
Psychometric Performance of Generic Childhood Multi-Attribute Utility Instruments in Preterm and Low Birthweight Populations: A Systematic Review


Abstract
:1. Background
- (1)
- Create a catalogue of evaluated psychometric evidence that can aid in the selection of generic childhood-specific or childhood-compatible MAUIs for application in PLB populations;
- (2)
- Identify gaps in psychometric evidence to inform future psychometric research in this population;
- (3)
- Summarise the commonly used psychometric assessment methods and the relative psychometric performance of instruments by property.
2. Methods
2.1. Data Sources and Study Selection
- 16D: 16-dimensional health-related measure [38]
- 17D: 17-dimensional health-related measure [39]
- AHUM: Adolescent Health Utility Measure [40]
- AQoL-6D Adolescent: Assessment of Quality of Life, 6-Dimensional, Adolescent [41]
- CH-6D: Child Health—6 Dimensions [42]
- CHSCS-PS: Comprehensive Health Status Classification System—Preschool [43]
- EQ-5D-Y-3L: EuroQoL 5 Dimensional questionnaire for Youth 3 Levels [46]
- EQ-5D-Y-5L: EQ-5D-Y 5 Levels [47]
- HUI2: Health Utilities Index 2 [48]
- HUI3: Health Utilities Index 3 [49]
- IQI: Infant health-related Quality of life Instrument [50]
2.2. Data Extraction
2.3. Evaluation and Data Synthesis
- (1)
- Create a catalogue of evaluated psychometric evidence. The online Excel file serves as the main catalogue wherein the criteria rating outputs are tabulated and the main rationale for each rating. More condensed catalogues are presented in this manuscript.
- (2)
- Identify gaps in psychometric evidence. Two aspects were defined as evidence gaps: (i) no criteria rating output available for an MAUI for a property and (ii) no criteria rating output available or where available no ‘+’ output. The number of these cases was computed for the whole evidence base and for a subset of evidence involving PLB adult populations.
- (3)
- Summarise the psychometric assessment methods and performance of instruments by property. The psychometric assessment methods used by the included studies were described by property. The relative performance of MAUIs was compared by property, using the proportion of ‘+’ as the performance metric and also considering the absolute number of outputs.
3. Results
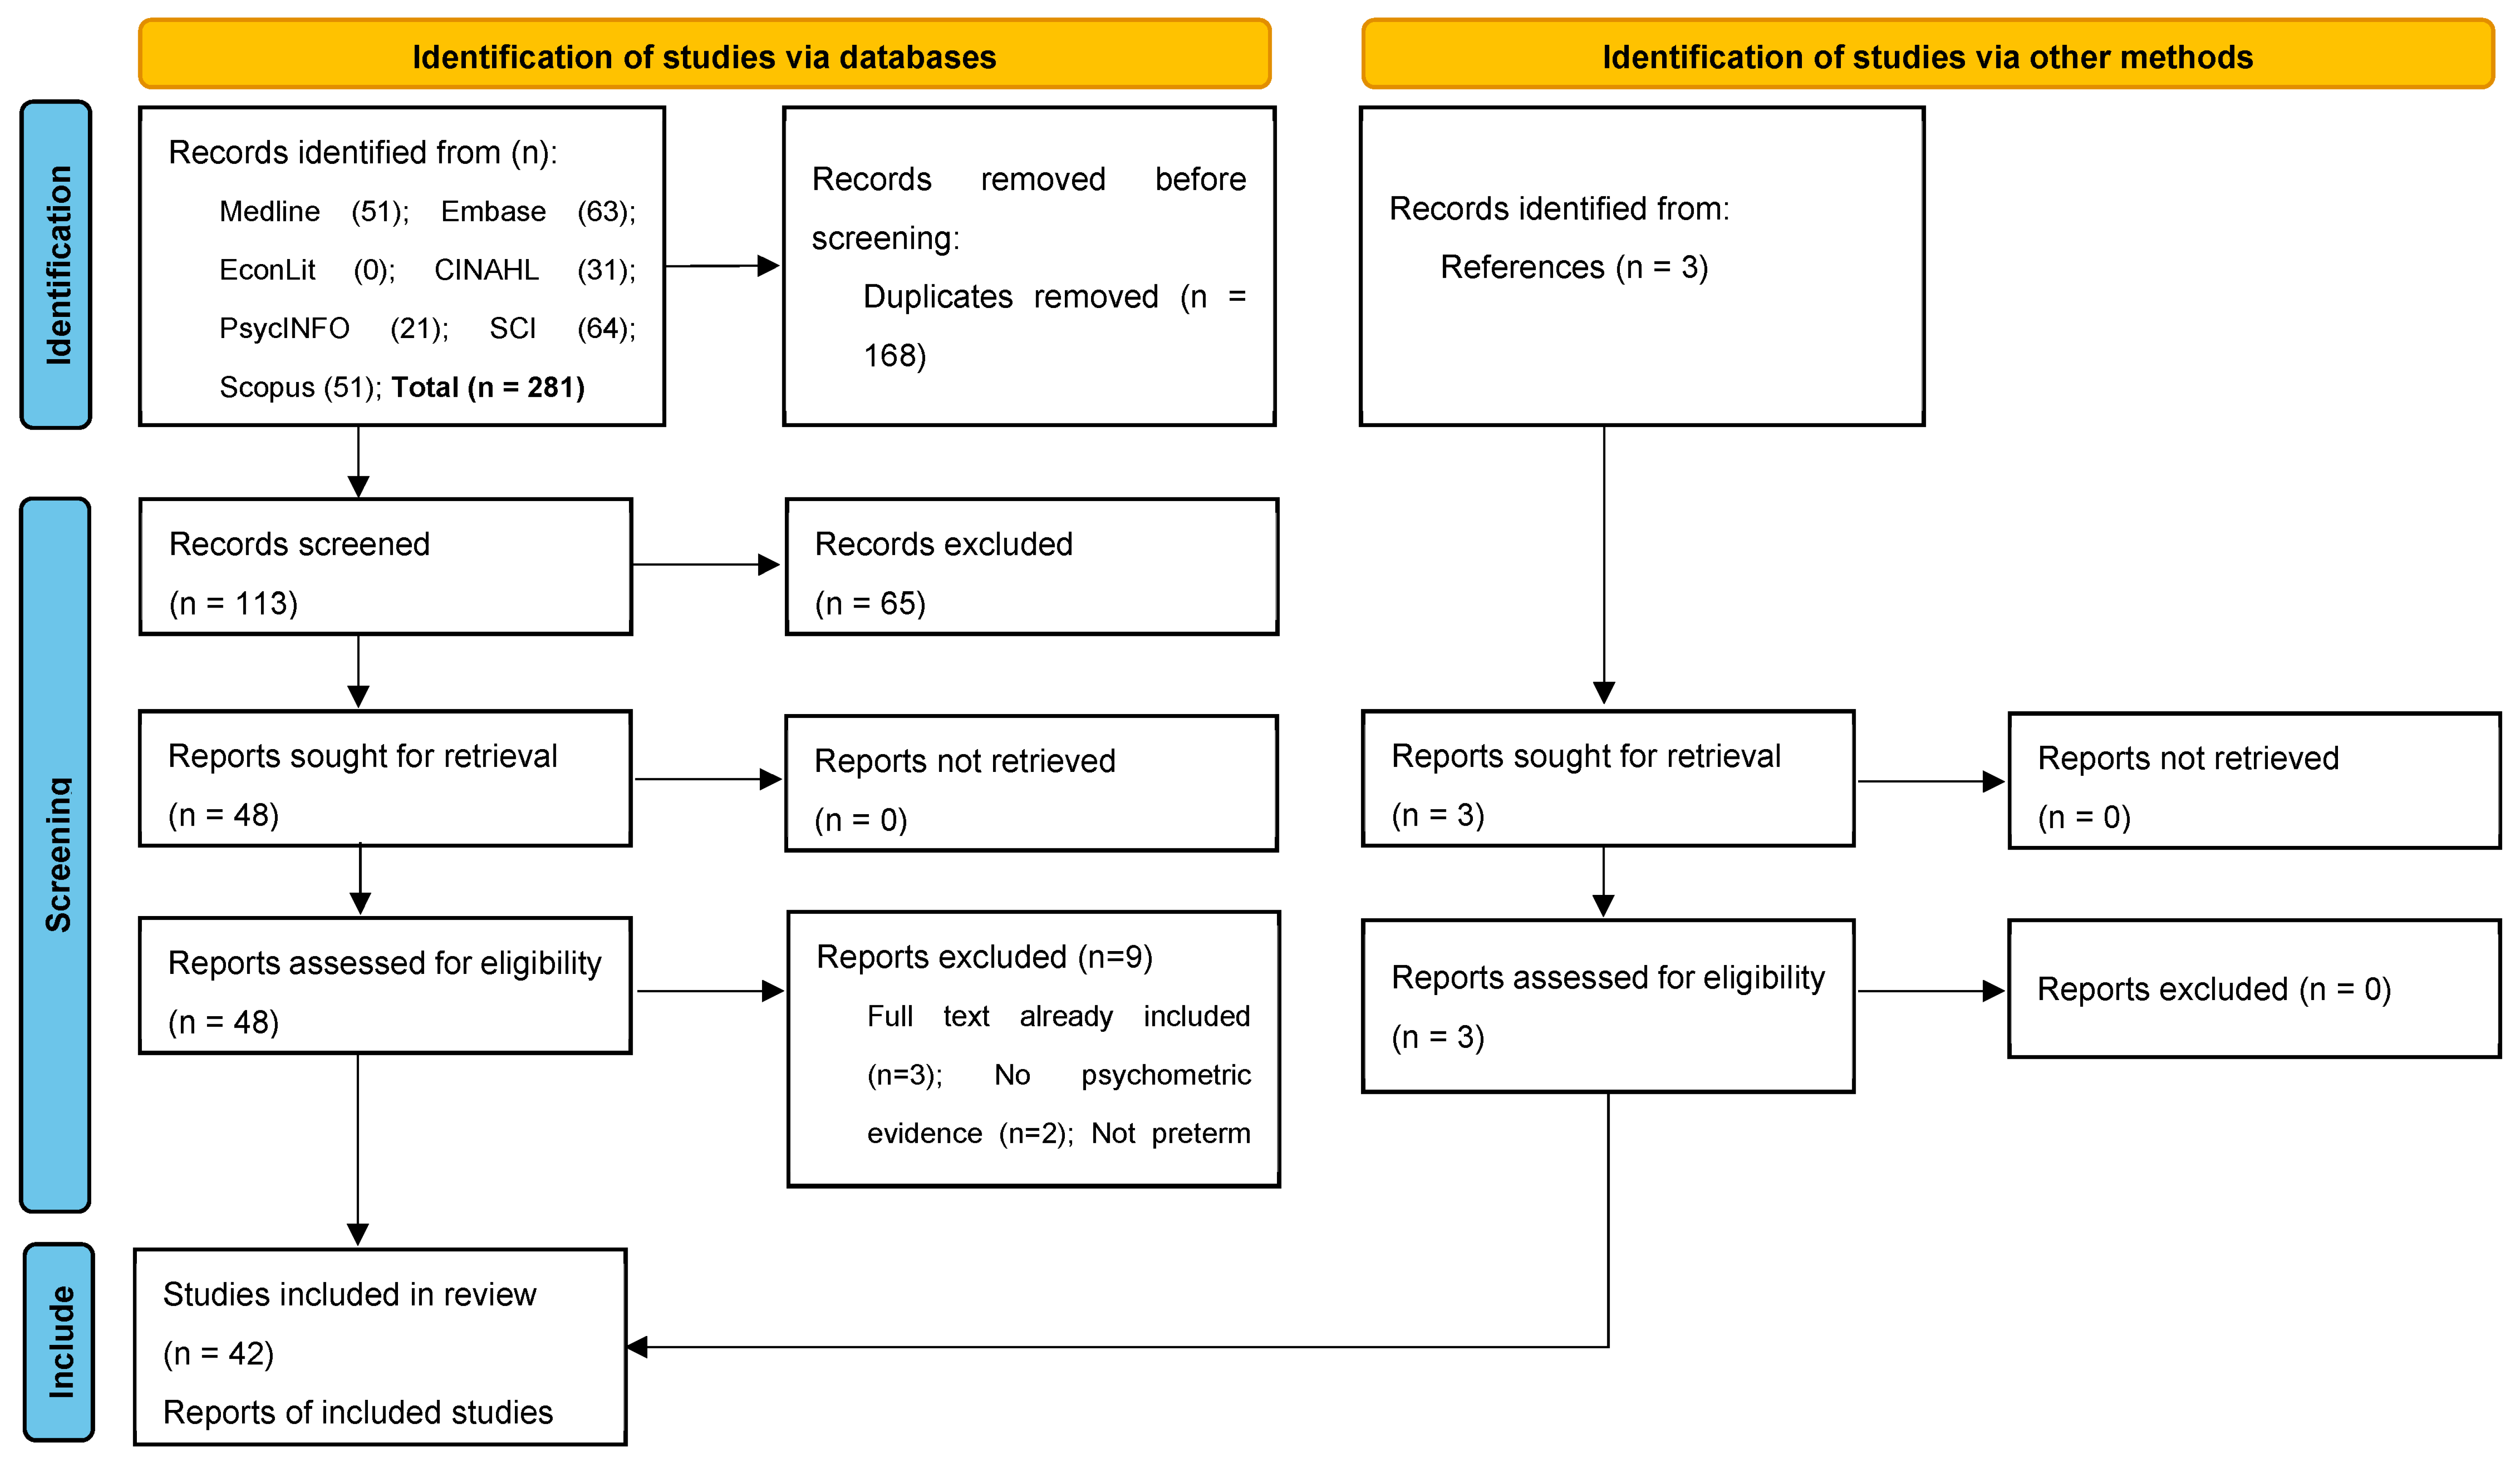
3.1. Search Results
3.2. Characteristics of Included Studies
3.3. Characteristics of Psychometric Assessments
3.4. Psychometric Evidence Gaps

| # | Reference | Country | Cohort | Population Characteristics | Target Age | Evidence 1 | Sample Size | MAUI 2 | Respondent |
|---|---|---|---|---|---|---|---|---|---|
| 1 | Achana 2022 [75] | UK | EPICure2 | EP (<27 weeks); normal term controls from mainstream schools matched by age and sex where possible | 11 | Indirect | PLB 200; C 143 | HUI2; HUI3 | Parents or other |
| 2 | Baumann 2016 [64] | Germany | BLS | VP (<32 weeks) and/or VLBW (<1500 g); normal term/BW controls from same birth hospitals matched by sex and family SES | 13, 26 (RM) | Indirect | PLB 190; C 201 | HUI3 | PLB; parents |
| 3 | Bolbocean 2023 [68] | Australia, Germany | BLS, VICS 1991-2 | VP (<32 weeks) and/or VLBW (<1500 g); normal term/BW controls | BLS 26, VICS 18 | Direct | PLB 558; C 491 | HUI3 | PLB |
| 4 | Bolbocean 2023b [76] | Australia, Germany, Ireland, UK | BLS, EPICure, VICS 1991-2 | VP (<32 weeks) and/or VLBW (<1500 g); normal term/BW controls | BLS 26, EPICure 19, VICS 18 | Indirect | PLB 527; C 423 | HUI3 | PLB |
| 5 | Breeman 2017 [77] | Germany, The Netherlands | BLS, POPS | VP (<32 weeks) and/or VLBW (<1500 g) | BLS 26, POPS 28 | Indirect | PLB 574 | HUI3 | PLB or parents |
| 6 | Feeny 2004 [69] | Canada | McMaster | ELBW (≤1000 g); normal BW controls matched by age, sex, and SES | Mean 14 | Direct | PLB 140; C 124 | HUI2; HUI3 | PLB |
| 7 | Gray 2007 [78] | UK | ELGA | GA < 29 weeks in mainstream school; normal term controls | 15–16 | Indirect | PLB 140; C 108 | HUI3 | PLB |
| 8 | Greenough 2004 [79] | UK | RSV infection | Median GA 27 weeks and BW 934 g with chronic lung disease, 17.4% hospitalised for RSV in first two years after birth | 5 | Indirect | PLB 190 | HUI2; HUI3 | Parents |
| 9 | Greenough 2014 [80] | UK | UKOS | EP (<29 weeks) schoolchildren | 11–14 | Indirect | PLB 319 | HUI3 | PLB; parents |
| 10 | Hille 2005 [81] | The Netherlands | POPS | VP (<32 weeks) and/or VLBW (<1500 g) | 14 | Indirect | PLB 853 | HUI3 | PLB or parents |
| 11 | Hille 2007 [82] | The Netherlands | POPS | VP (<32 weeks) and/or VLBW (<1500 g) | 19 | Indirect | PLB 705 | HUI3 | PLB or parents |
| 12 | Hollanders 2019 [83] | The Netherlands | POPS | VP (<32 weeks) and/or VLBW (<1500 g) | 19 | Indirect | PLB 705 | HUI3 | PLB or parents |
| 13 | Huhtala 2016 [84] | Finland | PIPARI | VP (<37 weeks) and/or VLBW (≤1500 g); normal term controls from same birth hospital matched by sex | 7–8 | Indirect | PLB 155; C 129 | 17D | PLB w/parents |
| 14 | Jain 2022 [60] | Ireland, UK | EPICure | EP (<26 weeks); normal term controls who are mainstream schoolmates matched by age, sex, and ethnicity | 19 | Indirect | PLB 128; C 65 | HUI3 | PLB |
| 15 | James 2003 [61] | Jamaica | Jamaican cohort | LBW (<2500 g); normal BW controls | 11–12 | Indirect | PLB 96; C 110 | HUI2 | PLB |
| 16 | Liu 2021 [85] | New Zealand | PIANO | VP (<30 weeks) and/or VLBW (<1500 g) | 7 | Indirect | PLB 127 | HUI2 | Caregivers |
| 17 | Ni 2021 [63] | Ireland, UK | EPICure | EP (<26 weeks); normal term controls recruited at age six years | 11, 19 (RM) | Indirect | At age 19: PLB 129; C 65 | HUI3 | Parents |
| 18 | Ni 2022 [86] | UK | EPICure, EPICure2 | EP (<26 weeks); normal term controls | 11 | Indirect | PLB 288; C 261 | HUI3 | Parents |
| 19 | Peart 2021 [67] | Australia | VICS 1991-2, 1997, 2005 | EP (<28 weeks) and/or ELBW (<1000 g); normal term/BW controls matched for expected term date of EP/ELBW person, sex, and SES recruited from same birth hospitals | 8 | Indirect | PLB 475; C 570 | HUI2; HUI3 | Parents |
| 20 | Petrou 2009 [87] | Ireland, UK | EPICure | EP (<26 weeks); normal term controls who are mainstream schoolmates matched by age, sex, and ethnicity | 11 | Indirect | PLB 190; C 141 | HUI3 | Parents |
| 21 | Petrou 2010 [88] | Ireland, UK | EPICure | EP (<26 weeks); normal term controls who are mainstream schoolmates matched by age, sex, and ethnicity | 11 | Indirect | PLB 190; C 141 | HUI2; HUI3 | Parents |
| 22 | Petrou 2013 [89] | Ireland, UK | EPICure | EP (<26 weeks); normal term controls who are mainstream schoolmates matched by age, sex, and ethnicity | 11 | Indirect | PLB 190; C 141 | HUI2; HUI3 | Parents |
| 23 | Quinn 2004 [90] | US | CRYO-ROP | VLBW (≤1250 g) with and without threshold retinopathy of prematurity | 10 | Indirect | PLB 346 | HUI3 | Parents or caregivers |
| 24 | Rautava 2009 [91] | Finland | PERFECT | VP (<32 weeks) and/or VLBW (≤1500 g); normal term/BW controls born in the same hospital matched by sex | 5 | Indirect | PLB 588; C 176 | 17D (modified) | Parents |
| 25 | Roberts 2011 [70] | Australia | VICS 1997 | EP (<28 weeks) and/or ELBW (<1000 g); normal term/BW controls matched for expected term date of EP/ELBW person, sex, and SES recruited from same birth hospitals | 8 | Direct | PLB 189; C 173 | HUI2 | Parents |
| 26 | Roberts 2013 [59] | Australia | VICS 1991-2 | EP (<28 weeks) and/or ELBW (<1000 g); normal term/BW controls matched for expected term date of EP/ELBW person, sex, and SES recruited from same birth hospitals | 18 | Indirect | PLB 194; C 148 | HUI3 | PLB |
| 27 | Saigal 1994 [71] | Canada | McMaster | ELBW (≤1000 g); normal BW controls matched by age, sex, and SES | 8 | Direct | PLB 156; C 145 | HUI2 | Clinicians |
| 28 | Saigal 1994b [92] | Canada | McMaster | ELBW (≤1000 g); normal BW controls matched by age, sex, and SES | 8 | Indirect | PLB 156; C 145 | HUI2 | Clinicians |
| 29 | Saigal 1996 [93] | Canada | McMaster | ELBW (≤1000 g); normal BW controls matched by age, sex, and SES | Mean 14 | Indirect | PLB 141; C 124 | HUI2 | PLB or parents |
| 30 | Saigal 1998 [72] | Canada | McMaster | ELBW (≤1000 g); normal BW controls aged 8 years old | Mean 14 | Direct | PLB 141; C 123 | HUI2 | PLB; parents |
| 31 | Saigal 2000 [94] | Canada | McMaster | ELBW (≤1000 g); normal BW controls matched by age, sex, and SES | Mean 14 | Indirect | PLB 149; C 126 | HUI2 | Parents |
| 32 | Saigal 2005 [43] | Australia, Canada | CHSCS-PS development | VLBW (<1500 g); normal BW controls; cerebral palsy patients | 2.5–5 | Direct | PLB 251; C 50 | CHSCS-PS | Parents; clinicians |
| 33 | Saigal 2006 [95] | Canada | McMaster | ELBW (≤1000 g); normal BW controls matched by age, sex, and SES | Mean 23 | Indirect | PLB 143; C 130 | HUI2 | PLB or parents |
| 34 | Saigal 2016 [96] | Canada | McMaster | ELBW (≤1000 g); normal BW controls matched by age, sex, and SES | Mean 14 | Indirect | PLB 139; C 124 | HUI3 | PLB |
| 35 | Selman 2023 [65] | Australia | VICS 1991-2 | EP (<28 weeks) and/or ELBW (<1000 g); normal term/BW controls matched for expected term date of EP/ELBW person, sex, and SES recruited from same birth hospitals | 18, 25 (RM) | Indirect | At age 25: PLB 165; C 131 | HUI3 | PLB |
| 36 | Uusitalo 2020 [97] | Finland | PIPARI | VP (<37 weeks) and/or VLBW (≤1500 g) | 11 | Indirect | PLB 170 | 17D | PLB |
| 37 | van Dommelen 2014 [98] | The Netherlands | POPS | SGA by weight or length or with a low head circumference or low BW adjusted for length | 19 | Indirect | PLB 334 | HUI3 | PLB or parents |
| 38 | van Lunenburg 2013 [66] | The Netherlands | POPS | VP (<32 weeks) and/or VLBW (<1500 g) | 19, 28 (RM) | Indirect | At age 28: PLB 314 | HUI3 | PLB |
| 39 | Verrips 2001 [73] | The Netherlands | POPS | VP (<32 weeks) and/or VLBW (<1500 g) | 14 | Direct | PLB 203 | HUI3 | PLB; parents |
| 40 | Verrips 2008 [99] | Canada, Germany, The Netherlands | BLS, McMaster, POPS | ELBW (≤1000 g) | BLS 13, McMaster mean 14, POPS 14 | Indirect | PLB 341 | HUI3 | PLB or caregivers |
| 41 | Verrips 2012 [62] | The Netherlands | POPS | VP (<32 weeks) and/or VLBW (<1500 g) | 14, 19 (RM) | Indirect | At age 19: PLB 684 | HUI3 | PLB or parents/caregivers |
| 42 | Wolke 2013 [74] | Germany | BLS | VP (<32 weeks) and/or VLBW (<1500 g); normal term/BW controls from same birth hospitals matched by sex and family SES | 13 | Direct | PLB 294; C 282 | HUI3 | PLB; parents |
| n | % | ||
|---|---|---|---|
| Whether study had a direct aim of assessing psychometric performance | Yes | 46 | 25.8 |
| No | 132 | 74.2 | |
| Total | 178 | 100.0 | |
| PLB population type | EP or ELBW | 95 | 53.4 |
| VP or VLBW | 80 | 44.9 | |
| LBW | 3 | 1.7 | |
| Total | 178 | 100.0 | |
| Target age group | (1) Infants and preschool children aged < 5 years | 7 | 3.9 |
| (2) Pre-adolescents aged 5–11 years | 67 | 37.6 | |
| (3) Adolescents aged 12–17 years | 54 | 30.3 | |
| (4) Adults aged ≥ 18 years | 35 | 19.7 | |
| (2) and (4) | 3 | 1.7 | |
| (3) and (4) | 12 | 6.7 | |
| Total | 178 | 100.0 | |
| Respondent type | Self-report by PLB person | 63 | 35.4 |
| Self-report by PLB person supported by proxy | 33 | 18.5 | |
| Proxy report only | 82 | 46.1 | |
| Total | 178 | 100.0 | |
| Administration mode | Self-administered by a PLB person or proxy | 126 | 70.8 |
| Interviewer-administered | 29 | 16.3 | |
| Mix of self- and interviewer-administered | 15 | 8.4 | |
| Unclear | 8 | 4.5 | |
| Total | 178 | 100.0 |
| N (% of ‘+’) | IC | TR | IR | IM | PC | CV | SV | CCV | KV | HT | CNV | DV | EV | CRV | PV | RE | AC | ITR | Total |
|---|---|---|---|---|---|---|---|---|---|---|---|---|---|---|---|---|---|---|---|
| All studies (n = 42) | |||||||||||||||||||
| 17D | 4 (50.0) | 3 (0.0) | 1 (0.0) | 3 (0.0) | 11 | ||||||||||||||
| CHSCS-PS | 1 (0.0) | 1 (0.0) | 1 (100) | 1 (100) | 1 (100) | 1 (100) | 1 (100) | 7 | |||||||||||
| HUI2 | 1 (100) | 1 (0.0) | 22 (63.6) | 9 (44.4) | 1 (0.0) | 9 (0.0) | 3 (0.0) | 46 | |||||||||||
| HUI3 | 1 (0.0) | 3 (0.0) | 5 (0.0) | 41 (58.5) | 20 (55.0) | 2 (0.0) | 6 (0.0) | 17 (5.9) | 19 (0.0) | 114 | |||||||||
| Total | 1 | 1 | 1 | 3 | 6 | 2 | 0 | 0 | 68 | 33 | 3 | 0 | 0 | 1 | 0 | 6 | 28 | 25 | 178 |
| Studies targeting children (n = 28) | |||||||||||||||||||
| 17D | 4 (50.0) | 3 (0.0) | 1 (0.0) | 3 (0.0) | 11 | ||||||||||||||
| CHSCS-PS | 1 (0.0) | 1 (0.0) | 1 (100) | 1 (100) | 1 (100) | 1 (100) | 1 (100) | 7 | |||||||||||
| HUI2 | 1 (100) | 1 (0.0) | 21 (61.9) | 9 (44.4) | 1 (0.0) | 8 (0.0) | 3 (0.0) | 44 | |||||||||||
| HUI3 | 3 (0.0) | 5 (0.0) | 28 (57.1) | 9 (55.6) | 1 (0.0) | 9 (11.1) | 11 (0.0) | 66 | |||||||||||
| Total | 0 | 1 | 1 | 3 | 6 | 2 | 0 | 0 | 54 | 22 | 2 | 0 | 0 | 1 | 0 | 0 | 19 | 17 | 128 |
| Studies targeting adults or both adults and children (n = 14) | |||||||||||||||||||
| HUI2 | 1 (100) | 1 (0.0) | 2 | ||||||||||||||||
| HUI3 | 1 (0.0) | 13 (61.5) | 11 (54.5) | 1 (0.0) | 6 (0.0) | 8 (0.0) | 8 (0.0) | 48 | |||||||||||
| Total | 1 | 0 | 0 | 0 | 0 | 0 | 0 | 0 | 14 | 11 | 1 | 0 | 0 | 0 | 0 | 6 | 9 | 8 | 50 |
3.5. Psychometric Assessment Methods and Performance by Property
3.5.1. Internal Consistency
3.5.2. Test–Retest Reliability
3.5.3. Inter-Rater Reliability
3.5.4. Inter-Modal Reliability
3.5.5. Proxy–Child Agreement
3.5.6. Content Validity
3.5.7. Known-Group Validity
3.5.8. Hypothesis Testing
3.5.9. Convergent Validity
3.5.10. Concurrent Validity
3.5.11. Responsiveness
3.5.12. Acceptability
3.5.13. Interpretability
4. Discussion
5. Conclusions
Supplementary Materials
Author Contributions
Funding
Institutional Review Board Statement
Informed Consent Statement
Data Availability Statement
Conflicts of Interest
Abbreviations
| 16D | 16-dimensional health-related measure |
| 17D | 17-dimensional health-related measure |
| AHUM | Adolescent Health Utility Measure |
| AQoL-6D Adolescent | Assessment of Quality of Life, 6-Dimensional, Adolescent |
| CH-6D | Child Health—6 Dimensions |
| CHSCS-PS | Comprehensive Health Status Classification System—Preschool |
| CHU9D | Child Health Utility—9 Dimensions |
| EP/ELBW | extremely preterm and/or extremely low birthweight |
| EQ-5D-Y-3L | EuroQoL 5 Dimensional questionnaire for Youth 3 Levels |
| EQ-5D-Y-5L | EuroQoL 5 Dimensional questionnaire for Youth 5 Levels |
| EQ-TIPS | EuroQoL Toddler and Infant Populations |
| HRQoL | health-related quality of life |
| HUI2 | Health Utilities Index 2 |
| HUI3 | Health Utilities Index 3 |
| IQI | Infant health-related Quality of life Instrument |
| MAUI | multi-attribute utility instrument |
| PLB | preterm and/or low birthweight |
| PRISMA | preferred reporting items for systematic reviews and meta-analyses |
| PROM | patient-reported outcome measure |
| QWB | Quality of Well-Being scale |
| RCT | randomised controlled trial |
| TANDI | Toddler and Infant health related quality of life instrument |
| VP/VLBW | very preterm and/or very low birthweight |
References
- Petrou, S. The economic consequences of preterm birth duringthe first 10 years of life. BJOG Int. J. Obstet. Gynaecol. 2005, 112, 10–15. [Google Scholar] [CrossRef] [PubMed]
- Bhutta, A.T.; Cleves, M.A.; Casey, P.H.; Cradock, M.M.; Anand, K.J. Cognitive and behavioral outcomes of school-aged children who were born preterm: A meta-analysis. JAMA 2002, 288, 728–737. [Google Scholar] [CrossRef] [PubMed]
- Saigal, S.; Doyle, L.W. An overview of mortality and sequelae of preterm birth from infancy to adulthood. Lancet 2008, 371, 261–269. [Google Scholar] [CrossRef] [PubMed]
- Parkinson, J.R.; Hyde, M.J.; Gale, C.; Santhakumaran, S.; Modi, N. Preterm birth and the metabolic syndrome in adult life: A systematic review and meta-analysis. Pediatrics 2013, 131, e1240–e1263. [Google Scholar] [CrossRef] [PubMed]
- Moore, T.; Hennessy, E.M.; Myles, J.; Johnson, S.J.; Draper, E.S.; Costeloe, K.L.; Marlow, N. Neurological and developmental outcome in extremely preterm children born in England in 1995 and 2006: The EPICure studies. BMJ 2012, 345, e7961. [Google Scholar] [CrossRef] [PubMed]
- Johnson, S.; Wolke, D. Behavioural outcomes and psychopathology during adolescence. Early Hum. Dev. 2013, 89, 199–207. [Google Scholar] [CrossRef]
- Wolke, D.; Johnson, S.; Mendonça, M. The life course consequences of very preterm birth. Annu. Rev. Dev. Psychol. 2019, 1, 69–92. [Google Scholar] [CrossRef]
- Karimi, M.; Brazier, J. Health, health-related quality of life, and quality of life: What is the difference? Pharmacoeconomics 2016, 34, 645–649. [Google Scholar] [CrossRef]
- Fayed, N.; De Camargo, O.K.; Kerr, E.; Rosenbaum, P.; Dubey, A.; Bostan, C.; Faulhaber, M.; Raina, P.; Cieza, A. Generic patient-reported outcomes in child health research: A review of conceptual content using World Health Organization definitions. Dev. Med. Child Neurol. 2012, 54, 1085–1095. [Google Scholar] [CrossRef]
- Zwicker, J.G.; Harris, S.R. Quality of life of formerly preterm and very low birth weight infants from preschool age to adulthood: A systematic review. Pediatrics 2008, 121, e366–e376. [Google Scholar] [CrossRef]
- Brazier, J.; Ratcliffe, J.; Saloman, J.; Tsuchiya, A. Measuring and Valuing Health Benefits for Economic Evaluation; Oxford University Press: Oxford, UK, 2017. [Google Scholar]
- Torrance, G.W. Measurement of health state utilities for economic appraisal: A review. J. Health Econ. 1986, 5, 1–30. [Google Scholar] [CrossRef] [PubMed]
- Chen, G.; Ratcliffe, J. A Review of the Development and Application of Generic Multi-Attribute Utility Instruments for Paediatric Populations. Pharmacoeconomics 2015, 33, 1013–1028. [Google Scholar] [CrossRef] [PubMed]
- Payakachat, N.; Ali, M.M.; Tilford, J.M. Can the EQ-5D detect meaningful change? A systematic review. Pharmacoeconomics 2015, 33, 1137–1154. [Google Scholar] [CrossRef] [PubMed]
- Bahrampour, M.; Norman, R.; Byrnes, J.; Downes, M.; Scuffham, P.A. Utility values for the CP-6D, a cerebral palsy-specific multi-attribute utility instrument, using a discrete choice experiment. Patient-Patient-Centered Outcomes Res. 2021, 14, 129–138. [Google Scholar] [CrossRef]
- Drummond, M.F.; Sculpher, M.J.; Claxton, K.; Stoddart, G.L.; Torrance, G.W. Methods for the Economic Evaluation of Health Care Programmes; Oxford University Press: Oxford, UK, 2015. [Google Scholar]
- National Institute for Health and Care Excellence. Guide to the methods of technology appraisal 2013. In Process and Methods PMG9; National Institute for Health and Care Excellence: London, UK, 2013. [Google Scholar]
- Canadian Agency for Drugs and Technologies in Health. Guidelines for the Economic Evaluation of Health Technologies: Canada, 4th ed.; Canadian Agency for Drugs and Technologies in Health: Ottawa, ON, Canada, 2017. [Google Scholar]
- Pharmaceutical Benefits Advisory Committee. Guidelines for Preparing Submissions to the Pharmaceutical Benefits Advisory Committee (Version 5); Pharmaceutical Benefits Advisory Committee: Canberra, Australia, 2016. [Google Scholar]
- Scottish Medicines Consortium. Working with SMC—A Guide for Manufacturers; Scottish Medicines Consortium: Glasgow, Scotland, 2017. [Google Scholar]
- Petrou, S.; Yiu, H.H.; Kwon, J. Economic consequences of preterm birth: A systematic review of the recent literature (2009–2017). Arch. Dis. Child. 2019, 104, 456–465. [Google Scholar] [CrossRef]
- Petrou, S.; Krabuanrat, N.; Khan, K. Preference-based health-related quality of life outcomes associated with preterm birth: A systematic review and meta-analysis. Pharmacoeconomics 2020, 38, 357–373. [Google Scholar] [CrossRef]
- Petrou, S. Methodological issues raised by preference-based approaches to measuring the health status of children. Health Econ. 2003, 12, 697–702. [Google Scholar] [CrossRef]
- Matza, L.S.; Patrick, D.L.; Riley, A.W.; Alexander, J.J.; Rajmil, L.; Pleil, A.M.; Bullinger, M. Pediatric patient-reported outcome instruments for research to support medical product labeling: Report of the ISPOR PRO good research practices for the assessment of children and adolescents task force. Value Health 2013, 16, 461–479. [Google Scholar] [CrossRef]
- Kwon, J.; Freijser, L.; Huynh, E.; Howell, M.; Chen, G.; Khan, K.; Daher, S.; Roberts, N.; Harrison, C.; Smith, S. Systematic review of conceptual, age, measurement and valuation considerations for generic multidimensional childhood patient-reported outcome measures. Pharmacoeconomics 2022, 40, 379–431. [Google Scholar] [CrossRef]
- Khadka, J.; Kwon, J.; Petrou, S.; Lancsar, E.; Ratcliffe, J. Mind the (inter-rater) gap. An investigation of self-reported versus proxy-reported assessments in the derivation of childhood utility values for economic evaluation: A systematic review. Soc. Sci. Med. 2019, 240, 112543. [Google Scholar] [CrossRef]
- Eiser, C.; Morse, R. Can parents rate their child’s health-related quality of life? Results of a systematic review. Qual. Life Res. 2001, 10, 347–357. [Google Scholar] [CrossRef] [PubMed]
- Johnson, S. Cognitive and behavioural outcomes following very preterm birth. Semin. Fetal Neonatal Med. 2007, 12, 363–373. [Google Scholar] [CrossRef] [PubMed]
- Brydges, C.R.; Landes, J.K.; Reid, C.L.; Campbell, C.; French, N.; Anderson, M. Cognitive outcomes in children and adolescents born very preterm: A meta-analysis. Dev. Med. Child Neurol. 2018, 60, 452–468. [Google Scholar] [CrossRef]
- Smith, S.; Lamping, D.; Banerjee, S.; Harwood, R.; Foley, B.; Smith, P.; Cook, J.; Murray, J.; Prince, M.; Levin, E. Measurement of health-related quality of life for people with dementia: Development of a new instrument (DEMQOL) and an evaluation of current methodology. Health Technol. Assess. 2005, 9, i–iv. [Google Scholar] [CrossRef] [PubMed]
- Food and Drug Administration. Guidance for Industry—Patient-Reported Outcome Measures: Use in Medical Product Development to Support Labeling Claims; Food and Drug Administration: Silver Spring, MD, USA, 2009.
- Brazier, J.; Deverill, M. A checklist for judging preference-based measures of health related quality of life: Learning from psychometrics. Health Econ. 1999, 8, 41–51. [Google Scholar] [CrossRef]
- Reeve, B.B.; Wyrwich, K.W.; Wu, A.W.; Velikova, G.; Terwee, C.B.; Snyder, C.F.; Schwartz, C.; Revicki, D.A.; Moinpour, C.M.; McLeod, L.D. ISOQOL recommends minimum standards for patient-reported outcome measures used in patient-centered outcomes and comparative effectiveness research. Qual. Life Res. 2013, 22, 1889–1905. [Google Scholar] [CrossRef]
- Lohr, K.N. Assessing health status and quality-of-life instruments: Attributes and review criteria. Qual. Life Res. 2002, 11, 193–205. [Google Scholar] [CrossRef]
- Kwon, J.; Smith, S.; Raghunandan, R.; Howell, M.; Huynh, E.; Kim, S.; Bentley, T.; Roberts, N.; Lancsar, E.; Howard, K. Systematic Review of the Psychometric Performance of Generic Childhood Multi-attribute Utility Instruments. Appl. Health Econ. Health Policy 2023, 21, 559–584. [Google Scholar] [CrossRef]
- Van der Pal, S.; Steinhof, M.; Grevinga, M.; Wolke, D.; Verrips, G. Quality of life of adults born very preterm or very low birth weight: A systematic review. Acta Paediatr. 2020, 109, 1974–1988. [Google Scholar] [CrossRef]
- Page, M.J.; McKenzie, J.E.; Bossuyt, P.M.; Boutron, I.; Hoffmann, T.C.; Mulrow, C.D.; Shamseer, L.; Tetzlaff, J.M.; Akl, E.A.; Brennan, S.E. The PRISMA 2020 statement: An updated guideline for reporting systematic reviews. BMJ 2021, 88, 105906. [Google Scholar]
- Apajasalo, M.; Sintonen, H.; Holmberg, C.; Sinkkonen, J.; Aalberg, V.; Pihko, H.; Siimes, M.A.; Kaitila, I.; Makela, A.; Rantakari, K.; et al. Quality of life in early adolescence: A sixteen-dimensional health-related measure (16D). Qual. Life Res. 1996, 5, 205–211. [Google Scholar] [CrossRef] [PubMed]
- Apajasalo, M.; Rautonen, J.; Holmberg, C.; Sinkkonen, J.; Aalberg, V.; Pihko, H.; Siimes, M.A.; Kaitila, I.; Makela, A.; Erkkila, K.; et al. Quality of life in pre-adolescence: A 17-dimensional health-related measure (17D). Qual. Life Res. 1996, 5, 532–538. [Google Scholar] [CrossRef] [PubMed]
- Beusterien, K.M.; Yeung, J.-E.; Pang, F.; Brazier, J. Development of the multi-attribute adolescent health utility measure (AHUM). Health Qual. Life Outcomes 2012, 10, 102. [Google Scholar] [CrossRef]
- Moodie, M.; Richardson, J.; Rankin, B.; Iezzi, A.; Sinha, K. Predicting time trade-off health state valuations of adolescents in four Pacific countries using the Assessment of Quality-of-Life (AQoL-6D) instrument. Value Health 2010, 13, 1014–1027. [Google Scholar] [CrossRef] [PubMed]
- Kang, E. Validity of Child Health-6 Dimension(Ch-6d) for Adolescents. Value Health 2016, 19, A854. [Google Scholar] [CrossRef]
- Saigal, S.; Rosenbaum, P.; Stoskopf, B.; Hoult, L.; Furlong, W.; Feeny, D.; Hagan, R. Development, reliability and validity of a new measure of overall health for pre-school children. Qual. Life Res. 2005, 14, 243–252. [Google Scholar] [CrossRef]
- Stevens, K. Developing a descriptive system for a new preference-based measure of health-related quality of life for children. Qual. Life Res. 2009, 18, 1105–1113. [Google Scholar] [CrossRef]
- Stevens, K. Assessing the performance of a new generic measure of health-related quality of life for children and refining it for use in health state valuation. Appl. Health Econ. Health Policy 2011, 9, 157–169. [Google Scholar] [CrossRef]
- Wille, N.; Badia, X.; Bonsel, G.; Burström, K.; Cavrini, G.; Devlin, N.; Egmar, A.-C.; Greiner, W.; Gusi, N.; Herdman, M. Development of the EQ-5D-Y: A child-friendly version of the EQ-5D. Qual. Life Res. 2010, 19, 875–886. [Google Scholar] [CrossRef]
- Kreimeier, S.; Åström, M.; Burström, K.; Egmar, A.-C.; Gusi, N.; Herdman, M.; Kind, P.; Perez-Sousa, M.A.; Greiner, W. EQ-5D-Y-5L: Developing a revised EQ-5D-Y with increased response categories. Qual. Life Res. 2019, 28, 1951–1961. [Google Scholar] [CrossRef]
- Torrance, G.W.; Feeny, D.H.; Furlong, W.J.; Barr, R.D.; Zhang, Y.; Wang, Q. Multiattribute utility function for a comprehensive health status classification system: Health Utilities Index Mark 2. Med. Care 1996, 34, 702–722. [Google Scholar] [CrossRef] [PubMed]
- Furlong, W.J.; Feeny, D.H.; Torrance, G.W.; Barr, R.D. The Health Utilities Index (HUI®) system for assessing health-related quality of life in clinical studies. Ann. Med. 2001, 33, 375–384. [Google Scholar] [CrossRef] [PubMed]
- Jabrayilov, R.; van Asselt, A.D.; Vermeulen, K.M.; Volger, S.; Detzel, P.; Dainelli, L.; Krabbe, P.F.; Pediatrics Expert Group. A descriptive system for the Infant health-related Quality of life Instrument (IQI): Measuring health with a mobile app. PLoS ONE 2018, 13, e0203276. [Google Scholar] [CrossRef]
- Kaplan, R.M.; Bush, J.W.; Berry, C.C. Health status: Types of validity and the index of well-being. Health Serv. Res. 1976, 11, 478–507. [Google Scholar] [PubMed]
- Kaplan, R.M.; Sieber, W.J.; Ganiats, T.G. The quality of well-being scale: Comparison of the interviewer-administered version with a self-administered questionnaire. Psychol. Health 1997, 12, 783–791. [Google Scholar] [CrossRef]
- Verstraete, J.; Ramma, L.; Jelsma, J. Item generation for a proxy health related quality of life measure in very young children. Health Qual. Life Outcomes 2020, 18, 11. [Google Scholar] [CrossRef]
- Verstraete, J.; Ramma, L.; Jelsma, J. Validity and reliability testing of the Toddler and Infant (TANDI) Health Related Quality of Life instrument for very young children. J. Patient-Rep. Outcomes 2020, 4, 94. [Google Scholar] [CrossRef]
- Veritas Health Innovation. Covidence Systematic Review Software; Veritas Health Innovation: Melbourne, VIC, Australia, 2020. [Google Scholar]
- Mokkink, L.B.; Terwee, C.B.; Patrick, D.L.; Alonso, J.; Stratford, P.W.; Knol, D.L.; Bouter, L.M.; de Vet, H.C. The COSMIN study reached international consensus on taxonomy, terminology, and definitions of measurement properties for health-related patient-reported outcomes. J. Clin. Epidemiol. 2010, 63, 737–745. [Google Scholar] [CrossRef]
- Mokkink, L.B.; Terwee, C.B.; Patrick, D.L.; Alonso, J.; Stratford, P.W.; Knol, D.L.; Bouter, L.M.; De Vet, H.C. The COSMIN checklist for assessing the methodological quality of studies on measurement properties of health status measurement instruments: An international Delphi study. Qual. Life Res. 2010, 19, 539–549. [Google Scholar] [CrossRef]
- Mokkink, L.B.; Terwee, C.B.; Knol, D.L.; Stratford, P.W.; Alonso, J.; Patrick, D.L.; Bouter, L.M.; De Vet, H.C. The COSMIN checklist for evaluating the methodological quality of studies on measurement properties: A clarification of its content. BMC Med. Res. Methodol. 2010, 10, 22. [Google Scholar] [CrossRef]
- Roberts, G.; Burnett, A.C.; Lee, K.J.; Cheong, J.; Wood, S.J.; Anderson, P.J.; Doyle, L.W.; Victorian Infant Collaborative Study Group. Quality of life at age 18 years after extremely preterm birth in the post-surfactant era. J. Pediatr. 2013, 163, 1008–1013.e1001. [Google Scholar] [CrossRef] [PubMed]
- Jain, S.; Sim, P.Y.; Beckmann, J.; Ni, Y.; Uddin, N.; Unwin, B.; Marlow, N. Functional ophthalmic factors associated with extreme prematurity in young adults. JAMA Netw. Open 2022, 5, e2145702. [Google Scholar] [CrossRef] [PubMed]
- James, J.D. Health Status and Psychological Adjustment in Low Birth Weight and Normal Birth Weight Jamaican Preadolescents; Northwestern University: Evanston, IL, USA, 2003. [Google Scholar]
- Verrips, G.; Brouwer, L.; Vogels, T.; Taal, E.; Drossaert, C.; Feeny, D.; Verheijden, M.; Verloove-Vanhorick, P. Long term follow-up of health-related quality of life in young adults born very preterm or with a very low birth weight. Health Qual. Life Outcomes 2012, 10, 49. [Google Scholar] [CrossRef] [PubMed]
- Ni, Y.; O’Reilly, H.; Johnson, S.; Marlow, N.; Wolke, D. Health-related quality of life from adolescence to adulthood following extremely preterm birth. J. Pediatr. 2021, 237, 227–236.e225. [Google Scholar] [CrossRef]
- Baumann, N.; Bartmann, P.; Wolke, D. Health-related quality of life into adulthood after very preterm birth. Pediatrics 2016, 137, e20153148. [Google Scholar] [CrossRef]
- Selman, C.; Mainzer, R.; Lee, K.; Anderson, P.; Burnett, A.; Garland, S.M.; Patton, G.C.; Pigdon, L.; Roberts, G.; Wark, J. Health-related quality of life in adults born extremely preterm or with extremely low birth weight in the postsurfactant era: A longitudinal cohort study. Arch. Dis. Child.-Fetal Neonatal Ed. 2023, 108, 581–587. [Google Scholar] [CrossRef]
- Van Lunenburg, A.; van der Pal, S.M.; van Dommelen, P.; van der Pal–de Bruin, K.M.; Bennebroek Gravenhorst, J.; Verrips, G.H. Changes in quality of life into adulthood after very preterm birth and/or very low birth weight in the Netherlands. Health Qual. Life Outcomes 2013, 11, 51. [Google Scholar] [CrossRef]
- Peart, S.; Cheong, J.L.Y.; Roberts, G.; Davis, N.; Anderson, P.J.; Doyle, L.W. Changes over time in quality of life of school-aged children born extremely preterm: 1991–2005. Arch. Dis. Child.-Fetal Neonatal Ed. 2021, 106, 425–429. [Google Scholar] [CrossRef]
- Bolbocean, C.; Anderson, P.J.; Bartmann, P.; Cheong, J.L.; Doyle, L.W.; Wolke, D.; Petrou, S. Comparative evaluation of the health utilities index mark 3 and the short form 6D: Evidence from an individual participant data meta-analysis of very preterm and very low birthweight adults. Qual. Life Res. 2023, 32, 1703–1716. [Google Scholar] [CrossRef]
- Feeny, D.; Furlong, W.; Saigal, S.; Sun, J. Comparing directly measured standard gamble scores to HUI2 and HUI3 utility scores: Group- and individual-level comparisons. Soc. Sci. Med. 2004, 58, 799–809. [Google Scholar] [CrossRef]
- Roberts, G.; Anderson, P.J.; Cheong, J.; Doyle, L.W.; Victorian Infant Collaborative Study Group. Parent-reported health in extremely preterm and extremely low-birthweight children at age 8 years compared with comparison children born at term. Dev. Med. Child Neurol. 2011, 53, 927–932. [Google Scholar] [CrossRef] [PubMed]
- Saigal, S.; Rosenbaum, P.; Stoskopf, B.; Hoult, L.; Furlong, W.; Feeny, D.; Burrows, E.; Torrance, G. Comprehensive assessment of the health status of extremely low birth weight children at eight years of age: Comparison with a reference group. J. Pediatr. 1994, 125, 411–417. [Google Scholar] [CrossRef] [PubMed]
- Saigal, S.; Rosenbaum, P.; Hoult, L.; Furlong, W.; Feeny, D.; Burrows, E.; Stoskopf, B. Conceptual and methodological issues in assessing health-related quality of life in children and adolescents: Illustration from studies of extremely low birthweight survivors. In Measuring Health-Related Quality of Life in Children and Adolescents: Implications for Research and Practice; Lawrence Erlbaum Associates: Mahwah, NJ, USA, 1998; pp. 151–169. [Google Scholar]
- Verrips, G.; Stuifbergen, M.; Den Ouden, A.; Bonsel, G.; Gemke, R.; Paneth, N.; Verloove-Vanhorick, S. Measuring health status using the Health Utilities Index: Agreement between raters and between modalities of administration. J. Clin. Epidemiol. 2001, 54, 475–481. [Google Scholar] [CrossRef]
- Wolke, D.; Chernova, J.; Eryigit-Madzwamuse, S.; Samara, M.; Zwierzynska, K.; Petrou, S. Self and parent perspectives on health-related quality of life of adolescents born very preterm. J. Pediatr. 2013, 163, 1020–1026.e1022. [Google Scholar] [CrossRef] [PubMed]
- Achana, F.; Johnson, S.; Ni, Y.; Marlow, N.; Wolke, D.; Khan, K.; Petrou, S. Economic costs and health utility values associated with extremely preterm birth: Evidence from the EPICure2 cohort study. Paediatr. Perinat. Epidemiol. 2022, 36, 696–705. [Google Scholar] [CrossRef] [PubMed]
- Bolbocean, C.; van der Pal, S.; van Buuren, S.; Anderson, P.J.; Bartmann, P.; Baumann, N.; Cheong, J.L.; Darlow, B.A.; Doyle, L.W.; Evensen, K.A.I. Health-related quality-of-life outcomes of very preterm or very low birth weight adults: Evidence from an individual participant data meta-analysis. PharmacoEconomics 2023, 41, 93–105. [Google Scholar] [CrossRef]
- Breeman, L.D.; van der Pal, S.; Verrips, G.H.; Baumann, N.; Bartmann, P.; Wolke, D. Neonatal treatment philosophy in Dutch and German NICUs: Health-related quality of life in adulthood of VP/VLBW infants. Qual. Life Res. 2017, 26, 935–943. [Google Scholar] [CrossRef]
- Gray, R.; Petrou, S.; Hockley, C.; Gardner, F. Self-reported health status and health-related quality of life of teenagers who were born before 29 weeks’ gestational age. Pediatrics 2007, 120, e86–e93. [Google Scholar] [CrossRef]
- Greenough, A.; Alexander, J.; Burgess, S.; Bytham, J.; Chetcuti, P.; Hagan, J.; Lenney, W.; Melville, S.; Shaw, N.; Boorman, J. Health care utilisation of prematurely born, preschool children related to hospitalisation for RSV infection. Arch. Dis. Child. 2004, 89, 673–678. [Google Scholar] [CrossRef]
- Greenough, A.; Peacock, J.; Zivanovic, S.; Alcazar-Paris, M.; Lo, J.; Marlow, N.; Calvert, S. United Kingdom Oscillation Study: Long-term outcomes of a randomised trial of two modes of neonatal ventilation. Health Technol. Assess. 2014, 18, 1–95. [Google Scholar] [CrossRef]
- Hille, E.; Den Ouden, A.; Stuifbergen, M.; Verrips, G.; Vogels, A.; Brand, R.; Gravenhorst, J.B.; Verloove-Vanhorick, S. Is attrition bias a problem in neonatal follow-up? Early Hum. Dev. 2005, 81, 901–908. [Google Scholar] [CrossRef] [PubMed]
- Hille, E.E.T.; Weisglas-Kuperus, N.; Van Goudoever, J.; Jacobusse, G.W.; Ens-Dokkum, M.H.; de Groot, L.; Wit, J.M.; Geven, W.B.; Kok, J.H.; de Kleine, M.J. Functional outcomes and participation in young adulthood for very preterm and very low birth weight infants: The Dutch Project on Preterm and Small for Gestational Age Infants at 19 years of age. Pediatrics 2007, 120, e587–e595. [Google Scholar] [CrossRef] [PubMed]
- Hollanders, J.J.; Schaëfer, N.; van der Pal, S.M.; Oosterlaan, J.; Rotteveel, J.; Finken, M.J. Long-term neurodevelopmental and functional outcomes of infants born very preterm and/or with a very low birth weight. Neonatology 2019, 115, 310–319. [Google Scholar] [CrossRef]
- Huhtala, M.; Korja, R.; Rautava, L.; Lehtonen, L.; Haataja, L.; Lapinleimu, H.; Rautava, P.; PIPARI Study Group. Health-related quality of life in very low birth weight children at nearly eight years of age. Acta Paediatr. 2016, 105, 53–59. [Google Scholar] [CrossRef] [PubMed]
- Liu, G.X.; Harding, J.E.; Team, P.S. Caregiver-reported health-related quality of life of New Zealand children born very and extremely preterm. PLoS ONE 2021, 16, e0253026. [Google Scholar] [CrossRef] [PubMed]
- Ni, Y.; Johnson, S.; Marlow, N.; Wolke, D. Reduced health-related quality of life in children born extremely preterm in 2006 compared with 1995: The EPICure Studies. Arch. Dis. Child. Fetal Neonatal Ed. 2022, 107, 408–413. [Google Scholar] [CrossRef]
- Petrou, S.; Abangma, G.; Johnson, S.; Wolke, D.; Marlow, N. Costs and health utilities associated with extremely preterm birth: Evidence from the EPICure study. Value Health 2009, 12, 1124–1134. [Google Scholar] [CrossRef]
- Petrou, S.; Johnson, S.; Wolke, D.; Hollis, C.; Kochhar, P.; Marlow, N. Economic costs and preference-based health-related quality of life outcomes associated with childhood psychiatric disorders. Br. J. Psychiatry 2010, 197, 395–404. [Google Scholar] [CrossRef]
- Petrou, S.; Johnson, S.; Wolke, D.; Marlow, N. The association between neurodevelopmental disability and economic outcomes during mid-childhood. Child Care Health Dev. 2013, 39, 345–357. [Google Scholar] [CrossRef]
- Quinn, G.E.; Dobson, V.; Saigal, S.; Phelps, D.L.; Hardy, R.J.; Tung, B.; Summers, C.G.; Palmer, E.A. Health-related quality of life at age 10 years in very low-birth-weight children with and without threshold retinopathy of prematurity. Arch. Ophthalmol. 2004, 122, 1659–1666. [Google Scholar]
- Rautava, L.; Häkkinen, U.; Korvenranta, E.; Andersson, S.; Gissler, M.; Hallman, M.; Korvenranta, H.; Leipälä, J.; Linna, M.; Peltola, M. Health-related quality of life in 5-year-old very low birth weight infants. J. Pediatr. 2009, 155, 338–343.e333. [Google Scholar] [CrossRef] [PubMed]
- Saigal, S.; Feeny, D.; Furlong, W.; Rosenbaum, P.; Burrows, E.; Torrance, G. Comparison of the health-related quality of life of extremely low birth weight children and a reference group of children at age eight years. J. Pediatr. 1994, 125, 418–425. [Google Scholar] [CrossRef] [PubMed]
- Saigal, S.; Feeny, D.; Rosenbaum, P.; Furlong, W.; Burrows, E.; Stoskopf, B. Self-perceived health status and health-related quality of life of extremely low-birth-weight infants at adolescence. JAMA 1996, 276, 453–459. [Google Scholar] [CrossRef] [PubMed]
- Saigal, S.; Rosenbaum, P.L.; Feeny, D.; Burrows, E.; Furlong, W.; Stoskopf, B.L.; Hoult, L. Parental perspectives of the health status and health-related quality of life of teen-aged children who were extremely low birth weight and term controls. Pediatrics 2000, 105, 569–574. [Google Scholar] [CrossRef]
- Saigal, S.; Stoskopf, B.; Pinelli, J.; Streiner, D.; Hoult, L.; Paneth, N.; Goddeeris, J. Self-perceived health-related quality of life of former extremely low birth weight infants at young adulthood. Pediatrics 2006, 118, 1140–1148. [Google Scholar] [CrossRef]
- Saigal, S.; Ferro, M.A.; Van Lieshout, R.J.; Schmidt, L.A.; Morrison, K.M.; Boyle, M.H. Health-related quality of life trajectories of extremely low birth weight survivors into adulthood. J. Pediatr. 2016, 179, 68–73.e61. [Google Scholar] [CrossRef]
- Uusitalo, K.; Haataja, L.; Nyman, A.; Ripatti, L.; Huhtala, M.; Rautava, P.; Lehtonen, L.; Parkkola, R.; Lahti, K.; Koivisto, M. Preterm children’s developmental coordination disorder, cognition and quality of life: A prospective cohort study. BMJ Paediatr. Open 2020, 4, e000633. [Google Scholar] [CrossRef]
- Van Dommelen, P.; Van Der Pal, S.M.; Bennebroek Gravenhorst, J.; Walther, F.J.; Wit, J.M.; van der Pal de Bruin, K.M. The effect of early catch-up growth on health and well-being in young adults. Ann. Nutr. Metab. 2014, 65, 220–226. [Google Scholar] [CrossRef]
- Verrips, E.; Vogels, T.; Saigal, S.; Wolke, D.; Meyer, R.; Hoult, L.; Verloove-Vanhorick, S.P. Health-related quality of life for extremely low birth weight adolescents in Canada, Germany, and the Netherlands. Pediatrics 2008, 122, 556–561. [Google Scholar] [CrossRef]
- Drummond, M. Introducing economic and quality of life measurements into clinical studies. Ann. Med. 2001, 33, 344–349. [Google Scholar] [CrossRef]
- Horsman, J.; Furlong, W.; Feeny, D.; Torrance, G. The Health Utilities Index (HUI®): Concepts, measurement properties and applications. Health Qual. Life Outcomes 2003, 1, 54. [Google Scholar] [CrossRef] [PubMed]
- Sintonen, H. Outcome measurement in acid-related diseases. PharmacoEconomics 1994, 5, 17–26. [Google Scholar] [CrossRef]
- Trudel, J.; Rivard, M.; Dobkin, P.; Leclerc, J.-M.; Robaey, P. Psychometric properties of the Health Utilities Index Mark 2 system in paediatric oncology patients. Qual. Life Res. 1998, 7, 421–432. [Google Scholar] [CrossRef] [PubMed]
- Hinds, P.S.; Burghen, E.A.; Zhou, Y.; Zhang, L.; West, N.; Bashore, L.; Pui, C.H. The Health Utilities Index 3 invalidated when completed by nurses for pediatric oncology patients. Cancer Nurs. 2007, 30, 169–177. [Google Scholar] [CrossRef]
- Petrou, S.; Hockley, C. An investigation into the empirical validity of the EQ-5D and SF-6D based on hypothetical preferences in a general population. Health Econ. 2005, 14, 1169–1189. [Google Scholar] [CrossRef]
Disclaimer/Publisher’s Note: The statements, opinions and data contained in all publications are solely those of the individual author(s) and contributor(s) and not of MDPI and/or the editor(s). MDPI and/or the editor(s) disclaim responsibility for any injury to people or property resulting from any ideas, methods, instructions or products referred to in the content. |
© 2023 by the authors. Licensee MDPI, Basel, Switzerland. This article is an open access article distributed under the terms and conditions of the Creative Commons Attribution (CC BY) license (https://creativecommons.org/licenses/by/4.0/).
Share and Cite
Kwon, J.; Bolbocean, C.; Onyimadu, O.; Roberts, N.; Petrou, S. Psychometric Performance of Generic Childhood Multi-Attribute Utility Instruments in Preterm and Low Birthweight Populations: A Systematic Review. Children 2023, 10, 1798. https://doi.org/10.3390/children10111798
Kwon J, Bolbocean C, Onyimadu O, Roberts N, Petrou S. Psychometric Performance of Generic Childhood Multi-Attribute Utility Instruments in Preterm and Low Birthweight Populations: A Systematic Review. Children. 2023; 10(11):1798. https://doi.org/10.3390/children10111798
Chicago/Turabian StyleKwon, Joseph, Corneliu Bolbocean, Olu Onyimadu, Nia Roberts, and Stavros Petrou. 2023. "Psychometric Performance of Generic Childhood Multi-Attribute Utility Instruments in Preterm and Low Birthweight Populations: A Systematic Review" Children 10, no. 11: 1798. https://doi.org/10.3390/children10111798
APA StyleKwon, J., Bolbocean, C., Onyimadu, O., Roberts, N., & Petrou, S. (2023). Psychometric Performance of Generic Childhood Multi-Attribute Utility Instruments in Preterm and Low Birthweight Populations: A Systematic Review. Children, 10(11), 1798. https://doi.org/10.3390/children10111798