
Validation of a New Soccer Shooting Test Based on Speed Radar Measurement and Shooting Accuracy


Abstract
:1. Introduction
2. Materials and Methods
2.1. General Study Design
2.2. Participants
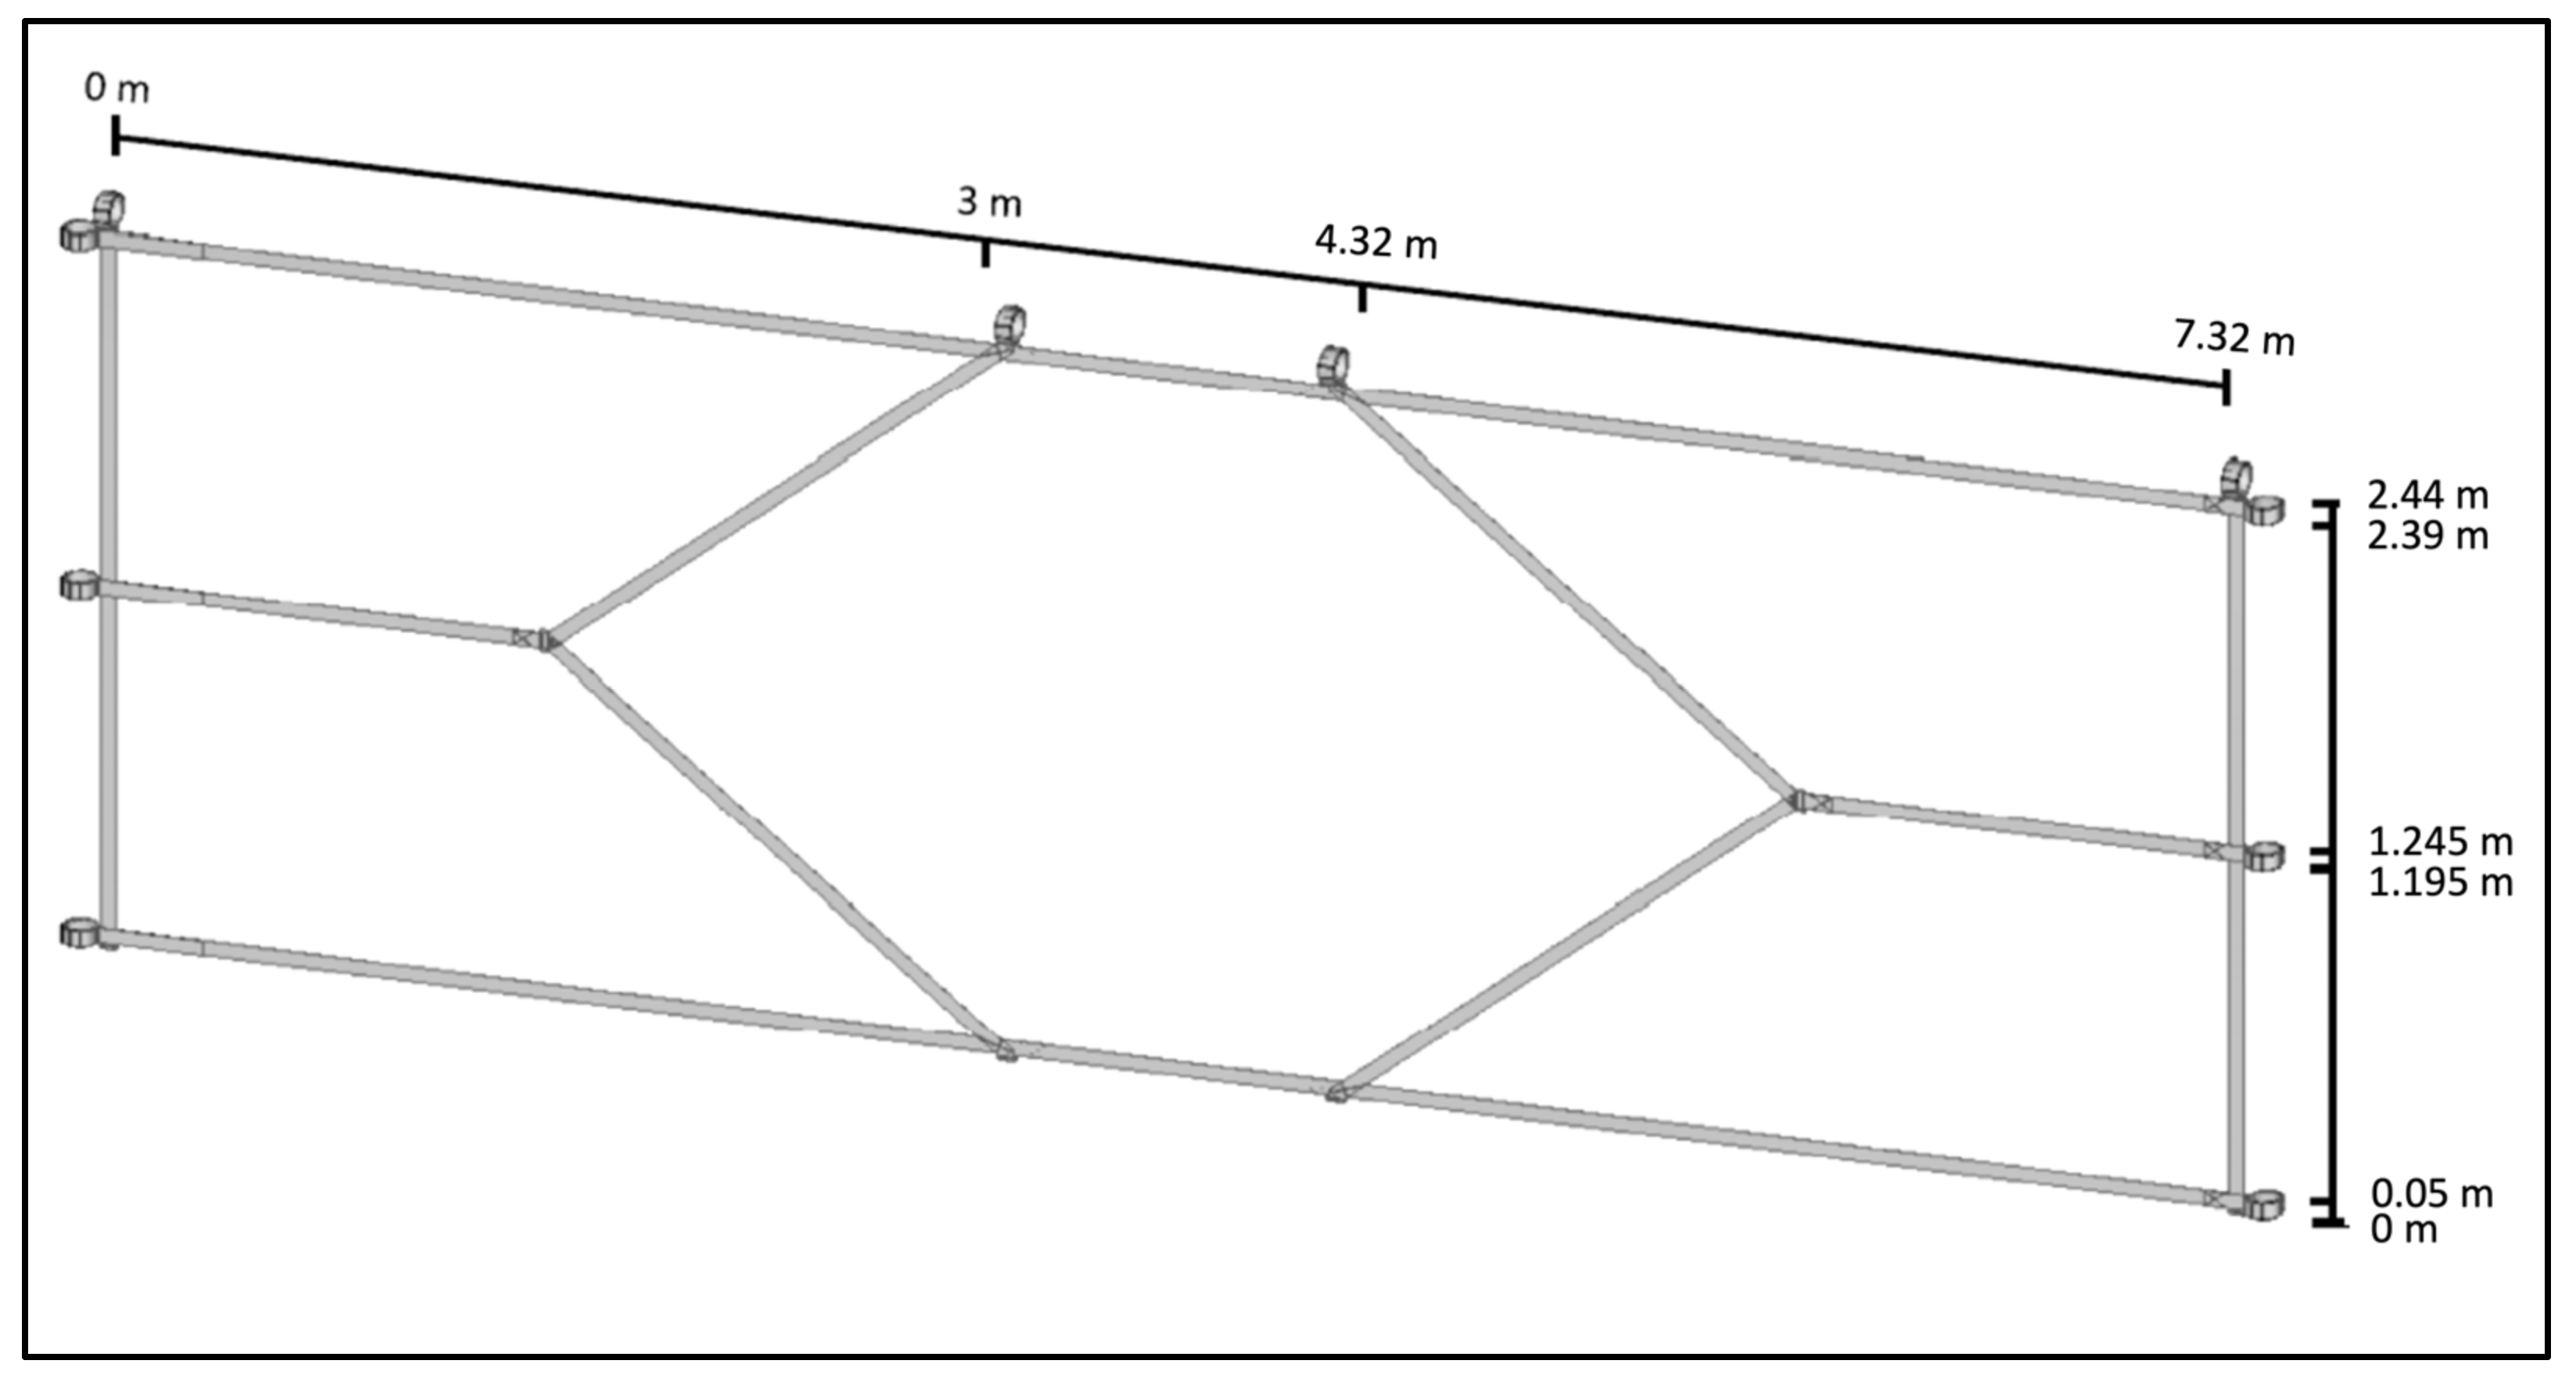
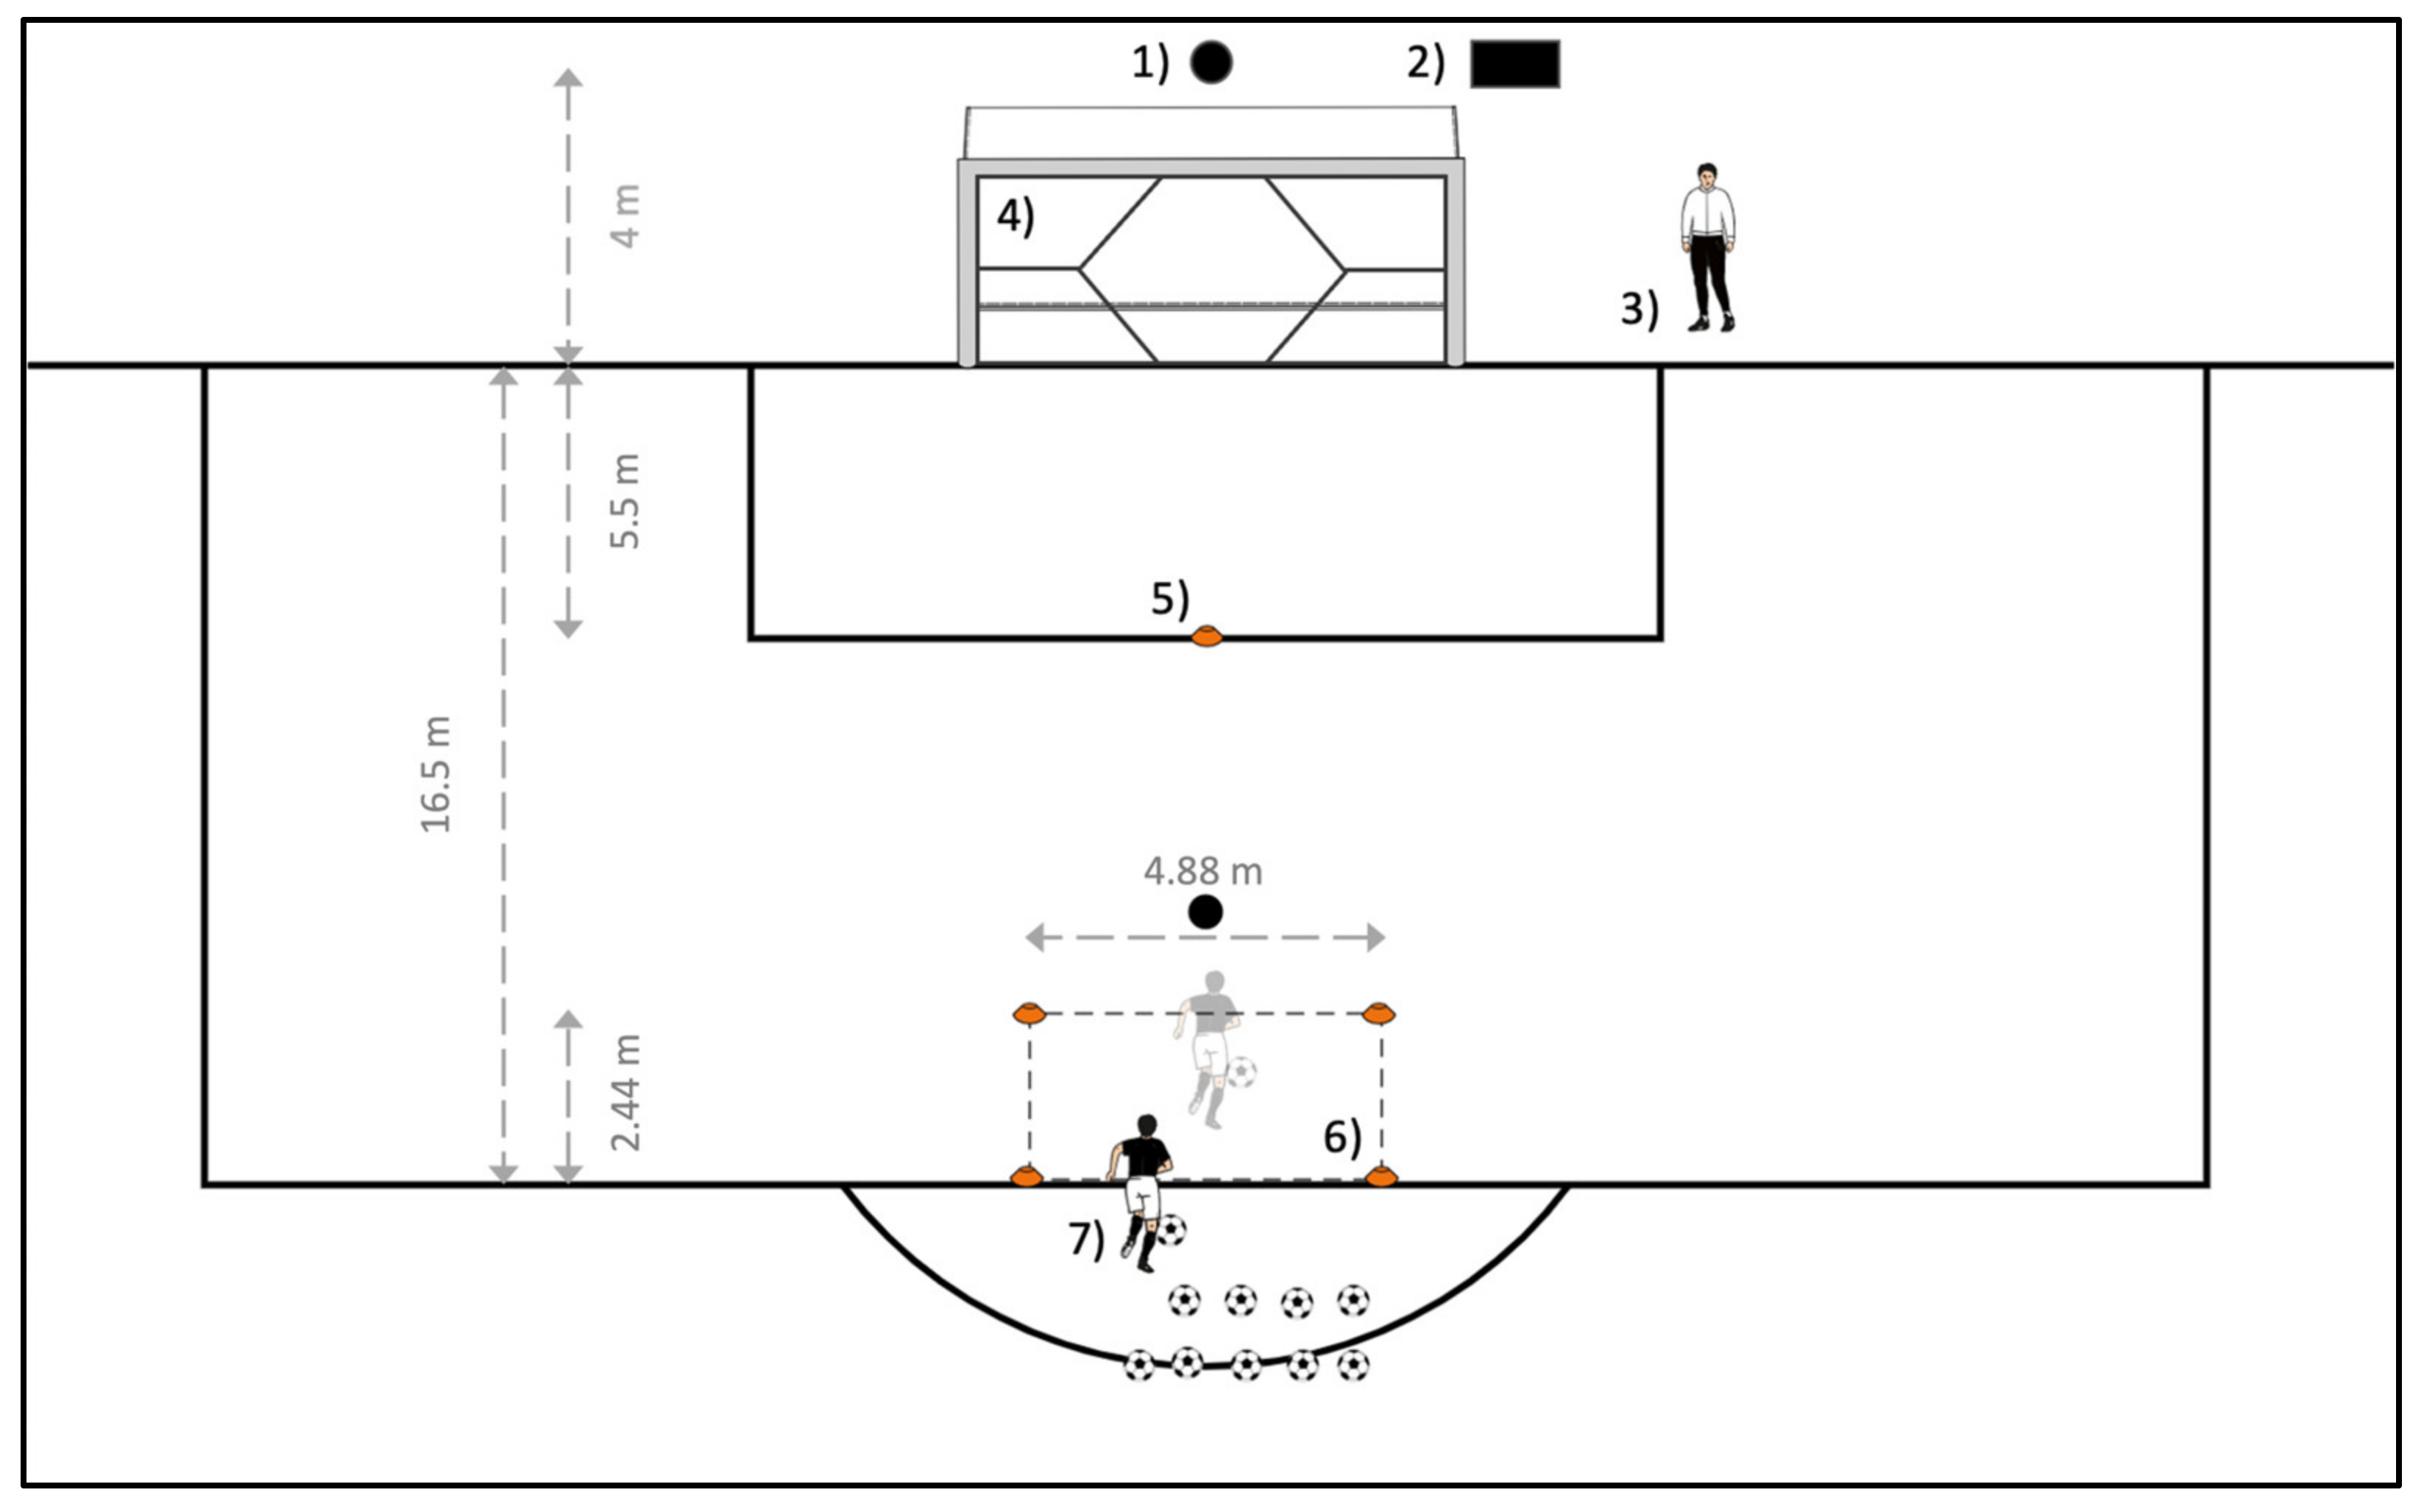
2.3. Test Set-Up
2.4. Measurements
2.5. Coach Ranking
2.6. Statistical Analyses
3. Results
3.1. Comparison of Performance Levels
3.2. Correlation Analysis
3.3. Predictability of Soccer Quality through the Shooting Test
4. Discussion
5. Conclusions
Author Contributions
Funding
Institutional Review Board Statement
Informed Consent Statement
Data Availability Statement
Acknowledgments
Conflicts of Interest
References
- DFL. Anhang V—Richtlinien für die Errichtung und Unterhaltung von Leistungszentren. In Lizenzierungsordnung; Deutsche Fußball Liga, Ed.; DFL: Frankfurt/Main, Germany, 2022. [Google Scholar]
- DFL. Durchschnittsalter in der Bundesliga Gesunken DFL Deutsche Fußball Liga. 2017. Available online: https://www.dfl.de/de/aktuelles/durchschnittsalter-in-der-bundesliga-gesunken/ (accessed on 19 August 2022).
- Knoebel, S. Wie der Reifungsstatus die fußballerische Entwicklung beeinflusst. Z. Sportpsychol. 2021, 28, 38. [Google Scholar] [CrossRef]
- Höner, O. Erläuterungen zu den Individuellen Spielerauswertungen im Rahmen der Technisch-Motorischen Leistungsdiagnostik an den DFB-Stützpunkten, Tübingen. 2015. Available online: https://assets.dfb.de/public/uploads/f10eecf7d57b95211501a72643b12d6166a13d2fa04163d7444a5189e959 (accessed on 24 August 2022).
- Deutscher Fußball-Bund. Leistungsdiagnostik im DFB—Talentförderprogramm: Eine Anleitung zur Durchführung Objektiver und Subjektiver Testverfahren im Aufbaubereich. Testmanual. 2022. Available online: https://uni-tuebingen.de/fakultaeten/wirtschafts-und-sozialwissenschaftliche-fakultaet/faecher/fachbereich-sozialwissenschaften/sportwissenschaft/institut/arbeitsbereiche/sportpsychologie-und-methodenlehre/forschung/identifikation-und-entwicklung-von-talenten-im-sport/ (accessed on 30 October 2022).
- Höner, O. Talentprognose: Ergebnisse zur Technomotorischen Diagnostik im DFB Talentförderprogramm; Philippka-Sportverlag: Münster, Germany, 2013. [Google Scholar]
- Deutscher Fußball-Bund. Testmanual für die Sportmotorische Leistungsdiagnostik—Anleitung zur Testdurchführung; Testmanual; DFB: Frankfurt am Main, Germany, 2022. [Google Scholar]
- Höner, O.; Votteler, A.; Schmid, M.; Schultz, F.; Roth, K. Psychometric properties of the motor diagnostics in the German football talent identification and development programme. J. Sport. Sci. 2015, 33, 145–159. [Google Scholar] [CrossRef] [PubMed]
- Höner, O.; Leyhr, D.; Kelava, A. The influence of speed abilities and technical skills in early adolescence on adult success in soccer: A long-term prospective analysis using ANOVA and SEM approaches. PLoS ONE 2017, 12, e0182211. [Google Scholar] [CrossRef] [PubMed] [Green Version]
- Lago-Ballesteros, J.; Lago-Peñas, C. Performance in Team Sports: Identifying the Keys to Success in Soccer. J. Hum. Kinet. 2010, 25, 85–91. [Google Scholar] [CrossRef]
- Lepschy, H.; Wäsche, H.; Woll, A. Success factors in football: An analysis of the German Bundesliga. Int. J. Perform. Anal. Sport 2020, 20, 150–164. [Google Scholar] [CrossRef]
- Yue, Z.; Broich, H.; Mester, J. Statistical Analysis for the Soccer Matches of the First Bundesliga. Int. J. Sport. Sci. Coach. 2014, 9, 553–560. [Google Scholar] [CrossRef]
- Vieira, L.H.P.; Cunha, S.A.; Moraes, R.; Barbieri, F.A.; Aquino, R.; Oliveira, L.D.P.; Navarro, M.; Bedo, B.L.S.; Santiago, P.R.P. Kicking Performance in Young U9 to U20 Soccer Players: Assessment of Velocity and Accuracy Simultaneously. Res. Q. Exerc. Sport 2018, 89, 210–220. [Google Scholar] [CrossRef]
- Rakojević, B.; Mrdakovic, V.; Pažin, N.; Vulović, R.; Leontiejvic, B.; Ilic, D. Speed-accuracy tradeoff of instep kick in young players. Facta Univ. Ser. Phys. Educ. Sport 2019, 16, 543–555. [Google Scholar] [CrossRef]
- Andersen, T.B.; Dörge, H.C. The influence of speed of approach and accuracy constraint on the maximal speed of the ball in soccer kicking: Speed of approach. Scand. J. Med. Sci. Sport. 2011, 21, 79–84. [Google Scholar] [CrossRef]
- Deutscher Fußball-Bund. Fußballregeln 22/23. Regelwerk, Frankfurt am Main. 2022. Available online: https://www.dfb.de/verbandsservice/publikationen/fussballregeln/ (accessed on 30 October 2022).
- BallSpeedoMeter. The BallSpeedoMeter: Whats Your Speed? Available online: https://www.ballspeedometer.de/ (accessed on 30 October 2022).
- Altman, D.G.; Bland, J.M. Measurement in Medicine: The Analysis of Method Comparison Studies. Statistician 1983, 32, 307. [Google Scholar] [CrossRef]
- Giavarina, D. Understanding Bland Altman analysis. Biochem. Med. 2015, 25, 141–151. [Google Scholar] [CrossRef] [Green Version]
- Stöckel, T.; Carey, D.P. Laterality Effects on Performance in Team Sports. In Laterality in Sports; Elsevier: Amsterdam, The Netherlands, 2016; pp. 309–328. ISBN 978-0-12-801426-4. [Google Scholar]
- Ali, A.; Williams, C.; Hulse, M.; Strudwick, A.; Reddin, J.; Howarth, L.; Eldred, J.; Hirst, M.; McGregor, S. Reliability and validity of two tests of soccer skill. J. Sport. Sci. 2007, 25, 1461–1470. [Google Scholar] [CrossRef]
- Keller, B.S.; Raynor, A.J.; Bruce, L.; Iredale, F. Technical attributes of Australian youth soccer players: Implications for talent identification. Int. J. Sport. Sci. Coach. 2016, 11, 819–824. [Google Scholar] [CrossRef]
- Towlson, C.; Cobley, S.; Midgley, A.; Garrett, A.; Parkin, G.; Lovell, R. Relative Age, Maturation and Physical Biases on Position Allocation in Elite-Youth Soccer. Int. J. Sport. Med. 2017, 38, 201–209. [Google Scholar] [CrossRef] [Green Version]
- Lovell, R.; Towlson, C.; Parkin, G.; Portas, M.; Vaeyens, R.; Cobley, S. Soccer Player Characteristics in English Lower-League Development Programmes: The Relationships between Relative Age, Maturation, Anthropometry and Physical Fitness. PLoS ONE 2015, 10, e0137238. [Google Scholar] [CrossRef]
- Hill, M.; Scott, S.; McGee, D.; Cumming, S.P. Are relative age and biological ages associated with coaches’ evaluations of match performance in male academy soccer players? Int. J. Sport. Sci. Coach. 2021, 16, 227–235. [Google Scholar] [CrossRef]
- Matta, M.D.O.; Figueiredo, A.J.B.; Garcia, E.S.; Werneck, F.Z.; Seabra, A. Morphological and maturational predictors of technical performance in young soccer players. Mot. Rev. Educ. Física 2014, 20, 280–285. [Google Scholar] [CrossRef]
- Hunter, A.H.; Smith, N.M.A.; Camata, T.V.; Crowther, M.S.; Mather, A.; Souza, N.M.; Ramos-Silva, L.F.; Pazetto, N.F.; Moura, F.A.; Wilson, R.S. Age- and size-corrected kicking speed and accuracy in elite junior soccer players. Sci. Med. Footb. 2022, 6, 29–39. [Google Scholar] [CrossRef]
- Rodríguez-Lorenzo, L.; Fernández-Del Olmo, M.; Sánchez-Molina, J.A.; Martín-Acero, R. Kicking ability and kicking deficit in young elite soccer players. Kinesiology 2018, 50, 194–203. [Google Scholar] [CrossRef]
- Towlson, C.; MacMaster, C.; Parr, J.; Cumming, S. One of these things is not like the other: Time to differentiate between relative age and biological maturity selection biases in soccer? Sci. Med. Footb. 2022, 6, 273–276. [Google Scholar] [CrossRef]
- Lipecki, K. Age-Related Differences in Fitness Performance and Technical Skills of Young Soccer Players. Pol. J. Sport Tour. 2018, 25, 8–14. [Google Scholar] [CrossRef] [Green Version]
- Pertsukhov, A.; Shalenko, V. Features if effective goal shots by football players in gamew of high level teams. Slobozhanskyi Her. Sci. Sport 2020, 8, 17–28. [Google Scholar]
- Bar-Eli, M.; Azar, O.H. Penalty kicks in soccer: An empirical analysis of shooting strategies and goalkeepers’ preferences. Soccer Soc. 2009, 10, 183–191. [Google Scholar] [CrossRef]
- Hohmann, A.; Siener, M. Talent Identification in Youth Soccer: Prognosis of U17 Soccer Performance on the Basis of General Athleticism and Talent Promotion Interventions in Second-Grade Children. Front. Sport. Act. Living 2021, 3, 625645. [Google Scholar] [CrossRef]


| Variables | Performance Level (Sign. Difference) | N | M | SD | SE | 95%-CL | Min | Max | |
|---|---|---|---|---|---|---|---|---|---|
| LL | UL | ||||||||
| Shots on target | 1st division (c) | 10 | 3.90 | 0.994 | 0.314 | 3.19 | 4.61 | 2 | 5 |
| 2nd division (c) | 17 | 3.59 | 1.176 | 0.285 | 2.98 | 4.19 | 1 | 5 | |
| 5th division (a,b) | 18 | 2.50 | 1.249 | 0.294 | 1.88 | 3.12 | 1 | 5 | |
| 7th division | 12 | 2.67 | 1.073 | 0.310 | 1.98 | 3.35 | 1 | 5 | |
| Shots at post | 1st division | 10 | 1.00 | 1.155 | 0.365 | 0.17 | 1.83 | 0 | 3 |
| 2nd division | 17 | 0.88 | 0.928 | 0.225 | 0.41 | 1.36 | 0 | 2 | |
| 5th division | 18 | 1.00 | 0.840 | 0.198 | 0.58 | 1.42 | 0 | 2 | |
| 7th division | 12 | 0.83 | 0.835 | 0.241 | 0.30 | 1.36 | 0 | 2 | |
| Shots missed | 1st division | 10 | 3.10 | 1.101 | 0.348 | 2.31 | 3.89 | 1 | 4 |
| 2nd division | 17 | 3.53 | 1.281 | 0.311 | 2.87 | 4.19 | 1 | 5 | |
| 5th division | 18 | 4.50 | 1.465 | 0.345 | 3.77 | 5.23 | 2 | 7 | |
| 7th division | 12 | 4.50 | 1.382 | 0.399 | 3.62 | 5.38 | 3 | 7 | |
| Max. shot speed (km/h) | 1st division (d) | 10 | 93.10 | 6.631 | 2.097 | 88.356 | 97.844 | 81.2 | 103.8 |
| 2nd division (d) | 17 | 97.67 | 8.000 | 1.940 | 93.557 | 101.784 | 83.7 | 109.0 | |
| 5th division (d) | 18 | 98.12 | 6.894 | 1.625 | 94.700 | 101.556 | 84.8 | 108.1 | |
| 7th division (a,b,c) | 12 | 82.45 | 6.633 | 1.915 | 78.235 | 86.665 | 68.1 | 90.7 | |
| Avg. shot speed (km/h) | 1st division (d) | 10 | 72.76 | 2.584 | 0.817 | 70.9130 | 74.6095 | 69.08 | 76.78 |
| 2nd division (d) | 17 | 70.66 | 5.601 | 1.359 | 67.7854 | 73.5455 | 60.15 | 79.38 | |
| 5th division (d) | 18 | 70.00 | 5.446 | 1.284 | 67.2938 | 72.7103 | 60.40 | 79.14 | |
| 7th division (a,b,c), | 12 | 58.75 | 4.560 | 1.316 | 55.8569 | 61.6514 | 48.51 | 65.73 | |
| Avg. shot speed DL (km/h) | 1st division (d) | 10 | 75.30 | 2.943 | 0.931 | 73.1944 | 77.4056 | 70.48 | 78.85 |
| 2nd division (d) | 17 | 73.10 | 6.173 | 1.497 | 69.9291 | 76.2768 | 62.58 | 82.75 | |
| 5th division (d) | 18 | 75.00 | 6.248 | 1.473 | 71.8928 | 78.1072 | 65.25 | 87.85 | |
| 7th division (a,b,c) | 12 | 66.13 | 5.823 | 1.681 | 62.4313 | 69.8312 | 55.53 | 74.90 | |
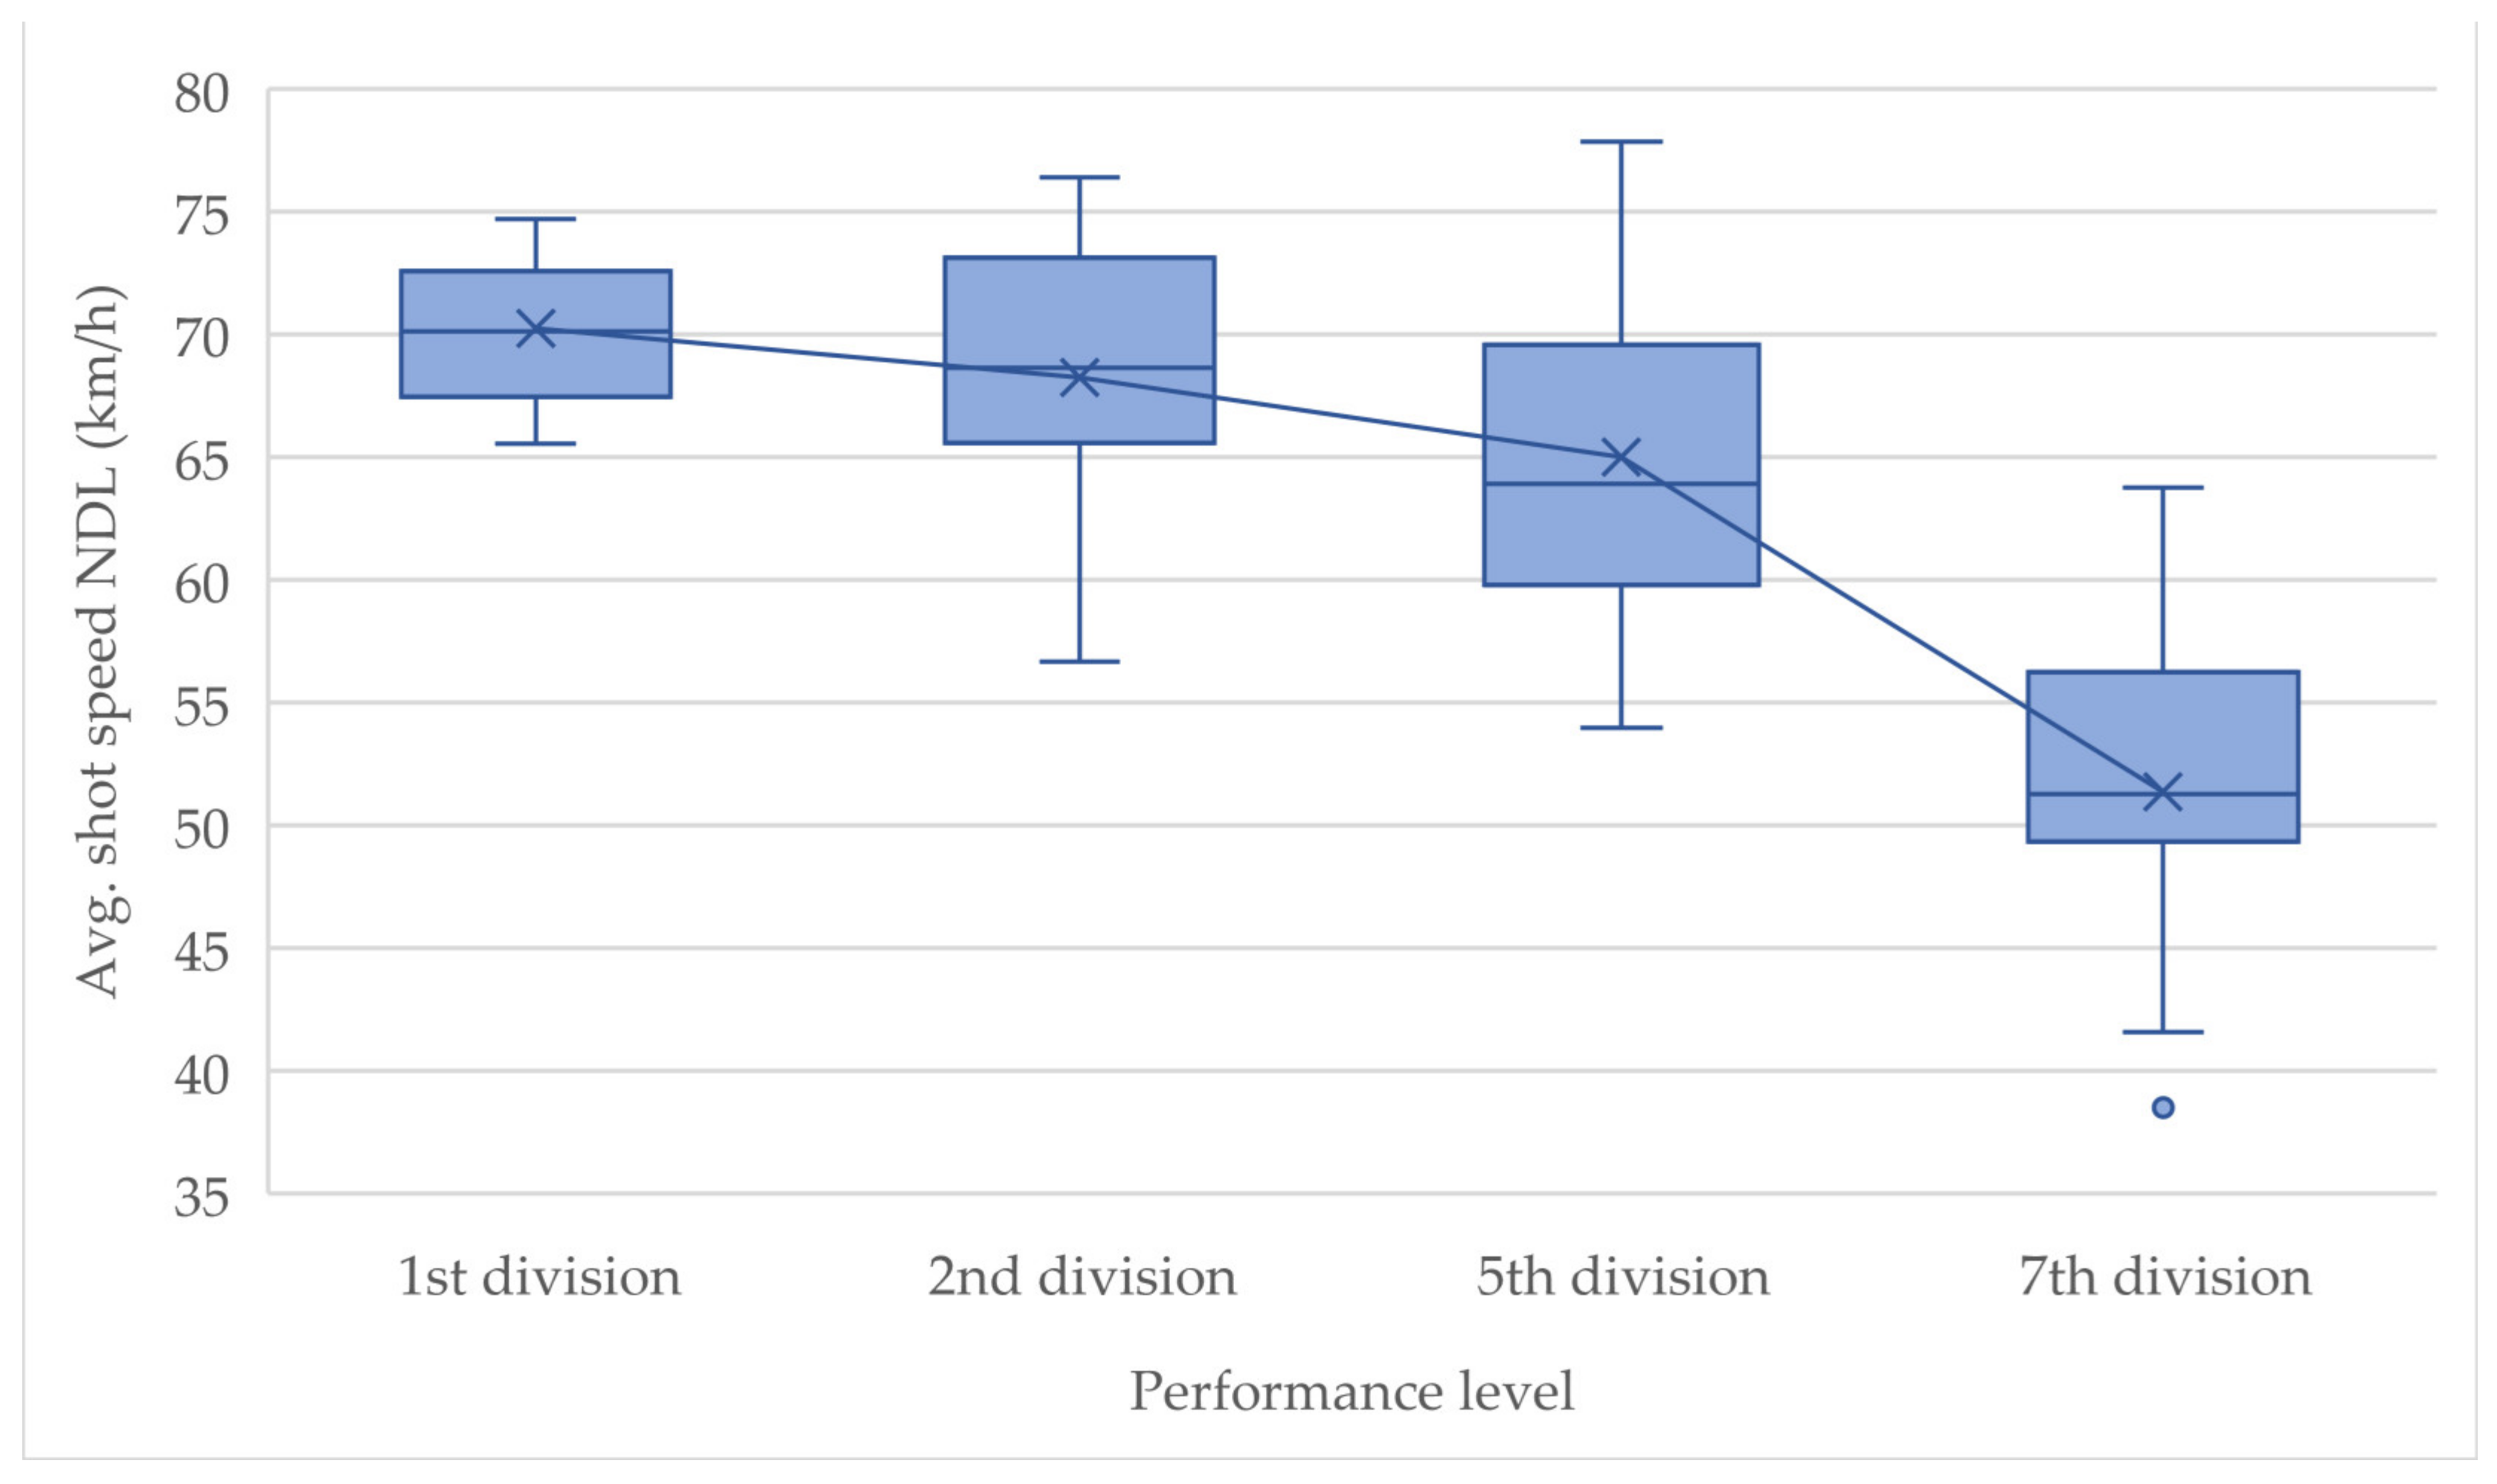
| Avg. shot speed NDL (km/h) | 1st division (d) | 10 | 70.22 | 3.025 | 0.957 | 68.0582 | 72.3868 | 65.53 | 74.70 |
| 2nd division (d) | 17 | 68.23 | 5.767 | 1.399 | 65.2631 | 71.1928 | 56.68 | 76.38 | |
| 5th division (d) | 18 | 65.00 | 7.036 | 1.658 | 61.5051 | 68.5032 | 53.98 | 77.83 | |
| 7th division (a,b,c) | 12 | 51.38 | 6.784 | 1.958 | 47.0668 | 55.6874 | 38.50 | 63.75 | |
| Avg. shot speed/max shot speed (%) | 1st division (c,d) | 10 | 78.37 | 3.730 | 1.180 | 75.70 | 81.04 | 73.81 | 85.33 |
| 2nd division | 17 | 72.70 | 7.263 | 1.762 | 68.97 | 76.43 | 60.82 | 86.84 | |
| 5th division (a) | 18 | 71.43 | 4.381 | 1.033 | 69.25 | 73.61 | 62.73 | 80.18 | |
| 7th division (a) | 12 | 71.37 | 3.846 | 1.110 | 68.93 | 73.81 | 64.48 | 77.40 | |
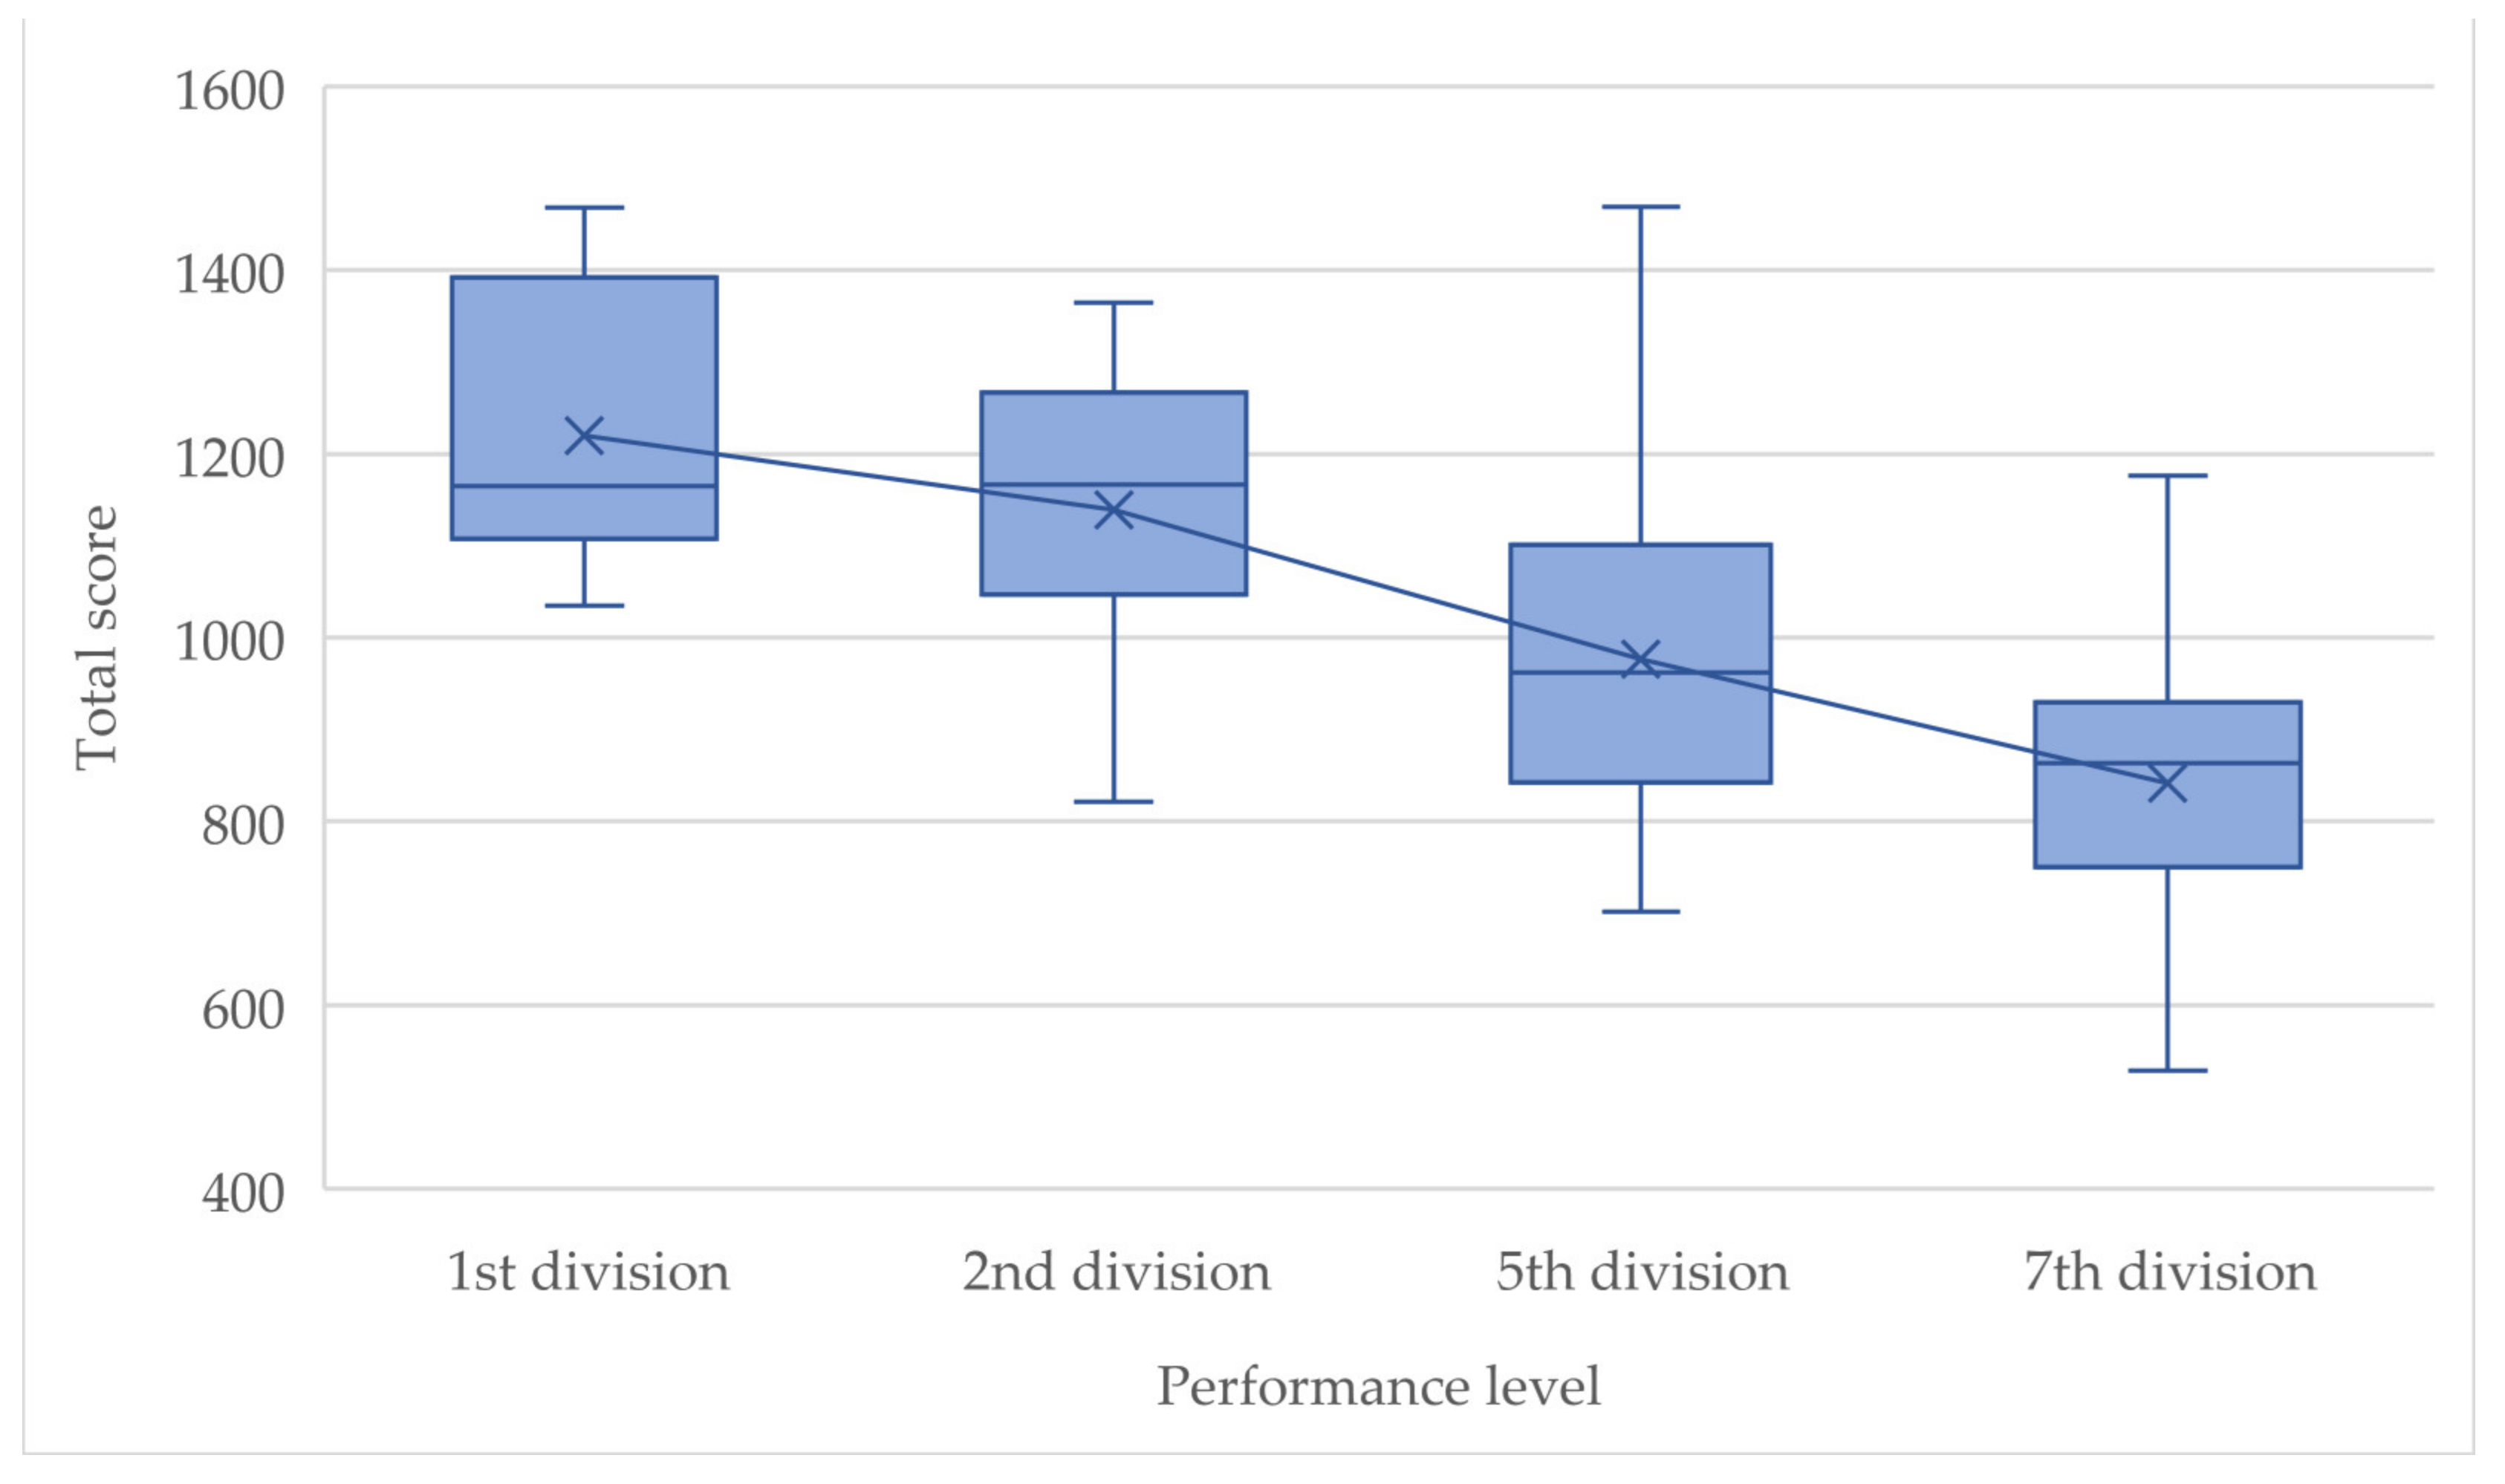
| Total score | 1st division (c,d) | 10 | 1219.5 | 149.213 | 47.185 | 1112.71 | 1326.19 | 1035.10 | 1467.70 |
| 2nd division (c,d) | 17 | 1138.9 | 168.131 | 40.778 | 1052.46 | 1225.34 | 821.30 | 1364.20 | |
| 5th division (a,b) | 18 | 976.3 | 194.484 | 45.840 | 879.59 | 1073.01 | 701.60 | 1469.00 | |
| 7th division (a,b) | 12 | 841.8 | 166.780 | 48.145 | 735.82 | 947.76 | 528.50 | 1175.80 | |
| Score lower targets | 1st division (c,d) | 10 | 745.93 | 71.481 | 22.604 | 694.80 | 797.06 | 658.60 | 890.10 |
| 2nd division (c,d) | 17 | 728.46 | 146.018 | 35.415 | 653.38 | 803.53 | 474.40 | 909.00 | |
| 5th division (a,b) | 18 | 607.34 | 137.685 | 32.453 | 538.88 | 675.81 | 407.80 | 918.90 | |
| 7th division (a,b) | 12 | 501.46 | 117.148 | 33.818 | 427.03 | 575.89 | 292.60 | 689.70 | |
| Score upper targets | 1st division | 10 | 473.52 | 152.273 | 48.153 | 364.59 | 582.45 | 278.40 | 691.70 |
| 2nd division | 17 | 410.44 | 124.838 | 30.278 | 346.26 | 474.63 | 255.20 | 786.80 | |
| 5th division | 18 | 368.96 | 91.774 | 21.631 | 323.32 | 414.59 | 230.00 | 550.10 | |
| 7th division | 12 | 340.33 | 92.160 | 26.604 | 281.78 | 398.89 | 228.40 | 526.20 | |
| Score DL | 1st division | 10 | 626.27 | 107.000 | 33.836 | 549.73 | 702.81 | 450.40 | 791.50 |
| 2nd division | 17 | 616.11 | 103.513 | 25.106 | 562.88 | 669.33 | 411.80 | 777.40 | |
| 5th division | 18 | 519.50 | 116.663 | 27.498 | 461.48 | 577.52 | 261.00 | 767.70 | |
| 7th division | 12 | 515.08 | 170.579 | 49.242 | 406.69 | 623.46 | 266.60 | 860.70 | |
| Score NDL | 1st division (c,d) | 10 | 593.18 | 77.928 | 24.643 | 537.43 | 648.93 | 459.80 | 694.30 |
| 2nd division (d) | 17 | 522.79 | 96.162 | 23.323 | 473.35 | 572.24 | 340.70 | 659.70 | |
| 5th division (a,d) | 18 | 456.80 | 107.892 | 25.431 | 403.15 | 510.45 | 256.70 | 701.30 | |
| 7th division (a,b,c) | 12 | 326.72 | 84.348 | 24.349 | 273.12 | 380.31 | 192.30 | 447.20 | |
| Variables | F (3.53) | p | η2 |
|---|---|---|---|
| Avg. shot speed NDL | 23.599 | <0.001 ** | 0.572 |
| Avg. shot speed | 19.641 | <0.001 ** | 0.526 |
| Score NDL | 16.535 | <0.001 ** | 0.483 |
| Max. shot speed | 13.959 | <0.001 ** | 0.441 |
| Total score | 11.391 | <0.001 ** | 0.392 |
| Score lower targets | 10.124 | <0.001 ** | 0.364 |
| Avg. shot speed DL | 6.997 | <0.001 ** | 0.284 |
| Shots on target | 4.829 | 0.005 ** | 0.215 |
| Avg. shot speed/max. shot speed | 4.433 | 0.007 ** | 0.201 |
| Shots missed | 3.602 | 0.019 * | 0.169 |
| Score DL | 3.188 | 0.031 * | 0.153 |
| Score upper targets | 2.891 | 0.044 * | 0.141 |
| Shots at post | 0.112 | 0.953 | 0.006 |
| Coach Ranking | Max. Shot Speed | Avg. Shot Speed | Avg. Shot Speed DL | Avg. Shot Speed NDL | % of Max. Shot Speed | Total Score | Score Lower Targets | Score Upper Targets | Score DL | Score NDL | Shots on Target | Shots at Post | Shots Missed | |
|---|---|---|---|---|---|---|---|---|---|---|---|---|---|---|
| Coach ranking | - | −0.421 ** | −0.684 ** | −0.462 ** | −0.720 ** | −0.409 ** | −0.666 ** | −0.619 ** | −0.402 ** | −0.427 ** | −0.678 ** | −0.433 ** | −0.014 | 0.387 ** |
| Max. shot speed | - | 0.691 ** | 0.552 ** | 0.668 ** | −0.338* | 0.411 ** | 0.525 ** | 0.062 | 0.277 * | 0.409 ** | 0.057 | 0.185 | −0.167 | |
| Avg. shot speed | - | 0.854 ** | 0.926 ** | 0.444 ** | 0.570 ** | 0.533 ** | 0.340 ** | 0.368 ** | 0.584 ** | 0.143 | −0.027 | −0.027 | ||
| Avg. shot speed DL | - | 0.594 ** | 0.420 ** | 0.337 * | 0.262* | 0.269 * | 0.299 * | 0.261 | −0.046 | −0.080 | 0.092 | |||
| Avg. shot speed NDL | - | 0.381 ** | 0.637 ** | 0.634 ** | 0.330 * | 0.352 ** | 0.713 ** | 0.255 | 0.016 | −0.236 | ||||
| % of max. shot speed | - | 0.245 | 0.057 | 0.369 ** | 0.140 | 0.269 * | 0.135 | −0.280 * | 0.057 | |||||
| Total score | - | 0.842 ** | 0.716 ** | 0.837 ** | 0.828 ** | 0.840 ** | 0.132 | −0.828 ** | ||||||
| Score lower targets | - | 0.226 | 0.662 ** | 0.740 ** | 0.705 ** | 0.040 | −0.650 ** | |||||||
| Score upper targets | - | 0.654 ** | 0.536 ** | 0.603 ** | 0.187 | −0.653 ** | ||||||||
| Score DL | - | 0.385 ** | 0.728 ** | 0.131 | −0.728 ** | |||||||||
| Score NDL | - | 0.669 ** | 0.088 | −0.648 ** | ||||||||||
| Shots on target | - | −0.166 | −0.781 ** | |||||||||||
| Shots at post | - | −0.487 ** | ||||||||||||
| Shots missed | - |
Disclaimer/Publisher’s Note: The statements, opinions and data contained in all publications are solely those of the individual author(s) and contributor(s) and not of MDPI and/or the editor(s). MDPI and/or the editor(s) disclaim responsibility for any injury to people or property resulting from any ideas, methods, instructions or products referred to in the content. |
© 2023 by the authors. Licensee MDPI, Basel, Switzerland. This article is an open access article distributed under the terms and conditions of the Creative Commons Attribution (CC BY) license (https://creativecommons.org/licenses/by/4.0/).
Share and Cite
Engler, F.; Hohmann, A.; Siener, M. Validation of a New Soccer Shooting Test Based on Speed Radar Measurement and Shooting Accuracy. Children 2023, 10, 199. https://doi.org/10.3390/children10020199
Engler F, Hohmann A, Siener M. Validation of a New Soccer Shooting Test Based on Speed Radar Measurement and Shooting Accuracy. Children. 2023; 10(2):199. https://doi.org/10.3390/children10020199
Chicago/Turabian StyleEngler, Felix, Andreas Hohmann, and Maximilian Siener. 2023. "Validation of a New Soccer Shooting Test Based on Speed Radar Measurement and Shooting Accuracy" Children 10, no. 2: 199. https://doi.org/10.3390/children10020199