
A Multilevel Analysis of Factors Influencing School Bullying in 15-Year-Old Students


Abstract
:1. Introduction
2. Materials and Methods
2.1. Materials
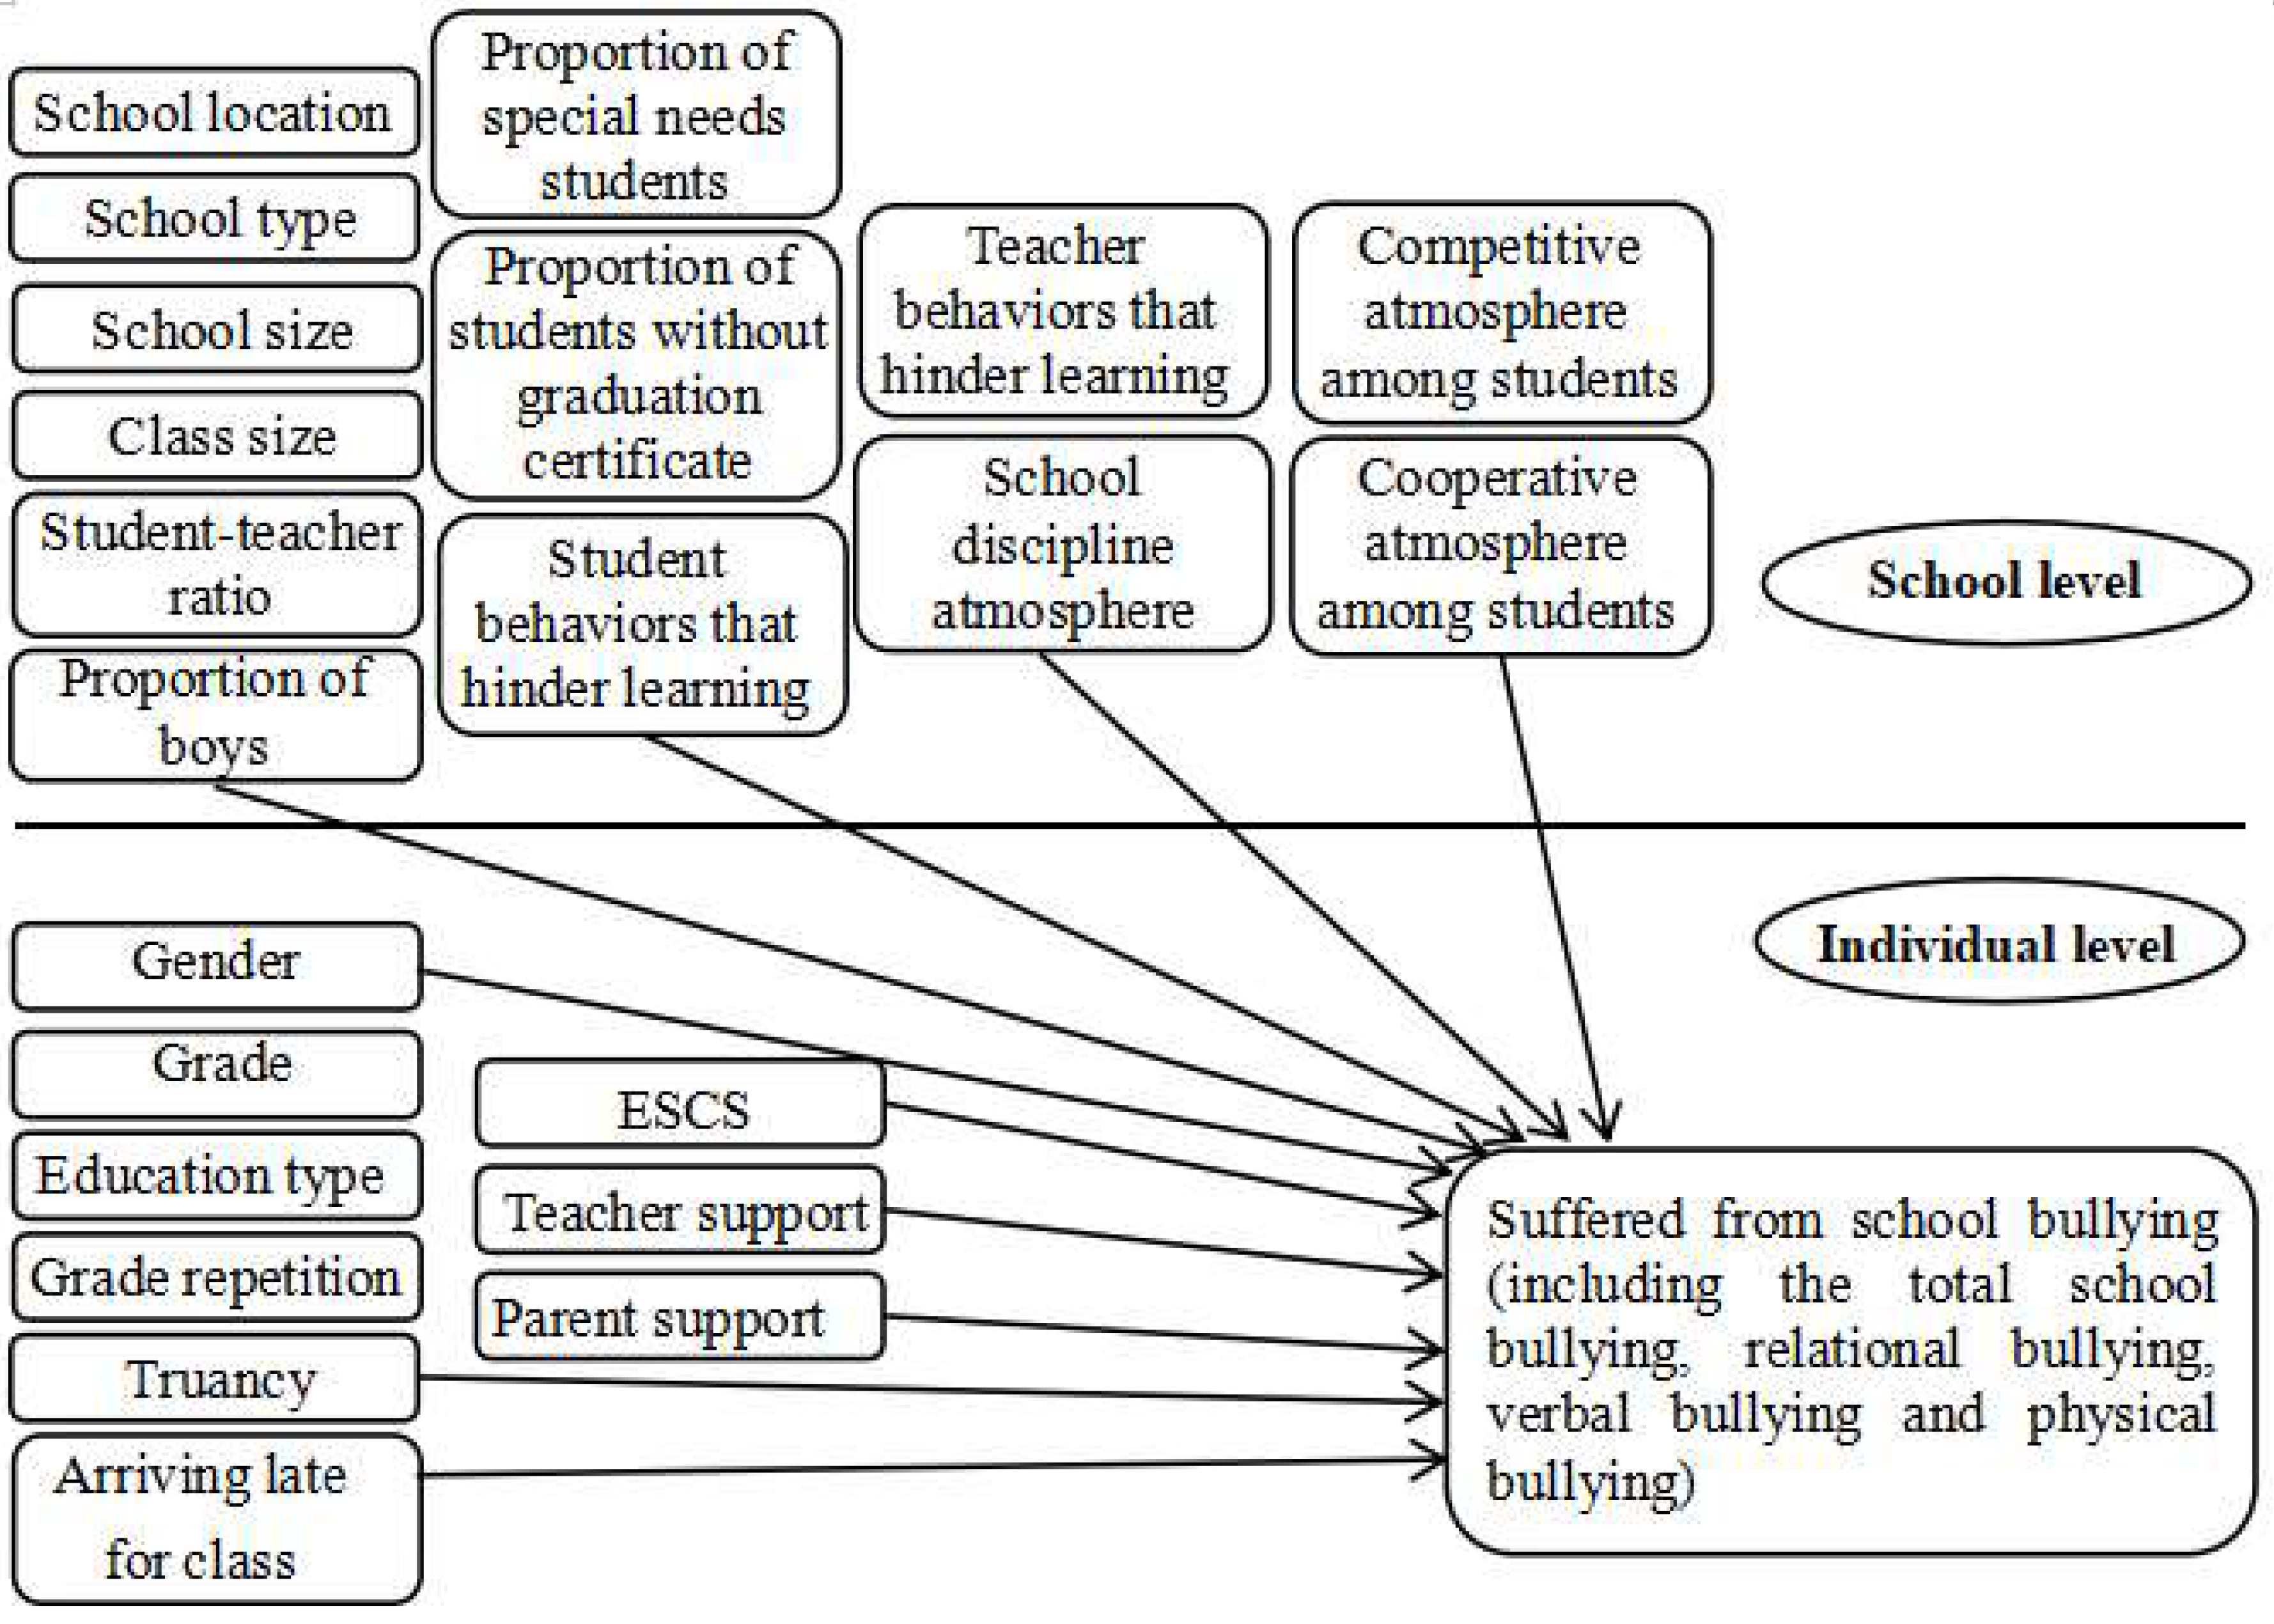
2.2. Research Variables
2.3. Statistical Analyses
3. Results
3.1. Model I: Null Model
3.2. Model II: Random Coefficient Model
3.3. Model III: Intercepts as Outcomes Model
4. Discussion
4.1. Influence of Student-Level Variables on Students Being Bullied
4.2. Influence of School-Level Variables on Students Being Bullied
4.3. Limitations and Future Research Directions
5. Conclusions
Author Contributions
Funding
Institutional Review Board Statement
Informed Consent Statement
Data Availability Statement
Acknowledgments
Conflicts of Interest
Appendix A
Appendix A.1. The Introduction to PISA and Descriptions of Student and School Questionnaires
Appendix A.2. The Procedure of Data Collection
Appendix A.3. The Statistical Criteria and Procedure of Deleting Data
| AGGREGATE |
| /OUTFILE = ‘F:\level2.sav’ *** Integrate data from level 1 to level 2 *** |
| /BREAK = CNTSCHID *** CNTSCHID is the name of the group variable *** |
| /sdx1 = SD(ST205Q01HA) *** SD () is standard deviation set syntax *** |
| /sdx2 = SD(ST205Q02HA) |
| /sdx3 = SD(ST205Q03HA) |
| /sdx4 = SD(ST205Q04HA). |
| execute. |
| Get file = ‘F:\level2.sav’. |
| COMPUTE varx1 = sdx1 * sdx1. *** Calculated variance *** |
| COMPUTE varx2 = sdx2 * sdx2. |
| COMPUTE varx3 = sdx3 * sdx3. |
| COMPUTE varx4 = sdx4 * sdx4. |
| compute mvar = MEAN(varx1,varx2, varx3,varx4). |
| *** Calculate the mean value of variances *** |
| compute nvar = 4. *** Question number of the variable *** |
| compute rwg = nvar * (1 − (mvar/2))/(nvar * (1 − (mvar/2)) + mvar/2). |
| execute. |
Appendix B
Appendix B.1. Outcome Variables (Y)
- “Other students left me out of things on purpose.” (Relational bullying),
- “Other students made fun of me.” (Verbal bullying),
- “I was threatened by other students.” (Verbal bullying),
- “Other students took away or destroyed things that belonged to me.” (Physical bullying),
- “I got hit or pushed around by other students. “ (Physical bullying),
- “Other students spread nasty rumors about me.” (Relational bullying).
Appendix B.2. Predictor Variables (X)
- Gender. In this study, gender is a binary dummy variable, female = 0, male = 1. Studies found that the number of male students who suffered from school bullying was significantly higher than that of female students [8,14], so gender is an important factor that affects a student’s suffering from school bullying.
- Education Type (two-category dummy variable), general education = 0, vocational education = 1;
- Grade repetition (two-category dummy variable), no grade repetition = 0, grade repetition = 1;
- Truancy (two-category dummy variable), no truancy = 0, truancy = 1;
- Arriving late for class (two-category dummy variable), no lateness = 0, lateness = 1;
- Family’s economic, social, and cultural status (continuous variable). PISA uses IRT technology to synthesize ESCS according to the parents’ highest educational degree (PARED) which selects the maximum value of parents, parents’ highest occupational status (HISEI) which is assigned based on the occupational prestige index in previous research [44] and adopts the maximum value of parents, and home properties (HOMEPOS) which is based on the property condition reported by students of their family’s computers, books, musical instruments, internet, independent bedrooms, vehicles (cars), and other household assets, etc. Then, they are added up to obtain the individual overall household economic status score. Finally, the three variables of PARED, HISEI, and HOMEPOS were converted into standard Z-values and subjected to principal component analysis to obtain the ESCS value of each student. The average value of students in OECD countries is 0, and if the value is negative/positive, it is lower/higher than the average level of students in OECD countries. The higher the score is, the higher the family’s economic, social, and cultural status is.
- The above 1 to 7 variables are not potential constructs, and they belong to the measurement of non-psychological constructs; there is no measurement error, so there is no need to discuss their reliabilities and validities.Teacher support (continuous variable). The variable measures the teacher’s cognitive and emotional support as perceived by the students for them in the classroom. There are four items for the question “How often do these things happen in your <test language lessons>?”:“The teacher shows an interest in every student’s learning”;“The teacher gives extra help when students need it”;“The teacher helps students with their learning”;“The teacher continues teaching until the students understand”.
- 9.
- Parent support (continuous variable). The variable measures students’ perceived emotional support from their parents, including three items for the question “Thinking about <this academic year>: to what extent do you agree or disagree with the following statements?”:“My parents support my educational efforts and achievements”;“My parents support me when I am facing difficulties at school”;“My parents encourage me to be confident”.
- School location (categorical variable): divided into town schools and city schools, town schools = 0, city schools = 1. The areas where schools are located in villages (less than 3000 people), towns (about 3000 to 15,000 people), and county towns (about 15,000 to 100,000 people) are classified as town schools, and the areas where schools are located in cities (100,000 to 1 million people) and large cities (more than 1 million people) are classified as city schools;
- School type (categorical variable): divided into public schools, which refer to schools directly or indirectly managed by the government or public educational institutions, and the leadership of the school is appointed or openly elected by the government, and private schools, which refer to schools directly or indirectly managed by non-government organizations, such as churches, unions, businesses, or other private institutions. Public schools are assigned the value of 0, and private schools as 1;
- School size (continuous variable): the school size measures the total number of students enrolled in the school. When the total number of students is larger, it means that the school is larger in size;
- Class size (continuous variable): class size refers to the average number of class members in the school, and the larger the value is, the larger the class size is;
- Student–teacher ratio (continuous variable): the ratio of the total number of students to the total number of teachers in the school, and the larger the value is, the more students are supervised by each teacher;
- Proportion of boys (continuous variable): refers to the proportion of the number of boys in school to the total number of students, and the larger the value is, the more boys in the school there are;
- Proportion of special needs students (continuous variable): refers to the sum proportion of students whose native language is not Chinese, students with special educational needs, and students who are from families with financial difficulties. The larger the value is, the more of students with special needs there are;
- Proportion of students without graduation certificate (continuous variable): refers to the proportion of the students’ number who leave the school without obtaining a graduation certificate to the total number of students. The larger the value is, the more students without a graduation certificate there are;
- 9.
- Student behaviors and teacher behaviors that hinder learning at school (continuous variable): in the school questionnaire, we learned about student behaviors and teacher behaviors that hinder student learning by asking “In your school, to what extent is the learning of students hindered by the following phenomena?”
- 10.
- School disciplinary atmosphere (continuous variable): it is aggregated from the mean value of the disciplinary atmosphere of the class perceived by students in the student questionnaire. The measurement of disciplinary atmosphere in the student questionnaire includes the following five items for the question “How often do these things happen in your <test language lessons>?”:“Students don’t listen to what the teacher says”;“There is noise and disorder”;“The teacher has to wait a long time for students to quiet down “;“Students cannot work well”;“Students don’t start working for a long time after the lesson begins”.
- 11.
- Competitive/Cooperative atmosphere among students: it is aggregated from the mean value of the competitive/cooperative atmosphere among students perceived by students in the student questionnaire. The measurement of the two variables in the student questionnaire consists of four items for the question “Think about your school: how true are the following statements?”:“Students seem to value competition/cooperation”,“It seems that students are competing/cooperating with each other”,“Students seem to share the feeling that competing/cooperating with each other is important”,“Students feel that they are being compared with others”/“Students feel that they are encouraged to cooperate with others”.
Appendix C
Appendix C.1. The Formula of Model I
Appendix C.2. The Formula of Model II
Appendix C.3. The Formula of Model III

| Model I | Model II | Model III | |||||||
|---|---|---|---|---|---|---|---|---|---|
| Fixed Effect | γ Coefficient | S.E. | p | γ Coefficient | S.E. | p | γ Coefficient | S.E. | p |
| γ00 | 2.491 | 0.011 | <0.001 | 2.309 | 0.017 | <0.001 | 2.335 | 0.025 | <0.001 |
| Student-level variables | |||||||||
| Gender γ10 | 0.218 | 0.020 | <0.001 | 0.215 | 0.020 | <0.001 | |||
| Grade γ20 | −0.022 | 0.021 | 0.293 | −0.029 | 0.021 | 0.173 | |||
| Education type γ30 | 0.000 | 0.029 | 0.995 | 0.001 | 0.030 | 0.972 | |||
| Grade repetition γ40 | 0.125 | 0.043 | 0.004 | 0.124 | 0.044 | 0.005 | |||
| Truancy γ50 | 0.431 | 0.038 | <0.001 | 0.427 | 0.038 | <0.001 | |||
| Arriving late for class γ60 | 0.085 | 0.022 | <0.001 | 0.082 | 0.022 | <0.001 | |||
| ESCS γ70 | −0.010 | 0.011 | 0.368 | −0.006 | 0.011 | 0.580 | |||
| Teacher support γ80 | −0.195 | 0.017 | <0.001 | −0.192 | 0.017 | <0.001 | |||
| Parent support γ90 | −0.142 | 0.017 | <0.001 | −0.140 | 0.017 | <0.001 | |||
| School-level variables | |||||||||
| School location γ01 | −0.013 | 0.023 | 0.566 | ||||||
| School type γ02 | −0.032 | 0.033 | 0.338 | ||||||
| School size γ03 | <0.001 | <0.001 | 0.880 | ||||||
| Class size γ04 | 0.001 | 0.001 | 0.548 | ||||||
| Student–teacher ratio γ05 | <0.001 | 0.002 | 0.850 | ||||||
| Proportion of boys γ06 | −0.111 | 0.130 | 0.395 | ||||||
| Proportion of special needs students γ07 | −0.001 | 0.001 | 0.522 | ||||||
| Proportion of students without graduation certificates γ08 | −0.003 | 0.003 | 0.328 | ||||||
| Student behaviors that hinder learning γ09 | 0.004 | 0.004 | 0.332 | ||||||
| Teacher behaviors that hinder learning γ10 | −0.005 | 0.005 | 0.350 | ||||||
| School discipline atmosphere γ011 | −0.198 | 0.074 | 0.008 | ||||||
| Competitive atmosphere among students γ012 | 0.263 | 0.078 | 0.001 | ||||||
| Cooperative atmosphere among students γ013 | −0.074 | 0.069 | 0.283 | ||||||
| Random effects | Variance components | χ2 | p | Variance components | χ2 | p | Variance components | χ2 | p |
| τ00 | 0.007 | 409.931 | 0.003 | 0.009 | 398.005 | <0.001 | 0.008 | 377.630 | 0.001 |
| σ2 | 1.147 | 1.047 | 1.046 | ||||||
| Model I | Model II | Model III | |||||||
|---|---|---|---|---|---|---|---|---|---|
| Fixed Effect | γ Coefficient | S.E. | p | γ Coefficient | S.E. | p | γ Coefficient | S.E. | p |
| γ00 | 2.542 | 0.010 | <0.001 | 2.302 | 0.013 | <0.001 | 2.303 | 0.024 | <0.001 |
| Student-level variables | |||||||||
| Gender γ10 | 0.336 | 0.020 | <0.001 | 0.334 | 0.019 | <0.001 | |||
| Grade γ20 | −0.008 | 0.019 | 0.670 | −0.014 | 0.020 | 0.493 | |||
| Education type γ30 | −0.032 | 0.030 | 0.287 | −0.023 | 0.029 | 0.422 | |||
| Grade repetition γ40 | 0.125 | 0.049 | 0.011 | 0.125 | 0.042 | 0.003 | |||
| Truancy γ50 | 0.366 | 0.046 | <0.001 | 0.362 | 0.037 | <0.001 | |||
| Arriving late for class γ60 | 0.097 | 0.024 | <0.001 | 0.096 | 0.021 | <0.001 | |||
| ESCS γ70 | −0.014 | 0.010 | 0.177 | −0.012 | 0.011 | 0.257 | |||
| Teacher support γ80 | −0.180 | 0.016 | <0.001 | −0.177 | 0.016 | <0.001 | |||
| Parent support γ90 | −0.133 | 0.016 | <0.001 | −0.133 | 0.017 | <0.001 | |||
| School-level variables | |||||||||
| School location γ01 | 0.011 | 0.022 | 0.630 | ||||||
| School type γ02 | −0.023 | 0.032 | 0.459 | ||||||
| School size γ03 | <0.001 | <0.001 | 0.603 | ||||||
| Class size γ04 | 0.001 | 0.001 | 0.532 | ||||||
| Student–teacher ratio γ05 | −0.001 | 0.002 | 0.817 | ||||||
| Proportion of boys γ06 | −0.079 | 0.125 | 0.527 | ||||||
| Proportion of special needs students γ07 | <0.001 | 0.001 | 0.995 | ||||||
| Proportion of students without graduation certificates γ08 | −0.002 | 0.003 | 0.530 | ||||||
| Student behaviors that hinder learning γ09 | −0.001 | 0.004 | 0.753 | ||||||
| Teacher behaviors that hinder learning γ10 | 0.003 | 0.005 | 0.552 | ||||||
| School discipline atmosphere γ011 | −0.143 | 0.071 | 0.044 | ||||||
| Competitive atmosphere among students γ012 | 0.289 | 0.075 | <0.001 | ||||||
| Cooperative atmosphere among students γ013 | −0.068 | 0.065 | 0.300 | ||||||
| Random effects | Variance components | χ2 | p | Variance components | χ2 | p | Variance components | χ2 | p |
| τ00 | 0.005 | 387.921 | 0.020 | 0.004 | 336.412 | 0.091 | 0.004 | 317.490 | 0.128 |
| σ2 | 1.075 | 0.967 | 0.966 | ||||||
| Model I | Model II | Model III | |||||||
|---|---|---|---|---|---|---|---|---|---|
| Fixed Effect | γ Coefficient | S.E. | p | γ Coefficient | S.E. | p | γ Coefficient | S.E. | p |
| γ00 | 2.577 | 0.012 | <0.001 | 2.316 | 0.014 | <0.001 | 2.326 | 0.025 | <0.001 |
| Student-level variables | |||||||||
| Gender γ10 | 0.297 | 0.019 | <0.001 | 0.294 | 0.019 | <0.001 | |||
| Grade γ20 | −0.038 | 0.020 | 0.066 | −0.044 | 0.020 | 0.033 | |||
| Education type γ30 | 0.055 | 0.030 | 0.063 | 0.051 | 0.029 | 0.082 | |||
| Grade repetition γ40 | 0.140 | 0.051 | 0.006 | 0.138 | 0.042 | 0.001 | |||
| Truancy γ50 | 0.354 | 0.047 | <0.001 | 0.349 | 0.037 | <0.001 | |||
| Arriving late for class γ60 | 0.150 | 0.023 | <0.001 | 0.148 | 0.021 | <0.001 | |||
| ESCS γ70 | −0.042 | 0.010 | <0.001 | −0.038 | 0.010 | <0.001 | |||
| Teacher support γ80 | −0.188 | 0.017 | <0.001 | −0.185 | 0.017 | <0.001 | |||
| Parent support γ90 | −0.117 | 0.017 | <0.001 | −0.115 | 0.017 | <0.001 | |||
| School-level variables | |||||||||
| School location γ01 | −0.009 | 0.023 | 0.681 | ||||||
| School type γ02 | 0.013 | 0.033 | 0.681 | ||||||
| School size γ03 | <0.001 | <0.001 | 0.672 | ||||||
| Class size γ04 | <0.001 | 0.001 | 0.928 | ||||||
| Student–teacher ratio γ05 | <0.001 | 0.002 | 0.915 | ||||||
| Proportion of boys γ06 | −0.010 | 0.128 | 0.939 | ||||||
| Proportion of special needs students γ07 | 0.001 | 0.001 | 0.573 | ||||||
| Proportion of students without graduation certificates γ08 | −0.003 | 0.003 | 0.367 | ||||||
| Student behaviors that hinder learning γ09 | −0.003 | 0.004 | 0.434 | ||||||
| Teacher behaviors that hinder learning γ10 | 0.004 | 0.005 | 0.374 | ||||||
| School discipline atmosphere γ011 | −0.231 | 0.073 | 0.002 | ||||||
| Competitive atmosphere among students γ012 | 0.245 | 0.077 | 0.002 | ||||||
| Cooperative atmosphere among students γ013 | −0.076 | 0.067 | 0.259 | ||||||
| Random effects | Variance components | χ2 | p | Variance components | χ2 | p | Variance components | χ2 | p |
| τ00 | 0.013 | 470.758 | <0.001 | 0.008 | 305.321 | 0.452 | 0.007 | 285.981 | >0.500 |
| σ2 | 1.088 | 0.977 | 0.977 | ||||||
References
- Olweus, D. Bully/victim problems among schoolchildren: Long-term consequences and an effective intervention program. Prospects 1993, 26, 331–359. [Google Scholar] [CrossRef]
- Ruan, D.X. A Study on Influencing Factors of School Bullying: Based on Factor Analysis and Logistic Regression. Master’s Thesis, Hangzhou Normal University, Hangzhou, China, 2019. [Google Scholar]
- Eriksen, T.; Nielsen, H.; Simonsen, M. Bullying in elementary school. J. Hum. Resour. 2014, 49, 839–871. [Google Scholar] [CrossRef]
- Wang, J.; Li, C.M.; Xie, F.; Jiang, X.Q.; Deadmond, M.; Vieyra, G.; Dai, X.P.; Yang, W.; Yuan, Z.K. Influencing factors of school bullying among high school students in Jiangxi Province. Chin. Sch. Health 2018, 39, 1814–1817. [Google Scholar] [CrossRef]
- Huang, L. The situation and influencing factors of school bullying among 15-year-old students: Based on the analysis of data from four provinces and cities of China in PISA 2015. Educ. Sci. Res. 2017, 11, 36–42. [Google Scholar]
- Gottfredson, G.; Gottfredson, D.; Payne, A. School climate predictors of school disorder: Results from a national study of delinquency prevention in schools. J. Res. Crime Delinq. 2005, 42, 412–444. [Google Scholar] [CrossRef]
- Bowers, L.; Smith, P.P.; Binney, V. Cohesion and power in the families of involved in bully/victim problems at school. J. Fam. Ther. 2003, 14, 371–387. [Google Scholar] [CrossRef]
- Rigby, K.; Slee, P.P. Bullying among Australian school children: Reported behavior and attitudes toward victims. J. Soc. Psychol. 1991, 131, 615–627. [Google Scholar] [CrossRef]
- Smith, P.K.; Madsen, K.C.; Moody, J.C. What causes the age decline in reports of being bullied at school? Towards a developmental analysis of risks of being bullied. Educ. Res. 1999, 41, 267–285. [Google Scholar] [CrossRef]
- Fu, Q.; Land, K.C.; Lamb, V.L. Bullying victimization, socioeconomic status and behavioral characteristics of 12th graders in the United States, 1989 to 2009: Repetitive trends and persistent risk differentials. Child Indic. Res. 2013, 6, 1–21. [Google Scholar] [CrossRef]
- Hox, J.J.; Moerbeek, M.; Schoot, R. Multilevel Analysis: Techniques and Applications, 3rd ed.; Routledge: New York, NY, USA, 2017. [Google Scholar]
- Bryk, A.S.; Raudenbush, S. Hierarchical linear models: Applications and data analysis methods. Econ. Educ. Rev. 1992, 16, 348. [Google Scholar] [CrossRef]
- Kreft, I.G.G.; de Leeuw, J.; Aiken, L.S. The effect of different forms of centering in Hierarchical Linear Models. Multivar. Behav. Res. 1995, 30, 1–21. [Google Scholar] [CrossRef] [PubMed]
- Barboza, G.E.; Schiamberg, L.B.; Oehmke, J.; Korzeniewski, S.J.; Post, L.A.; Heraux, C.G. Individual characteristics and the multiple contexts of adolescent bullying: An ecological perspective. J. Youth Adolesc. 2009, 38, 101–121. [Google Scholar] [CrossRef] [PubMed]
- Österman, K.; Björkqvist, K.; Lagerspetz, K.M.J.; Kaukiainen, A.; Landau, S.F.; Frączek, A.; Caprara, G.V. Cross-cultural evidence of female indirect aggression. Aggress. Behav. 1998, 24, 1–8. [Google Scholar] [CrossRef]
- OECD. PISA 2015 Results (Volume III): Students’ Well-Being; PISA, OECD Publishing: Paris, France, 2017. [Google Scholar]
- Peets, K.; Kikas, E. Aggressive strategies and victimization during adolescence: Grade and gender differences, and cross-informant agreement. Aggress. Behav. 2006, 32, 68–79. [Google Scholar] [CrossRef]
- Gao, L.R. The current situation and influencing factors of school bullying among middle school students in China: A comparative study of Mainland China, Hong Kong and Macau. China Youth Stud. 2020, 10, 65–72. [Google Scholar] [CrossRef]
- Crothers, L.M.; Schreiber, J.B.; Schmitt, A.J.; Bell, G.R.; Blasik, J.; Comstock, L.A.; Greisler, M.J.; Keener, D.; King, J.M.; Lipinski, J. A preliminary study of bully and victim behavior in old-for-grade students: Another potential hidden cost of grade retention or delayed school entry. J. Appl. Sch. Psychol. 2010, 26, 327–338. [Google Scholar] [CrossRef]
- Fang, J.H. Psychoanalysis and corrective strategies of students’ absenteeism. Educ. Sci. Res. 2007, 23, 4. [Google Scholar] [CrossRef]
- Schwartz, D.; Farver, J.M.; Chang, L.; Lee-Shin, Y. Victimization in South Korean children’s peer groups. J. Abnorm. Child Psychol. 2002, 30, 113–125. [Google Scholar] [CrossRef] [PubMed]
- Gastic, B. School truancy and the disciplinary problems of bullying victims. Educ. Rev. 2008, 60, 391–404. [Google Scholar] [CrossRef]
- Huang, L.; Zhao, D.C. Current situation, consequences and coping strategies of middle school bullying: A study based on data from four Chinese provinces or cities and OECD countries. Mod. Educ. Manag. 2018, 12, 102–106. [Google Scholar] [CrossRef]
- Jansen, P.W.; Verlinden, M.; Berkel, A.D.-V.; Mieloo, C.; van der Ende, J.; Veenstra, R.; Verhulst, F.C.; Jansen, W.; Tiemeier, H. Prevalence of bullying and victimization among children in early elementary school: Do family and school neighbourhood socioeconomic status matter? BMC Public Health 2012, 12, 494. [Google Scholar] [CrossRef] [Green Version]
- Rivara, F.; Le Menestrel, S. Preventing Bullying through Science, Policy, and Practice; The National Academies Press: Washington, DC, USA, 2016. [Google Scholar]
- Konishi, C.; Hymel, S.; Zumbo, B.D.; Li, Z. Do school bullying and student-teacher relationships matter for academic achievement? A multilevel analysis. Can. J. Sch. Psychol. 2010, 25, 19–39. [Google Scholar] [CrossRef]
- Gregory, A.; Cornell, D.; Fan, X.; Sheras, P.; Shih, T.-H.; Huang, F. Authoritative school discipline: High school practices associated with lower bullying and victimization. J. Educ. Psychol. 2010, 102, 483–496. [Google Scholar] [CrossRef]
- Cornell, D.; Huang, F. Authoritative school climate and high school student risk behavior: A cross-sectional multi-level analysis of student self-reports. J. Youth Adolesc. 2016, 45, 2246–2259. [Google Scholar] [CrossRef]
- Koth, C.W.; Bradshaw, C.P.; Leaf, P.J. A multilevel study of predictors of student perceptions of school climate: The effect of classroom-level aactors. J. Educ. Psychol. 2008, 100, 96–104. [Google Scholar] [CrossRef] [Green Version]
- Volk, A.A.; Cioppa, V.D.; Earle, M. Social competition and bullying: An adaptive socioecological perspective. In Evolutionary Perspectives on Social Psychology; Springer International Publishing: New York, NY, USA, 2015. [Google Scholar]
- Wang, S.J. A Study on the Relationship between Perceived Academic Competition, Social Competition, Moral Disengagement and School Bullying among Primary and Secondary School Students. Master’s Thesis, Qingdao University, Qingdao, China, 2020. [Google Scholar]
- Wang, H. Research on the Influence of School Culture on Campus Bullying. Master’s Thesis, Sichuan Normal University, Chengdu, China, 2018. [Google Scholar]
- Huang, L.; Gao, W. How serious is the impact of school spirit on Chinese students’ learning?—Based on the analysis of teacher-student behavior data in four provinces and cities in China PISA 2015. Prim. Second. Sch. Manag. 2017, 10, 3. [Google Scholar] [CrossRef]
- Feng, B.; Li, X. Review of research on school bullying in China in the past ten years. Shanghai Educ. Res. 2017, 4, 6. [Google Scholar]
- Chen, I.H. An empirical study on the relationship between school bullying prevention and middle school students’ core competencies. J. Sichuan Norm. Univ. Soc. Sci. Ed. 2019, 46, 85–95. [Google Scholar]
- Kreft, I.; Kreft, I. Are Multilevel Techniques Necessary? An Overview, Including Simulation Studies; California State University: Los Angeles, CA, USA, 2005. [Google Scholar]
- Hox, J.J. Multilevel Modeling: When and Why. In Classification, Data Analysis, and Data Highways; Balderjahn, I., Mathar, R., Eds.; Springer: Berlin, Germany, 1998. [Google Scholar]
- Hox, J.J.; De Leeuw, E.D. Multilevel Models for Meta-Analysis. In Multilevel Modeling; Psychology Press: London, UK, 2003; pp. 87–104. [Google Scholar]
- Zohar, D. A group-level model of safety climate: Testing the effect of group climate on microaccidents in manufacturing jobs. J. Appl. Psychol. 2000, 85, 587–596. [Google Scholar] [CrossRef]
- Hu, Y.M.; Li, J.Z. Who is being bullied? A study on the influencing factors of school bullying among middle school students. J. Cap. Norm. Univ. Soc. Sci. Ed. 2018, 6, 171–185. [Google Scholar]
- Straub, D.; Boudreau, M.-C.; Gefen, D. Validation guidelines for IS positivist research. Commun. Assoc. Inf. Syst. 2004, 13, 380–427. [Google Scholar] [CrossRef]
- Petter, B.S.; Straub, D.W.; Rai, A. Specifying formative constructs in information systems research. MIS Q 2007, 31, 623. [Google Scholar] [CrossRef] [Green Version]
- Carney, A.; Merrell, K. Bullying in schools: Perspectives on understanding and preventing an international problem. Sch. Psychol. Int. 2001, 22, 364–382. [Google Scholar] [CrossRef]
- Li, C.L. Prestige stratification in contemporary Chinese society: Measurement of occupational prestige and socioeconomic status index. Sociol. Res. 2015, 2, 30. [Google Scholar]
- Hair, J.F.; Black, W.C.; Babin, B.J.; Adnerson, R.E. Multivariate Data Analysis, 6th ed.; Pearson Prentice Hall: Hoboken, NJ, USA, 2006. [Google Scholar]

| Variable Name | Minimum | Maximum | Average | S.E. |
|---|---|---|---|---|
| Student-level variables | ||||
| School bullying | 6.000 | 24.000 | 7.610 | 2.776 |
| Relational bullying | 2.000 | 8.000 | 2.494 | 1.077 |
| Verbal bullying | 2.000 | 8.000 | 2.542 | 1.038 |
| Physical bullying | 2.000 | 8.000 | 2.579 | 1.051 |
| Gender (female, male) | 0 | 1.000 | 0.521 1 | 0.500 |
| Grade | 7.000 | 12.000 | 9.640 | 0.549 |
| Education type (general education, vocational education) | 0 | 1.000 | 0.181 | 0.385 |
| Grade repetition (no, yes) | 0 | 1.000 | 0.063 1 | 0.242 |
| Truancy (no, yes) | 0 | 1.000 | 0.075 | 0.264 |
| Arriving late for class (no, yes) | 0 | 1.000 | 0.302 | 0.459 |
| Economic, social, and cultural status (ESCS) | −5.077 | 3.102 | −0.359 | 1.089 |
| Teacher support | 1.000 | 4.000 | 3.393 | 0.693 |
| Parent support | 1.000 | 4.000 | 3.330 | 0.643 |
| School-level variables | ||||
| School location (town schools, city schools) | 0 | 1.000 | 0.630 | 0.485 |
| School type (public school, private school) | 0 | 1.000 | 0.140 1 | 0.345 |
| School size | 78.000 | 13,400.000 | 1926.920 | 1461.488 |
| Class size | 18.000 | 53.000 | 38.760 | 8.003 |
| Student–teacher ratio | 1.000 | 100.000 | 10.755 | 6.261 |
| Proportion of boys | 0.100 | 0.890 | 0.522 | 0.084 |
| Proportion of special needs students | 0 | 107.000 | 7.686 | 11.094 |
| Proportion of students without graduation certificates | 0 | 42 | 1.230 | 3.709 |
| Student behaviors that hinder learning | 5.000 | 20.000 | 11.332 | 5.085 |
| Teacher behaviors that hinder learning | 5.000 | 20.000 | 11.320 | 4.429 |
| School discipline atmosphere | 2.900 | 3.830 | 3.411 | 0.166 |
| Competitive atmosphere among students | 2.240 | 3.010 | 2.566 | 0.146 |
| Cooperative atmosphere among students | 2.330 | 3.520 | 2.848 | 0.176 |
| Model I | Model II | Model III | |||||||
|---|---|---|---|---|---|---|---|---|---|
| Fixed Effect | γ Coefficient | S.E. | p | γ Coefficient | S.E. | p | γ Coefficient | S.E. | p |
| γ00 | 7.610 | 0.030 | <0.001 | 6.928 | 0.035 | <0.001 | 6.962 | 0.064 | <0.001 |
| Student-level variables | |||||||||
| Gender γ10 | 0.851 | 0.052 | <0.001 | 0.842 | 0.050 | <0.001 | |||
| Grade γ20 | −0.071 | 0.035 | 0.180 | −0.089 | 0.054 | 0.099 | |||
| Education type γ30 | 0.028 | 0.080 | 0.730 | 0.033 | 0.077 | 0.667 | |||
| Grade repetition γ40 | 0.390 | 0.127 | 0.003 | 0.387 | 0.111 | 0.001 | |||
| Truancy γ50 | 1.151 | 0.128 | <0.001 | 1.138 | 0.097 | <0.001 | |||
| Arriving late for class γ60 | 0.331 | 0.063 | <0.001 | 0.324 | 0.056 | <0.001 | |||
| ESCS γ70 | −0.066 | 0.027 | 0.015 | −0.056 | 0.027 | 0.041 | |||
| Teacher support γ80 | −0.562 | 0.044 | <0.001 | −0.554 | 0.044 | <0.001 | |||
| Parent support γ90 | −0.391 | 0.043 | <0.001 | −0.388 | 0.044 | <0.001 | |||
| School-level variables | |||||||||
| School location γ01 | −0.008 | 0.060 | 0.891 | ||||||
| School type γ02 | −0.051 | 0.086 | 0.552 | ||||||
| School size γ03 | <0.001 | <0.001 | 0.813 | ||||||
| Class size γ04 | 0.002 | 0.004 | 0.582 | ||||||
| Student–teacher ratio γ05 | −0.001 | 0.006 | 0.901 | ||||||
| Proportion of boys γ06 | −0.178 | 0.337 | 0.598 | ||||||
| Proportion of special needs students γ07 | <0.001 | 0.003 | 0.980 | ||||||
| Proportion of students without graduation certificates γ08 | −0.007 | 0.008 | 0.355 | ||||||
| Student behaviors that hinder learning γ09 | <0.001 | 0.011 | 0.975 | ||||||
| Teacher behaviors that hinder learning γ10 | 0.002 | 0.013 | 0.865 | ||||||
| School discipline atmosphere γ011 | −0.572 | 0.192 | 0.004 | ||||||
| Competitive atmosphere among students γ012 | 0.806 | 0.201 | <0.001 | ||||||
| Cooperative atmosphere among students γ013 | −0.218 | 0.177 | 0.220 | ||||||
| Random effects | Variance components | χ2 | p | Variance components | χ2 | p | Variance components | χ2 | p |
| τ00 | 0.071 | 444.065 | <0.001 | 0.051 | 363.704 | 0.010 | 0.047 | 339.720 | 0.023 |
| σ2 | 7.632 | 6.739 | 6.729 | ||||||
Disclaimer/Publisher’s Note: The statements, opinions and data contained in all publications are solely those of the individual author(s) and contributor(s) and not of MDPI and/or the editor(s). MDPI and/or the editor(s) disclaim responsibility for any injury to people or property resulting from any ideas, methods, instructions or products referred to in the content. |
© 2023 by the authors. Licensee MDPI, Basel, Switzerland. This article is an open access article distributed under the terms and conditions of the Creative Commons Attribution (CC BY) license (https://creativecommons.org/licenses/by/4.0/).
Share and Cite
Wang, Y.-J.; Chen, I.-H. A Multilevel Analysis of Factors Influencing School Bullying in 15-Year-Old Students. Children 2023, 10, 653. https://doi.org/10.3390/children10040653
Wang Y-J, Chen I-H. A Multilevel Analysis of Factors Influencing School Bullying in 15-Year-Old Students. Children. 2023; 10(4):653. https://doi.org/10.3390/children10040653
Chicago/Turabian StyleWang, Yu-Jiao, and I-Hua Chen. 2023. "A Multilevel Analysis of Factors Influencing School Bullying in 15-Year-Old Students" Children 10, no. 4: 653. https://doi.org/10.3390/children10040653
APA StyleWang, Y.-J., & Chen, I.-H. (2023). A Multilevel Analysis of Factors Influencing School Bullying in 15-Year-Old Students. Children, 10(4), 653. https://doi.org/10.3390/children10040653