Abstract
We investigated the association between obesity and cardiovascular disease risk factors (CVDRFs) in adolescents. We performed a cross-sectional study using the data from 8149 adolescents, aged 10–18 years, included in the Korean National Health and Nutrition Examination Survey (2011–2020). Using the body mass index, we defined “overweight” (≥85th to <95th percentile) and “obese” (≥95th percentile). We analyzed the associations between obesity and CVDRFs (high blood pressure, abnormal lipid profiles, and high fasting glucose levels) by sex and age groups (early [10–12 years], middle [13–15 years], and late [16–18 years] adolescence). When analyzing all the subjects, being overweight was correlated with high blood pressure and abnormal all-lipid profiles in boys and high triglyceride and low high-density lipoprotein cholesterol levels in girls, while obesity was associated with all CVDRFs in both boys and girls. Analyzing separately in the age subgroups, the correlation between obesity and CVDRFs tended to be shown earlier in boys than in girls, and obesity tended to be associated with CVDRFs earlier than being overweight. The association between obesity and CVDRFs may begin to be shown at different periods of youth, depending on the degree of obesity, CVDRF variables, and sex.
1. Introduction
Recently, obesity in children and adolescents has become a significant global health issue [1]. The prevalence of obesity among children and adolescents has increased over the past several decades globally [2,3,4]. On the basis of developing evidence, it is apparent that adiposity in children and adolescents increases the likelihood of becoming obese as adults and is connected to a higher risk of cardiovascular morbidity and mortality, including stroke, congestive heart failure, ischemic heart disease, and cardiovascular death in adulthood [5,6,7,8,9]. Additionally, many studies have reported that children and adolescents with obesity had a higher prevalence of cardiovascular disease risk factors (CVDRFs) such as high blood pressure, abnormal lipid profiles, and high fasting glucose than normal weight children and adolescents of the same age group [10,11,12,13,14,15].
However, little is known about the precise age at which the relationship between obesity and CVDRFs begins. In order to identify the onset age of this relationship, longitudinal studies on young children are required but have been scarcely performed. Instead of longitudinal studies, there have been a few studies which could infer the age pattern of the relationship between obesity and CVDRFs by analyzing the nationwide-scale cross-sectional data even though they have some shortcomings. A population-based study by Lambert et al. revealed an association between weight status and CVDRFs by age groups without considering sex difference [16]. In a study using the National Health and Nutrition Examination Survey conducted by Skinner et al., the relationship between the degree of obesity and CVDRFs by age groups was investigated without comparison with a normal weight control group [17].
In the present study, we investigated the association between obesity and CVDRFs in Korean adolescents using the nationally representative data in order to identify the period at which this association begin to be shown with consideration of CVDRF variables, degree of obesity, and sex.
2. Materials and Methods
2.1. Study Population
The Korean National Health and Nutrition Examination Survey (KNHANES) is a nationwide cross-sectional survey with a stratified and multi-stage clustered sampling design that comprises a health interview, a nutritional survey, and a health examination including anthropometric and laboratory data. The Korean Centers for Disease Control and Prevention (KCDC) approved the KNHANES and collected data after obtaining written informed consent from all participants. A detailed description of KNHANES has been published elsewhere [18].
This study included KNHANES participants from 2011 to 2020 who were 10–18 years of age at the time of the survey and examination. The participants who had congenital heart disease, renal failure, or diabetes mellitus were excluded. A total of 8149 adolescents (4314 boys and 3835 girls) were included in the present study. We classified the participants into three age groups: early adolescence (10–12 years of age), middle adolescence (13–15 years of age), and late adolescence (16–18 years of age).
2.2. Assessments of Dietary Intake and Phisical Activity
In an in-person interview, dietary intake was measured using a food intake questionnaire with a 24-hour dietary recall approach. The formula used to calculate the energy and macronutrient intakes from the food the participant had consumed the day before was as follows: total energy/nutrient intake = intake frequency x food intake amount x energy/nutritent by food item. Daily intake of energy, protein, fat, carbohydrate, and sodium were computed. The physical activity was evaluated using the International Physical Activity Questionnaire (IPAQ) [19]. We estimated weekly physical acitivity time for walking, moderate exercise, and vigorous exercise (hour/week).
2.3. Anthropometric and Laboratory Measurements
Anthropometric measurements were performed by trained examiners. Height was measured using a stadiometer (Seca 225 in 2011 to June 2019, Seca 274 in July 2019 to 2020; Seca, Hamburg, Germany) in 0.1 cm increments. Weight was measured using an electronic balance (GL-6000-20; G-tech, Seoul, Korea) in 0.1 kg increments. Body mass index (BMI) was computed as weight (kg) divided by height squared (m2). The BMI z-scores adjusted for age and sex were calculated based on the KCDC reference data [20]. Blood pressure was measured on the right arm with the participants in a sitting position and at rest for at least 5 min, using a mercury sphygmomanometer in 2011–2019 (Baumanometer Desk Model 0320 in 2011–2012, Baumanometer Wall unit 33(0850) in 2013–2019; W.A. Baum, Copiague, NY, USA) or a mercury-free electronic sphygmomanometer in 2020 (Greenlight 300; Accoson, Ayrshire, UK). Three measures were obtained from all participants using an appropriately sized cuff and the average values of the second and third systolic blood pressure (SBP) and diastolic blood pressure (DBP) were reported.
Blood samples were obtained in the morning after an overnight fast and analyzed in a national central laboratory. The serum levels of total cholesterol, triglyceride (TG), high-density lipoprotein cholesterol (HDL-C), and glucose were measured using Hitachi Automatic Analyzer 7600 (Hitachi, Tokyo, Japan) in 2011–2012, Hitachi Automatic Analyzer 7600-210 (Hitachi, Tokyo, Japan) in 2013–2018, and Labospect 008AS (Hitachi, Tokyo, Japan) in 2019–2020. The low-density lipoprotein cholesterol (LDL-C) levels were calculated by Friedewald’s equation if the TG levels were <400 mg/dL [21].
2.4. Definition of Obesity and CVDRFs
The participants were classified into 3 groups based on BMI percentile for adjusting age and sex: normal weight, overweight, and obesity. Overweight and obesity were defined as a BMI of ≥85th to <95th percentile and of ≥95th percentile, respectively. Parental obesity was defined as a BMI of ≥30 kg/m2. High SBP and DBP were defined as SBP and DBP of ≥95th percentile, adjusted for age, sex, and height, for participants aged < 16 years, and SBP of ≥140 mmHg and DBP of ≥90 mmHg for participants aged 16–18 years, respectively, using blood pressure reference data for Korean children and adolescents [20]. Parental hypertension was diagnosed when SBP was ≥140 mmHg and/or DBP was ≥90 mmHg, or they were taking antihypertensive medication. The serum levels of total cholesterol ≥ 200 mg/dL, TG ≥ 130 mg/dL, HDL-C < 40 mg/dL, LDL-C ≥ 130 mg/dL, and fasting glucose ≥ 100 mg/dL were assigned as abnormal according to the pediatric guideline for cardiovascular health [22]. Parental diabetes mellitus was diagnosed when hemoglobin A1c was ≥6.5%, or fasting glucose was ≥126 mg/dL, or the subject was taking diabetic medication or insulin therapy.
2.5. Statistical Analyses
Sample weights were used for the analyses because of a stratified and multi-stage clustered sampling design of KNHANES. The sample weights are determined using a combination of probability of selection, nonresponse adjustment, and post-stratification adjustment methods to guarantee that survey data from KNHANES appropriately reflect the target population. Categorical variables were expressed as weighted percentages with standard errors and continuous variables were presented as weighted means with standard errors. We assessed normality of the variables using the Kolmogorov–Smirnov and Shapiro–Wilk tests. We used the analysis of covariance with the least significant difference test to compare age-adjusted mean values of BMI, lipid profiles, fasting glucose, and age- and height-adjusted mean values of blood pressure between boys and girls and between participants with normal weight, overweight, and obesity. We estimated the multivariable-adjusted prevalence of CVDRFs by logistic regression analysis using R statistical programming language. The data were analyzed separately for each sex because sex is known to influence the relationship between obesity and CVDRFs [17,23,24]. The associations of BMI z-score with age-adjusted lipid levels, fasting glucose levels, and age- and height-adjusted blood pressure values were analyzed via multiple linear regression analysis. Logistic regression analysis was used to estimate the age-adjusted odds ratios (ORs) with 95% confidence intervals (CIs) for associations between obesity and CVDRFs for each sex. In addition, to assume the age at which these relationships were shown, the same analyses were conducted in three age groups for each sex: early (10–12 years); middle (13–15 years); and late (16–18 years) adolescence. Statistical analyses were assessed using IBM SPSS Statistics version 20.0 (IBM Corp, Armonk, NY, USA) with integration plug-in for R. The version of R used in this study was 2.12.1. Statistical significance was set at p value < 0.05.
3. Results
3.1. Study Population
The characteristic of 8149 adolescents (4314 boys and 3835 girls) are shown in Table 1. All the variables were normally distributed (p values for all the variables in Kolmogorov–Smirnov and Shapiro–Wilk tests were > 0.05). The mean values for BMI were higher in boys than girls. The mean values of SBP, DBP, and fasting glucose were higher in boys than girls, whereas the mean levels of total cholesterol, TG, HDL–C, and LDL–C were higher in girls than in boys. The prevalence of high SBP, high DBP, low HDL–C, and high fasting glucose levels was higher in boys than in girls, whereas the prevalence of high total cholesterol and high LDL–C levels was higher in girls than in boys.

Table 1.
Study population.
3.2. Association of BMI z-Score with CVDRFs
BMI z-score had a significant linear correlation with SBP, DBP, total cholesterol, TG, HDL-C, LDL-C, and fasting glucose levels in both boys and girls (Table 2).
Table 2.
Association between BMI z-score and CVDRFs.
3.3. Factors Affecting CVDRFs: Dietary Intake, Physcal Activity, and Parental CVDRFs
There were no significant differences in dietary intake or physical activity between the normal weight, overweight, and obesity groups in boys (Table 3). Significant differences in dietary intake were not observed between the normal weight, overweight, or obesity groups in girls either. Among physical activity, moderate- and vigorous-exercise times, but not walking time, were shorter in the overweight and obesity groups than in the normal weight group in girls.
Table 3.
Comparison of dietary intake, physical activity, and parental CVDRFs by weight status.
The prevalences of all parental CVDRFs (paternal obesity, paternal hypertension, paternal diabetes mellitus, maternal obesity, maternal hypertension, and maternal diabetes mellitus) were higher in the obesity group than in the normal weight group, both in boys and girls. The prevalences of father with hypertension in boys, and father with hypertension, father with obesity, and mother with obesity in girls were higher in the overweight group than in the normal weight group.
3.4. Comparison of CVDRFs by Weight Status
The mean values of systolic and diastolic blood pressure were higher in boys and girls with overweight and obesity than those with normal weight (Table 4). Both boys and girls with overweight and obesity had higher mean total cholesterol, TG, LDL-C, and fasting glucose levels, as well as lower mean HDL-C levels, than those with normal weight.
Table 4.
Comparison of blood pressure, lipid profiles, and fasting glucose by weight status for each sex.
There was a higher prevalence of high blood pressure and adverse levels of total cholesterol, TG, HDL-C, and LDL-C in boys with overweight and obesity than boys with normal weight (Table 5). Boys with normal weight and those with overweight did not vary in the prevalence of high fasting glucose levels. There was a higher prevalence of high blood pressure as well as adverse levels of total cholesterol, TG, HDL-C, LDL-C, and fasting glucose in girls with obesity than in girls with normal weight. Girls with normal weight and those with overweight did not vary in the prevalence of high SBP and DBP, high LDL-C and high total cholesterol and fasting glucose levels.
Table 5.
Prevalence of CVDRFs by age, sex, and weight status adjusted for dietary intake, physical activity, and parental CVDRFs.
3.5. ORs for CVDRFs by Weight Status
The age-adjusted ORs for CVDRF by sex and weight status are shown in Figure 1. Boys and girls with obesity had increased odds of all CVDRFs. Boys with overweight had increased odds of high blood pressure and adverse lipid levels, whereas girls with overweight had increased odds of adverse TG and HDL-C levels.
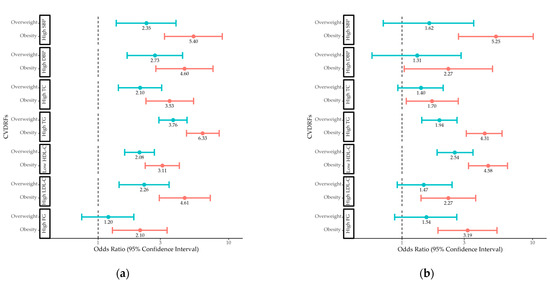
Figure 1.
Odds ratios for CVDRFs in (a) boys and (b) girls with overweight and obesity compared to those with normal weight. CVDRF, cardiovascular disease risk factor; SBP, systolic blood pressure; DBP, diastolic blood pressure; TC, total cholesterol; TG, triglyceride; HDL-C, high-density lipoprotein cholesterol; LDL-C, low-density lipoprotein cholesterol; FG, fasting glucose.
3.6. ORs for CVDRFs by Weight Status in Different Age Groups
Boys who were overweight or obese had increased odds of high SBP and adverse TG and HDL-C levels in early, middle, and late adolescence, as well as increased odds of total cholesterol levels in middle and late adolescence (Figure 2). High DBP and high LDL-C levels in boys were associated with obesity in early, middle, and late adolescence, while they were associated with overweight in middle and late adolescence. High fasting glucose levels in boys were linked to obesity in middle and late adolescence, but they were not linked to adolescent overweight.
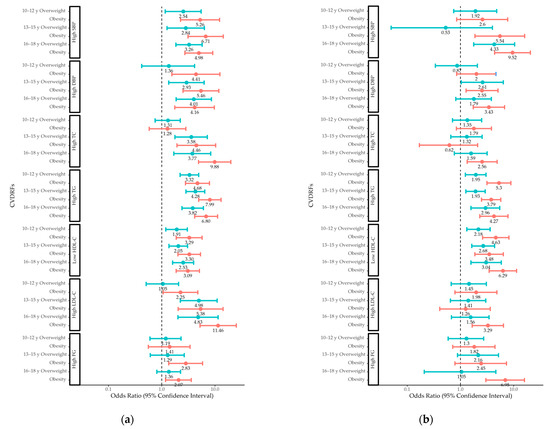
Figure 2.
Odds ratios for CVDRFs in (a) boys and (b) girls with overweight and obesity compared to those with normal weight in different age groups. CVDRF, cardiovascular disease risk factor; SBP, systolic blood pressure; DBP, diastolic blood pressure; TC, total cholesterol; TG, triglyceride; HDL-C, high-density lipoprotein cholesterol; LDL-C, low-density lipoprotein cholesterol; FG, fasting glucose.
Girls who were overweight or obese had increased odds of adverse TG and HDL-C levels in early, middle, and late adolescence. Obesity in girls was associated with high SBP and DBP in middle and late adolescence, while being overweight in girls was associated with high SBP in late adolescence and high DBP in middle adolescence. High total cholesterol, high LDL-C, and high fasting glucose levels in girls were linked to obesity in late adolescence, but they were not linked to being overweight.
4. Discussion
In the present study, we investigated the association between adolescent obesity and CVDRFs. Compared to normal weight adolescents, adolescents with obesity had an association with every CVDRF, and overweight adolescents exhibited an association with some of them as well. The timing of the association between weight status and each CVDRF varied according to weight status variable, CVDRF variable, and sex. Among CVDRFs, high TG and low HDL-C levels were linked to being overweight and obese in both boys and girls from early to late adolescence. Other CVDRFs, such as high SBP and DBP, high total cholesterol and LDL-C levels, and high fasting glucose levels, are likely to present earlier in boys than girls and in adolescents with obesity than in adolescents with overweight.
Previous research has found a link between childhood obesity and high blood pressure, which was confirmed in this study [13,16,23,25]. In a study conducted by Lambert et al., both boys and girls with obesity had at least three times the odds of borderline or unfavorable SBP compared to those with normal weight (OR 3.1 [95% CI 2.1–5.2] and 4.7 [95% CI 2.9–7.7], respectively) [16]. In a 5-year cohort study of 1267 adolescents conducted by Dasgupta et al., high SBP was associated with a BMI of ≥ 85th in both boys and girls (OR 3.04 [1.80–5.13] and 2.25 [1.27–4.00], respectively) [25]. The present study also found that the association between being overweight/obese and hypertension develops earlier in boys than in girls. These findings might be explained by sex differences in lifestyle behaviors. High systolic blood pressure in teenagers was influenced by both increases in sedentary behavior and decreases in physical activity, even when overweight and obesity themselves were considered [25]. In a cross-sectional study of adolescents with severe obesity, boys were more likely to spend more time watching screens and had similar levels of physical activity to girls [26]. Differences in the distribution of excess fat across the sexes may also affect how soon a relationship between weight status and hypertension occurs. Visceral fat played an important role in adiposity-related hypertension in both adults and children [27,28,29]. During and after puberty, boys typically accumulated more visceral fat, whereas girls typically accumulate more total body fat and subcutaneous fat [30].
The present study demonstrated an association between obesity and dyslipidemia in male and female adolescents. It was consistent with previous studies, but there were some disparities in lipid variables based on the sex and weight status variables [11,13,16,17,31,32]. Freedman et al. demonstrated that children aged 5 to 17 years with a BMI of ≥95th percentile had greater odds of all adverse lipid levels compared to children with normal weight (OR 2.4 [95% CI 2.0–3.0], 7.1 [95% CI 5.8–8.6], 3.4 [95% CI 2.8–4.2], and 3.0 [95% CI 2.4–3.6] of adverse total cholesterol, TG, HDL-C, and LDL-C levels, respectively) [11]. Skinner et al. demonstrated that obesity was associated with all adverse total cholesterol, TG, and HDL-C levels (OR 2.4, 3.8, and 6.0, respectively), and overweight was associated with low HDL-C levels (OR 3.3) in children aged 6 to 17 years old [14]. In a Canadian population-based study conducted by Lambert et al, obesity was associated with borderline or unfavorable total cholesterol, TG, HDL-C, and LDL-C levels in boys (OR 2.3 [1.5–3.7], 16.1 [6.5–40.0], 3.0 [1.8–5.1], and 2.5 [1.6–3.9], respectively) and borderline or unfavorable TG and HDL-C levels in girls (OR 3.9 [1.5–10.2] and 3.6 [1.9–6.9], respectively) [16]. The mechanism underlying sex differences in the obesity/dyslipidemia relationship was not fully understood. These differences could be attributed to sex differences in the accumulation of visceral adipose tissue during puberty [30]. According to an adult study conducted by Lemieux et al., adjustment of abdominal visceral fat area removed the differences for TG and apolipoprotein level between men and women [33]. Dietary intake and sex hormone disparity also could be related to sex difference in the obesity/dyslipidemia relationship. In a study of the Australian National Nutrition Survey, McNaughton et al. reported male adolescents were more likely to have high fat and sugar dietary patterns than female adolescents [34]. In a longitudinal observational study, Morrison et al. showed a rise in free testosterone was associated adverse lipid levels in male adolescents [35].
High fasting glucose levels were linked to obesity but not to being overweight in adolescents: these links emerged earlier in boys than in girls. These findings were accordance with previous studies showing a greater prevalence of prediabetes and type 2 diabetes in children and adolescents with obesity [16,36,37,38]. In a study based on NHANES, Li et al. demonstrated adolescents with severe obesity had a higher likelihood of having high FG than normal weight adolescents, but neither moderately obese nor overweight adolescents did (OR 2.68 [95% CI 1.81–3.99], 1.49 [95% CI 0.93–2.37] and 1.19 [95% CI 0.83–1.71] in adolescents with severe obesity, moderate obesity, and overweight) [13]. In a study of 2144 Danish children and adolescents, Kloppenborg et al. demonstrated participants of a BMI ≥ 90 percentile have higher prevalence of impaired fasting glucose (≥100 mg/dL) than normal weight participants (14.3% vs. 4.5%) [39]. Impaired fasting glucose is one of diagnostic criteria for prediabetes and closely related to changes in β cell glucose sensitivity and liver insulin sensitivity [40,41]. Adipose tissue releasing nonesterified fatty acids and other mediators cause pancreatic β cell dysfunction and insulin resistance, which leads to prediabetes and diabetes mellitus [42,43].
The findings of the present study demonstrated that adolescent obesity was associated with all CVDRFs, with some CVDRF variables showing this association as early as 10–12 years old. These results emphasize the significance of early detection of obesity, and physicians can use routine weight status assessments as a method to identify teenagers who are at a higher risk of developing CVDRFs. In addition, the present study revealed that the associations between obesity and CVDRFs were shown to appear at different ages, depending on the degree of obesity, sex, and CVDRF variable. When considering limited medical resources and costly and labor-intensive obesity treatments for adolescent obesity, identifying the age at which obesity begins to show an association with certain CVDRFs can help efficiently screen and manage CVDRFs as well as prevent future cardiovascular disease.
This study had several limitations. First, because this was not a longitudinal cohort study, we were unable to demonstrate a causal relationship between obesity and CVDRFs and follow the relationship between obesity and CVDRFs in adulthood. Thus, this study only suggests the specific period of age when the relationship between obesity and CVDRFs was observed. Second, because this study only included youths from 10 to 18 years of age, we could not identify the trend of the relationship between being overweight/obese and CVDRFs before 10 years of age. A longitudinal cohort study including participants under the age of 10 years is required to identify the exact timing of when the relationship between obesity and CVDRFs begins.
5. Conclusions
Overweight and obesity are associated with CVDRFs in Korean adolescents. The associations between obesity and CVDRFs have been observed at different periods of youth, depending on the degree of obesity, CVDRF variables, and sex. Identification of when these associations are observed may allow for screening and management of CVDRFs as well as prevention of future cardiovascular disease.
Author Contributions
Conceptualization, Y.H.S.; methodology, Y.H.S.; formal analysis, Y.H.S.; Investigation, Y.H.S.; writing—original draft preparation, J.L., S.G.C. and Y.H.S.; writing—review and editing, J.L., J.S.L., S.T.K., S.G.C. and Y.H.S.; visualization, J.L. and S.G.C.; supervision, Y.H.S. All authors have read and agreed to the published version of the manuscript.
Funding
This research received no external funding.
Institutional Review Board Statement
The study was conducted in accordance with the Declaration of Helsinki and was exempted from deliberation by Institutional Review Board of Seoul National University Bundang Hospital (IRB No. X-1604-344-901), 15 April 2016, due to the anonymity and public availability of the KNHANES data.
Informed Consent Statement
Patient consent was waived because the study used previously collected deidentified national data stored in KNHANES.
Data Availability Statement
Data supporting reported results can be found via publicly available datasets (https://knhanes.kdca.go.kr/knhanes/sub03/sub03_02_05.do).
Acknowledgments
The authors thank Division of Statistics in Medical Research Collaborating Center at Seoul National University Bundang Hospital for statistical analyses.
Conflicts of Interest
The authors declare no conflict of interest.
References
- Lobstein, T.; Jackson-Leach, R.; Moodie, M.L.; Hall, K.D.; Gortmaker, S.L.; Swinburn, B.A.; James, W.P.; Wang, Y.; McPherson, K. Child and adolescent obesity: Part of a bigger picture. Lancet 2015, 385, 2510–2520. [Google Scholar] [CrossRef] [PubMed]
- NCD Risk Factor Collaboration (NCD-RisC). Worldwide trends in body-mass index, underweight, overweight, and obesity from 1975 to 2016: A pooled analysis of 2416 population-based measurement studies in 128.9 million children, adolescents, and adults. Lancet 2017, 390, 2627–2642. [Google Scholar] [CrossRef] [PubMed]
- Ha, K.H.; Kim, D.J. Epidemiology of Childhood Obesity in Korea. Endocrinol. Metab. 2016, 31, 510–518. [Google Scholar] [CrossRef] [PubMed]
- Skinner, A.C.; Ravanbakht, S.N.; Skelton, J.A.; Perrin, E.M.; Armstrong, S.C. Prevalence of Obesity and Severe Obesity in US Children, 1999–2016. Pediatrics 2018, 141, e20173459. [Google Scholar] [CrossRef]
- Ajala, O.; Mold, F.; Boughton, C.; Cooke, D.; Whyte, M. Childhood predictors of cardiovascular disease in adulthood. A systematic review and meta-analysis. Obes. Rev. 2017, 18, 1061–1070. [Google Scholar] [CrossRef]
- Franks, P.W.; Hanson, R.L.; Knowler, W.C.; Sievers, M.L.; Bennett, P.H.; Looker, H.C. Childhood obesity, other cardiovascular risk factors, and premature death. N. Engl. J. Med. 2010, 362, 485–493. [Google Scholar] [CrossRef]
- Freedman, D.S.; Khan, L.K.; Serdula, M.K.; Dietz, W.H.; Srinivasan, S.R.; Berenson, G.S. The relation of childhood BMI to adult adiposity: The Bogalusa Heart Study. Pediatrics 2005, 115, 22–27. [Google Scholar] [CrossRef] [PubMed]
- Horesh, A.; Tsur, A.M.; Bardugo, A.; Twig, G. Adolescent and Childhood Obesity and Excess Morbidity and Mortality in Young Adulthood-a Systematic Review. Curr. Obes. Rep. 2021, 10, 301–310. [Google Scholar] [CrossRef]
- Sommer, A.; Twig, G. The Impact of Childhood and Adolescent Obesity on Cardiovascular Risk in Adulthood: A Systematic Review. Curr. Diab. Rep. 2018, 18, 91. [Google Scholar] [CrossRef]
- Calcaterra, V.; Klersy, C.; Muratori, T.; Telli, S.; Caramagna, C.; Scaglia, F.; Cisternino, M.; Larizza, D. Prevalence of metabolic syndrome (MS) in children and adolescents with varying degrees of obesity. Clin. Endocrinol. 2008, 68, 868–872. [Google Scholar] [CrossRef]
- Freedman, D.S.; Dietz, W.H.; Srinivasan, S.R.; Berenson, G.S. The relation of overweight to cardiovascular risk factors among children and adolescents: The Bogalusa Heart Study. Pediatrics 1999, 103, 1175–1182. [Google Scholar] [CrossRef] [PubMed]
- Freedman, D.S.; Mei, Z.; Srinivasan, S.R.; Berenson, G.S.; Dietz, W.H. Cardiovascular risk factors and excess adiposity among overweight children and adolescents: The Bogalusa Heart Study. J. Pediatr. 2007, 150, 12–17 e12. [Google Scholar] [CrossRef]
- Li, L.; Perez, A.; Wu, L.T.; Ranjit, N.; Brown, H.S.; Kelder, S.H. Cardiometabolic Risk Factors among Severely Obese Children and Adolescents in the United States, 1999–2012. Child. Obes. 2016, 12, 12–19. [Google Scholar] [CrossRef]
- Skinner, A.C.; Mayer, M.L.; Flower, K.; Weinberger, M. Health status and health care expenditures in a nationally representative sample: How do overweight and healthy-weight children compare? Pediatrics 2008, 121, e269–e277. [Google Scholar] [CrossRef] [PubMed]
- Weiss, R.; Dziura, J.; Burgert, T.S.; Tamborlane, W.V.; Taksali, S.E.; Yeckel, C.W.; Allen, K.; Lopes, M.; Savoye, M.; Morrison, J.; et al. Obesity and the metabolic syndrome in children and adolescents. N. Engl. J. Med. 2004, 350, 2362–2374. [Google Scholar] [CrossRef]
- Lambert, M.; Delvin, E.E.; Levy, E.; O’Loughlin, J.; Paradis, G.; Barnett, T.; McGrath, J.J. Prevalence of cardiometabolic risk factors by weight status in a population-based sample of Quebec children and adolescents. Can. J. Cardiol. 2008, 24, 575–583. [Google Scholar] [CrossRef]
- Skinner, A.C.; Perrin, E.M.; Moss, L.A.; Skelton, J.A. Cardiometabolic Risks and Severity of Obesity in Children and Young Adults. N. Engl. J. Med. 2015, 373, 1307–1317. [Google Scholar] [CrossRef]
- Kweon, S.; Kim, Y.; Jang, M.J.; Kim, Y.; Kim, K.; Choi, S.; Chun, C.; Khang, Y.H.; Oh, K. Data resource profile: The Korea National Health and Nutrition Examination Survey (KNHANES). Int. J. Epidemiol. 2014, 43, 69–77. [Google Scholar] [CrossRef] [PubMed]
- Craig, C.L.; Marshall, A.L.; Sjostrom, M.; Bauman, A.E.; Booth, M.L.; Ainsworth, B.E.; Pratt, M.; Ekelund, U.; Yngve, A.; Sallis, J.F.; et al. International physical activity questionnaire: 12-country reliability and validity. Med. Sci. Sport. Exerc. 2003, 35, 1381–1395. [Google Scholar] [CrossRef]
- Kim, J.H.; Yun, S.; Hwang, S.S.; Shim, J.O.; Chae, H.W.; Lee, Y.J.; Lee, J.H.; Kim, S.C.; Lim, D.; Yang, S.W.; et al. The 2017 Korean National Growth Charts for children and adolescents: Development, improvement, and prospects. Korean J. Pediatr. 2018, 61, 135–149. [Google Scholar] [CrossRef]
- Friedewald, W.T.; Levy, R.I.; Fredrickson, D.S. Estimation of the concentration of low-density lipoprotein cholesterol in plasma, without use of the preparative ultracentrifuge. Clin. Chem. 1972, 18, 499–502. [Google Scholar] [CrossRef] [PubMed]
- Expert Panel on Integrated Guidelines for Cardiovascular Health and Risk Reduction in Children and Adolescents; National Heart, Lung, and Blood Institute. Expert panel on integrated guidelines for cardiovascular health and risk reduction in children and adolescents: Summary report. Pediatrics 2011, 128 (Suppl. 5), S213–S256. [CrossRef]
- Machluf, Y.; Fink, D.; Farkash, R.; Rotkopf, R.; Pirogovsky, A.; Tal, O.; Shohat, T.; Weisz, G.; Ringler, E.; Dagan, D.; et al. Adolescent BMI at Northern Israel: From Trends, to Associated Variables and Comorbidities, and to Medical Signatures. Medicine 2016, 95, e3022. [Google Scholar] [CrossRef] [PubMed]
- Sinaiko, A.R.; Jacobs, D.R., Jr.; Steinberger, J.; Moran, A.; Luepker, R.; Rocchini, A.P.; Prineas, R.J. Insulin resistance syndrome in childhood: Associations of the euglycemic insulin clamp and fasting insulin with fatness and other risk factors. J. Pediatr. 2001, 139, 700–707. [Google Scholar] [CrossRef]
- Dasgupta, K.; O’Loughlin, J.; Chen, S.; Karp, I.; Paradis, G.; Tremblay, J.; Hamet, P.; Pilote, L. Emergence of sex differences in prevalence of high systolic blood pressure: Analysis of a longitudinal adolescent cohort. Circulation 2006, 114, 2663–2670. [Google Scholar] [CrossRef]
- Barstad, L.H.; Juliusson, P.B.; Johnson, L.K.; Hertel, J.K.; Lekhal, S.; Hjelmesaeth, J. Gender-related differences in cardiometabolic risk factors and lifestyle behaviors in treatment-seeking adolescents with severe obesity. BMC Pediatr. 2018, 18, 61. [Google Scholar] [CrossRef]
- Jansen, M.A.; Uiterwaal, C.S.; Visseren, F.L.; van der Ent, C.K.; Grobbee, D.E.; Dalmeijer, G.W. Abdominal fat and blood pressure in healthy young children. J. Hypertens. 2016, 34, 1796–1803. [Google Scholar] [CrossRef]
- Malden, D.; Lacey, B.; Emberson, J.; Karpe, F.; Allen, N.; Bennett, D.; Lewington, S. Body Fat Distribution and Systolic Blood Pressure in 10,000 Adults with Whole-Body Imaging: UK Biobank and Oxford BioBank. Obesity 2019, 27, 1200–1206. [Google Scholar] [CrossRef]
- Pausova, Z.; Mahboubi, A.; Abrahamowicz, M.; Leonard, G.T.; Perron, M.; Richer, L.; Veillette, S.; Gaudet, D.; Paus, T. Sex differences in the contributions of visceral and total body fat to blood pressure in adolescence. Hypertension 2012, 59, 572–579. [Google Scholar] [CrossRef]
- Staiano, A.E.; Katzmarzyk, P.T. Ethnic and sex differences in body fat and visceral and subcutaneous adiposity in children and adolescents. Int. J. Obes. 2012, 36, 1261–1269. [Google Scholar] [CrossRef]
- Isasi, C.R.; Parrinello, C.M.; Ayala, G.X.; Delamater, A.M.; Perreira, K.M.; Daviglus, M.L.; Elder, J.P.; Marchante, A.N.; Bangdiwala, S.I.; Van Horn, L.; et al. Sex Differences in Cardiometabolic Risk Factors among Hispanic/Latino Youth. J. Pediatr. 2016, 176, 121–127 e121. [Google Scholar] [CrossRef]
- Kim, M.; Kim, J. Cardiometabolic risk factors and metabolic syndrome based on severity of obesity in Korean children and adolescents: Data from the Korea National Health and Nutrition Examination Survey 2007–2018. Ann. Pediatr. Endocrinol. Metab. 2022, 27, 289–299. [Google Scholar] [CrossRef] [PubMed]
- Lemieux, S.; Despres, J.P.; Moorjani, S.; Nadeau, A.; Theriault, G.; Prud’homme, D.; Tremblay, A.; Bouchard, C.; Lupien, P.J. Are gender differences in cardiovascular disease risk factors explained by the level of visceral adipose tissue? Diabetologia 1994, 37, 757–764. [Google Scholar] [CrossRef]
- McNaughton, S.A.; Ball, K.; Mishra, G.D.; Crawford, D.A. Dietary patterns of adolescents and risk of obesity and hypertension. J. Nutr. 2008, 138, 364–370. [Google Scholar] [CrossRef] [PubMed]
- Morrison, J.A.; Barton, B.A.; Biro, F.M.; Sprecher, D.L. Sex hormones and the changes in adolescent male lipids: Longitudinal studies in a biracial cohort. J. Pediatr. 2003, 142, 637–642. [Google Scholar] [CrossRef]
- He, Q.X.; Zhao, L.; Tong, J.S.; Liang, X.Y.; Li, R.N.; Zhang, P.; Liang, X.H. The impact of obesity epidemic on type 2 diabetes in children and adolescents: A systematic review and meta-analysis. Prim. Care Diabetes 2022, 16, 736–744. [Google Scholar] [CrossRef]
- Pedicelli, S.; Fintini, D.; Rava, L.; Inzaghi, E.; Deodati, A.; Spreghini, M.R.; Bizzarri, C.; Mariani, M.; Cianfarani, S.; Cappa, M.; et al. Prevalence of prediabetes in children and adolescents by class of obesity. Pediatr. Obes. 2022, 17, e12900. [Google Scholar] [CrossRef] [PubMed]
- Sinha, R.; Fisch, G.; Teague, B.; Tamborlane, W.V.; Banyas, B.; Allen, K.; Savoye, M.; Rieger, V.; Taksali, S.; Barbetta, G.; et al. Prevalence of impaired glucose tolerance among children and adolescents with marked obesity. N. Engl. J. Med. 2002, 346, 802–810. [Google Scholar] [CrossRef]
- Kloppenborg, J.T.; Fonvig, C.E.; Nielsen, T.R.H.; Mollerup, P.M.; Bojsoe, C.; Pedersen, O.; Johannesen, J.; Hansen, T.; Holm, J.C. Impaired fasting glucose and the metabolic profile in Danish children and adolescents with normal weight, overweight, or obesity. Pediatr. Diabetes 2018, 19, 356–365. [Google Scholar] [CrossRef] [PubMed]
- Cali, A.M.; Bonadonna, R.C.; Trombetta, M.; Weiss, R.; Caprio, S. Metabolic abnormalities underlying the different prediabetic phenotypes in obese adolescents. J. Clin. Endocrinol. Metab. 2008, 93, 1767–1773. [Google Scholar] [CrossRef]
- ElSayed, N.A.; Aleppo, G.; Aroda, V.R.; Bannuru, R.R.; Brown, F.M.; Bruemmer, D.; Collins, B.S.; Hilliard, M.E.; Isaacs, D.; Johnson, E.L.; et al. 2. Classification and Diagnosis of Diabetes: Standards of Care in Diabetes-2023. Diabetes Care 2023, 46, S19–S40. [Google Scholar] [CrossRef] [PubMed]
- Abbasi, A.; Juszczyk, D.; van Jaarsveld, C.H.M.; Gulliford, M.C. Body Mass Index and Incident Type 1 and Type 2 Diabetes in Children and Young Adults: A Retrospective Cohort Study. J. Endocr. Soc. 2017, 1, 524–537. [Google Scholar] [CrossRef] [PubMed]
- Kahn, S.E.; Hull, R.L.; Utzschneider, K.M. Mechanisms linking obesity to insulin resistance and type 2 diabetes. Nature 2006, 444, 840–846. [Google Scholar] [CrossRef] [PubMed]
Disclaimer/Publisher’s Note: The statements, opinions and data contained in all publications are solely those of the individual author(s) and contributor(s) and not of MDPI and/or the editor(s). MDPI and/or the editor(s) disclaim responsibility for any injury to people or property resulting from any ideas, methods, instructions or products referred to in the content. |
© 2023 by the authors. Licensee MDPI, Basel, Switzerland. This article is an open access article distributed under the terms and conditions of the Creative Commons Attribution (CC BY) license (https://creativecommons.org/licenses/by/4.0/).