Article

Examining Language, Speech and Behaviour Characteristics: A Cross-Sectional Study in Saudi Arabia Using the Arabic Version of Gilliam Autism Rating Scale-Third Edition

1
Department of English Language and Literature, College of Arts of Letters, University of Bisha, Bisha 67714, Saudi Arabia
2
Department of Human Sciences (Psychology), University of Verona, 37129 Verona, Italy
3
Department of English Language and Translation, College of Science and Theoretical Studies, Saudi Electronic University, Riyadh 11673, Saudi Arabia
4
Speech Pathology Division, Jeddah Institute for Speech and Hearing and Medical Rehabilitation, Jeddah 21471, Saudi Arabia
*
Author to whom correspondence should be addressed.
Children 2024, 11(4), 472; https://doi.org/10.3390/children11040472
Submission received: 16 February 2024 / Revised: 9 April 2024 / Accepted: 10 April 2024 / Published: 15 April 2024
(This article belongs to the Special Issue Developmental and Behavioral Pediatrics - Volume II)

Abstract

:
Autism spectrum disorder (ASD) exhibits diverse manifestations influenced by demographic factors. This study evaluates these variations within Saudi Arabia, aiming to investigate language, speech and behaviour characteristics across different demographics in Saudi Arabia using the Arabic Version of the Gilliam Autism Rating Scale—Third Edition (A-GARS-3). Employing a cross-sectional design, 178 participants were stratified by developmental status (n = 124 school settings, n = 54 clinical setting), sex (Females = 77, Males =101), age (range = 3–22), and geographical region (different provinces in Saudi Arabia). The A-GARS-3 measured ASD manifestations across six subscales. The study identified significant differences in ASD manifestations by developmental status, with higher ASD likelihood and severity in clinical settings. Younger children showed more pronounced ASD characteristics, and males were slightly more likely to be diagnosed with ASD. Geographical analysis revealed regional differences in severity. The findings underline the importance of demographic considerations in ASD assessment and diagnosis, suggesting the need for age-specific and culturally sensitive approaches. The A-GARS-3 is a reliable tool for the Saudi context. Regional disparities in ASD prevalence and severity indicate a need for tailored health policies and resources across Saudi provinces.

1. Introduction

1.1. An Overview of Autism Spectrum Disorder

Autism spectrum disorder (ASD) is a complex developmental condition marked by substantial obstacles in social interaction and communication, coupled with a repertoire of repetitive and restricted behaviors. The World Health Organization’s International Classification of Diseases, Eleventh Revision (ICD-11), delineates ASD as encompassing enduring difficulties in social reciprocity and communicative skills, as well as rigid behavioral patterns that deviate from the normative expectations of the individual’s age and cultural background [1]. Manifesting primarily during the developmental phase, typically in early childhood, ASD can engender functional impairments across several domains. Parallel to the ICD-11, the American Psychiatric Association’s Diagnostic and Statistical Manual of Mental Disorders: DSM-5-TR, enumerates similar diagnostic criteria, including persistent challenges in social communication and interaction across diverse settings, along with restricted and repetitive behavior patterns [2]. Both diagnostic manuals acknowledge the spectrum nature of ASD, with the DSM-5-TR noting the necessity for symptoms to emerge in the early developmental stages and the ICD-11 highlighting gender disparities in diagnosis rates, with a higher prevalence in males. These diagnostic standards are instrumental in the prompt identification of ASD, which is crucial for initiating early interventions and providing support for the affected individuals and their families [1,2].

1.2. Impact on Families and Heterogeneity of ASD

Further, the impact of an ASD diagnosis on family quality of life is profound and multifaceted. Families navigating the early stages of an ASD diagnosis often face considerable stress, which can strain family dynamics and emotional well-being. The study highlights how parental stress, particularly in relation to the core symptoms of ASD, negatively correlates with the family’s quality of life. This stress can manifest in various ways, affecting the mental health of family members, their relationships, and even their financial stability, as they may need to address the specialized needs of the individual with ASD, including therapy, education, and medical care [3].
The recognition of ASD’s heterogeneity has been widely regarded as an accurate reflection of the disorder’s diverse manifestations [4]. This diversity underscores the fundamental principle that a plethora of internal and external variables interact to create the distinct profiles observed within the ASD spectrum. Such complexity has not inhibited substantial advancements in this field. On the contrary, the critical need for increased awareness, comprehensive screening, and early intervention is a recurrent theme in the literature, driving significant progress in the field [5,6,7,8,9]. Research has consistently demonstrated that early detection can profoundly reduce distress, preserve cognitive function, and enhance the quality of life and independence for individuals with ASD who engage in intervention programs. Furthermore, an ASD diagnosis has a deep and multifaceted impact on family quality of life. Families confronting an ASD diagnosis often encounter significant stress, which can disrupt family dynamics and emotional health. A recent study by Papadopoulos et al. highlights the negative correlation between parental stress, especially in relation to ASD’s core symptoms, and the family’s quality of life [3]. This stress can affect various aspects, including the mental health of family members, their interpersonal relationships, and economic security, as they may incur additional expenses for specialized care, including therapy, educational support, and medical treatments.
Despite ASD’s acknowledged heterogeneity, a central theme persists across the spectrum: deficits in social interaction and communication, along with a limited propensity to engage in play or activities [10]. The manifestations of these core features of ASD are highly variable, reflecting the diverse factors at play and the disorder’s presentation at different life stages. For analytical purposes, we may discuss these characteristics separately; however, they typically intermingle in real-life scenarios without clear demarcation. The Centers for Disease Control and Prevention (CDC) notes that ASD can be identified in children as young as 12 to 14 months, with early signs including avoidance of eye contact, lack of response to their names by 9 months, disinterest in interactive games by 12 months, and absence of pointing to objects of interest by 18 months [11]. By 24 months, children with ASD may not recognize others’ emotions, by 36 months they may not play with peers, and by 60 months may show no interest in role-playing or imaginative activities. Repetitive behaviors, such as echolalia, insistence on sameness, hand-flapping, or spinning, are also common. Often, children with ASD exhibit delays in language, motor skills, or learning, and may experience anxiety, and unusual sleep and eating habits [11].
The majority of ASD research has traditionally focused on young children and the early developmental stages, with a particular emphasis on the importance of early detection and intervention for improving life outcomes for those diagnosed [12]. Nevertheless, Schall and Todd McDonough point out the relative scarcity of research on adolescents and adults with ASD, which is noteworthy given that ASD is recognized as a lifelong condition [13]. They suggest that the wide range of heterogeneity observed in children with ASD further diversifies in later stages, potentially due to access to adequate professional and social support. Furthermore, they note that while autistic traits are often more pronounced at a younger age, ASD is a neurodevelopmental condition distinguished by significant challenges in social interaction, communication skills, and a tendency for restricted and repetitive behaviors [13]. The World Health Organization, through its International Classification of Diseases, Eleventh Revision (ICD-11), characterizes ASD by enduring impairments in social communication and interaction, coupled with rigid behavior patterns that are incongruent with the individual’s developmental stage and cultural context [1]. Emerging typically during early childhood, ASD can lead to considerable dysfunction across multiple life areas. The Diagnostic and Statistical Manual of Mental Disorders, Fifth Edition, Text Revision (DSM-5-TR) by the American Psychiatric Association provides parallel diagnostic criteria, specifying that these impairments must be present across various contexts and feature prominently in the individual’s early developmental phase [2]. Both the ICD-11 and the DSM-5-TR acknowledge that ASD manifests with considerable variability, with the DSM-5-TR particularly noting the requirement for early developmental onset of symptoms and the ICD-11 acknowledging differences in cultural presentation and a higher diagnostic prevalence in males. The establishment of these diagnostic frameworks plays a pivotal role in the early detection of ASD, which is crucial for timely intervention and support for affected individuals and their families [1,2].

1.3. Factors Influencing the Presentation and Management of ASD

The presentation and management of ASD are influenced by several key factors, including age, sex, developmental status, and geographical location. Early detection of ASD, critical for effective intervention, can manifest through developmental markers as early as 12 to 14 months, although symptom presentation and needs evolve throughout the lifespan [11,13]. Sex differences are evident, with higher rates of diagnosis in males, potentially due to both biological differences and diagnostic biases, whereas females may be underdiagnosed due to subtler symptoms [14]. Co-occurring psychiatric conditions can complicate the ASD profile, influencing both diagnosis and intervention approaches [15]. Additionally, geographical disparities impact the prevalence, recognition, and resources available for ASD, with variations in cultural perceptions and healthcare infrastructure affecting how ASD is managed across different regions [16]. These factors highlight the necessity for a personalized approach in the treatment and support of individuals with ASD.

1.4. Purpose of the Present Study

The aim of this study is to conduct a targeted evaluation of ASD manifestations within a Saudi Arabian context, focusing on a modest cohort of 178 participants to identify potential demographic variations. The objectives include: (1) assessing the relationship between developmental status, sex, age groups, and geographic locations within Saudi Arabia and ASD symptomatology; and (2) determining the prevalence and severity of ASD symptoms within these demographic subgroups using the Arabic Version of the A-GARS-3. By adopting a cross-sectional study design, this research intends to provide a detailed understanding of how ASD presents in a Saudi Arabian context. The study’s refined scope, considering the limited sample size, will contribute to the larger discourse on culturally responsive diagnostic practices and inform more targeted health policies and resource allocation within Saudi Arabia’s diverse communities.

2. Method

2.1. Sample

In this cross-sectional study assessing the utility of an Arabic adaptation of the A-GARS-3 within Saudi Arabia, the demographic distribution of participants highlighted a dichotomous sample composition across educational and clinical settings (See Table 1). Of the 178 randomly sampled individuals, 124 were ascertained from school environments, encapsulating 69.66% of the total, while the remaining 30.34% (n = 54) were derived from clinical contexts. The age demographics indicated a preponderance of younger participants in the clinical setting, particularly within the ‘3–5’ age bracket, which constituted 51.85% as compared to 22.58% in the school setting. A stark gender disparity was observed, with the clinical cohort comprising a male majority at 68.52%. Geographical representation was notably disproportionate, with the Asir province predominantly represented in schools (72.58%), and Mecca province preponderant in clinical settings (92.59%). Exceptionality status was exclusively reported in clinical settings, with speech and language delay being the most prevalent at 50%. The participant pool was homogeneously Arab, speaking the Saudi dialect of Arabic, which ensures cultural and linguistic consistency with the adapted assessment tool.

2.2. Instrument: The Translation Process

The GARS-3 is an established and widely recognized instrument designed for the evaluation and diagnostic assessment of ASD within individuals aged 3 to 22 years [17]. This tool is constructed to reflect the diagnostic criteria outlined in the DSM-5, and it incorporates a tripartite scale system—consisting of subscales for social interaction, social communication, and restricted/repetitive behaviours—thus encapsulating the core characteristics associated with ASD. In the English version of GARS-3, the consistency and reliability of these subscales have undergone rigorous empirical validation, as seen in the scholarly critique and subsequent affirmative recognition of their internal consistency and inter-rater reliability. Such endorsement is mirrored in studies that have critically examined the construct and diagnostic validity of the GARS-3, with research underscoring its utility in both clinical and research populations, revealing the scale’s methodological robustness and its nuanced diagnostic capacity within the realm of ASD. The reported reliability for the original scale is 0.94 for the Autism Index 4 and 0.93 for the Autism Index 6, and the range of Cronbach value for the subscales is between 0.79 and 90 [17].
Conversely, the A-GARS-3 has been meticulously tailored to address the linguistic and cultural nuances inherent within the Arab-speaking demographic. The adaptation process began with a direct translation, followed by a comprehensive review by a panel of experts in linguistics, translation, and speech–language pathology. This was succeeded by a back-translation protocol to ensure semantic equivalence with the English version. The A-GARS-3 was then subjected to a pilot study to evaluate its practical application and effectiveness. The translation retained the original instrument’s six subscales, which were directly transposed to assess ASD-related behaviours in a culturally congruent manner. The A-GARS-3’s translation integrity and cultural relevance were paramount, with careful considerations made regarding idiomatic expressions and societal norms characteristic of the Saudi Arabian context, ensuring the tool’s resonance with the target population [17].
The psychometric properties of the A-GARS-3 have been substantiated through a comprehensive cross-sectional study that confirms its reliability and validity for use in Arabic-speaking regions [18]. The instrument demonstrated a high internal consistency, with Cronbach’s alpha and McDonald’s omega coefficients exceeding the threshold for excellent reliability. The instrument’s construct validity was affirmed through exploratory and confirmatory factor analyses, indicating a coherent underlying structure consistent with the original GARS-3’s theoretical constructs. Predictive validity was evidenced by significant correlations between the Autism Index—a composite score derived from the subscale scores—and each subscale, especially those measuring social interaction and communication. The rigorous validation process of the A-GARS-3, including factorial and statistical analysis, ensures that the scale is a robust and reliable tool for diagnosing ASD within the cultural framework of Arab societies, promising enhanced screening, diagnosis, and subsequent intervention strategies tailored to this specific linguistic and cultural context. The scale exhibits excellent internal consistency, with Cronbach’s alpha and McDonald’s omega both indicating very high reliability (α = 0.971; ω = 0.972). The range Cronbach value for the six subscales was reported in our analysis between 0.77 and 0.88 [18].
The GARS-3 is structured with six subscales that intricately map onto the multifaceted nature of ASD, providing a comprehensive framework for assessment (See Table 2). The first subscale, assessing restricted and repetitive behaviours, captures the proclivity for uniformity and repetition that is often a hallmark of ASD. The second and third subscales delve into social interaction and social communication, respectively, gauging the individual’s ability to engage with others and the competence in using and interpreting both verbal and nonverbal forms of communication. Emotional responses, the fourth subscale, scrutinize the affective aspects, including the range and appropriateness of emotional reactions, which can be atypical in ASD. Cognitive style, the fifth subscale, evaluates distinctive patterns of thinking and processing, such as a preference for detail-focused and concrete thinking. Lastly, the maladaptive speech subscale inspects aspects of language use that are considered aberrant, such as echolalia or pronoun reversal. Each subscale consists of specific items designed to capture the essence of these domains, thereby enabling the GARS-3 to provide a detailed profile of autistic traits as they manifest in a given individual.

2.3. Design

The study employs a cross-sectional design to evaluate the presentation of ASD symptoms within the Saudi Arabian context, utilizing a specific sample of 178 participants to explore demographic differences. The research aims to: (1) examine the associations between developmental status, sex, age, and geographic location within Saudi Arabia and the expression of ASD symptoms; and (2) measure the prevalence and intensity of ASD symptoms across these demographic categories using the Arabic Version of the Autism Spectrum Rating Scales (A-GARS-3). This design provides a concise and current picture of ASD in Saudi Arabia, despite the relatively small sample size. The findings are expected to enhance understanding of ASD within this cultural setting and contribute to the development of culturally sensitive diagnostic procedures. The results will also assist in shaping health policies and directing resources effectively within Saudi Arabia’s varied communities.

2.4. Procedures

The integrity of the study’s procedures was rigorously maintained to ensure the reliability and validity of the data collection process. Throughout the research, informed consents were obtained from all participants within school and clinical settings to adhere to ethical standards and maintain the autonomy of the participants involved. In the educational context, both parents and teachers were provided with comprehensive training on how to use the Autism A-GARS-3. This extensive training included detailed explanations of each item on the scale, the importance of objective observation, and practical sessions to practice scoring. The training sought to equip them with the skills necessary to accurately observe and record the behaviours and characteristics of the participants consistent with the scale’s guidelines. This meticulous preparation was designed to ensure that when parents and teachers completed the A-GARS-3, their assessments would be carried out with a high degree of consistency and precision, accurately reflecting the observed behaviours of the children.
In contrast, within the clinical environment, the administration of the A-GARS-3 was entrusted to trained clinicians and speech–language pathologists who possessed specialized knowledge and experience in working with the clinical population. Their professional expertise allowed for a nuanced and sensitive approach to engaging with participants and carrying out the assessment, which was particularly important for accurately capturing the complex clinical profiles of individuals with ASD. The clinical evaluations were conducted with individuals who had previously been diagnosed with ASD, a fact that is documented in detail in Table 1 of the study. This dual approach, utilising both educational and clinical professionals, was designed to validate the use of A-GARS-3 across different settings and ensure that the tool was administered in a way that was both culturally sensitive and appropriate to the Saudi Arabian context.
The A-GARS-3 was operationalized via Google Forms, an approach that not only streamlined the collection process but also bolstered the integrity and confidentiality of the data. Participants’ responses were submitted online, directly integrating into the research team’s database, thereby minimizing the potential for data-entry errors and ensuring real-time capture of the responses. This digital transformation of the scale facilitated a seamless and efficient data aggregation process, integral to the large-scale deployment of the instrument.
Ethical considerations were paramount in the study’s design and execution. Prior to the commencement of the data collection, informed consent forms elucidated the research’s objectives, the voluntary nature of participation, and the measures in place to ensure anonymity and confidentiality. These forms were disseminated and retrieved, ensuring that participants and their guardians were fully informed and consented to the involvement in the study. The implementation of anonymity and confidentiality protocols served to protect participant identity and the sensitivity of the information provided, adhering to ethical research standards and fostering a foundation of trust between the researchers and participants. Above all, an institutional review board (IRB) approval was obtained from the Department of English Language and Literature, University of Bisha, Saudi Arabia.
The subsequent data analysis phase commenced with a rigorous data cleaning process, a critical step to ensure the validity and reliability of the findings. The data, initially collected in Arabic, were translated into English to accommodate the diverse linguistic capabilities of the research team and to ensure the data’s accessibility for analysis. Following translation, the data were transitioned from Excel to Jamovi (version 2.3.26.0), a statistical software that supports both descriptive and inferential statistical analyses. This transfer was conducted with precision, ensuring that data integrity was maintained across platforms. Within Jamovi, a range of statistical tests were performed, encompassing both descriptive statistics to capture the sample’s characteristics and inferential statistics to explore the relationships between variables and to test hypotheses. The application of these analyses provided a robust statistical foundation for the study’s conclusions, aligning with the overarching research objectives and advancing the field’s understanding of the scale’s utility within the target population.

3. Results

The initial phase of statistical examination involved creating survey plots for key variables such as developmental status, age group, and gender in relation to ASD. These plots took into account the likelihood of ASD, the nature of support needed, and the degree of ASD severity as classified by the Diagnostic and Statistical Manual of Mental Disorders, Fifth Edition (DSM-5) [19].

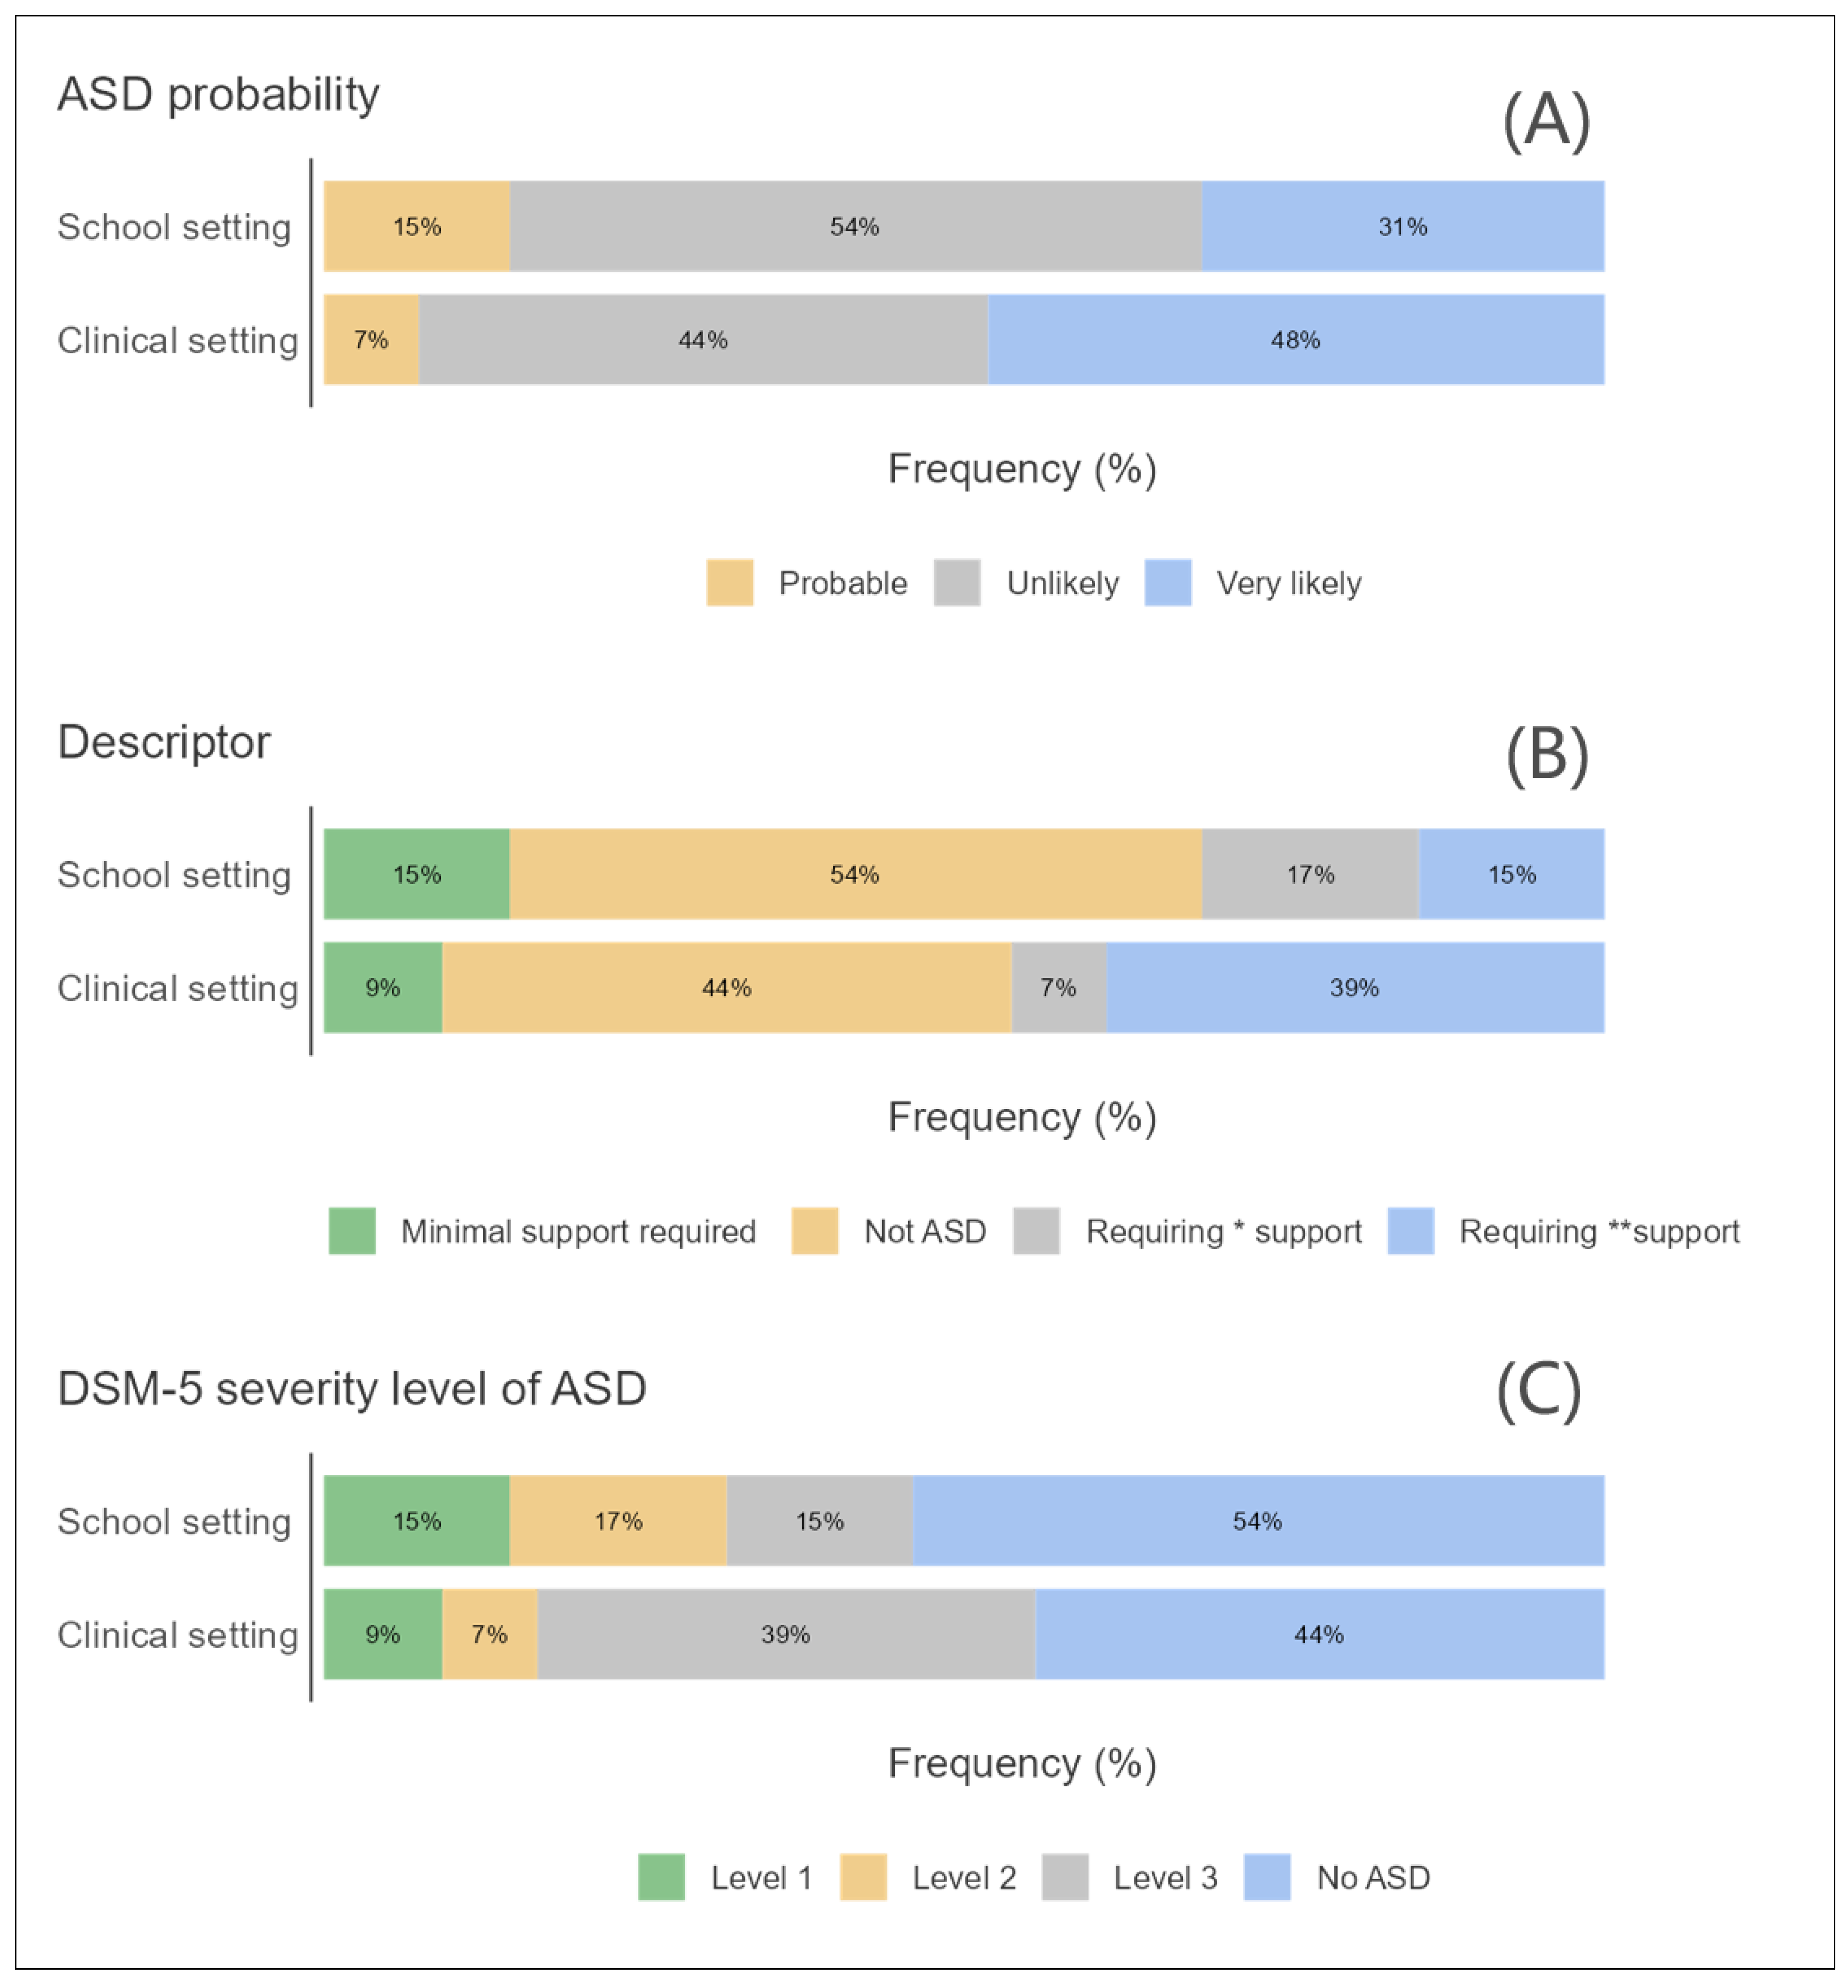
3.1. ASD and Developmental Status

Figure 1A–C shows the ASD and developmental status based on three factors: the probability of ASD in three levels, the possibility of required support using four descriptors, and the ASD severity level in three levels. It should be noted that these are based on the original GARS-2 version. Figure 1A suggests that ASD is more likely to be diagnosed in a clinical setting than in a school setting. It also suggests that ASD is more likely to be “very likely” in a clinical setting than in a school setting. Figure 1B suggests that students who are referred to a clinical setting are more likely to require substantial or very substantial support compared to students in a school setting. Figure 1C suggests that individuals diagnosed with ASD in a clinical setting are more likely to fall into the Level 3 (most severe) category compared to those diagnosed in a school setting. Conversely, individuals diagnosed in a school setting are more likely to fall into the “No ASD” category compared to those diagnosed in a clinical setting.

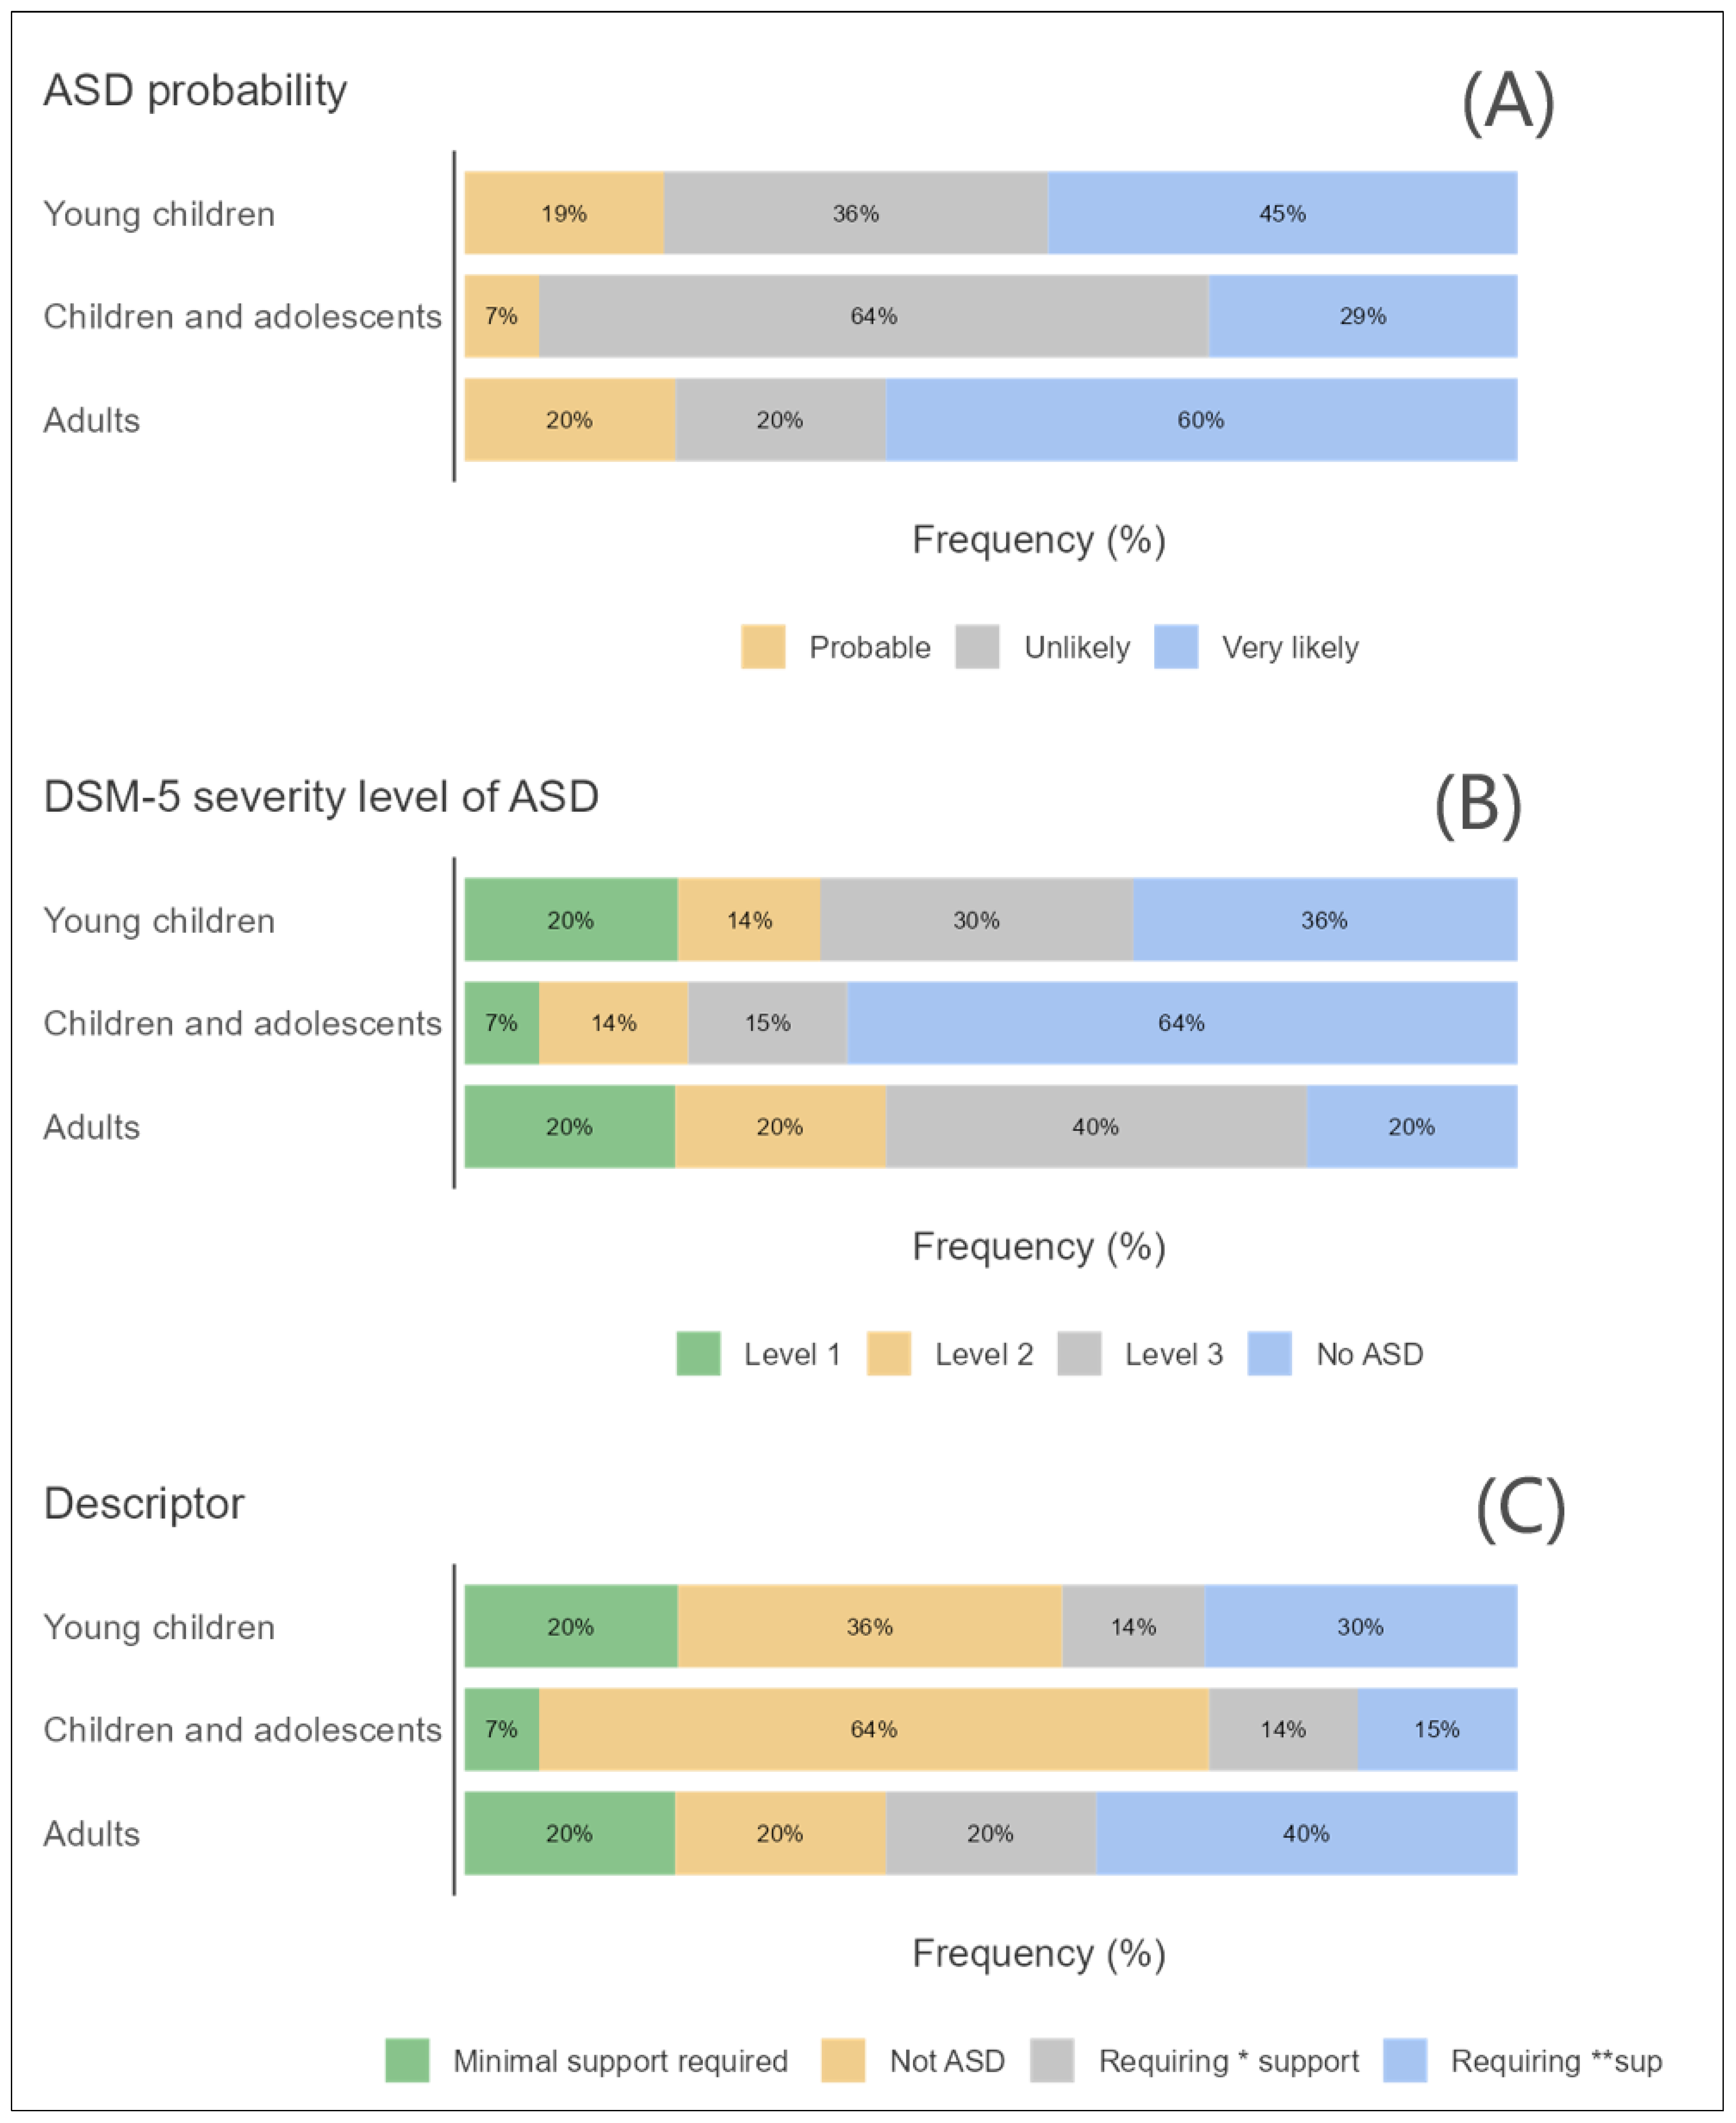
3.2. ASD and Age Groups
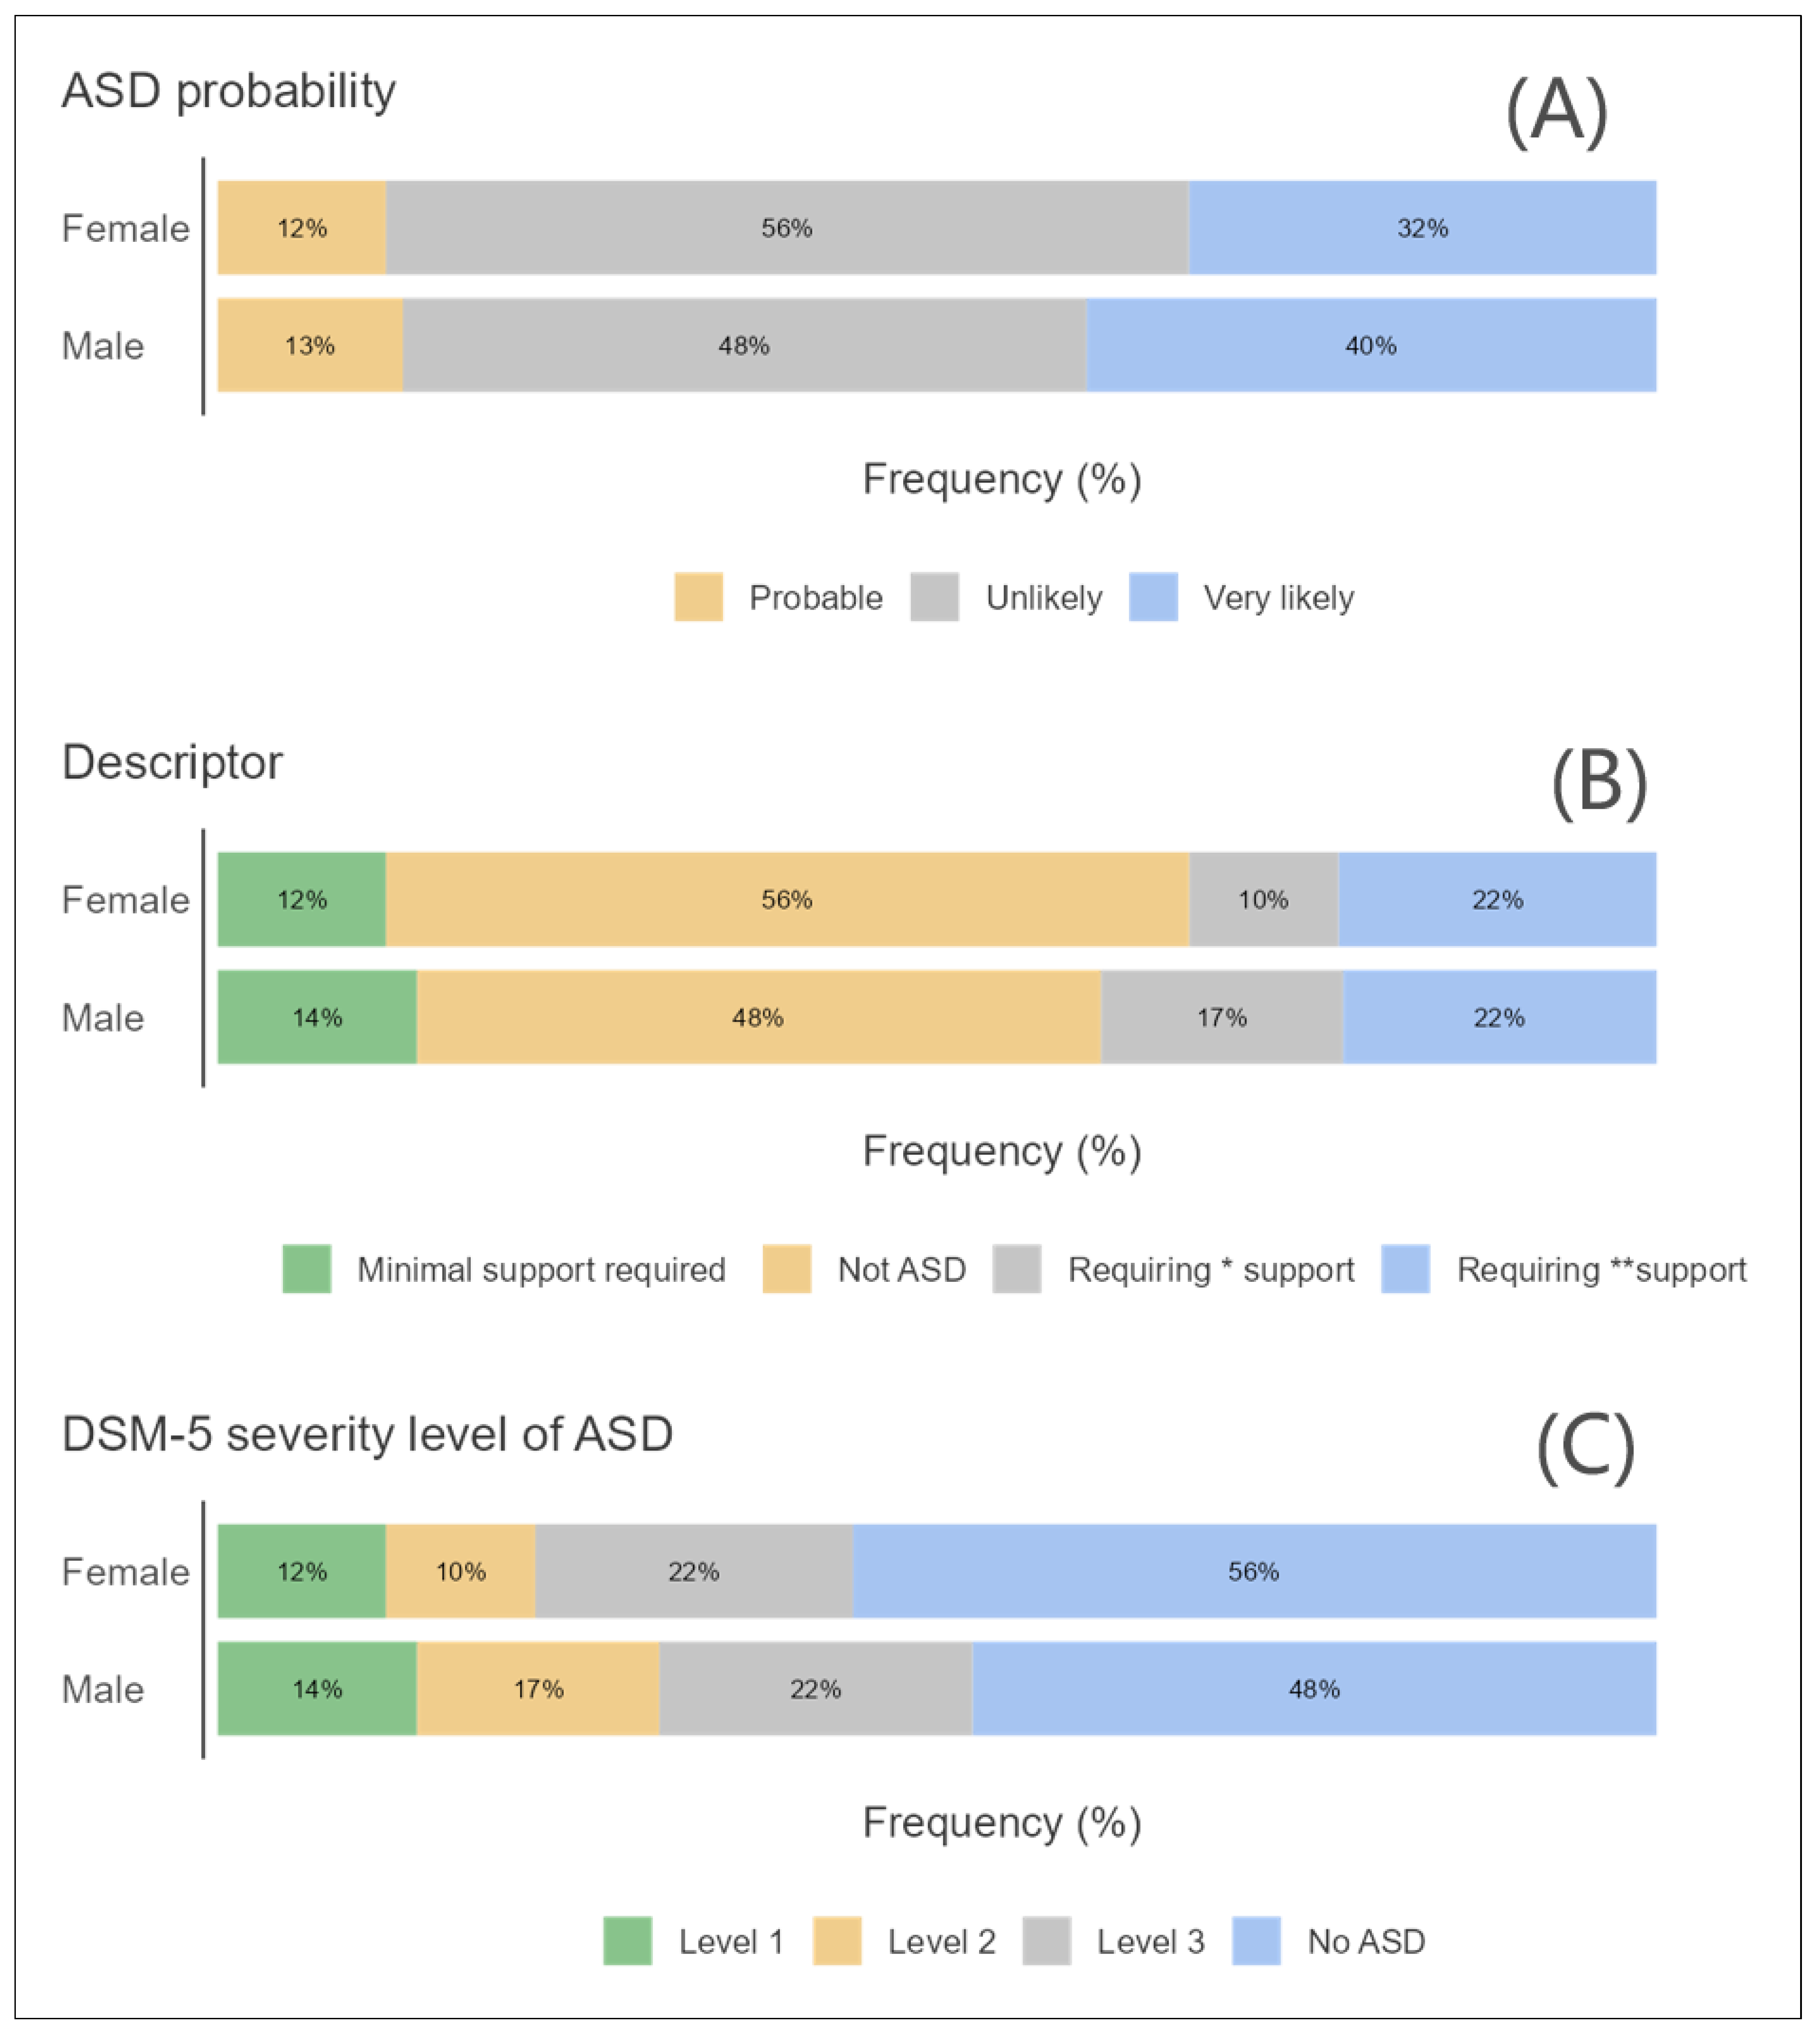
Figure 2A–C shows the ASD and different age groups based on three factors: probability of ASD in three levels, the possibility of required support using four descriptors, and the ASD severity level in three levels. Figure 2A seems to suggest that ASD is more likely to be diagnosed in adults. Figure 2B suggests that young children are less likely to require substantial or very substantial support in a school setting compared to children and adolescents and adults. Figure 2C suggests that ASD is more likely to be diagnosed in young children and adults.

3.3. ASD and Sex

Figure 3A–C shows the ASD and sex based on three factors: the probability of ASD in three levels, the possibility of required support using four descriptors, and the ASD severity level in three levels. Figure 3A suggests that ASD is more likely to be diagnosed in a clinical setting than in a school setting or the general population, for both females and males. It also suggests that ASD is slightly more likely to be diagnosed in males than in females, across all three settings. Figure 3B proposes that males with ASD are more likely to require very substantial support compared to females with ASD, regardless of the setting. Figure 3C the graph indicates that individuals with ASD diagnosed in a clinical setting are more likely to fall into the Level 3 (most severe) category compared to those diagnosed in a school setting. Conversely, individuals diagnosed in a school setting are more likely to fall into the “No ASD” category compared to those diagnosed in a clinical setting.

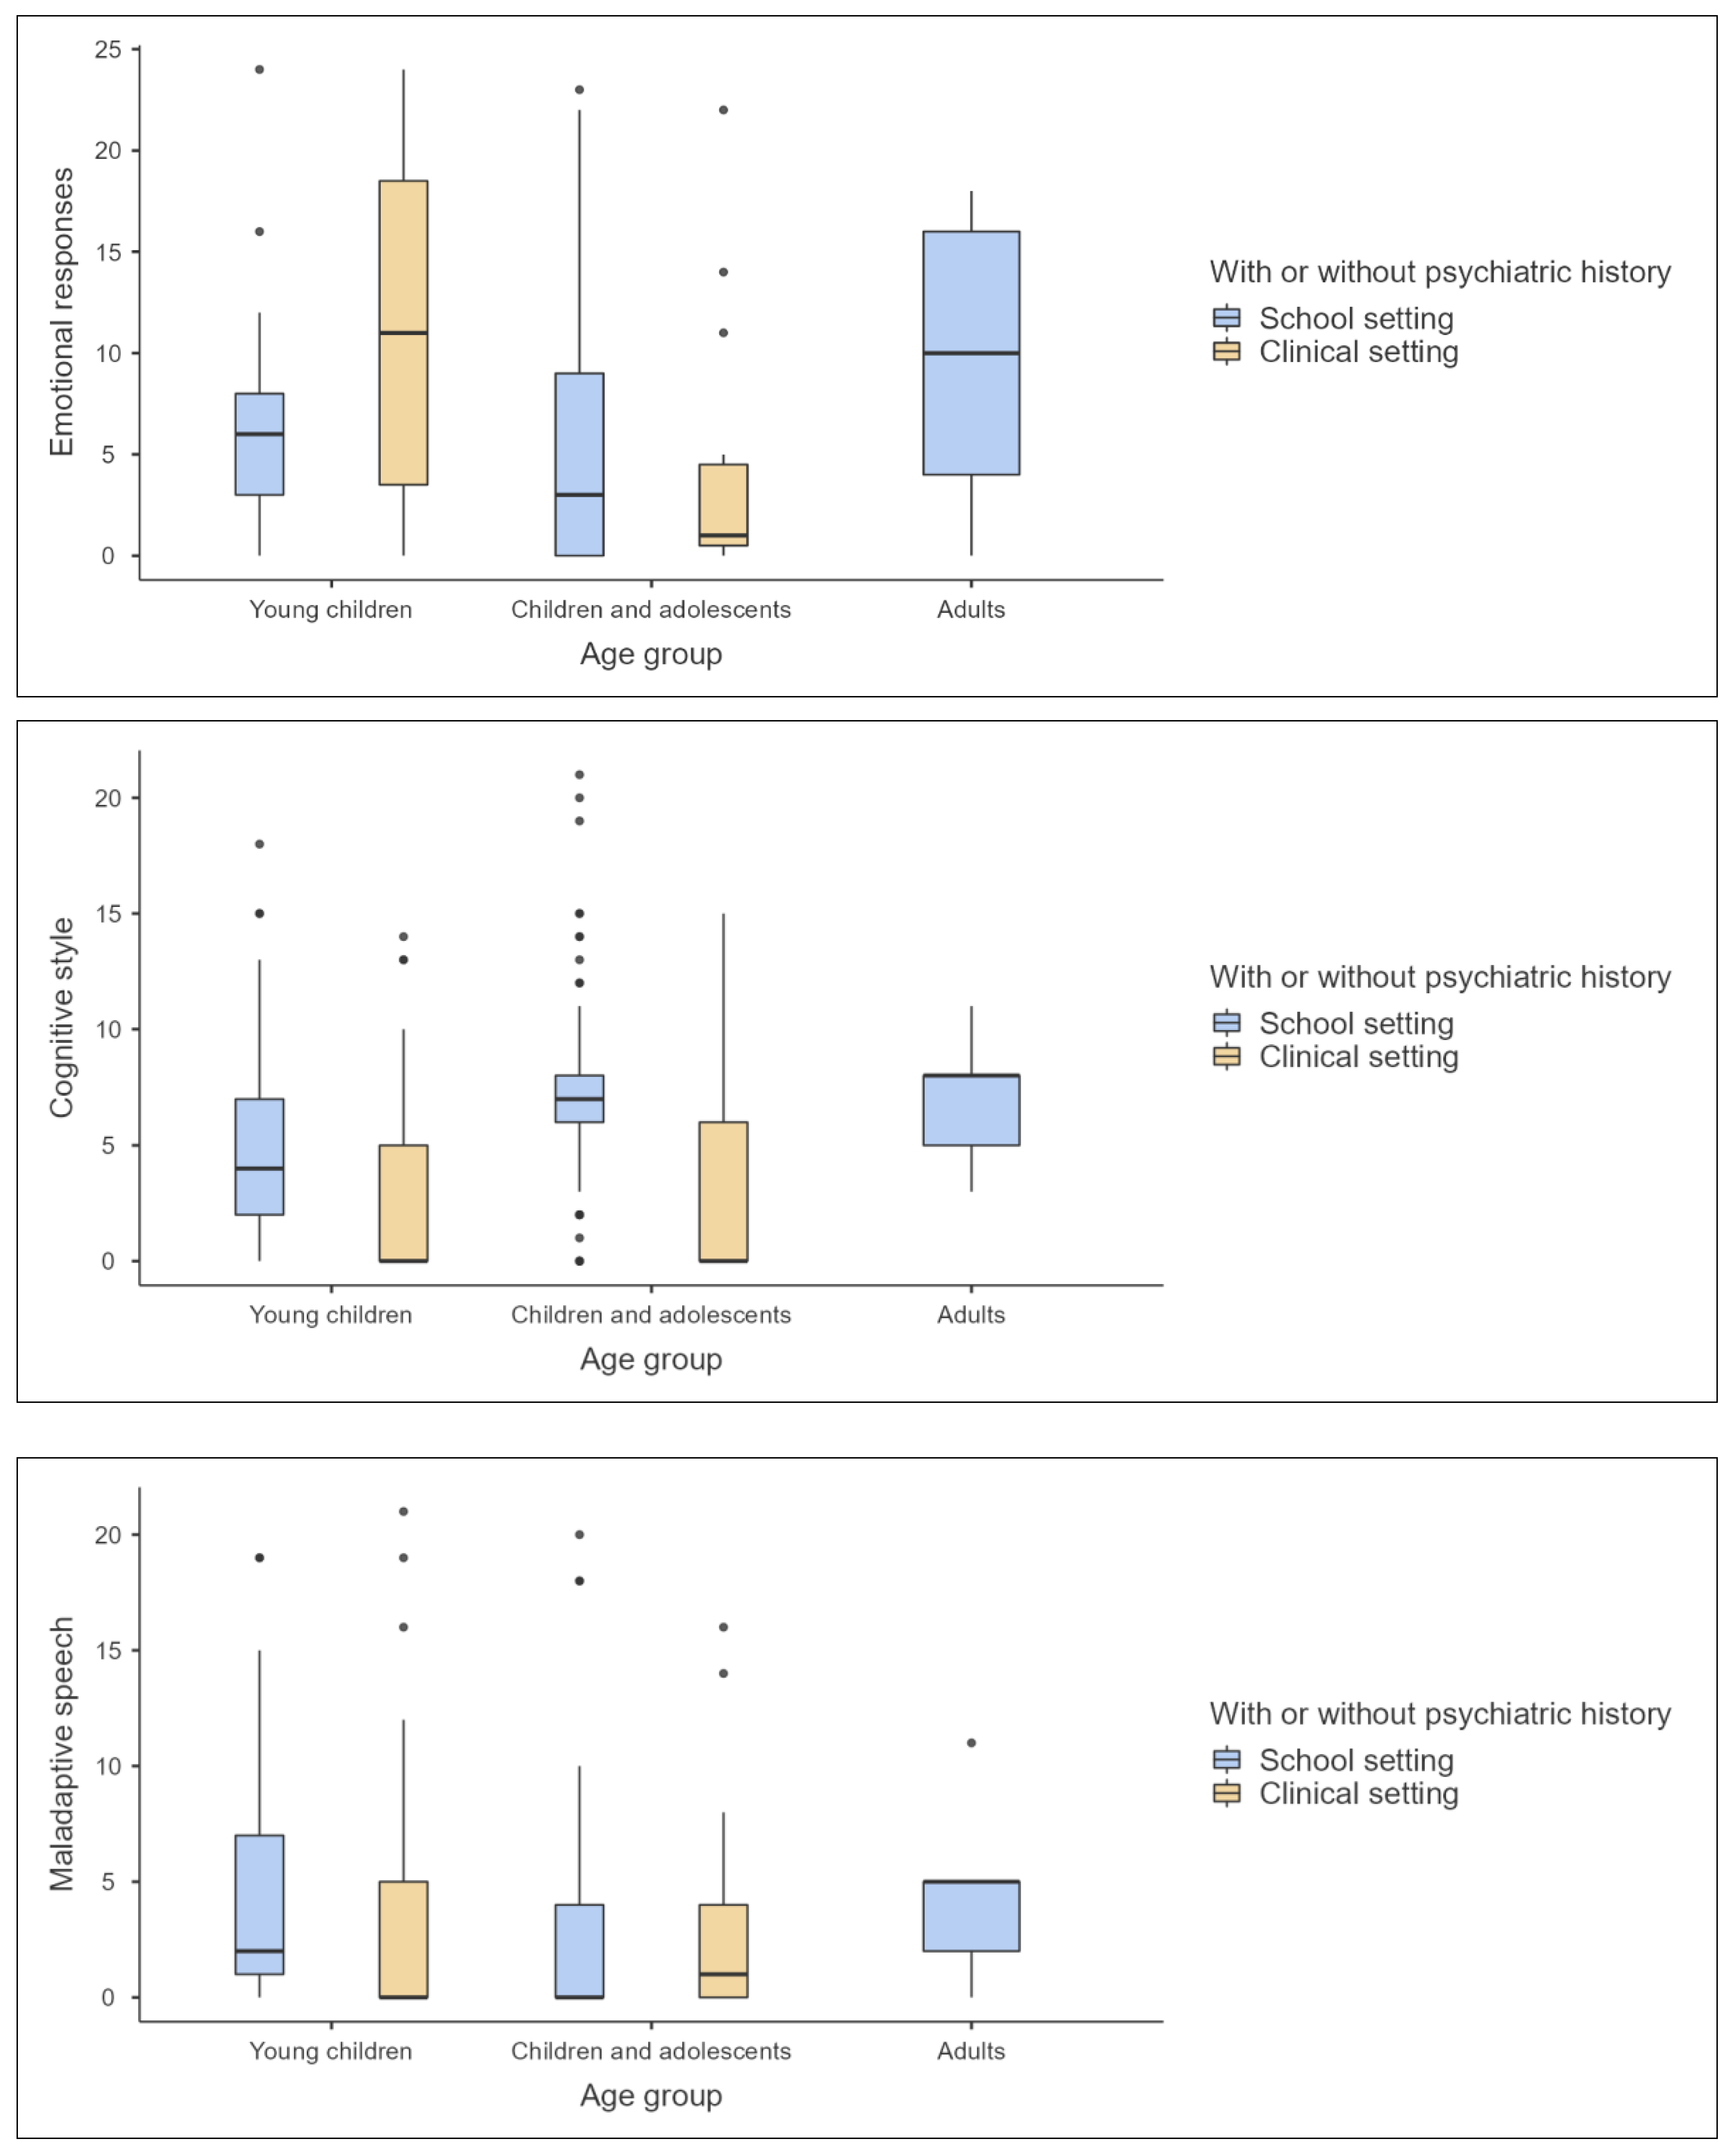
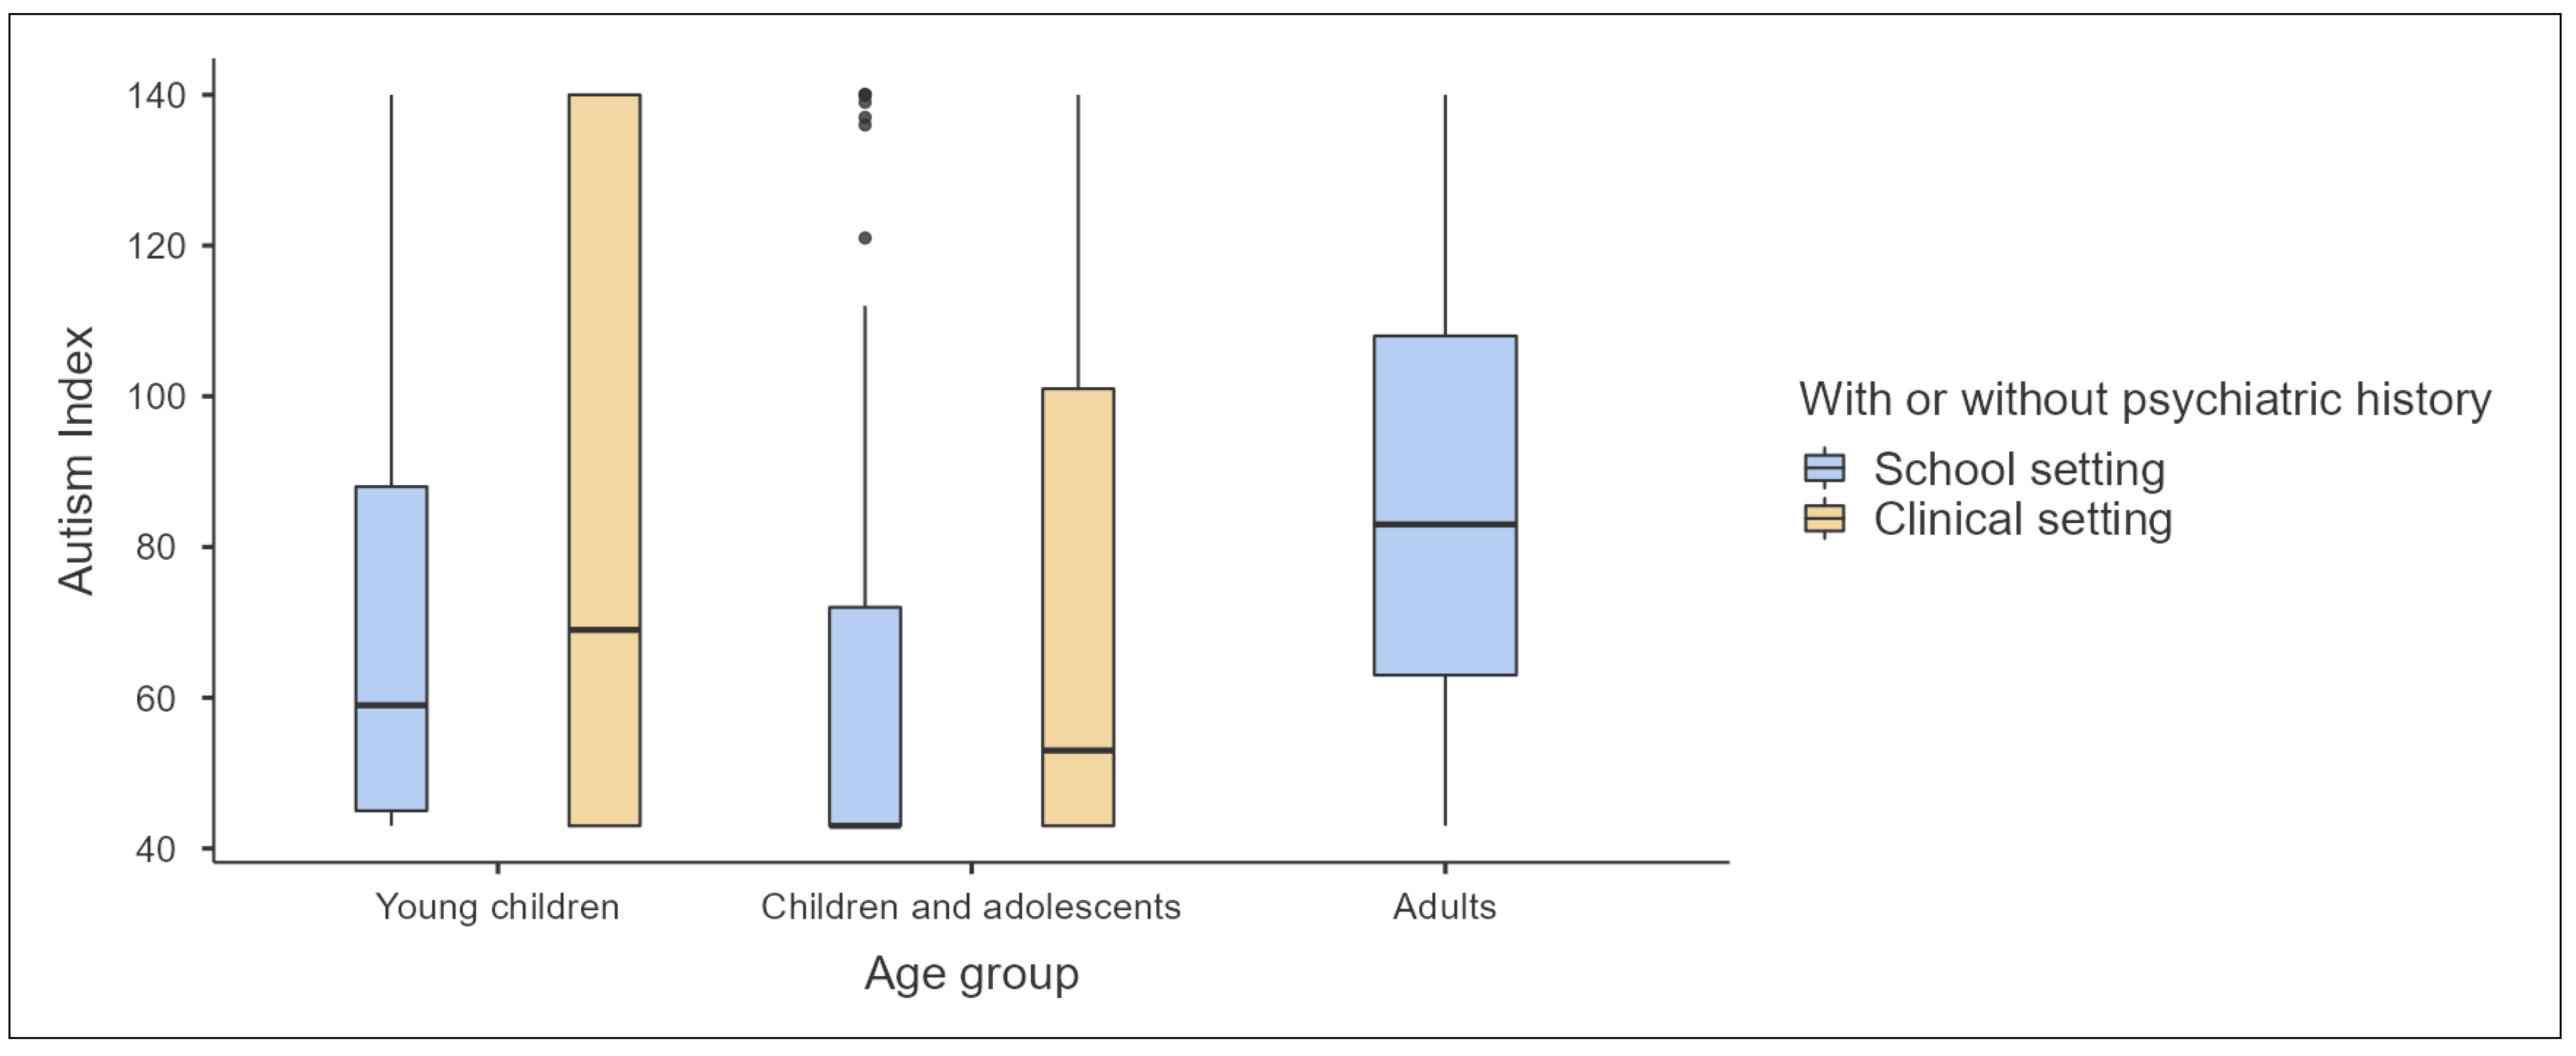
3.4. Descriptive Statistical Analysis of Age Groups and Settings

The second step was to run descriptive analysis, (See Table 3), which indicates distinct variation across age groups and settings in the appraisal of ASD-related characteristics. Within the cohort of young children, individuals in clinical settings displayed marginally higher mean scores in restricted/repetitive behaviours and social communication than their school counterparts, suggesting that clinical populations may exhibit more pronounced ASD symptomatology. This trend is also observed in the social interaction subscale, where clinical settings yield a higher mean, pointing towards greater social impairments within this environment. However, the cognitive style subscale presents an anomaly, wherein young children in school settings demonstrate higher mean scores, which may indicate a greater diversity in cognitive patterns among this population.
Children and adolescents revealed lower mean scores across most subscales compared to younger children, particularly in the school setting. This could be indicative of a developmental trajectory where manifestations of ASD characteristics evolve or become less evident as individuals age. However, the clinical setting for this age group reflects a variance in the trend, particularly within the social communication and social interaction subscales, where mean scores are significantly higher, reinforcing the notion that clinical populations may present with more severe manifestations of ASD.
Adult participants, although limited in number and lacking a clinical comparison group, showed the highest mean scores in the emotional responses’ subscale within the school setting, potentially suggesting an accumulation of emotional expression challenges with age. The maladaptive speech subscale, however, did not follow this pattern, with mean scores similar to those of younger children.
The Autism Index, serving as a composite measure derived from the subscale scores, further underscores these patterns. Young children in clinical settings exhibit the highest mean scores, followed by adults in school settings, and then children and adolescents in clinical settings. This index, a critical component of the GARS-3, encapsulates the cumulative impact of ASD characteristics across subscales and substantiates the necessity of nuanced interpretation when comparing across age groups and settings.
These findings, situated within the confidence interval parameters, highlight the variability of ASD presentation. Such variability necessitates a discerning approach to ASD assessment, taking into account the age and setting of individuals, to ensure accurate and culturally sensitive diagnoses. The data underscore the complexity of ASD and the imperative of tailored assessments that consider the developmental and environmental contexts of the individuals assessed. Figure 4, Figure 5 and Figure 6 provide visualized graphs for these differences.

3.5. Inferential Statistical Analysis of Developmental Status, Geographical Location, Sex, Age, and Different Levels of ASD

In the third step, inferential statistics were employed to discern the differences among various covariates in relation to the Autism Index. Linear regression analysis was conducted (See Table 4), revealing a robust model with an R2 of 0.91883, indicating that approximately 91.88% of the variance in the Autism Index can be explained by the independent variables included in the model.
The omnibus ANOVA test within the linear regression analysis provided insight into the significance of each covariate. It was observed that age group (p = 0.886), presence or absence of psychiatric history (p = 0.529), sex (p = 0.769), and city (p = 0.193) were not significant predictors of the Autism Index scores. However, the subscales of restricted/repetitive behaviours (p < 0.001), social interaction (p = 0.002), social communication (p < 0.001), emotional responses (p = 0.001), cognitive style (p = 0.044), and maladaptive speech (p < 0.001) were found to be significant predictors, indicating that these domains of ASD-related characteristics bear a consequential impact on the overall assessment of ASD severity as measured by the Autism Index.
When examining the model coefficients, the influences of individual predictors on the Autism Index scores were further elucidated. Notably, the city of Taif demonstrated a significant positive relationship with the Autism Index (p = 0.024), suggesting that geographical location within Saudi Arabia may be associated with variability in ASD assessment outcomes. Moreover, the subscales of restricted/repetitive behaviours, social interaction, social communication, emotional responses, cognitive style, and maladaptive speech each significantly contributed to the prediction of the Autism Index scores, with standardized estimates reflecting their respective effect sizes.
This regression analysis underscores the multifaceted nature of ASD assessment through the A-GARS-3 and the complex interplay of various factors that contribute to the overall evaluation of ASD severity. The findings stress the importance of a comprehensive approach to ASD diagnosis, considering a broad spectrum of behaviours and communication styles, and highlight the potential influence of cultural and regional factors on the assessment outcomes.
In further examining the predictors of ASD severity within the Saudi Arabian context, the study progressed to a log-linear regression analysis (See Table 5). This statistical approach extended beyond the descriptive, delving into the multivariate relationships and interactions between several predictors including sex, age group, developmental status (typically or atypically developing), and the levels of ASD as categorized by DSM-5 severity (ranging from no ASD to very substantial support).
The model fit measures indicated a perfect fit (R2 = 1.00000), with the omnibus test reaching statistical significance (χ2 = 299.50, df = 47, p < 0.001). These results suggest that the model was highly effective in predicting the presence and severity of ASD based on the included predictors. However, it is noteworthy that the R2 value of 1.00000 may indicate overfitting, a scenario where the model too closely matches the sample data and may not generalize well to other datasets.
Within the model coefficients, the intercept was significant (p < 0.001), establishing a baseline relationship between the predictors and ASD severity. The main effects for age group and the setting did not reach statistical significance when compared to young children, nor did the main effect for sex. However, interactions between age group and psychiatric history, as well as between age group and DSM-5 severity levels, were notably significant. Particularly, the interaction between children and adolescents with no ASD compared to Level 1 severity (p = 0.003) and the interaction with Level 3 severity (p = 0.037) were significant, indicating that the association between age group and severity level of support needed is contingent upon the presence of a psychiatric history.
The coefficients for interactions involving the clinical setting were generally non-significant, with large standard errors, which suggests a degree of instability in the estimates likely due to small sample sizes in certain categories or potential data sparsity. This warrants a cautious interpretation of these interaction terms, as the results may not accurately represent the population.
In sum, the log-linear regression analysis provided a nuanced understanding of the multifactorial nature of ASD diagnosis and severity. It underscores the complexity of interactions between demographic variables and clinical presentations of ASD, and it highlights the necessity for comprehensive assessment protocols that account for the interplay of these variables. The results of this analysis are pivotal for informing clinical practices and tailoring intervention strategies to meet the individualized needs of the ASD population in Saudi Arabia.

4. Discussion

The primary aim of this study was to use the Arabic adaptation of the A-GARS-3 to investigate how ASD symptoms manifest across different demographic variables in Saudi Arabia, including developmental status, gender, age groups, and geographic regions. The study focused on evaluating ASD characteristics through six subscales: restricted/repetitive behaviors, social interaction, social communication, emotional responses, cognitive style, and maladaptive speech. Our analysis revealed notable differences in ASD presentations among the various demographic factors. We observed significant disparities in the likelihood and intensity of ASD symptoms in relation to setting, where clinical settings depicted a higher propensity and greater severity of ASD. This aligns with earlier research indicating that children with ASD often experience more severe symptoms associated with greater challenges [20,21,22]. Furthermore, age-related patterns suggest that younger children exhibit more severe ASD symptoms, while geographical analysis points to regional variances in the severity of ASD, corroborating with previous findings that younger age correlates with a higher level of ASD-related difficulties [23,24].
Interestingly, this study found that males were slightly more likely to be diagnosed with ASD compared to females across all settings, though some existing studies reported that sex differences of children with ASD are significantly limited and there are similarities and no differences [25,26]. There are similar studies that support the fact that males have been diagnosed with ASD more compared to female [27,28,29]. Similarly previous studies reported that females with ASD demonstrate less restricted and repetitive behaviors, although sex effects may be highlighted due to use of recognized, male-centric diagnostic instruments. Females also use better vocal expressiveness in how they use and alter the quality of their speech resulting in more natural speech patterns during social communication [30,31,32]. In the same vein, it was reported that ten years ago, a UK study found that, regardless of the severity of autistic traits, boys were more likely to receive a diagnosis than girls [33].
The study’s results highlight the complex interplay of demographic factors in the presentation of ASD, emphasizing the need for tailored assessment protocols. The findings of the research showed that the A-GARS-3 proved to be a reliable and culturally appropriate tool for evaluating ASD in the Saudi Arabian context. These findings suggest the necessity for age-specific and culturally informed diagnostic approaches in clinical and educational settings. The regional differences in ASD prevalence and severity call for targeted health policies and resource distribution to address the diverse needs across Saudi provinces. This finding indicated that social and demographic factors play a role in receiving a diagnosis of autistic spectrum disorder (ASD) separately of symptom severity and this supports the reality of socio-demographic influence found in the previous existing research [33,34].
Further, the previous validations of the GARS across different cultural contexts have consistently demonstrated the scale’s reliability and validity for assessing ASD when it is properly adapted and standardized. For example, the Spanish adaptation of GARS-2 exhibited high internal consistency and discriminative validity [35], a pattern also evident in the Turkish [36] and Korean versions [37,38]. These studies collectively affirm the universality of ASD and the cultural robustness of GARS across diverse populations [21,39,40].
In alignment with these international findings, our study has shown the Arabic version of the GARS-3 to be a reliable tool within the Saudi Arabian context. This is in agreement with previous research, such as the Jordanian translated Arabic version of GARS-2, which indicated significant validity and reliability indicators [41]. Our study’s focus on demographic variables, including developmental status, sex, age, and geographical region, echoes the recognized necessity for culturally sensitive approaches in the diagnosis of ASD. Although our sample size was smaller, the significant demographic differences observed in ASD manifestations are in line with the global understanding that GARS can be adapted to various cultures when proper translation and standardization are applied.
Moreover, the emphasis on the need for culturally sensitive tools, as highlighted by the Chinese validation studies [42], supports our findings that regional disparities in ASD presentation must be considered in diagnosis and assessment. Thus, our research both confirms the validity and reliability of the Arabic GARS-3 and emphasizes the critical role of cultural and demographic factors in assessing ASD. This supports the ongoing need for the adaptation and refinement of diagnostic instruments to meet the diverse needs of populations across different regions [39,40,43].
Additionally, Alasmari, Alduais, and Qasem’s study highlights the critical role of language in the assessment and diagnosis of ASD in Saudi Arabia, emphasizing the evolution of research towards a more culturally and linguistically informed approach [44]. This aligns with our findings underscoring the need for assessment tools that are sensitive to the linguistic nuances and cultural context of Saudi Arabian society, a perspective that complements our findings on the reliability of the Arabic GARS-3 for this population. This recent research points to a significant gap in longitudinal studies addressing language and cultural impacts on ASD, bolstering the call for tailored diagnostic practices in clinical settings within the region.

5. Limitations

The present study, while illuminating in its findings, is not without limitations that warrant circumspection. Primarily, its cross-sectional nature precludes the establishment of causality, rendering the temporal sequencing of ASD symptomatology and its predictors elusive. Additionally, the reliance on self-reported data via Google Forms, albeit innovative, may introduce self-selection bias, potentially skewing the sample towards individuals with internet access and technological proficiency. Furthermore, the psychometric properties, while robust, were evaluated within a homogeneous cultural context, which may limit the generalizability of the A-GARS-3 across Arab societies with varying dialects and cultural nuances. Finally, the sample size, particularly within the adult cohort, was relatively modest, constraining the statistical power to detect nuanced differences within this demographic, an issue compounded by the absence of a clinical comparison group for adults.

6. Implications for Practice

The findings of this study have substantial implications for the clinical assessment and intervention strategies of ASD within the Saudi Arabian context. The demonstrated reliability and validity of the A-GARS-3 affirm its utility as a culturally attuned diagnostic tool, facilitating earlier and more accurate identification of ASD, which is paramount for timely and effective intervention. The nuanced understanding of ASD presentation across different age demographics underscores the exigency for age-specific assessment protocols. Moreover, the regional disparities in ASD severity indices intimate the necessity for regionalized health policies and resource allocation to address the variegated needs across Saudi provinces. In the ambit of educational and clinical settings, the insights gleaned from this research advocate for tailored support programs that address both the common and idiosyncratic challenges faced by individuals with ASD.

7. Conclusions

In brief, this research utilized a cross-sectional design to assess how symptoms of ASD present within the Saudi Arabian context, with a focus on a sample of 178 participants to understand demographic differences. The diverse participant group allowed for a comprehensive analysis of the prevalence and severity of ASD across different ages, sexes, and developmental stages within the Saudi context. Innovative methods, such as employing Google Forms for data collection, facilitated an efficient and secure process, upholding the integrity of the data and preserving participant confidentiality. The findings provide nuanced insights into how demographic factors such as age, sex, and developmental status intersect with ASD presentations. These insights highlight the importance of a nuanced diagnostic approach that considers the complex interplay of individual characteristics with ASD. The study contributes valuable perspectives to the body of ASD research, offering guidance for future investigations into the nuanced expressions of autism spectrum disorders within specific cultural settings.

Author Contributions

Conceptualization, M.A., A.A., F.Q., S.A. and L.A.; Data curation, A.A. and L.A.; Formal analysis, A.A.; Funding acquisition, M.A. and F.Q.; Investigation, M.A., F.Q. and S.A.; Methodology, A.A.; Project administration, M.A. and F.Q.; Resources, M.A., F.Q., S.A. and L.A.; Software, A.A.; Supervision, M.A. and F.Q.; Validation, A.A.; Visualization, A.A.; Writing—original draft, M.A., A.A., F.Q., S.A. and L.A.; Writing—review and editing, A.A. All authors have read and agreed to the published version of the manuscript.

Funding

This research was supported by King Salman Centre for Disability Research, Saudi Arabia, Research Group no KSRG-2023-372.

Institutional Review Board Statement

An IRB approval was obtained by the Department of English Language and Literature, University of Bisha, Bisha, Saudi Arabia on 19 February 2023 with an approval number KSRG-2023-372.

Informed Consent Statement

Informed consent was obtained from all subjects involved in the study.

Data Availability Statement

The raw data supporting the conclusions of this article will be made available by the corresponding author on request. The data are not publicly available due to confidentiality and privacy disclosure of the participants’ identities and authorized sharing of the data.

Acknowledgments

The authors extend their appreciation to the King Salman Centre for Disability Research for funding this work through Research Group no KSRG-2023-372.

Conflicts of Interest

The authors declare no conflicts of interest.

References

  1. World Health Organization. 6A02: Autism Spectrum Disorder. In International Classification of Diseases; World Health Organization: Geneva, Switzerland, 2023; 11th Revision. [Google Scholar]
  2. American Psychiatric Association. F84.0: Autism Spectrum Disorder. In Diagnostic and Statistical Manual of Mental Disorders: DSM-5-TR; American Psychiatric Association: Arlington, VA, USA, 2022; pp. 56–68. [Google Scholar]
  3. Papadopoulos, A.; Siafaka, V.; Tsapara, A.; Tafiadis, D.; Kotsis, K.; Skapinakis, P.; Tzoufi, M. Measuring Parental Stress, Illness Perceptions, Coping and Quality of Life in Families of Children Newly Diagnosed with Autism Spectrum Disorder. BJPsych Open 2023, 9, e84. [Google Scholar] [CrossRef]
  4. Boucher, J. Autism Spectrum Disorders Characteristics, Causes and Practical Issues, 3rd ed.; SAGE Publications Ltd.: New York, NY, USA, 2022. [Google Scholar]
  5. Jacobs, D.; Steyaert, J.; Dierickx, K.; Hens, K. Parents’ Multi-Layered Expectations When Requesting an Autism Spectrum Disorder Assessment of Their Young Child: An in-Depth Interview Study. BMC Psychiatry 2020, 20, 440. [Google Scholar] [CrossRef] [PubMed]
  6. Volkmar, F.; Siegel, M.; Woodbury-Smith, M.; King, B.; McCracken, J.; State, M. Practice Parameter for the Assessment and Treatment of Children and Adolescents with Autism Spectrum Disorder. J. Am. Acad. Child. Adolesc. Psychiatry 2014, 53, 237–257. [Google Scholar] [CrossRef]
  7. Ashwood, K.L.; Buitelaar, J.; Murphy, D.; Spooren, W.; Charman, T. European Clinical Network: Autism Spectrum Disorder Assessments and Patient Characterisation. Eur. Child. Adolesc. Psychiatry 2015, 24, 985–995. [Google Scholar] [CrossRef]
  8. Dahiya, A.V.; DeLucia, E.; McDonnell, C.G.; Scarpa, A. A Systematic Review of Technological Approaches for Autism Spectrum Disorder Assessment in Children: Implications for the COVID-19 Pandemic. Res. Dev. Disabil. 2021, 109, 103852. [Google Scholar] [CrossRef]
  9. Rojahn, J.; Matson, J.L. Assessment and Diagnosis of Autism and Spectrum Disorders in Children. J. Dev. Phys. Disabil. 2010, 22, 313–315. [Google Scholar] [CrossRef]
  10. Kantzer, A.-K.; Fernell, E.; Gillberg, C.; Miniscalco, C. Autism in Community Pre-Schoolers: Developmental Profiles. Res. Dev. Disabil. 2013, 34, 2900–2908. [Google Scholar] [CrossRef]
  11. Centers for Disease Control and Prevention. Data & Statistics on Autism Spectrum Disorder. Available online: https://www.cdc.gov/ncbddd/autism/data.html (accessed on 4 March 2024).
  12. Waligórska, A.; Kucharczyk, S.; Waligórski, M.; Kuncewicz-Sosnowska, K.; Kalisz, K.; Odom, S. National Professional Development Center on Autism Spectrum Disorders (NPDC) Model—An Integrated Model of Evidence-Based Practices for Autism Spectrum Disorder. Psychiatr. Pol. 2019, 53, 753–770. [Google Scholar] [CrossRef] [PubMed]
  13. Schall, C.M.; McDonough, J.T. Autism Spectrum Disorders in Adolescence and Early Adulthood: Characteristics and Issues. J. Vocat. Rehabil. 2010, 32, 81–88. [Google Scholar] [CrossRef]
  14. Kreiser, N.L.; White, S.W. ASD in Females: Are We Overstating the Gender Difference in Diagnosis? Clin. Child. Fam. Psychol. Rev. 2014, 17, 67–84. [Google Scholar] [CrossRef]
  15. Simonoff, E.; Pickles, A.; Charman, T.; Chandler, S.; Loucas, T.; Baird, G. Psychiatric Disorders in Children with Autism Spectrum Disorders: Prevalence, Comorbidity, and Associated Factors in a Population-Derived Sample. J. Am. Acad. Child. Adolesc. Psychiatry 2008, 47, 921–929. [Google Scholar] [CrossRef] [PubMed]
  16. Durkin, M.S.; Maenner, M.J.; Meaney, F.J.; Levy, S.E.; DiGuiseppi, C.; Nicholas, J.S.; Kirby, R.S.; Pinto-Martin, J.A.; Schieve, L.A. Socioeconomic Inequality in the Prevalence of Autism Spectrum Disorder: Evidence from a U.S. Cross-Sectional Study. PLoS ONE 2010, 5, e11551. [Google Scholar] [CrossRef] [PubMed]
  17. Gilliam, J.E. GARS-3: Gilliam Autism Rating Scale, 3rd ed.; Pro-Ed: Austin, TX, USA, 2014. [Google Scholar]
  18. Alasmari, M.; Alduais, A.; Qasem, F.; Almaghlough, S.; AlAmri, L. Arabic Validation of Gilliam Autism Rating Scale-Third Edition to Identify Individuals with and without Autism Spectrum Disorder. Psychol. Sch. 2024; under review. [Google Scholar]
  19. American Psychiatric Association. Diagnostic and Statistical Manual of Mental Disorders: DSM-5, 5th ed.; American Psychiatric Association: Washington, DC, USA, 2013. [Google Scholar]
  20. Tudor, M.E.; Hoffman, C.D.; Sweeney, D.P. Children with Autism: Sleep Problems and Symptom Severity. Focus Autism Other Dev. Disabil. 2012, 27, 254–262. [Google Scholar] [CrossRef]
  21. Samadi, S.A.; McConkey, R. The Utility of the Gilliam Autism Rating Scale for Identifying Iranian Children with Autism. Disabil. Rehabil. 2014, 36, 452–456. [Google Scholar] [CrossRef] [PubMed]
  22. Veatch, O.J.; Sutcliffe, J.S.; Warren, Z.E.; Keenan, B.T.; Potter, M.H.; Malow, B.A. Shorter Sleep Duration Is Associated with Social Impairment and Comorbidities in ASD. Autism Res. 2017, 10, 1221–1238. [Google Scholar] [CrossRef] [PubMed]
  23. Driscoll, K.; Schonberg, M.; Stark, M.F.; Carter, A.S.; Hirshfeld-Becker, D. Family-Centered Cognitive Behavioral Therapy for Anxiety in Very Young Children with Autism Spectrum Disorder. J. Autism Dev. Disord. 2020, 50, 3905–3920. [Google Scholar] [CrossRef]
  24. Vasa, R.A.; Kalb, L.; Mazurek, M.; Kanne, S.; Freedman, B.; Keefer, A.; Clemons, T.; Murray, D. Age-Related Differences in the Prevalence and Correlates of Anxiety in Youth with Autism Spectrum Disorders. Res. Autism Spectr. Disord. 2013, 7, 1358–1369. [Google Scholar] [CrossRef]
  25. Anderson, L.C.; Bolling, D.Z.; Schelinski, S.; Coffman, M.C.; Pelphrey, K.A.; Kaiser, M.D. Sex Differences in the Development of Brain Mechanisms for Processing Biological Motion. NeuroImage 2013, 83, 751–760. [Google Scholar] [CrossRef]
  26. Baron-Cohen, S.; Richler, J.; Bisarya, D.; Gurunathan, N.; Wheelwright, S. The Systemizing Quotient: An Investigation of Adults with Asperger Syndrome or High-Functioning Autism, and Normal Sex Differences. Philos. Trans. R. Soc. B Biol. Sci. 2003, 358, 361–374. [Google Scholar] [CrossRef]
  27. Lai, M.-C.; Baron-Cohen, S.; Buxbaum, J.D. Understanding Autism in the Light of Sex/Gender. Mol. Autism 2015, 6, 24. [Google Scholar] [CrossRef]
  28. Lai, M.C.; Lombardo, M.V.; Ruigrok, A.N.V.; Chakrabarti, B.; Auyeung, B.; Szatmari, P.; Happé, F.; Baron-Cohen, S. Quantifying and Exploring Camouflaging in Men and Women with Autism. Autism 2016, 21, 690–702. [Google Scholar] [CrossRef]
  29. Posserud, M.; Skretting Solberg, B.; Engeland, A.; Haavik, J.; Klungsøyr, K. Male to Female Ratios in Autism Spectrum Disorders by Age, Intellectual Disability and Attention-deficit/Hyperactivity Disorder. Acta Psychiatr. Scand. 2021, 144, 635–646. [Google Scholar] [CrossRef]
  30. Livingston, L.A.; Shah, P.; Happe, F. Autism Spectrum Disorder. Encycl. Ment. Health 2019, 1, 124–130. [Google Scholar]
  31. Livingston, L.A.; Shah, P.; Happé, F. Compensatory Strategies below the Behavioural Surface in Autism: A Qualitative Study. Lancet Psychiatry 2019, 6, 766–777. [Google Scholar] [CrossRef] [PubMed]
  32. McPartland, J.C.; Reichow, B.; Volkmar, F.R. Sensitivity and Specificity of Proposed DSM-5 Diagnostic Criteria for Autism Spectrum Disorder. J. Am. Acad. Child. Adolesc. Psychiatry 2012, 51, 368–383. [Google Scholar] [CrossRef]
  33. Russell, G.; Steer, C.; Golding, J. Social and Demographic Factors That Influence the Diagnosis of Autistic Spectrum Disorders. Soc. Psychiatry Psychiatr. Epidemiol. 2011, 46, 1283–1293. [Google Scholar] [CrossRef] [PubMed]
  34. Pozo, P.; Sarriá, E.; Brioso, A. Family Quality of Life and Psychological Well-Being in Parents of Children with Autism Spectrum Disorders: A Double ABCX Model. J. Intellect. Disabil. Res. 2014, 58, 442–458. [Google Scholar] [CrossRef]
  35. Jackson, L.S.; Little, S.G.; Akin-Little, A. The Spanish Adaptation of the Gilliam Autism Rating Scale-2: Translation and Psychometric Analysis. Res. Autism Spectr. Disord. 2013, 7, 1160–1167. [Google Scholar] [CrossRef]
  36. Diken, İ.H.; Avşar, A.; Diken, Ö.; Gilliam, J.E. Exploring the Validity and Reliability of Turkish Version of Gilliam Autism Rating Scale-2: Turkish Standardization Study* Gilliam Otistik Bozukluk Derecelendirme Ölçeği-2 Türkçe Versiyonu’nun (GOBDÖ-2-TV) Geçerlik ve Güvenirliğinin Araştırılması: Türkiye Standardizasyon Çalışması; Turkish Education Association: Ankara, Turkey, 2012; Volume 37. [Google Scholar]
  37. Choi, H.; Kim, U. The Reliability and Validity of the Gilliam Autism Rating Scale with Children and Youth in the Republic of Korea: A Preliminary Study. Korean J. Spec. Eduation 2005, 40, 301–311. [Google Scholar]
  38. Jhin, H.-K.; Yoon, H.-J.; Park, J.-P. 한국판-Gilliam 자폐증 평정척도-2(K-GARS-2) 표준화 연구 (Korean-Gilliam Autism Rating Scale-2(K-GARS-2) Standardization). Biol. Ther. Psychiatry 2011, 17, 189. [Google Scholar]
  39. Samadi, S.A.; Noori, H.; Abdullah, A.; Ahmed, L.; Abdalla, B.; Biçak, C.A.; McConkey, R. The Psychometric Properties of the Gilliam Autism Rating Scale (GARS-3) with Kurdish Samples of Children with Developmental Disabilities. Children 2022, 9, 434. [Google Scholar] [CrossRef] [PubMed]
  40. Samadi, S.A.; McConkey, R.; Nuri, H.; Abdullah, A.; Ahmad, L.; Abdalla, B.; Biçak, C.A. Screening Children for Autism Spectrum Disorders in Low-and Middle-Income Countries: Experiences from the Kurdistan Region of Iraq. Int. J. Environ. Res. Public Health 2022, 19, 4581. [Google Scholar] [CrossRef] [PubMed]
  41. AlJabery, A.M. The Examination of Validity and Reliability Indicators of the Jordanian Translated Arabic Version of the Gilliam Autism Rating Scale (GARS-2). Ph.D. Thesis, Wayne State University, Detroit, MI, USA, 2008. [Google Scholar]
  42. Li, N. Preliminary Validation of the Childhood Autism Rating Scale-Second Edition Questionnaire for Parents or Caregivers (Cars2-Qpc) and the Gilliam Autism Rating Scale (Gars-2) with a Chinese-Speaking Population. Master’s Thesis, University of Eastern Kentucky, Richmond, KY, USA, 2005. [Google Scholar]
  43. Samadi, S.A.; Biçak, C.A.; Noori, H.; Abdalla, B.; Abdullah, A.; Ahmed, L. Autism Spectrum Disorder Diagnostic Criteria Changes and Impacts on the Diagnostic Scales-Utility of the 2nd and 3rd Versions of the Gilliam Autism Rating Scale (GARS). Brain Sci. 2022, 12, 537, Erratum in Brain Sci. 2023, 13, 1081. [Google Scholar] [CrossRef]
  44. Alasmari, M.; Alduais, A.; Qasem, F. A Thematic Review of Autism Spectrum Disorder Research in Saudi Arabia: Insights into Diagnosis, Assessment, and Language Considerations. Appl. Neuropsychol. Child. 2023, 1–15. [Google Scholar] [CrossRef]
Figure 1. A survey plot for the distribution participants by (A) developmental status and ASD probability, (B) ASD description, and (C) DSM-5 severity level. * Substantial support. ** Very substantial support.
Children 11 00472 g001
Figure 2. A survey plot for the distribution participants by (A) age group and ASD probability, (B) ASD description, and (C) DSM-5 severity level. * Substantial support. ** Very substantial support.
Children 11 00472 g002
Figure 3. A survey plot for the distribution participants by (A) sex and ASD probability, (B) ASD description, and (C) DSM-5 severity level. * Substantial support. ** Very substantial support.
Children 11 00472 g003
Figure 4. Graph plots for the first three subscales of A-GARS-3 by age group and developmental status.
Children 11 00472 g004
Figure 5. Graph plots for last three subscales of A-GARS-3 by age group and developmental status.
Children 11 00472 g005
Figure 6. Autism index for A-GARS-3 by age group and developmental status.
Children 11 00472 g006
Table 1. Demographic characteristics of participants.
School Setting (n)Clinical Setting (n)%
Age Group1245469.6630.34
3–5282822.5851.85
6–10592147.5838.89
11–1528522.589.26
16–20604.840
21–22302.420
Gender Group
Female601748.3931.48
Male643751.6168.52
City Group
Asir province90372.585.56
Riyadh Province403.230
Eastern Province1008.060
Medina Province100.810
Tabuk Province0101.85
Mecca Province195015.3292.59
Exceptionality Status
No exceptionality124NA100NA
Attention deficit hyperactivity disorderNA3NA5.56
Autism spectrum disorderNA16NA29.63
Apraxia of speechNA1NA1.85
Hearing impairmentNA6NA11.11
DysarthriaNA1NA1.85
Speech and language delayNA27NA50.00
Ethnicity
Arabs1245469.6630.34
Language (mother tongue)
Arabic (Saudi dialect)1245469.6630.34
The sample included 178 participants with a mean age of 8.16 years (SD = 4.03). The participants were categorized into two groups: those in school settings (n = 124; M = 9.15, SD = 4.12) and those in clinical settings (n = 54; M = 5.89, SD = 2.70). The reported means and standard deviations reflect the participants’ ages in years.
Table 2. Subscales of the GARS-3 for measuring ASD.
SubscaleElaboration on Relation to ASD Based on GARS-3
Restricted/Repetitive BehavioursThis subscale measures the presence and severity of behaviours characterized by rigidity, restricted interests, and repetitive actions, which are core features of ASD.
Social InteractionAssesses the individual’s ability to engage in and maintain social reciprocity, recognize social cues, and form social connections, which are often impaired in ASD.
Social CommunicationEvaluates the capacity for verbal and non-verbal communication, including the use of language for social engagement, often disrupted in individuals with ASD.
Emotional ResponsesProbes the range, intensity, and appropriateness of emotional reactions, which can be markedly atypical or muted in persons with ASD.
Cognitive StyleExamines the individual’s thinking patterns, problem-solving approach, and preference for detail, which may be rigid or idiosyncratic in ASD.
Maladaptive SpeechMeasures aspects of speech and language such as echolalia, pronoun reversal, or atypical language processing, commonly observed in ASD.
Table 3. Descriptive analysis of ASD by age group and developmental status across the six subscales of A-GARS-3.
95% Confidence Interval
ASD CovariatesAge GroupSettingnMeanLowerUpperSDMinimumMaximum
Restricted/repetitive behavioursYoung childrenSchool358.31435.91003210.71856.9990022
Clinical399.89746.37393613.420910.8695035
Children and adolescentsSchool844.40482.8757585.93387.0457028
Clinical154.2667−0.3356108.86898.3106024
AdultsSchool515.20002.25449928.145510.4259026
Clinical0NaNNaNNaNNaNNaNNaN
Social interactionYoung childrenSchool359.34296.87144811.81437.1945033
Clinical3913.74369.71828417.768912.4176040
Children and adolescentsSchool846.22624.4435308.00898.2145035
Clinical1512.73337.36231818.10439.6988029
AdultsSchool59.8000−1.21517620.81528.8713024
Clinical0NaNNaNNaNNaNNaNNaN
Social communicationYoung childrenSchool355.31433.0574617.57116.5699027
Clinical3913.794910.34241917.247310.6504027
Children and adolescentsSchool843.50002.3628454.63725.2400019
Clinical1511.33337.94105114.72566.1257124
AdultsSchool55.2000−2.21887712.61895.9749015
Clinical0NaNNaNNaNNaNNaNNaN
Emotional responsesYoung childrenSchool356.20004.4647497.93535.0515024
Clinical3910.66678.04649213.28688.0829024
Children and adolescentsSchool844.83333.5801806.08655.7745023
Clinical154.26670.6993837.83406.4417022
AdultsSchool59.60000.07877719.12127.6681018
Clinical0NaNNaNNaNNaNNaNNaN
Cognitive styleYoung childrenSchool355.22863.5725616.88464.8208018
Clinical392.89741.5185274.27634.2538014
Children and adolescentsSchool847.28576.4043178.16714.0615021
Clinical153.26670.8485585.68484.3665015
AdultsSchool57.00003.17293510.82713.0822311
Clinical0NaNNaNNaNNaNNaNNaN
Maladaptive speechYoung childrenSchool354.68572.8915206.47995.2231019
Clinical393.48721.6825165.29185.5672021
Children and adolescentsSchool842.42861.4785713.37864.3776020
Clinical153.40000.4936836.30635.2481016
AdultsSchool54.6000−0.5644869.76454.1593011
Clinical0NaNNaNNaNNaNNaNNaN
Autism IndexYoung childrenSchool3571.600061.49590981.704129.414143140
Clinical3989.948775.363880104.533644.992443140
Children and adolescentsSchool8461.273854.62889667.918730.619843140
Clinical1575.000055.05178294.948236.021843140
AdultsSchool587.400040.211867134.588138.003943140
Clinical0NaNNaNNaNNaNNaNNaN
Note. The CI of the mean assumes sample means follow a t-distribution with N − 1 degrees of freedom. NaN: Not a Number, calculations were not figured out statistically.
Table 4. Model coefficients—Autism Index and GARS-3 subscales by age group, developmental status, sex, and city.
PredictorEstimateSEtpStand. Estimate
Intercept a36.259223.871459.365798<0.001
Age group:
    Children and adolescents − Young children0.256562.181070.1176290.9070.0070924
    Adults − Young children3.514027.163430.4905500.6240.0971435
With or without psychiatric history:
    Clinical setting − School setting3.703335.871910.6306860.5290.1023769
Sex:
    Male − Female−0.590442.00372−0.2946730.769−0.0163225
City:
    Alahsa − Abha2.898607.343990.3946900.6940.0801304
    Aldammam − Abha−9.785316.45331−1.5163240.132−0.2705103
    Alnamas − Abha−0.268593.36240−0.0798800.936−0.0074250
    Bisha − Abha−5.592683.80554−1.4696150.144−0.1546071
    Damam − Abha9.739808.809521.1056000.2710.2692524
    Jedah − Abha7.736248.461060.9143350.3620.2138648
    Jeddah − Abha−5.144286.79038−0.7575830.450−0.1422112
    Madina − Abha−0.2273911.68801−0.0194550.985−0.0062860
    Meca − Abha10.562776.670771.5834400.1150.2920029
    Mecca − Abha0.153578.236330.0186460.9850.0042454
    Riyadh − Abha1.7746811.708690.1515700.8800.0490602
    Riyadh − Abha3.741278.782650.4259850.6710.1034258
    Riyadh − Abha11.0620611.922860.9278020.3550.3058056
    Tabuk − Abha14.5895312.840051.1362520.2580.4033210
    Taif − Abha28.0724812.318992.2787970.0240.7760508
    Jeddah − Abha−4.966327.07335−0.7021160.484−0.1372915
Restricted/repetitive behaviours1.238660.182746.778242<0.0010.2941276
Social interaction0.575250.181323.1725410.0020.1539529
Social communication1.530080.208617.334672<0.0010.3474993
Emotional responses0.726600.218693.3224670.0010.1347893
Cognitive style0.548460.269892.0321350.0440.0699885
Maladaptive speech1.292000.241145.357834<0.0010.1758611
a Represents reference level. Note: SE (Standard Error): Measures the precision of a sample mean, indicating how much it can vary. t (t-Statistic): Used in t-tests, it represents the standardized difference between a sample statistic and a hypothesized value. p (p-Value): Provides the probability of observing the data, or more extreme, if the null hypothesis is true, used for hypothesis testing.
Table 5. Log linear regression: model coefficients by age group, developmental status, DSM-5 severity level, and sex.
PredictorEstimateSEZp
Intercept1.7917590.408254.388896<0.001
Age group:
    Children and adolescents − Young children−1.0986120.81650−1.3455200.178
    Adults − Young children−27.094345189,338.66108−1.4310 × 10−41.000
With or without psychiatric history:
    Clinical setting − School setting−1.7917591.08012−1.6588470.097
DSM-5 severity level of ASD:
    Level 2 − Level 1−0.4054650.64550−0.6281440.530
    Level 3 − Level 1−0.6931470.70711−0.9802580.327
    No ASD − Level 1−0.1823220.60553−0.3010940.763
Sex:
    Male − Female−0.4054650.64550−0.6281440.530
Age group * With or without psychiatric history:
    (Children and adolescents − Young children) * (Clinical setting − School setting)−24.203973189,338.66083−1.2783 × 10−41.000
    (Adults − Young children) * (Clinical setting − School setting)1.791759267,765.302146.6915 × 10−61.000
Age group * DSM-5 severity level of ASD:
    (Children and adolescents − Young children) * (Level 2 − Level 1)0.4054651.190240.3406590.733
    (Adults − Young children) * (Level 2 − Level 1)0.405465267,765.302271.5143 × 10−61.000
    (Children and adolescents − Young children) * (Level 3 − Level 1)2.1972251.054092.0844700.037
    (Adults − Young children) * (Level 3 − Level 1)0.693147267,765.302132.5886 × 10−61.000
    (Children and adolescents − Young children) * (No ASD − Level 1)2.8213790.949942.9700680.003
    (Adults − Young children) * (No ASD − Level 1)25.484907189,338.661081.3460 × 10−41.000
With or without psychiatric history * DSM-5 severity level of ASD:
    (Clinical setting − School setting) * (Level 2 − Level 1)−24.897120189,338.66068−1.3150 × 10−41.000
    (Clinical setting − School setting) * (Level 3 − Level 1)2.0794421.322881.5719100.116
    (Clinical setting − School setting) * (No ASD − Level 1)1.9740811.238281.5942140.111
Age group * Sex:
    (Children and adolescents − Young children) * (Male − Female)1.3217561.056721.2508050.211
    (Adults − Young children) * (Male − Female)25.708050189,338.661081.3578 × 10−41.000
With or without psychiatric history * Sex:
    (Clinical setting − School setting) * (Male − Female)1.7917591.290991.3878910.165
DSM-5 severity level of ASD * Sex:
    (Level 2 − Level 1) * (Male − Female)0.6286090.930950.6752340.500
    (Level 3 − Level 1) * (Male − Female)−4.4186 × 10−151.11803−3.9521 × 10−151.000
    (No ASD − Level 1) * (Male − Female)0.5877870.885060.6641200.507
Age group * With or without psychiatric history * DSM-5 severity level of ASD:
    (Children and adolescents − Young children) * (Clinical setting − School setting) * (Level 2 − Level 1)50.892852267,765.301901.9007 × 10−41.000
    (Adults − Young children) * (Clinical setting − School setting) * (Level 2 − Level 1)24.897120423,374.116405.8806 × 10−51.000
    (Children and adolescents − Young children) * (Clinical setting − School setting) * (Level 3 − Level 1)21.719066189,338.660831.1471 × 10−41.000
    (Adults − Young children) * (Clinical setting − School setting) * (Level 3 − Level 1)−2.079442378,677.32166−5.4913 × 10−61.000
    (Children and adolescents − Young children) * (Clinical setting − School setting) * (No ASD − Level 1)21.788059189,338.660831.1507 × 10−41.000
    (Adults − Young children) * (Clinical setting − School setting) * (No ASD − Level 1)−27.276666327,944.18045−8.3175 × 10−51.000
Age group * With or without psychiatric history * Sex:
    (Children and adolescents − Young children) * (Clinical setting − School setting) * (Male − Female)−2.708050267,765.30179−1.0114 × 10−51.000
    (Adults − Young children) * (Clinical setting − School setting) * (Male − Female)−27.094345327,944.18044−8.2619 × 10−51.000
Age group * DSM-5 severity level of ASD * Sex:
    (Children and adolescents − Young children) ✻ (Level 2 − Level 1) * (Male − Female)−0.0408221.47573−0.0276620.978
    (Adults − Young children) * (Level 2 − Level 1) * (Male − Female)−0.628609267,765.30227−2.3476 × 10−61.000
    (Children and adolescents − Young children) * (Level 3 − Level 1) * (Male − Female)−2.4203681.60035−1.5124020.130
    (Adults − Young children) * (Level 3 − Level 1) * (Male − Female)0.693147267,765.302142.5886 × 10−61.000
    (Children and adolescents − Young children) * (No ASD − Level 1) * (Male − Female)−1.5404451.24743−1.2348940.217
    (Adults − Young children) * (No ASD − Level 1) * (Male − Female)−51.192957267,765.30216−1.9119 × 10−41.000
With or without psychiatric history * DSM-5 severity level of ASD * Sex:
    (Clinical setting − School setting) * (Level 2 − Level 1) * (Male − Female)23.287682189,338.660691.2299 × 10−41.000
    (Clinical setting − School setting) * (Level 3 − Level 1) * (Male − Female)−0.2076391.68135−0.1234960.902
    (Clinical setting − School setting) * (No ASD − Level 1) * (Male − Female)−1.4632551.51658−0.9648420.335
Age group * With or without psychiatric history * DSM-5 severity level of ASD * Sex:
    (Children and adolescents − Young children) * (Clinical setting − School setting) * (Level 2 − Level 1) * (Male − Female)−24.568616327,944.18010−7.4917 × 10−51.000
    (Adults − Young children) * (Clinical setting − School setting) * (Level 2 − Level 1) * (Male − Female)−23.287682500,943.01009−4.6488 × 10−51.000
    (Children and adolescents − Young children) * (Clinical setting − School setting) * (Level 3 − Level 1) * (Male − Female)3.726620267,765.301791.3917 × 10−51.000
    (Adults − Young children) * (Clinical setting − School setting) * (Level 3 − Level 1) * (Male − Female)−0.485508463,783.10756−1.0468 × 10−61.000
    (Children and adolescents − Young children) * (Clinical setting − School setting) * (No ASD − Level 1) * (Male − Female)2.926739267,765.301791.0930 × 10−51.000
    (Adults − Young children) * (Clinical setting − School setting) * (No ASD − Level 1) * (Male − Female)52.068426463,783.107541.1227 × 10−41.000
Note: * The asterisk (*) symbol is used to denote an interaction between two categorical variables. This means that the analysis is not only examining the individual effects of each variable on the outcome but also how these variables work together to influence the outcome.
Disclaimer/Publisher’s Note: The statements, opinions and data contained in all publications are solely those of the individual author(s) and contributor(s) and not of MDPI and/or the editor(s). MDPI and/or the editor(s) disclaim responsibility for any injury to people or property resulting from any ideas, methods, instructions or products referred to in the content.

