

The Effect of Leisure Time Sport on Executive Functions in Danish 1st Grade Children


Abstract
:1. Introduction
1.1. Executive Functions
1.2. Leisure Time Sport and Executive Functions
1.3. Socio-Economic Status and Executive Functions
1.4. Objective
2. Materials and Methods
2.1. Study Design
2.2. Participants and Setting
2.2.1. Inclusion Criteria
2.2.2. Exclusion Criteria
2.2.3. Invitation
3. Data Collection
3.1. Baseline and Follow up Measurements
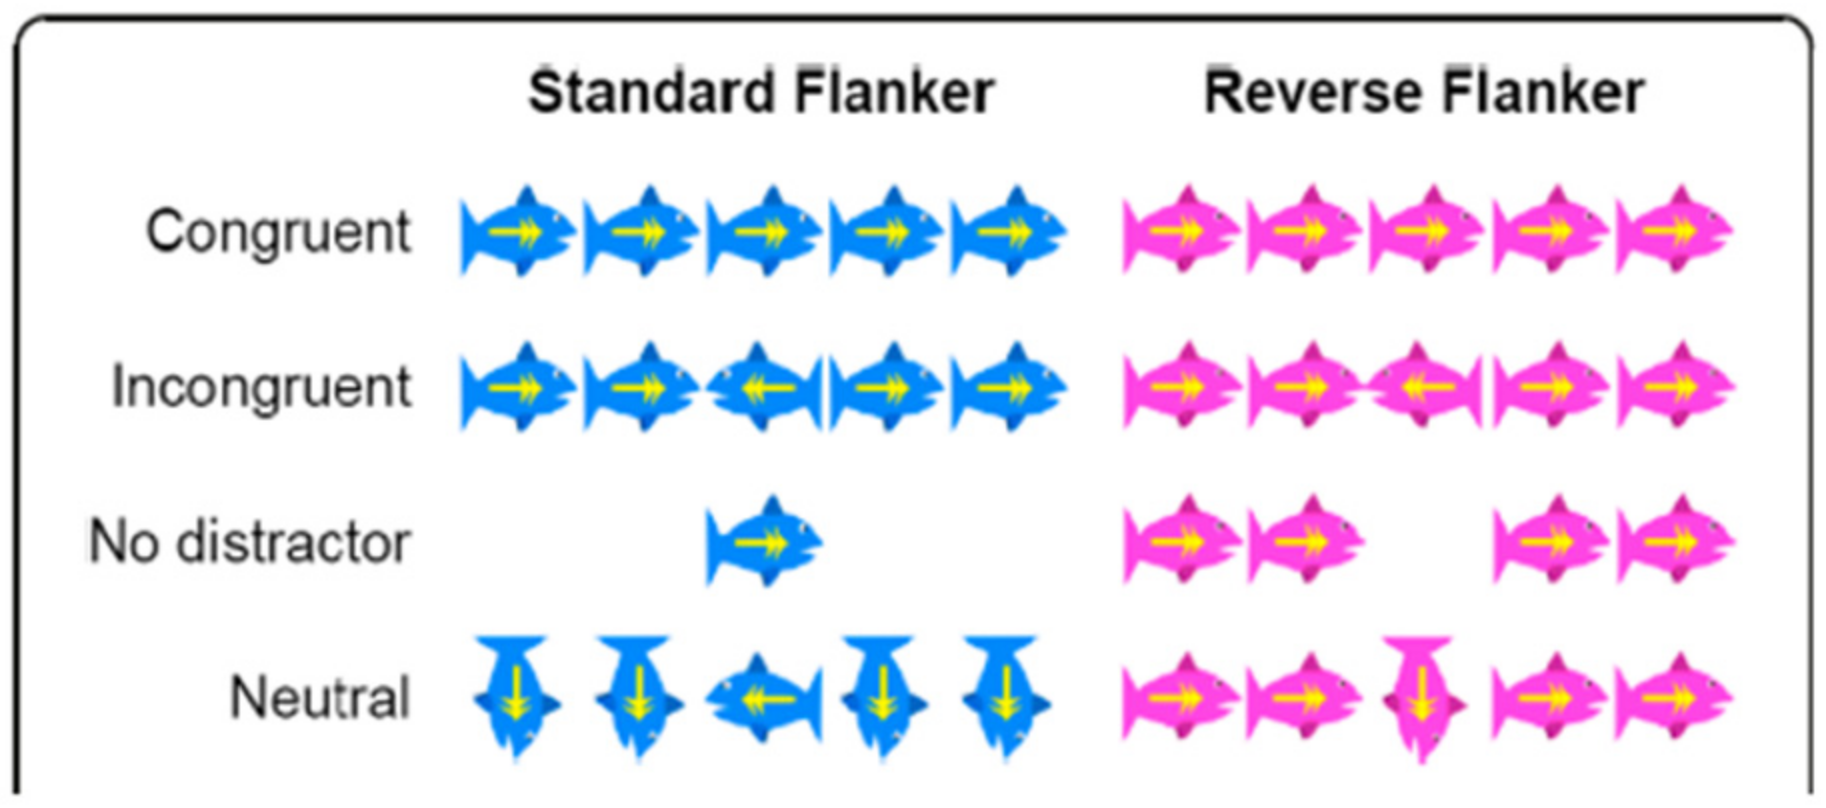
3.2. Flanker/Reverse Flanker
3.3. BRIEF Questionnaire
3.4. Leisure-Time Sport
3.5. Socio-Economic Status
4. Variables of Interest
5. Covariates, Possible Moderators, and Confounders
6. Blinding
7. Analyzes
7.1. Descriptives
7.2. Missing Data
7.3. Multivariate Analyzes
8. Results
8.1. Missing Data and Lost to Follow Up
8.2. Leisure Time Sport and Executive Functions
8.2.1. Overall
8.2.2. Kolding
8.2.3. Svendborg
8.3. Socio-Economy—A Confounder?
9. Discussion
9.1. Summary of Findings
9.2. Methodological Considerations
10. Conclusions
Author Contributions
Funding
Institutional Review Board Statement
Informed Consent Statement
Data Availability Statement
Conflicts of Interest
Appendix A. Short Message Service (SMS)-Tracking for Parents
- (1)
- ”How many times did NAME OF CHILD engage in sports during the last week”?
- (2)
- Which type of sports did NAME OF CHILD undertake?
- (3)
- How many times has NAME OF CHILD cycled to school in the last week?
References
- Gunnarsdottir, H.; Bjereld, Y.; Hensing, G.; Petzold, M.; Povlsen, L. Associations between parents’ subjective time pressure and mental health problems among children in the Nordic countries: A population based study. BMC Public Health 2015, 15, 353. [Google Scholar] [CrossRef] [PubMed]
- Abstracts of the IPOS 12th World Congress of Psycho-Oncology. May 25–29, 2010. Quebec City, QC, Canada. Psychooncology 2010, 19 (Suppl. 2), S1–S325. [CrossRef] [PubMed]
- Lindsay, A.; Sussner, K.; Kim, J.; Gortmaker, S. The Role of Parents in Preventing Childhood Obesity. Future Child. Cent. Future Child. David Lucile Packard Found. 2006, 16, 169–186. [Google Scholar] [CrossRef] [PubMed]
- Ornelas, I.J.; Perreira, K.M.; Ayala, G.X. Parental influences on adolescent physical activity: A longitudinal study. Int. J. Behav. Nutr. Phys. Act. 2007, 4, 3. [Google Scholar] [CrossRef]
- Chircop, A.; Shearer, C.; Pitter, R.; Sim, M.; Rehman, L.; Flannery, M.; Kirk, S. Privileging physical activity over healthy eating: ‘Time’ to Choose? Health Promot. Int. 2015, 30, 418–426. [Google Scholar] [CrossRef]
- Eaton, D.; Kann, L.; Kinchen, S.; Shanklin, S.; Ross, J.; Hawkins, J.; Harris, W.; Lowry, R.; McManus, T.; Chyen, D.; et al. Youth risk behavior surveillance—United States, 2009. MMWR Surveill. Summ. 2010, 59, 1–142. [Google Scholar]
- Li, C.; Cheng, G.; Sha, T.; Cheng, W.; Yan, Y. The Relationships between Screen Use and Health Indicators among Infants, Toddlers, and Preschoolers: A Meta-Analysis and Systematic Review. Int. J. Environ. Res. Public Health 2020, 17, 7324. [Google Scholar] [CrossRef]
- Kappos, A.D. The impact of electronic media on mental and somatic children’s health. Int. J. Hyg. Environ. Health 2007, 210, 555–562. [Google Scholar] [CrossRef]
- Hale, L.; Guan, S. Screen time and sleep among school-aged children and adolescents: A systematic literature review. Sleep Med. Rev. 2015, 21, 50–58. [Google Scholar] [CrossRef]
- Guerrero, M.A.-O.; Barnes, J.D.; Chaput, J.P.; Tremblay, M.S. Screen time and problem behaviors in children: Exploring the mediating role of sleep duration. Int. J. Behav. Nutr. Phys. Act. 2019, 16, 1–10. [Google Scholar] [CrossRef]
- Astill, R.G.; Van der Heijden, K.B.; Van Ijzendoorn, M.H.; Van Someren, E.J. Sleep, cognition, and behavioral problems in school-age children: A century of research meta-analyzed. Psychol. Bull. 2012, 138, 1109–1138. [Google Scholar] [CrossRef] [Green Version]
- Page, A.S.; Cooper, A.R.; Griew, P.; Jago, R. Children’s screen viewing is related to psychological difficulties irrespective of physical activity. Pediatrics 2010, 126, e1011-7. [Google Scholar] [CrossRef]
- Hamer, M.; Stamatakis, E.; Mishra, G. Psychological distress, television viewing, and physical activity in children aged 4 to 12 years. Pediatrics Neonatol. 2009, 123, 1263–1268. [Google Scholar] [CrossRef]
- Alesi, M.; Bianco, A.; Luppina, G.; Palma, A.; Pepi, A. Improving Children’s Coordinative Skills and Executive Functions: The Effects of a Football Exercise Program. Percept. Mot. Ski. 2016, 122, 27–46. [Google Scholar] [CrossRef]
- Diamond, A.; Ling, D.S. Conclusions about interventions, programs, and approaches for improving executive functions that appear justified and those that, despite much hype, do not. Dev. Cogn. Neurosci. 2016, 18, 34–48. [Google Scholar] [CrossRef]
- Diamond, A. Executive Functions. Annu. Rev. Psychol. 2013, 64, 135–168. [Google Scholar] [CrossRef]
- Hart, S.; Lindahl Jacobsen, S. Zones of Proximal Emotional Development—Psychotherapy Within a Neuroaffective Perspective. J. Infant Child Adolesc. Psychother. 2018, 17, 28–42. [Google Scholar] [CrossRef]
- Roberts, C.K.; Freed, B.; McCarthy, W.J. Low aerobic fitness and obesity are associated with lower standardized test scores in children. J. Pediatrics 2010, 156, 711–718.e1. [Google Scholar] [CrossRef]
- Åberg, M.A.; Pedersen, N.L.; Torén, K.; Svartengren, M.; Bäckstrand, B.; Johnsson, T.; Cooper-Kuhn, C.M.; Åberg, N.D.; Nilsson, M.; Kuhn, H.G. Cardiovascular fitness is associated with cognition in young adulthood. Proc. Natl. Acad. Sci. USA 2009, 106, 20906–20911. [Google Scholar] [CrossRef]
- Chaddock, L.; Pontifex, M.B.; Hillman, C.H.; Kramer, A.F. A Review of the Relation of Aerobic Fitness and Physical Activity to Brain Structure and Function in Children. J. Int. Neuropsychol. Soc. 2011, 17, 975–985. [Google Scholar] [CrossRef]
- Berchicci, M.; Pontifex, M.B.; Drollette, E.S.; Pesce, C.; Hillman, C.H.; Di Russo, F. From cognitive motor preparation to visual processing: The benefits of childhood fitness to brain health. Neuroscience 2015, 298, 211–219. [Google Scholar] [CrossRef]
- Castelli, D.M.; Hillman, C.H.; Buck, S.M.; Erwin, H.E. Physical fitness and academic achievement in third- and fifth-grade students. J. Sport Exerc. Psychol. 2007, 29, 239–252. [Google Scholar] [CrossRef]
- Grissom, J. A Study of the Relationship Between Physical Fitness and Academic Achievement in California Using 2004 Test Results; Department of Education, State of California: Sacramento, CA, USA, 2005. [Google Scholar]
- Dwyer, T.; Coonan, W.E.; Leitch, D.R.; Hetzel, B.S.; Baghurst, R.A. An investigation of the effects of daily physical activity on the health of primary school students in South Australia. Int. J. Epidemiol. 1983, 12, 308–313. [Google Scholar] [CrossRef]
- Davis, C.L.; Cooper, S. Fitness, fatness, cognition, behavior, and academic achievement among overweight children: Do cross-sectional associations correspond to exercise trial outcomes? Prev. Med. 2011, 52 (Suppl. 1), S65–S69. [Google Scholar] [CrossRef]
- Buck, S.M.; Hillman Ch Fau-Castelli, D.M.; Castelli, D.M. The relation of aerobic fitness to stroop task performance in preadolescent children. Med. Sci. Sports Exerc. 2008, 40, 166–172. [Google Scholar] [CrossRef]
- Syväoja, H.J.; Tammelin, T.H.; Ahonen, T.; Kankaanpää, A.; Kantomaa, M.T. The associations of objectively measured physical activity and sedentary time with cognitive functions in school-aged children. PLoS ONE 2014, 9, e103559. [Google Scholar] [CrossRef]
- Pontifex, M.B.; Scudder, M.R.; Drollette, E.S.; Hillman, C.H. Fit and vigilant: The relationship between poorer aerobic fitness and failures in sustained attention during preadolescence. Neuropsychology 2012, 26, 407–413. [Google Scholar] [CrossRef]
- Scudder, M.R.; Lambourne, K.; Drollette, E.S.; Herrmann, S.D.; Washburn, R.A.; Donnelly, J.E.; Hillman, C.H. Aerobic Capacity and Cognitive Control in Elementary School-Age Children. Med. Sci. Sports Exerc. 2014, 46, 1025–1035. [Google Scholar] [CrossRef]
- Scudder, M.R.; Khan, N.A.; Lambourne, K.; Drollette, E.S.; Herrmann, S.D.; Betts, J.L.; Washburn, R.A.; Donnelly, J.E.; Hillman, C.H. Cognitive control in preadolescent children with risk factors for metabolic syndrome. Health Psychol. 2015, 34, 243–252. [Google Scholar] [CrossRef]
- Wu, C.T.; Pontifex, M.B.; Raine, L.B.; Chaddock, L.; Voss, M.W.; Kramer, A.F.; Hillman, C.H. Aerobic fitness and response variability in preadolescent children performing a cognitive control task. Neuropsychology 2011, 25, 333–341. [Google Scholar] [CrossRef]
- Kopp, B. A simple hypothesis of executive function. Front. Hum. Neurosci. 2012, 6, 159. [Google Scholar] [CrossRef] [PubMed] [Green Version]
- LF, K. The Myth of Executive Functioning—Missing Elements in Conceptualization, Evaluation, and Assessment; Springer International Publishing: Basel, Switzerland, 2014. [Google Scholar]
- Miyake, A.; Friedman, N.P.; Emerson, M.J.; Witzki, A.H.; Howerter, A.; Wager, T.D. The unity and diversity of executive functions and their contributions to complex “Frontal Lobe” tasks: A latent variable analysis. Cogn. Psychol. 2000, 41, 49–100. [Google Scholar] [CrossRef] [PubMed]
- Larsen, L.R.; Kristensen, P.L.; Junge, T.; Rexen, C.T.; Wedderkopp, N. Motor Performance as Predictor of Physical Activity in Children: The CHAMPS Study-DK. Med. Sci. Sports Exerc. 2015, 47, 1849–1856. [Google Scholar] [CrossRef] [PubMed]
- Hillman, C.H.; Biggan, J.R. A Review of Childhood Physical Activity, Brain, and Cognition: Perspectives on the Future. Pediatr. Exerc. Sci. 2017, 29, 170–176. [Google Scholar] [CrossRef]
- Hillman, C.H.; Pontifex, M.B.; Castelli, D.M.; Khan, N.A.; Raine, L.B.; Scudder, M.R.; Drollette, E.S.; Moore, R.D.; Wu, C.T.; Kamijo, K. Effects of the FITKids Randomized Controlled Trial on Executive Control and Brain Function. Pediatrics 2014, 134, e1063–e1071. [Google Scholar] [CrossRef]
- Van Praagh, H.; CBSejnowski, T.J.; Gage, F.H. Running enhances neurogenesis, learning, and long-term potentiation in mice. Proc. Natl. Acad. Sci. USA 1999, 96, 13427–13431. [Google Scholar] [CrossRef]
- Mengia, S.R.-P.; Friedman, D.; Donoghue, J.P. Learning-Induced LTP in Neocortex. Science 2000, 290, 533–536. [Google Scholar]
- Johnston, M.V. Plasticity in the developing brain: Implications for rehabilitation. Dev. Diasabilities Res. Rev. 2009, 15, 94–101. [Google Scholar] [CrossRef]
- Liu, P.Z.; Nusslock, R. Exercise-Mediated Neurogenesis in the Hippocampus via BDNF. Front. Neurosci. 2018, 12, 52. [Google Scholar] [CrossRef]
- Phillips, C. Neuroprotective effects of physical activity on the brain: A closer look at trophic factor signaling. Front. Cell. Neurosci. 2014, 8, 170. [Google Scholar] [CrossRef]
- Gomez-Pinilla, F.; Hillman, C. The Influence of Exercise on Cognitive Abilities. Compr. Physiol. 2013, 3, 403–428. [Google Scholar]
- Davis, C.L.; Tomporowski, P.D.; McDowell, J.E.; Austin, B.P.; Miller, P.H.; Yanasak, N.E.; Allison, J.D.; Naglieri, J.A. Exercise Improves Executive Function and Achievement and Alters Brain Activation in Overweight Children: A Randomized, Controlled Trial. Health Psychol 2011, 30, 91–98. [Google Scholar] [CrossRef]
- Yuan, P.; Raz, N. Prefrontal Cortex and Executive Functions in Healthy Adults: A Meta-Analysis of Structural Neuroimaging Studies. Neurosci Biobehav Rev. 2014, 42, 180–192. [Google Scholar] [CrossRef] [Green Version]
- Fredericks, C.R.; Kokot, S.J.; Krog, S. Using a developmental movement programme to enhance academic skills in grade 1 learners. J. S. Afr. J. Res. Sport Phys. Educ. 2006, 28, 29–42. [Google Scholar] [CrossRef]
- Rathore, A.A.-O.; Lom, B. The effects of chronic and acute physical activity on working memory performance in healthy participants: A systematic review with meta-analysis of randomized controlled trials. Syst. Rev. 2017, 6, 1–16. [Google Scholar] [CrossRef]
- de Greeff, J.W.; Bosker, R.J.; Oosterlaan, J.; Visscher, C.; Hartman, E. Effects of physical activity on executive functions, attention and academic performance in preadolescent children: A meta-analysis. J. Sci. Med. Sport 2018, 21, 501–507. [Google Scholar] [CrossRef]
- Have, M.; Nielsen, J.H.; Ernst, M.T.; Gejl, A.K.; Fredens, K.; Grontved, A.; Kristensen, P.L. Classroom-based physical activity improves children’s math achievement—A randomized controlled trial. PLoS ONE 2018, 13, e0208787. [Google Scholar] [CrossRef]
- Hebert, J.J.; Moller, N.C.; Andersen, L.B.; Wedderkopp, N. Organized Sport Participation Is Associated with Higher Levels of Overall Health-Related Physical Activity in Children (CHAMPS Study-DK). PLoS ONE 2015, 10, e0134621. [Google Scholar] [CrossRef]
- Møller, N.C.; Tarp, J.; Kamelarczyk, E.F.; Brønd, J.C.; Klakk, H.; Wedderkopp, N. Do extra compulsory physical education lessons mean more physically active children—Findings from the childhood health, activity, and motor performance school study Denmark (The CHAMPS-study DK). Int. J. Behav. Nutr. Phys. Act. 2014, 11, 121. [Google Scholar] [CrossRef]
- Sirin, S. Socioeconomic Status and Academic Achievement: A Meta-Analytic Review of Research. Rev. Educ. Res. 2005, 75, 417–453. [Google Scholar] [CrossRef]
- Bugge, A.; Moller, S.; Tarp, J.; Hillman, C.H.; Lima, R.A.; Gejl, A.K.; Klakk, H.; Wedderkopp, N. Influence of a 2- to 6-year physical education intervention on scholastic performance: The CHAMPS study-DK. Scand. J. Med. Sci. Sports 2018, 28, 228–236. [Google Scholar] [CrossRef]
- Undervisningsministeriet. Vejledning om de Nationale Test–til Lærere i alle Fag; Undervisningsministeriet/Ministry of Education: Copenhagen, Denmark, 2018; p. 32. [Google Scholar]
- Domazet, S.L.; Tarp, J.; Huang, T.; Gejl, A.K.; Andersen, L.B.; Froberg, K.; Bugge, A. Associations of Physical Activity, Sports Participation and Active Commuting on Mathematic Performance and Inhibitory Control in Adolescents. PLoS ONE 2015, 11, e0146319. [Google Scholar] [CrossRef]
- Cheron, C.; Leboeuf-Yde, C.; Le Scanff, C.; Jespersen, E.; Rexen, C.T.; Franz, C.; Wedderkopp, N. Leisure-time sport and overuse injuries of extremities in children age 6–13, a 2.5 years prospective cohort study: The CHAMPS-study DK. BMJ Open 2017, 7, e012606. [Google Scholar] [CrossRef] [Green Version]
- Twisk, J.W. Applied Longitudinal Data Analysis for Epidemiology: A Practical Guide; Cambridge University Press: Cambridge, UK, 2013. [Google Scholar]
- Have, M.; Nielsen, J.H.; Gejl, A.K.; Thomsen Ernst, M.; Fredens, K.; Støckel, J.T.; Wedderkopp, N.; Domazet, S.L.; Gudex, C.; Grøntved, A.; et al. Rationale and design of a randomized controlled trial examining the effect of classroom-based physical activity on math achievement. BMC Public Health 2016, 16, 304. [Google Scholar] [CrossRef]
- Eriksen, B.A.; Eriksen, C.W. Effects of noise letters upon the identification of a target letter in a nonsearch task. Percept. Psychophys. 1974, 16, 143–149. [Google Scholar] [CrossRef]
- Schonert-Reichl, K.A.; Oberle, E.; Lawlor, M.S.; Abbott, D.; Thomson, K.; Oberlander, T.F.; Diamond, A. Enhancing Cognitive and Social-Emotional Development Through a Simple-to-Administer Mindfulness-Based School Program for Elementary School Children: A Randomized Controlled Trial. Dev. Psychol. 2015, 51, 52–66. [Google Scholar] [CrossRef]
- Nielsen, M. The effect of classroom based physical activity on cognition and academic achievement. 2016. [Google Scholar]
- Gioia, G.A.; Espy, K.A.; Isquith, P.K. BRIEF-F; Hogrefe: Boston, MA, USA, 2005. [Google Scholar]
- SMS-Track sms-track.com/Products. Available online: https://sms-track.com/Products.aspx (accessed on 6 December 2018).
- Ministry of Higher Education and Science. Dansk-Engelsk Uddannelsesterminologi; Uddannelses- og Forskningsministeriet; Styrelsen for Forskning og Uddannelse/Ministry of Higher Education and Science: Copenhagen, Denmark, 2017. [Google Scholar]
- Mullender-Wijnsma, M.J.; Hartman, E.; de Greeff, J.W.; Doolaard, S.; Bosker, R.J.; Visscher, C. Physically Active Math and Language Lessons Improve Academic Achievement: A Cluster Randomized Controlled Trial. Pediatrics 2016, 137, 1–9. [Google Scholar] [CrossRef]
- Fedewa, A.L.; Ahn, S. The effects of physical activity and physical fitness on children’s achievement and cognitive outcomes:a meta-analysis. Res. Q. Exerc. Sport 2011, 82, 521–535. [Google Scholar] [CrossRef]
- Clark, J.M.; Paivio, A. Dual coding theory and education. Educ. Psychol. Rev. 1991, 3, 149–210. [Google Scholar] [CrossRef]
- Holdsport Største Sportsgrene i Danmark: Nye Medlemstal Fra. 2017. Available online: https://www.holdsport.dk/da/artikler/storste-sportsgrene-i-danmark-2017 (accessed on 29 December 2018).
- Sjowall, D.; Hertz, M.; Klingberg, T. No Long-Term Effect of Physical Activity Intervention on Working Memory or Arithmetic in Preadolescents. Front. Psychol. 2017, 8, 1342. [Google Scholar] [CrossRef]
- Hsieh, S.S.; Fung, D.; Tsai, H.; Chang, Y.K.; Huang, C.J.; Hung, T.M. Differences in working memory as a function of physical activity in children. Am. Psychol. Assoc. 2018, 32, 797–808. [Google Scholar] [CrossRef] [PubMed]
- Vazou, S.; Pesce, C.; Lakes, K.; Smiley-Oyen, A. More than one road leads to Rome: A narrative review and meta-analysis of physical activity intervention effects on cognition in youth. Int. J. Sport Exerc. Psychol. 2016, 17, 153–178. [Google Scholar] [CrossRef] [PubMed]
- Hillman, C.H.; Snook, E.M.; Jerome, G.J. Acute cardiovascular exercise and executive control function. Int. J. Psychophysiol. 2003, 48, 307–314. [Google Scholar] [CrossRef]
- Kao, S.C.; Westfall, D.R.; Soneson, J.; Gurd, B.; Hillman, C.H. Comparison of the acute effects of high-intensity interval training and continuous aerobic walking on inhibitory control. Psychophysiology 2017, 54, 1335–1345. [Google Scholar] [CrossRef]
- Chaddock, L.; Hillman, C.H.; Pontifex, M.B.; Johnson, C.R.; Raine, L.B.; Kramer, A.F. Childhood aerobic fitness predicts cognitive performance one year later. J Sports Sci 2012, 30, 421–430. [Google Scholar] [CrossRef]
- McAuley, T.; Chen, S.; Goos, L.; Schachar, R.; Crosbie, J. Is the behavior rating inventory of executive function more strongly associated with measures of impairment or executive function? J. Int. Neuropsychol. Soc. 2010, 16, 495–505. [Google Scholar] [CrossRef]


| Kolding | Svendborg | All | |
|---|---|---|---|
| Mean (95% CI) n | Mean (95% CI) n | Mean (95% CI) n | |
| Baseline | Baseline | Baseline | |
| Variable/Gruppe | |||
| n | 187–232 | 177–230 | 384–505 |
| Age (year) | 7.2 (7.2–7.3) n = 230 | 7.2 (7.2–7.2) (n = 229) | 7.2 (7.2–7.3) (n = 495) |
| Gender (%boys) | 47.41% n = 232 | 51.74% (n = 230) | 49.50% (n = 505) |
| Highest Parental Education Denoted as social categori | Soc.cat 1: 3.46% Soc.cat 2: 0% Soc.cat 3: 27.71% Soc.cat 4: 37.23% Soc.cat 5: 27.71% Missing: 3.90% | ||
| ANTHROPOMETRIC MEASURES | |||
| Height (cm) | 126.9 (126.2–127.6) n = 224 | 126.8 (126.1–127.5) (n = 227) | 126.7 (126.2–127.2) (n = 485) |
| Weight (kg) | 25.9 (25.3–26.6) n = 224 | 25.8 (25.2–26.3) (n = 227) | 25.7 (25.3–26.1) (n = 485) |
| BMI (kg/m2) | 16.1 (15.7–16.3) n = 224 | 15.9 (15.7–16.2) (n = 227) | 15.9 (15.7–16.1) (n = 485) |
| FLANKER | |||
| Congruent reaction time (ms) | 1381.51 (1337.37–1425.65) (n = 225) | 1374.38 (1326.51–1422.25) (n = 220) | 1374.94 (1343.01–1406.86) (n = 478) |
| Incongruent reaction time (ms) | 1759.09 (1703.25–1814.93) (n = 225) | 1755.17 (1698.45–1811.90) (n = 220) | 1751.68 (1712.90–1790.46) (n = 478) |
| Congruent accuracy (%) | 95.00 (94.00–96.00) (n = 225) | 93.56 (91.78–95.34) (n = 220) | 93.93 (92.88–94.99) (n = 478) |
| Incongruent accuracy (%) | 77.61 (75.74–79.48) (n = 225) | 75.00 (72.67–77.33) (n = 220) | 76.27 (74.81–77.73) (n = 478) |
| BRIEF | |||
| Inhibition | 15.12 (14.63–15.61) (n = 187) | 14.85 (14.36–15.35) (n = 177) | 15.04 (14.70–15.38) (n = 384) |
| Shift | 11.71 (11.29–12.15) (n = 187) | 11.73 (11.32–12.14) (n = 177) | 11.80 (11.51–12.09) (n = 384) |
| Emotional control | 16.44 (15.86–17.03) (n = 187) | 15.77 (15.20–16.34) (n = 177) | 16.17 (15.77–16.57) (n = 384) |
| Initiate | 12.51 (12.15–12.87) (n = 187) | 12.42 (12.03–12.82) (n = 177) | 12.5 (12.24–12.76) (n = 384) |
| Working memory | 16.32 (15.69–16.95) (n = 187) | 15.94 (15.34–16.53) (n = 177) | 16.21 (15.78–16.63) (n = 384) |
| Plan and organization | 17.67 (16.94–18.41) (n = 187) | 17.04 (16.32–17.76) (n = 177) | 17.48 (16.98–17.97) (n = 384) |
| Organization of materials | 12.29 (11.85–12.72) (n = 187) | 12.01 (11.56–12.45) (n = 177) | 12.19 (11.88–12.49) (n = 384) |
| Monitor | 12.82 (12.34–13.31) (n = 187) | 12.63 (12.19–13.08) (n = 177) | 12.79 (12.47–13.11) (n = 384) |
| Behavioral regulation index (BRI) (overall) | 43.20 (41.90–44.50) (n = 187) | 42.21 (40.94–43.49) (n = 177) | 42.92 (42.03–43.81) (n = 384) |
| Metacognition index (MCI) (Overall) | 70.16 (67.53–72.78) (n = 187) | 68.21 (65.53–70.89) (n = 177) | 69.61 (67.79–71.43) (n = 384) |
| Global executive composite (GEC) | 112.20 (108.16–116.24) (n = 187) | 108.75 (104.43–113.07) (n = 177) | 111.20 (108.34–114.05) (n = 384) |
| Full Follow-Up vs. Non Full Fullow-Up | ||||||||
|---|---|---|---|---|---|---|---|---|
| Variable/Group | Kolding | Svendborg | ||||||
| Baseline Characteristics for Those with Full Follow up | Baseline Characteristics for Those with Missing Data or Lost to Follow up | Differences (SE) (95% CI) | p for Difference | Baseline Characteristics for Those with Full Follow up | Baseline Characteristics for Those with Missing Data or Lost to Follow up | Differences (SE) (95% CI) | p for Difference | |
| ANTHROPOMETRIC MEASURES | ||||||||
| Age (year) | 7.25 (7.21–7.30) n = 215 | 7.15 (6.97–7.33) n = 9 | −0.11 (−0.35–0.13) | 0.383 | 7.20 (7.16–7.24) n = 216 | 7.14 (6.92–7.36) n = 11 | −0.06 (−0.25–0.13) | 0.518 |
| Gender (%boys) | 46.12% | 45.69% | 0.43% percentage point | 0.954 | 50.65% | 47.19% | 3.46 percentage point | 0.850 |
| Height (cm) | 126.87 (126.12–127.62) n = 215 | 127.31 (126.12–132.53) n = 9 | 0.44 (−3.33–4.21) | 0.818 | 126.83 (126.05–127.52) n = 216 | 125.99 (124.14–127.85) n = 11 | −0.84 (2.80–1.12) | 0.377 |
| Weight (kg) | 25.87 (25.23–26.51) n = 215 | 27.29 (22.98–31.60) n = 9 | 1.42 (−1.79–4.63) | 0.384 | 25.78 (25.17–26.38) n = 216 | 25.49 (23.93–27.05) n = 11 | −0.29 (−1.93–1.36) | 0.715 |
| BMI (kg/m2) | 15.98 (15.71–16.25) n = 215 | 16.70 (15.00–18.40) n = 9 | 0.72 (−0.64–2.07) | 0.298 | 15.94 (15.68–16.21) n = 216 | 16.05 (15.21–16.88) n = 11 | 0.10 (−1.10–1.31) | 0.865 |
| FLANKER | ||||||||
| Congruent reaction time (ms) | 1379.01 (1332.66–1425.36) n = 209 | 1414.17 (1261.13–1567.21) n = 16 | 35.16 (−136.90–207.22) | 0.688 | 1412 (CI 1342.68–1468.83) n = 129 | 1262.55 (CI 1076.42–1372.16) n = 42 | *149.45 | 0.9213 |
| Incongruent reaction time (ms) | 1754.29 (1695.64–1812.94) n = 209 | 1821.78 (1630.82–2012.74) n = 16 | 67.49 (−150.09–285.07) | 0.542 | 1754.13 (CI 1704.89–1821.52) n = 129 | 1711.90 (CI 1429.14–1845.42) n = 42 | *42.23 | 0.4815 |
| Congruent accuracy (%) | 100 (CI 91.67–100) n = 111 | 100 (CI 91.67–100) n = 72 | *0 | 0.564 | 100 (CI 100–100) n = 129 | 100 (CI 91.67–100) n = 42) | *0 | 0.1162 |
| Incongruent accuracy (%) | 81.25 (CI 75–81.25) n = 111 | 81.25 (CI 75–87.5) n = 72 | *0 | 0.841 | 81.25 (CI75–81.25) n = 129 | 71.88 (CI 62.5–81.25) n = 42 | *9.37 | 0.162 |
| BRIEF | ||||||||
| Inhibition | 14 (CI 14–15) n = 114 | 15 (CI 14–16.82) n = 72 | *1 | 0.156 | 14 (CI 13.78–15) n = 131 | 17 (CI 15–18) n = 45 | *3 | 0.000 |
| Shift | 11 (CI 10–12) n = 114 | 12 (CI (11–12.82) n = 72 | *1 | 0.441 | 11.45 (11.00–11.91) n = 132 | 12.53 (11.65–13.42) n = 45 | 1.08 (0.15–2.00) | 0.023 |
| Emotional control | 16 (CI 15–17) n = 114 | 16 (CI 16–18.40) n = 73 | *0 | 0.361 | 16 (CI 14–16) n = 132 | 17 (CI 15–18.61) n = 45 | *1 | 0.077 |
| Initiate | 12.28 (11.82–12.74) n = 114 | 12.86 (12.29–13.43) n = 73 | 0.58 (−0.15–1.31) | 0.118 | 12 (CI 12–13) n = 132 | 13 (CI 11–13) n = 45 | *1 | 0.507 |
| Working memory | 16 (CI 14–17) n = 114 | 17 (CI 16–18) n = 72 | *1 | 0.180 | 15 (CI 14–16) n = 132 | 17 (CI 16–19) n = 45 | *2 | 0.000 |
| Plan and organization | 17 (CI 16–18) n = 111 | 19 (CI 17–20) n = 70 | *2 | 0.100 | 17 (CI 16–18) n = 129 | 19 (CI 17–21) n = 42) | *2 | 0.006 |
| Organization of materials | 12.24 (11.70–12.77) n = 114 | 12.37 (11.62–13.12) n = 73 | 0.13 (−0.76–1.03) | 0.770 | 11.85 (11.32–12.38) n = 132 | 12.47 (11.62–13.31) n = 45 | 0.62 (−0.40–1.64) | 0.2347 |
| Monitor | 13 (CI 12–14) n = 114 | 13 (CI 12–14) n = 71 | *1 | 0.418 | 12 (CI 12–13) n = 132 | 14 (CI 13–15) n = 45 | *2 | 0.001 |
| Behavioral regulation index (BRI) (overall) | 42.78 (41.25–44.31) n = 114 | 44.47 (42.43–46.51) n = 72 | 1.69 (−0.81–4.19) | 0.184 | 41 (CI 39–43) n = 131 | 45 (CI 42–49.61) n = 45 | *4 | 0.003 |
| Metacognition index (MCI) (Overall) | 71.29 (68.90–73.68) n = 111 | 74.37 (71.09–77.65) n = 70 | 3.08 (−0.87–7.03) | 0.125 | 68.75 (66.65–70.85) n = 129 | 76.29 (71.89–80.68) n = 42 | 7.53 (3.12–11.95) | 0.001 |
| Global executive composite (GEC) | 114.15 (110.60–117.71) n = 111 | 118.73 (113.96–123.50) n = 70 | 4.58 (−1.25–10.40) | 0.123 | 110.34 (107.24–113.43) n = 128 | 122.05 (115.36–128.73) n = 42 | 11.71 (3.32) (5.15–18.27) | 0.001 |
| Kolding | Svendborg | All | |
|---|---|---|---|
| LTS Mean (p-Value) (95% CI) | LTS Mean (p-Value) (95% CI) | LTS Mean (p-Value) (95% CI) | |
| BRIEF | (n = 101) | (n = 107) | (n = 213) |
| Inhibition | (1) −0.56 (p = 0.399) (−1.86–0.74) (2) −0.63 (p = 0.385) (−2.06–0.80) (3) −1.90 (p = 0.126) (−4.33–0.53) | (1) −0.74 (p = 0.236) (−1.95–0.48) (2) −0.11 (p = 0.883) (−1.54–1.33) (3) −0.33 (p = 0.770) (−2.62–1.95) | (1) −0.59 (p = 0.190) (−1.46–0.29) (2) −0.36 (p = 0.476) (−1.34–0.63) (3) −0.91 (p = 0.283) (−2.58–0.75) |
| Shifting | (1) −0.96 (p = 0.146) (−2.15–0.32) (2) −1.36 (p = 0.051) (−2.72–0.01) (3) −1.73 (p = 0.155) (−4.12–0.65) | (1) −0.01 (p = 0.985(−1.03–1.01) (2) 0.41 (p = 0.510) (−0.81–1.64) (3) 0.28 (p = 0.770) (−1.61–2.17) | (1) −0.23 (p = 0.565) (−1.02–0.56) (2) −0.48 (p = 0.292) (−1.36–0.41) (3) −0.51 (p = 0.510) (−2.02–1.00) |
| Emotional control | (1) −1.59 (p = 0.048) (−3.17–−0.01) (2) −1.22 (p = 0.173) (−2.97–0.53) (3) −3.45 (p = 0.028) (−6.53–−0.37) Test for trend −0.63 (p = 0.099) (−1.39–0.12) | (1) −0.77 (p = 0.291) (−2.19–0.65) (2) 0.36 (p = 0.675) (−2.02–1.31) (3) 0.07 (p = 0.958) (−2.60–2.74) | (1) −0.97 (p = 0.071) (−2.03–0.08) (2) −0.62 (p = 0.304) (−1.80–0.56) (3) −1.42 (p = 0.174) (−3.46–0.62) |
| Initiate | (1) −1.61 (p = 0.010) (−2.83–0.39) (2) −2.49 (p = 0.000) (−3.86–−1.13) (3) −3.11 (p = 0.009) (−5.45–−0.77) Test for trend −1.09 (p = 0.000) (−1.66–−0.52) | (1) −0.07 (p = 0.189) (−1.80–0.36) (2) −0.91 (p = 0.161) (−2.17–0.36) (3) 0.46 (p = 0.663) (−2.51–1.60) | (1) −0.96 (p = 0.020) (−1.78–−0.15) (2) −1.45 (p = 0.002) (−2.36–−0.54) (3) −1.62 (p = 0.043) (−3.18–−0.05) Test for trend −0.61 (p = 0.002) (−0.99–−0.22) |
| Working memory | (1) −1.95 (p = 0.008) (−3.39–−0.50) (2) −2.01 (p = 0.011) (−3.66–−0.47) (3) −4.46 (p = 0.001) (−7.20–−1.73) Test for trend −1.03 (p = 0.003) (−1.71–−0.36) | (1) −1.31 (p = 0.040) (−2.56–−0.06) (2) −1.51 (p = 0.045) (−3.00–−0.03) (3) −2.56 (p = 0.031) (−4.88–−0.24) Test for trend −0.74 (p = 0.019) (−1.35–−0.12) | (1) −1.36 (p = 0.005) (−2.31–−0.41) (2) −1.85 (p = 0.001) (−2.92–−0.78) (3) −3.16 (p = 0.001) (−4.97–−1.35) Test for trend −0.90 (p = 0.000) (−1.35–−0.45) |
| Plan & Organization | (1) 0.78 (p = 0.490) (−1.44–3.00) (2) 1.29 (p = 0.303) (−1.17–3.76) (3) −1.34 (p = 0.539) (−5.62–2.94) | (1) −1.58 (p = 0.114(−3.55–0.38) (2) −0.22 (p = 0.849) (−2.54–2.09) (3) −0.50 (p = 0.788) (−4.18–3.17) | (1) −0.37 (p = 0.628) (−1.85–−1.12) (2) −0.06 (p = 0.939) (−1.73–1.60) (3) −0.82 (p = 0.575) (−3.68–2.04) |
| Organising og materials | (1) −1.33 (p = 0.028) (−2.52–−0.14) (2) −0.95 (p = 0.165) (−2.29–0.39) (3) −1.83 (p = 0.120) (−4.14–0.48) Test for trend −0.36 (p = 0.222) (−0.94–0.22) | (1) −0.62 (p = 0.272(−1.72–0.49) (2) −0.32 (p = 0.629) (−1.62–0.98) (3) −0.63 (p = 0.559) (−2.73–1.48) | (1) −0.90 (p = 0.030) (−1.72–−0.09) (2) −0.74 (p = 0.115) (−1.65–0.18) (3) −1.02 (p = 0.205) (−2.60–0.56) |
| Monitor | (1) −0.72 (p = 0.259) (−1.98–0.53) (2) −0.24 (p = 0.735) (−1.66–1.17) (3) −2.02 (p = 0.096) (−4.40–0.36) | (1) −1.61 (p = 0.004) (−2.72–−0.50) (2)−1.42 (p = 0.032) (−2.71–−0.12) (3) −0.68 (p = 0.519(−2.77–1.40) Test for trend −0.37 (p = 0.191) (−0.93–0.18) | (1) −1.00 (p = 0.019) (−1.84–−0.17) (2) −0.98 (p = 0.043) (−1.92–−0.03) (3) −0.99 (p = 0.222) (−2.58–0.60) Test for trend −0.34 (p = 0.096) (−0.74–0.06) |
| Behavior regulation index | (1) −2.97 (p = 0.071) (−6.19–0.25) (2) −3.11 (p = 0.086) (−6.68–0.45) (3) −6.28 (p = 0.048) (−12.50–−0.05) Test for trend −1.49 (p = 0.055) (−3.00–0.03) | (1) −1.33 (p = 0.390) (−4.37–1.71) (2) 0.22 (p = 0.903) (−3.37–3.82) (3) 0.18 (p = 0.951) (−5.58–5.94) | (1) −1.74 (p = 0.117) (−3.92–0.44) (2) −1.11 (p = 0.376) (−3.56–1.34) (3) −2.61 (p = 0.224) (−6.83–1.60) |
| Metacogntiion index | (1) −1.48 (p = 0.695) (−8.86–5.90) (2) 0.79 (p = 0.850) (−7.45–9.03) (3) −9.56 (p = 0.187) (−23.78–4.66) | (1) −4.61 (p = 0.228) (−12.10–2.88) (2)−1.74 (p = 0.699) (−10.56–7.08) (3) −3.55 (p = 0.625) (−17.80–10.70) | (1) −2.78 (p = 0.308) (−8.11–2.56) (2) −2.23 (p = 0.466) (−8.23–3.76) (3) −6.18 (p = 0.239) (−16.48–4.18) |
| Generel Executive Functions | (1) −1.72 (p = 0.763) (−12.91–9.47) (2) 2.02 (p = 0.751) (−10.47–14.52) (3) −14.46 (p = 0.190) (−36.06–7.14) | (1) −5.50 (p = 0.342) (−16.85–5.85) (2) 0.04 (p = 0.995) (−13.36–13.45) (3) −3.21 (p = 0.771) (−24.81–18.38) | (1) −3.14 (p = 0.446) (−11.22–4.93) (2) −1.02 (p = 0.827) (−10.11–8.08) (3) −8.61 (p = 0.279) (−24.20–6.98) |
| Kolding | Svendborg | All | |
|---|---|---|---|
| LTS Mean (p-Value) (95% CI) | LTS Mean (p-Value) (95% CI) | LTS Mean (p-Value) (95% CI) | |
| FLANKER | (n = 176) | (n = 179) | (n = 360) |
| Flanker reactiontime congruent trial block 3 | (1) −70.99 (p = 0.222)(−185.04–43.05) (2) −58.46 (p = 0.405)(−196.03–79.12) (3) 158.69 (p = 0.197)(−82.53–399.91) | (1) 38.83 (p = 0.480)(−69.03–146.68) (2) 63.05 (p = 0.340)(−66.33–192.42) (3) 21.22 (p = 0.846)(−192.35–234.79) | (1) −3.94 (p = 0.917)(−78.47–70.58) (2) 21.43 (p = 0.641)(−68.67–111.53) (3) 91.95 (p = 0.256)(−66.61–250.50) |
| Flanker reactiontime incongruent trial block 3 | (1) −2.83 (p = 0.962)(−120.13–114.47) (2) −105.54 (p = 0.138)(−244.96–33.89) (3) 6.87 (p = 0.957)(−241.45–255.18) | (1) −29.26 (p = 0.611)(−141.88–83.36) (2) −0.72 (p = 0.992)(−137.21–135.77) (3) 54.04 (p = 0.643)(−174.68–282.75) | (1) 6.43 (p = 0.873)(−72.57–85.43) (2) −25.28 (p = 0.600)(−119.74–69.19) (3) 45.45 (p = 0.597)(−122.80–213.70) |
| Flanker Accuracy congruent trial block 3 | (1) −0.06 (p = 0.957)(−2.38–2.25) (2) 0.65 (p = 0.642)(−2.08–3.38) (3) −1.77 (p = 0.484)(−6.72–3.18) | (1) 1.69 (p = 0.128)(−0.48–3.87) (2) 3.48 (p = 0.010)(0.84–6.11) (3) 2.84 (p = 0.207)(−1.57–7.25) Test for trend 1.40 (p = 0.014)(0.28–2.51) | (1) 0.94 (p = 0.234)(−0.61–2.49) (2) 1.49 (p = 0.112)(−0.34–3.32) (3) 0.82 (p = 0.628)(−2.49–4.13) |
| Flanker Accuracy incongruent trial block 3 | (1) 2.81 (p = 0.256)(−2.03–7.64) (2) 2.81 (p = 0.336)(−2.91–8.53) (3) 3.05 (p = 0.565)(−7.34–13.44) | (1) 4.29 (p = 0.055)(−0.09–8.67) (2) 2.60 (p = 0.335)(−2.69–7.89) (3) 6.54 (p = 0.150)(−2.37–15.46) | (1) 2.96 (p = 0.068)(−0.22–6.13) (2) 2.05 (p = 0.284)(−1.70–5.81) (3) 5.04 (p = 0.147)(−1.78–11.86) |
Publisher’s Note: MDPI stays neutral with regard to jurisdictional claims in published maps and institutional affiliations. |
© 2022 by the authors. Licensee MDPI, Basel, Switzerland. This article is an open access article distributed under the terms and conditions of the Creative Commons Attribution (CC BY) license (https://creativecommons.org/licenses/by/4.0/).
Share and Cite
Siersbaek, G.M.; Have, M.; Wedderkopp, N. The Effect of Leisure Time Sport on Executive Functions in Danish 1st Grade Children. Children 2022, 9, 1458. https://doi.org/10.3390/children9101458
Siersbaek GM, Have M, Wedderkopp N. The Effect of Leisure Time Sport on Executive Functions in Danish 1st Grade Children. Children. 2022; 9(10):1458. https://doi.org/10.3390/children9101458
Chicago/Turabian StyleSiersbaek, Gitte Meilandt, Mona Have, and Niels Wedderkopp. 2022. "The Effect of Leisure Time Sport on Executive Functions in Danish 1st Grade Children" Children 9, no. 10: 1458. https://doi.org/10.3390/children9101458
APA StyleSiersbaek, G. M., Have, M., & Wedderkopp, N. (2022). The Effect of Leisure Time Sport on Executive Functions in Danish 1st Grade Children. Children, 9(10), 1458. https://doi.org/10.3390/children9101458