Article

A Generalized Linear Mixed Model for Data Breaches and Its Application in Cyber Insurance

Department of Statistics and Actuarial Science, Simon Fraser University, 8888 University Drive, Burnaby, BC V5A 1S6, Canada
*
Author to whom correspondence should be addressed.
Risks 2022, 10(12), 224; https://doi.org/10.3390/risks10120224
Submission received: 7 October 2022 / Revised: 9 November 2022 / Accepted: 14 November 2022 / Published: 23 November 2022

Abstract

:
Data breach incidents result in severe financial loss and reputational damage, which raises the importance of using insurance to manage and mitigate cyber related risks. We analyze data breach chronology collected by Privacy Rights Clearinghouse (PRC) since 2001 and propose a Bayesian generalized linear mixed model for data breach incidents. Our model captures the dependency between frequency and severity of cyber losses and the behavior of cyber attacks on entities across time. Risk characteristics such as types of breach, types of organization, entity locations in chronology, as well as time trend effects are taken into consideration when investigating breach frequencies. Estimations of model parameters are presented under Bayesian framework using a combination of Gibbs sampler and Metropolis–Hastings algorithm. Predictions and implications of the proposed model in enterprise risk management and cyber insurance rate filing are discussed and illustrated. We find that it is feasible and effective to use our proposed NB-GLMM for analyzing the number of data breach incidents with uniquely identified risk factors. Our results show that both geological location and business type play significant roles in measuring cyber risks. The outcomes of our predictive analytics can be utilized by insurers to price their cyber insurance products, and by corporate information technology (IT) and data security officers to develop risk mitigation strategies according to company’s characteristics.

1. Introduction

With borderless network thoroughly covered nearly every terminal in the world, it is crucial to maintain security on digital assets/property and identify vulnerable data residencies in time. Industries, companies and organizations have been increasingly suffered by cyber breaches, which have posed serious risks to their business operations over last decades. For instance, a ransomware attack paralyzed at least 200 U.S. companies via Kaseya, a globally used software supplier on 3 July 2021 (BBC News 2021). It was a colossal and devastating supply chain attack and has the potential to spread to any size or scale business through cloud-service providers. Several federal legislations (e.g., Data Security and Breach Notification Act 2015 and Data Accountability and Trust Act 2019) have been introduced in the U.S. to enhance the cyber security and data protection. The Federal Bureau of Investigation (FBI) set up an Internet Crime Complaint Center (IC3) (FBI 2000) in 2000 with a trustworthy source for information on cyber criminal activities to combat through criminal and cyber investigative work. In 2020, IC3 received a total of 791,790 cyber crime records from American public with reported losses exceeding USD 4.1 billion, which is a 69% increase in total complaints and about 20% increase in loss amount from 2019. Over the years from 2016 to 2020, IC3 received over two million complaints, reporting a nearly USD 13.3 billion (Internet Crime Report 2020) total loss. Those complaints address a wide array of Internet scams affecting victims across the globe. Recently, IBM Security published the Cost of Data Breach Report 2021 IBM (2021) that analyzed 537 real data breaches across 17 counties and different industries. Data breaches refer to unauthorized access and manipulation on exposed confidential data (information). The report shows a 10% increase in average total cost of a breach incident from 2020 to 2021 with USD 1.07 million cost difference where remote work was a key factor in causing the data breaches and a 10.3% increase in average per record cost of a data breach from 2020 to 2021. This increasing trend in breach frequency and average cost raises the importance of cyber insurance for business and organizations to protect themselves against data breach losses/liabilities. A recent industry survey Rudolph (2022) indicates that cyber/networks has been listed as number one or two among the top five notable emerging risks in their 2018–2021 surveys.
Cyber insurance is emerging as an important tool to protect organizations against future cyber breach losses and its institutional pillars are progressively evolving and reinforcing one another (Kshetri 2020). By analyzing the U.S. cyber insurance market, Xie et al. (2020) find that professional surplus insurers and insurers with surplus insurer affiliation demonstrate a competitive advantage in cyber insurance participation. According to an NAIC report (NAIC 2020), U.S. domiciled insurers writing cyber coverage had USD 2.75 billion of direct premium written in 2020 (increased by 21.7% and 35.7%, respectively, from the year of 2019 and the year of 2018). The top 20 groups in the cyber insurance market reported average direct loss ratios 66.9% up from 44.6% in 2019 and 35.3% in 2018. The report also points out that changes in cyber insurance loss ratios are not driven by premium growth but by claim frequency and severity growth, implying the significance of cyber insurance policy designs.
Cyber risk has become an increasingly important research topic in many disciplines. Recently, Eling (2020) present a comprehensive review of the academic literature on cyber risk and cyber insurance in actuarial science and business related fields including economics, finance, risk management, and insurance. Here, we briefly review recent research in the actuarial science literature on modeling and analyzing data breach related cyber risks. Maillart and Sornette (2010) reveal an explosive growth in data breach incidents up to July 2006 and a stable rate thereafter. Wheatley et al. (2016) focus on the so called extreme risk of personal data breaches by detecting and modeling the maximum breach sizes and show that the rate of large breach events has been stable for U.S. firms under their study. Edwards et al. (2016) find that daily frequency of breaches can be well described by a negative binomial distribution. Eling and Loperfido (2017) implement frequency analyses on different levels of breach types and entities through multidimensional scaling and multiple factor analysis for contingency tables, while Eling and Jung (2018) extend former work by implementing pair copula construction (PCC) and Gaussian copula to deal with asymmetric dependence of monthly losses (total number of records breached) in two cross-sectional settings. Fahrenwaldt et al. (2018) develop a mathematical (network) model of insured losses incurred from infectious cyber threats and introduce a new polynomial approximation of claims together with a mean-field approach that allows computing aggregate expected losses and pricing cyber insurance products. Jevtić and Lanchier (2020) propose a structural model of aggregate cyber loss distribution for small and medium-sized enterprises under the assumption of a tree-based local area network (LAN) topology. Schnell (2020) shows that the frequently used actuarial dependence models, such as copulas, and frequency distributions, such as Poisson distribution, would underestimate the strength and non linearity of dependence.
The purpose of this paper is to provide predictive analytics based on historical data on cyber incidents frequency aiming to help insurance companies examine, price, and manage their cyber related insurance risks. This analysis may be used by organizations as a reference in balancing their prevention costs with premiums according to their entity types and locations. We make use of related factors from cyber breach data and perform Bayesian regression techniques under generalized linear mixed model (GLMM). GLMM is one of the most useful structures in modern statistics, allowing many complications to be handled within linear model framework (McCulloch 2006). In the actuarial science literature, Antonio and Beirlant (2007) use the GLMMs for the modeling of longitudinal data and discuss the model estimation and inference under the Bayesian framework. Recently, Jeong et al. (2021) study the dependent frequency and severity model under the GLMM framework, where the aggregate loss is expressed as a product of the number of claims (frequency) and the average claim amount (severity) knowing the frequency. The GLMM has also been used in studying the credibility models; see, for example, Antonio and Beirlant (2007) and Garrido and Zhou (2009). Generally, a generalized regression model is used to describe within-group heterogeneity of observations, and a sampling model is used to describe the group specific regression parameters. A GLMM can handle those issues by not only accommodating non-normally distributed responses and specifying a non-linear link function between response mean and regressors but also allowing group specific correlations in the data.
The dataset we examine in this paper is from Privacy Rights Clearinghouse (PRC) (PRC 2019). It is primarily grant-supported and serves individuals in the United States. This repository keeps records of data breaches that expose individuals to identity theft as well as breaches that qualify for disclosure under the state laws. Chronology includes the type of breaches, type of organization, name of company and its physical location, date of incidents, and number of records breached. It is the largest and most extensive dataset that is publicly available and has been investigated by several research papers from various perspectives. Below are notable studies based on this dataset. Edwards et al. (2016) develop Bayesian generalized linear models to investigate trends in data breaches. Eling and Loperfido (2017) investigate this dataset under the statistical and actuarial framework; multidimensional scaling and goodness-of-fit tests are used to analyze the distribution of data breach information. Eling and Jung (2018) propose methods for modeling cross-sectional dependence of data breach losses; copula models are implemented to identify the dependence structure between monthly loss events (frequency and severity). Carfora and Orlando (2019) propose an estimation of value at risk (VaR) and tail value at risk (TVaR). Xu et al. (2018) model hacking breach incident inter-arrival times and breach sizes by stochastic processes and propose data-driven time series approaches to model the complex patterns exhibited by the financial data. Recently, Farkas et al. (2021) present a method for cyber claim analysis based on regression trees to identify criteria for claim classification and evaluation, and Bessy-Roland et al. (2021) propose a multivariate Hawkes framework for modeling and predicting cyber attacks frequency.
In this study, we propose a Bayesian negative binomial GLMM (NB-GLMM) for the quarterly cyber incidents recorded by PRC. The quarter specific is one of the variations of random effects explained by the quarterly hierarchical panel data. Regression models on covariate predictors can capture variations of within-quarter heterogeneity effects. Moreover, GLMMs outperform the generalized linear model (GLM) by reveling features of the random effects distribution and allowing subject-specific predictions based on measured characteristics and observed values among different groups, while most studies on modeling cyber risk related dependencies in the literature are geared toward cross-sectional dependence using copulas (see, for example, Eling and Jung (2018) and Schnell (2020), and references therein), our approach models the dependence between the frequency and severity under the widely known generalized linear framework, which excels in interpreting the directional effect of features, along with the GLMM that deals with hierarchical effects and dependent variables using general design matrices (McCulloch and Searle 2004) The Bayesian approach and Markov chain Monte Carlo (MCMC) method are utilized to obtain posterior distributions of parameters of interest. Specifically, our hierarchical structure of Bayesian NB-GLMM requires Metropolis–Gibbs (M-G) sampling schemes working on regression mean related parameters, and conditional maximum likelihood estimates of the dispersion parameter.
The significant findings of our study are the following. (1) It is effective to use of the complex NB-GLMM for analyzing the number of data breach incidents with uniquely identified risk factors such as type of breaches, type of organizations, and their locations. (2) It is practical to include in our model the notable correlation detected between the number of cyber incidents and average severity amount (the number of data breached), as well as the time trend effects impacted on the cyber incidents. (3) It is efficient to use the sophisticated estimation techniques for our analysis, including Bayesian approach, MCMC method, Gibbs sampling, and Metropolis–Hastings algorithm. (4) Using the frequency–severity technique, it is feasible to use our predictive results for pricing the cyber insurance products with coverage modifications.
Our contributions to related research areas can be described as follows. In modeling the dependence between frequency and severity of cyber risks, we investigate the use of average severity as one of subject-specific covariates via GLMM regression process. Meanwhile, we model time trend effects as a group-specific factor in order to explain the change in data breach incidents over time. Besides examining fixed effects, we adopt MCMC method to extract random effects working on several different explanatory variables. We estimate parameters of GLMM under the NB distribution with a non-constant scale parameter by combining the maximum likelihood estimation with the MCMC method. We add to the existing literature the implementation of our proposed estimation procedure in the actuarial context, which may be of interest to other researchers and practitioners in the related fields.
The rest of this paper is structured as follows. In Section 2, we introduce our database and present empirical data analysis. Section 3 presents the NB-GLMM for our breach data and the parameter inferences under Bayesian framework. Section 4 shows the MCMC implementation and inference of the posterior distribution of parameters, followed by a simulation study and cross validation test against testing dataset to assess model performance in Section 5. Model applications in industry risk mitigation and premium calculations are discussed and illustrated in Section 6. Finally, in Section 7 we provide further discussions on aggregating total claim costs.

2. Chronology of Data Breaches from PRC Dataset

2.1. Data Description

Our research is data-driven based on PRC chronology database which contains cyber breach incidents between years 2001 and 2018. The data is recorded under case unit with breach types, business types, incident entities, and their geological location; these variables could be valuable predictors while generating regression models and making predictions. We model PRC quarterly counts as a function of breach type, breach entity, and location, which can be linear predictors of target variable via general design matrices. Moreover, we model relationships among risk exposure characteristics via matrix design by taking all featured combinations as different risk exposures. In order to lower the dimension of parameter matrix, reduce the volatility of data and stable the rates overtime, we further combine levels with similar information into new representative levels of three categorical variables under clustering analysis (Jain et al. 1999): South, West, Northeast, and Midwest (according to U.S. Census Bureau) under location; external and internal under breach type; and business and non-business under organization type for non-medical organizations as an example showed in Table 11.
As a result, the original case unit basis dataset is manipulated as a hierarchical dataset with quarterly counts on uniquely identified 16 level combinations. These combinations divided the dataset into three dimensional augmentations.
Besides targeting counts variable and designing covariate matrix described above, it is worth mentioning the following features of the PRC empirical breach frequency distribution. Figure 1 shows the empirical quarterly counts between years 2001 and 2018 density performance of non-medical organizations (left) and medical organizations (right).
Frequency counts are aggregated on quarterly interval of specific combination subjects. Both plots reflect the fact that there exists a portion of zero incidents and dispersion on a wide range. It is noteworthy that, although density plots for non-medical and medical organizations share overall similarities, the detailed performances between two plots are different showing the cyber related risk nature differences between the non-medical and medical organizations. For instance, the proportion of zeros is higher for non-medical organizations and the scale for non-medical distributions is more centered. These observations follow the current trending that medical identity theft and medical data breaches are vividly rising at disproportionate rates compared with other attacked industries (Rathee 2020). NAIC 2020 Cybersecurity Report (NAIC 2020) points out that healthcare breaches grew by 33.3 % higher than breaches from other type of organizations. All these suggest that it may be necessary to separately analyze of data breaches happened to the non-medical organizations and that to the medical organizations.

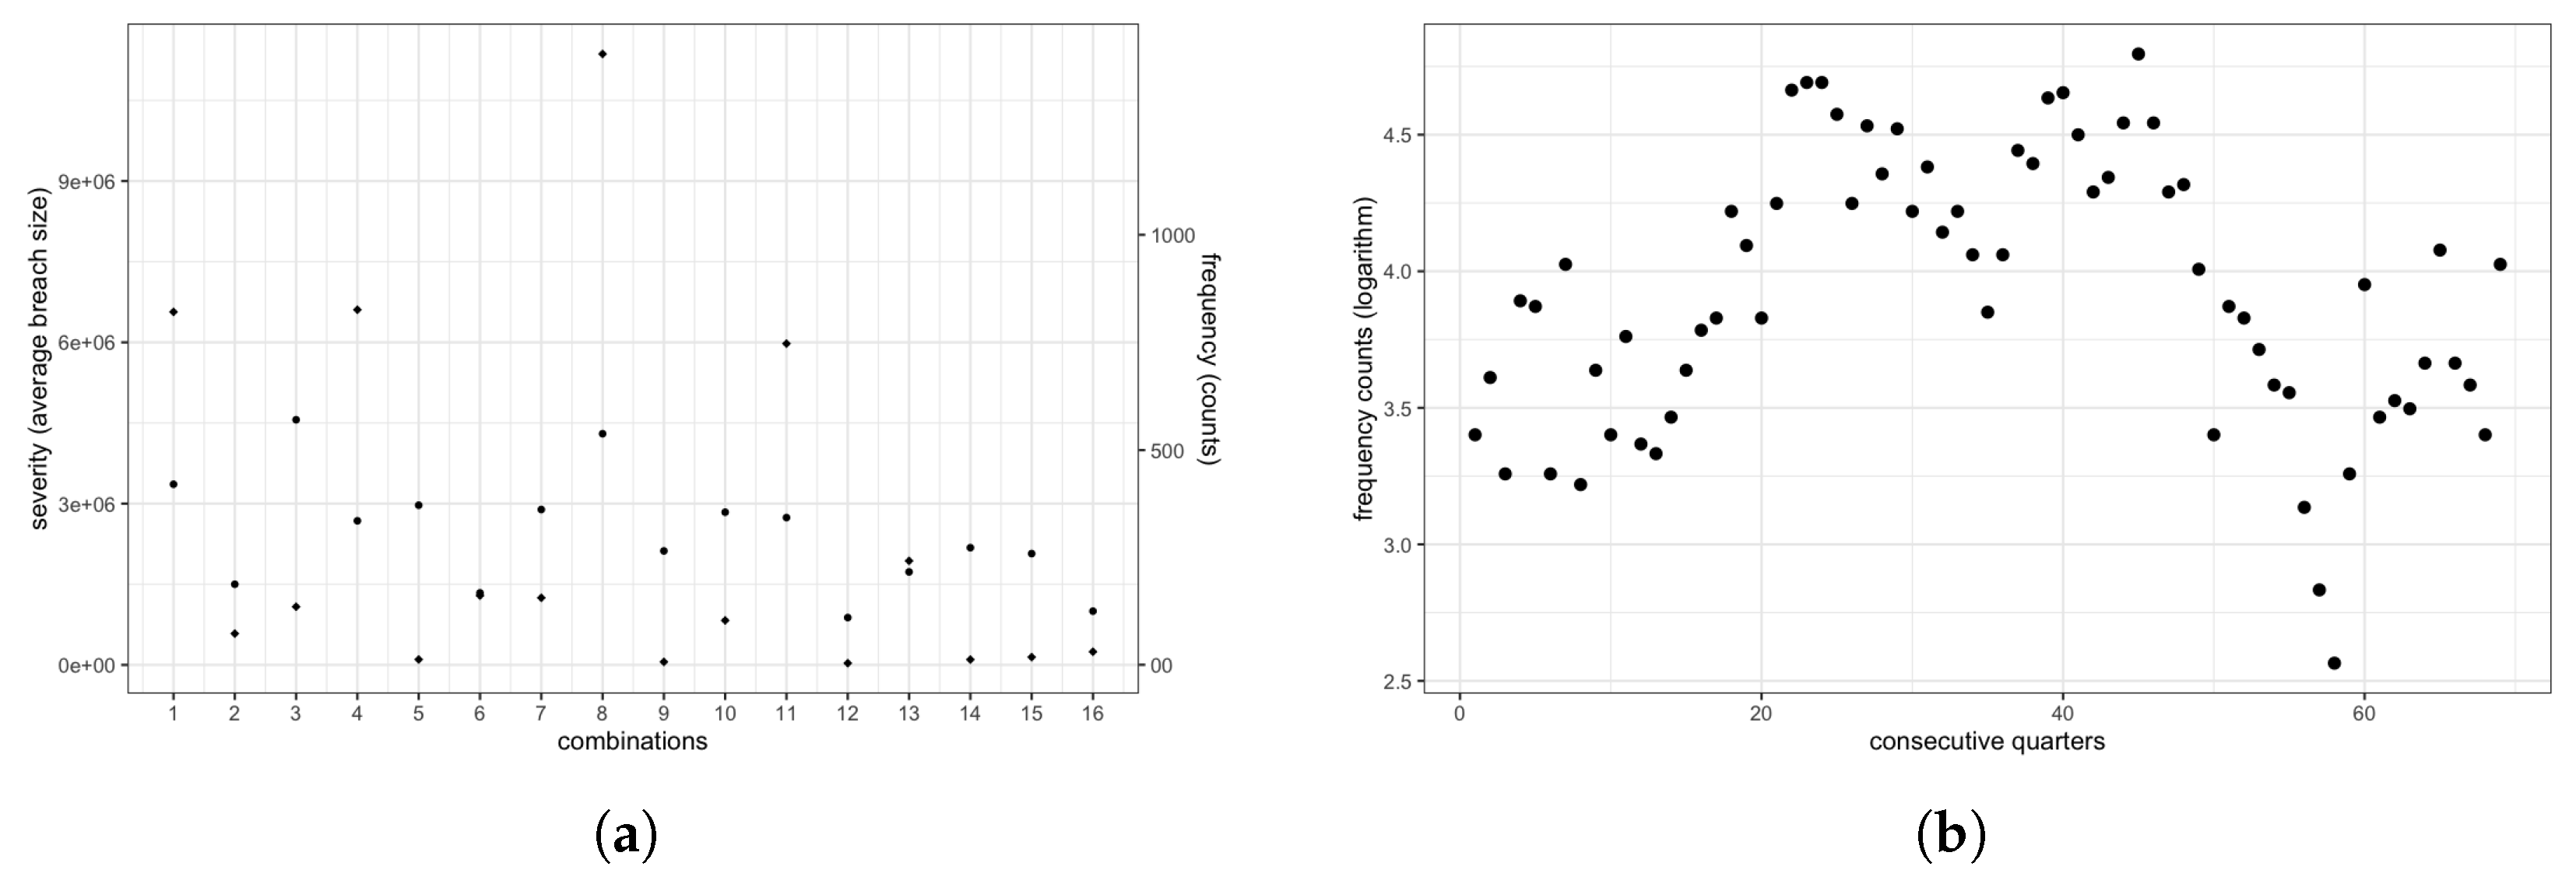
2.2. Empirical Data Analysis

In this subsection we perform exploratory data analysis on breach incident counts (frequency) that helps gain insights into the distribution of our target variable. Our study is based on the latest available PRC data breach chronology downloaded with 9012 breach observations happened in the U.S. After we remove incomplete and inconsistent observations, 8095 incidents include 4161 medical incidents and 3934 non-medical incidents are investigated and modeled. Table 2 displays the summary statistics of quarterly number of breach incidents that the non-medical and medical organizations incurred between years 2001 and 2018. The incidents of the medical subset is more widespread ranging from 0 to 37 whereas that of the non-medical ranges from 0 to 20 only. Both of them are right skewed with mean greater than median and the medical subset has a heavier tail and shows over dispersion with a large variance. Both quarterly count frequencies contain a proportion of zeros which means some characteristic combinations do not incur breach incidents at these quarters.
With these features, we fit the Poisson, negative binomial (NB), zero-inflated Poisson, and zero-inflated NB distributions to both the medical and non-medical counts subdatasets, respectively, while the Poisson and NB distributions are commonly used in modeling the claim counts in actuarial field, the NB distribution could be a conservative model choice as it can handle over-dispersion and its zero-inflated version could be appropriate due to the appearance of heavy zeros observed in the non-medical subdataset. When several models are available, one can compare the model performance based on statistical likelihood measures; here we use AIC (Akaike information criterion, Bozdogan 1987) to testify which distribution preliminarily describes best the breach incident frequencies with uniquely identified risk features. Table 3 shows the AIC values for the distributional models that we fit.
Based on these values, we find that the NB model fits both the medical and non-medical data best. Our findings actually coincide with the conclusions from several studies of cyber incidents in the literature. For example, Edwards et al. (2016) model the frequency of data breaches with the NB distribution under Bayesian approach. Joe and Zhu (2005) provide helpful insights, besides the likelihood metrics, in selecting a better fitting NB distribution for modeling count data with long right tails. Proceeding along similar lines, we adopt the NB as the target regression distribution of GLMM model based on natures of PRC dataset, which is discussed in Section 3.

3. Generalized Linear Mixed Model for Data Breaches

In this section, we start with introducing our GLMM under the NB target variable distribution. Instead of letting only one covariate contain random effects, we consider that the random effects rely on all the risk characteristic features derived from raw factors. Besides hierarchical structure variations, the time trend effects are considered as fixed effects in the portion of the mean of GLMM. We then investigate unknown parameters under Bayesian framework combined with prior and posterior distributions. Finally, we introduce parameter inferences on hyper parameters using MCMC and M-G algorithms.

3.1. Model Formulation

We first introduce notations before a GLMM (McCulloch 2006) for modeling the quarterly number of data breaches is formulated for our study. Assume that the total number of combinations is I and the total number of quarters is J. Let Y i j be a random variable representing the number of data breach incidents of ith combination in jth quarter, where i = 1 , 2 , , I and j = 1 , 2 , , J . Let μ i j be the mean of Y i j conditional on β j and b , where β j = ( β 1 , j , β 2 , j , , β H , j ) T is a H-dimensional vector of regression coefficients for the jth quarter, and b = ( b 1 , b 2 , , b G ) T is a G-dimensional vector of regression coefficients. Furthermore, let x i j = ( x 1 , i j , x 2 , i j , , x H , i j ) T be a H-dimensional vector and z i j = ( z 1 , i j , z 2 , i j , , z G , i j ) T be a G-dimensional vector, which are measured covariates for the ith combination in the jth quarter.
Assume that { Y i j , i = 1 , 2 , , I } are conditionally independent given β j and b , and follow a distribution with probability density function f ( · | β j , b ) and mean μ i j , i = 1 , 2 , , I , respectively. Let g ( · ) be a link function. Then our model, for i = 1 , 2 , , I and j = 1 , 2 , , J , can be described as
Y i j | β j , b i . i . d . f ( y i j | β j , b ) , i = 1 , 2 , , I E [ Y i j | β j , b ] = μ i j , g ( μ i j ) = η i j = x i j T β j + z i j T b , β j i . i . d . N ( θ , Σ ) , j = 1 , 2 , , J
in which the heterogeneity among the regression coefficients β 1 , , β J is described by a multivariate normal distribution with mean θ and a variance–covariance matrix Σ = ( σ i j ) with σ i i = σ i 2 . Note that random vector variable β j reflects the within group variations for the jth group (quarter), while the i.i.d. multivariate normal random vector variables β 1 , , β J reflect the between group variations for total of J groups (quarters).
In fact, the model (1) can be written as a standard GLMM format using the notations and formulations given in (McCulloch 2006). Let η j = ( η 1 j , , η I j ) T , X j = ( x 1 j T , , x I j T ) T and Z j = ( z 1 j T , , z I j T ) T , and write β j = θ + u j . Then the explanatory variable structure η j given in (1) can be rewritten as a sum of fixed effects and random effects components via the treatment design (Stroup 2012):
η j = X j β j + Z j b = M j γ + X j u j , u j i . i . d . N ( 0 , Σ ) ,
where M j = [ X j , Z j ] is a I × ( H + G ) covariate matrix and γ = [ θ T , b T ] T is a ( H + G ) -dimensional vector. Clearly, in (2) M j γ represents the fixed effects component of the mean vector, while X j u j represents the random effects component of the mean vector, for which a multivariate normal distribution with mean 0 and variance–covariance matrix Σ is assigned to u j for all j. This shows that between group effects and within group effects can be separated for a given information about the hierarchical data.
As suggested by our empirical study showed in Section 2.2, we assume that Y i j given β and b j follows a NB distribution and a log link is used, namely, for i = 1 , 2 , , I , j = 1 , 2 , , J and y i j = 0 , 1 ,
f ( y i j | μ i j , α j ) = Γ ( y i j + α j 1 ) Γ ( α j 1 ) Γ ( y i j + 1 ) 1 1 + μ i j α j α j 1 μ i j α j 1 + μ i j y i j ,
where μ i j is the mean of Y i j as denoted in (1) such that ln ( μ i j ) = η i j = x i j T β j + z i j T b , and α j ( > 0 ) is the dispersion parameter used in the variance expression of Y i j , which is μ i j + α j μ i j 2 . Here we take the type II NB distribution, termed as NB2 (Hilbe 2011) due to the quadratic natural of its variance function. The NB2 distribution can be generated from the Poisson-gamma mixture model and is also a member of exponential family. This formulation is adopted because it allows the modeling of within group heterogeneity using a gamma distribution.
In our data breach frequency data analysis, the recorded information from the PRC dataset on the type of breaches, type of organizations and entity location, when a data breach incident occurs, are used as covariates. We also take into consideration the variations in average severity (the number of data breaches caused by data breach events) of each combination and the time trend. We consider the parameters corresponding to type of breaches, type of organizations, entity location, and average severity as both fixed and random effects, and consider the parameters for time trend as fixed effects. We thus have H = 6 for x i j and β j , and G = 3 for z i j and b under cubic polynomial assumption for the time trend; the corresponding dimension of fixed effects covariates (type of breaches, type of organization, location, average severity, time trend) in (2) is thus 9 and that of random effects covariates (type of breaches, type of organization, location, average severity) is 6. More details on the GLMM for the PRC frequency dataset are presented in Section 4.

3.2. Parameter Inference under Bayesian Framework

The GLMM has been specified in Section 3.1. We now in this subsection consider the inferences about the built-in process that generates the data. There are various ways to approximate the likelihood used for estimating GLMM parameters, including pseudo and penalized quasilikelihood (PQL) (see, for example, Schall 1991, Wolfinger and O’connell 1993, and Breslow and Clayton 1993 among others), Laplace approximations (Raudenbush et al. 2000), Gauss–Hermite quadrature (GHQ) (Pinheiro and Chao 2006) and Markov chain Monte Carlo (MCMC) algorithms (Gilks 1996). First three methods explicitly integrate over random effects to compute the likelihood, whereas the MCMC method generates random samples from the distributions of parameters for fixed and random effects. We adopt the MCMC method in this study, because it can be easily used in considering multiple random effects on part of explanatory variables for our dataset. MCMC algorithms are normally used under a Bayesian framework which incorporates prior information based on previous knowledge about the parameters or specifies uninformative prior distributions to indicate lack of knowledge. Parameter estimations are made through the posterior distribution which is computed using Bayes’ theorem, which is the cornerstone of Bayesian statistics and provides an effective approach in making inferences (Dempster 1968).

3.2.1. Prior and Posterior Distribution

In addition to Bayesian flavor and well posed statistical model, MCMC involves possibly challenging technical details including choosing appropriate priors and efficient algorithms for large problems. The Bayesian approach also requires the specification of prior distributions of all model parameters. Note that in Bayesian GLMM analysis, it normally assumes that the prior distribution of coefficient vector is multivariate normal distributed and the variance-covariance matrix is inverse Wishart distributed. Under our model described by (1), the prior distributions for θ and Σ are assumed and their posterior distributions are discussed in the following.
We first present the prior and posterior distribution of θ assuming that the variance-covariance matrix Σ is known. Suppose that the mean vector θ is multivariate normal distributed with mean vector μ 0 and variance–covariance matrix Λ 0 , that is,
θ N ( μ 0 , Λ 0 ) ,
which is actually a conjugate prior distribution of θ as in this case it is well known that the corresponding posterior distribution is also multivariate normal distributed. Following Hoff (2009), the full conditional (posterior) distribution of θ , given a sample of regression coefficients β 1 , , β J and Σ , can be easily derived as
[ θ | β 1 , , β J , Σ ] N ( μ J , Λ J ) ,
where μ J is the conditional mean vector and Λ J is the variance–covariance matrix, given by
μ J = ( Λ 0 1 + J Σ 1 ) 1 ( Λ 0 1 μ 0 + J Σ 1 β ¯ ) , Λ J = ( Λ 0 1 + J Σ 1 ) 1 ,
in which β ¯ = ( 1 / J ) j = 1 J β 1 j , , ( 1 / J ) j = 1 J β H j T is a H-dimensional vector average.
We now discuss the prior and posterior distribution of Σ . Having information of Σ helps us in detecting group variance caused by group specific features, especially the relationship between covariates which could be evaluated with correlation coefficient ρ i j = σ i j / σ i 2 σ j 2 . In Bayesian statistics, in the context of the multivariate normal distribution, the Wishart distribution is the semi-conjugate prior to the precision matrix Σ 1 (Chatfield and Collins 2018), and hence the inverse-Wishart distribution is the semi-conjugate prior distribution for the variance-covariance matrix Σ . Assume now a conjugate inverse-Wishart prior distribution for Σ ,
Σ W 1 ν 0 , S 0 1 ,
where ν 0 is the hyper-parameter and S 0 1 is a symmetric positive definite matrix. Based on (1) that regression coefficients β j , j = 1 , , J , are multivariate normal distributed, the conditional posterior distribution of Σ , given a sample of regression coefficients β 1 , , β J and θ , can be written as
[ Σ | β 1 , , β J , θ ] W 1 ν 0 + J , S 0 + S θ 1
where ν 0 + J is the hyper-parameter and S 0 + S θ 1 is the covariance matrix, in which S θ is the matrix of residual sum of squares with respect to mean vector θ , given by
S θ = j = 1 J ( β j θ ) ( β j θ ) T .
Detailed derivations can be found in Hoff (2009).
The maximum likelihood estimation for the dispersion or heterogeneity parameter from a NB distribution is discussed with details in Piegorsch (1990). Under our GLMM setting, α j is the dispersion parameter for jth quarter in (3) which scales the population variance. In our model, the generalized linear regression algorithm on target NB2 distribution with a log link function leaving heterogeneity parameter to be entered into GLMM model as a constant (Hilbe 2011). As it can be seen in the estimation algorithm presented in the next subsection, parameter α = { α 1 , , α J } are estimated outside and subsequently entered into the GLMM algorithm.
The log-likelihood function from a sample of i.i.d. response variables for jth quarter over all combinations based on (1) is derived as
( α j | { y i j } , { μ i j } ) = i = 1 I y i j ln ( μ i j ) + y i j ln ( α j ) y i j + 1 α j ln 1 + α j μ i j + ln Γ y i j + α j 1 ln Γ ( y i j + 1 ) I ln Γ α j 1 ,
where μ i j = exp ( x i j T β j + z i j T b ) . During the Metropolis–Hastings (M-H) approximation process, β j is generated from a multivariate normal distribution and b is generated under regression model conditioning on known β j values at every iteration. Together with x i j and z i j , we can obtain the mean parameter μ i j . Maximum likelihood estimation of α j can then be obtained by unidimensional numerical maximization of ( α j | { y i j } , { μ i j } ) given by (6). In each iteration, α j is recalculated together with θ and Σ from Gibbs sampling. All the newly generated parameter samples then provide a decision criteria in M-H algorithm.

3.2.2. Markov Chain Monte Carlo for Parameter Estimations

In this subsection, we implement Markov chain Monte Carlo (MCMC) methods to explore and summarize posterior distributions in Bayesian statistics described in Section 1. Introduced by Metropolis et al. (1953) and Hastings (1970), MCMC has been a classical and general method for stochastic process simulation given probability density functions. It has been widely applied especially under Bayesian algorithm (Gamerman and Lopes 2006). Since it is not always feasible to find analytical expressions under Bayes theorem for the posterior distribution of model parameters, Monte Carlo method (Metropolis and Ulam 1949) has been brought up to estimate features of the posterior or predictive distribution of interest by using samples drawn from that distribution. One is able to simulate dependent samples from an irreducible Markov chain and treat stationary numerical approximations as empirical distribution. Since M-H algorithm provides dependent chains, iteration samples require to be large enough in order to be independent.
In general, generating samples directly from a high dimensional joint distribution is unlikely possible. It is feasible to sample each parameter from the full conditional distribution via Gibbs sampler algorithm(Geman and Geman 1984). As an indirect sampling approach, Gibbs sampler has become an increasingly popular statistical tool in both applied and theoretical research. Casella and George (1992) analytically establish its properties and provide insights on complicated cases. Smith and Roberts (1993) review the use of the Gibbs sampler for Bayesian computation and describe the implementation of MCMC simulation methods.
Based on the generalized parameterization scheme for our GLMM given by (1) and (3), { θ , Σ , b , α j } is a set of unknown parameters for jth quarter. The joint posterior distribution does not have a standard form and hence it is difficult to sample directly from it. Instead of obtaining a joint distribution of unknown parameters, we can construct a full conditional distribution p ( θ , Σ , b , α j | y 1 , , y J ) by Gibbs sampler under M-H algorithm giving a MCMC approximation, where y j = { y 1 j , , y I j } represents a collection of data for the jth quarter. Iterated samplers from the full conditional distribution of each parameter generate a dependent sequence that converges to the joint conditional posterior distribution. The respective full conditional distributions of θ and Σ rely only on β 1 , , β J as shown in (4) and (5) no matter what target distribution for Y i j is chosen. Parameter b depends on the target distribution and is updated using given β 1 , , β J in each iteration. The remaining unknown dispersion parameter α j is affected by the chosen NB-GLMM and its full conditional distribution, f ( y i j | μ i j , α j ) , can be obtained once the mean parameter μ i j has been generated.
Given a set of starting values { Σ ( 0 ) , β 1 ( 0 ) , , β J ( 0 ) , b ( 0 ) } , the Gibbs sampler generates ( s + 1 ) th set of parameters { θ ( s + 1 ) , Σ ( s + 1 ) , α 1 ( s + 1 ) , , α J ( s + 1 ) } from { θ ( s ) , Σ ( s ) , β 1 ( s ) , , β J ( s ) , b ( s ) } , s = 0 , 1 , . The logic of the Gibbs sampler updating algorithm can be described as follows.
  • Sample θ ( s + 1 ) from full conditional distribution (4):
    (a)
    Compute μ J ( s ) and Λ J ( s ) from { Σ ( s ) , β 1 ( s ) , , β J ( s ) } , where
    μ J ( s ) = ( Λ 0 1 + J ( Σ ( s ) ) 1 ) 1 ( Λ 0 1 μ 0 + J ( Σ ( s ) ) 1 β ¯ ( s ) ) , Λ J ( s ) = ( Λ 0 1 + J ( Σ ( s ) ) 1 ) 1 ;
    (b)
    Sample θ ( s + 1 ) N μ J ( s ) , Λ J ( s ) .
  • Sample Σ ( s + 1 ) from full conditional distribution (5):
    (a)
    Compute S θ ( s ) from { θ ( s + 1 ) , β 1 ( s ) , , β J ( s ) } , where
    S θ ( s ) = j = 1 J ( β j ( s ) θ ( s + 1 ) ) ( β j ( s ) θ ( s + 1 ) ) T ;
    (b)
    Sample Σ ( s + 1 ) W 1 ν 0 + J , S 0 + S θ ( s ) 1 .
  • Obtain maximum likelihood estimate of α ( s + 1 ) = { α 1 ( s + 1 ) , , α J ( s + 1 ) } from the conditional log-likelihood function (6), given { β 1 ( s ) , , β J ( s ) , b ( s ) } .
Such iterative algorithm constructs a dependent sequence of parameter values whose distribution converges to the target joint posterior distribution with a sufficiently large number of iterations. As seen from the algorithm, parameters { θ ( s + 1 ) , Σ ( s + 1 ) , α ( s + 1 ) } are sampled from the full conditional distributions or estimated from their log-likelihood functions; the set of parameter values are thus also samples from the joint distribution.
Given that θ and Σ are estimated using conjugate prior distributions, their posterior distributions can be approximated with Gibbs sampler as described in Section 3.2.1. However, a conjugate prior distribution on { β 1 , , β J } is not available due to high dimensions and full conditional distributions of the parameters do not have a standard form due to unknown sampling parameters. In this case, M-H algorithm can be a generic method to approximate the posterior distribution. M-H is named after Nicholas Metropolis (Metropolis et al. 1953) and W.K. Hastings (Hastings 1970), which is a powerful Markov chain method to simulate multivariate distributions. Chib and Greenberg (1995) provide a tutorial introduction to the M-H algorithm and show examples on Gibbs sampler, a special case of the M-H algorithm. In our GLMM model, since the dominating density is not explicitly available, the M-H algorithm can be used under an acceptance-rejection scheme (Tierney 1994). In acceptance-rejection step, we can generate candidates using Gibbs sampler from suitable generating density, and accept or reject observations from proposal distributions by implementing generation from a uniform distribution. Each step of the Gibbs sampler generates a proposal from full conditional distribution and then accept it. The Metropolis step generates proposals from population distribution and accepts them with some probability. M-H algorithm combines both approaches and allows arbitrary proposal distributions. Different from Metropolis’s, acceptance ratio of Metropolis–Hastings is the probability of generating the current value from proposed to the probability of generating the proposed value.
For each j { 1 , , J } , Metropolis step for updating β j ( s ) by proposing a new value β j * from the multivariate normal distribution with the current mean value β j ( s ) and variance–covariance matrix Σ ( s ) and accepting or rejecting it with appropriate probability described below. Then, b ( s ) is to be updated by newly accepted { β 1 ( s + 1 ) , , β J ( s + 1 ) } .
  • Generate β j * N ( β j ( s ) , Σ ( s ) ) .
  • Compute the acceptance ratio
    r j = i = 1 I f ( y i j | μ i j * , α j ) f ( β j * | θ ( s ) , Σ ( s ) ) i = 1 I f ( y i j | μ i j ( s ) , α j ) f ( β j ( s ) | θ ( s ) , Σ ( s ) ) ,
    where μ i j * = exp ( x i j T β j * + z i j T b ( s ) ) and μ i j ( s ) = exp ( x i j T β j ( s ) + z i j T b ( s ) ) .
  • Sample u uniform ( 0 , 1 ) . Set β j ( s + 1 ) to β j * if u < r , or to β j ( s ) if u > r .
  • Update b ( s + 1 ) , given { β 1 ( s + 1 ) , , β J ( s + 1 ) , y 1 , , y J } , under our regression model given by (1) using the maximum likelihood algorithm.
In this way, the Gibbs sampler and Metropolis step described above are combined as an iterative algorithm to generate a Markov chain that can be used to approximate the joint posterior distribution of { θ , Σ , b , α } . As iteration times go large enough so that the auto correlation effects are reduced, those sets of generated samples can be used to approximate the joint posterior distribution of all the parameters.

4. Analysis of Frequencies of Data Breaches

Followed by empirical analysis presented in Section 2.2 and GLMM structure proposed in Section 3, we examine the manipulated PRC frequency dataset with unique subjective combinations. As mentioned in Section 2, the medical and non-medical portion (organization) of the data breach dataset are analyzed separately in our study. Since the only difference we treat between partitioned medical organization subdataset and non-medical organization subdataset is whether to include type of organizations as one of the covariates (we do not further partition medical organizations), we thus focus on the analysis of the non-medical portion of the PRC dataset with type of organizations factor in the rest of this paper.

4.1. Specification of Priors and Parameters

Quarterly counts of data breaches are modeled as a regression function of breach type, organization entity, entity location, and overall quarterly average severity with specific identities under NB-GLMM. The effects due to potential trends overtime are also taken into consideration. We analyze in total 69 quarters (between years 2001 and 2018) of non-medical data breach incidents data in this section. Recall that in Section 2.1 levels of categorical covariates have been combined so there are 16 uniquely identified combinations (observations) within the non-medical subdataset. Therefore, among 69 investigated quarters, each quarter has 16 uniquely identified combinations that represent different cyber risk subjects, namely, unique type of data breaches, type of organizations, and location of the entity that the breach incident occurs. Each combination can be treated as unique risk features/subjects corresponded to quarterly counts.
In order to detect the inner relationships between incident frequency and other features, a box plot is drawn in Figure 2 on frequency counts upon uniquely identified categorical level combinations for all the quarters under observation; it shows 16 boxes with each one representing the simplified distribution of 69 quarterly counts of that combination plotted upon uniquely identified level combinations. By examining these 16 distribution patterns of different combinations, we find that these count distributions differ significantly. For example, the 3rd and 8th combinations have higher log values of incident counts compared to other combinations, whereas the 12th combination has the lowest log median value of incident counts among all combinations.
We also observe a correlation between quarterly counts and their corresponding average severity of combinations. Note that the severity here means the number of data breached caused by the data breach incident. It is observed that a quarter with high frequency counts often contains more incidents with a relatively large severity. Figure 3a is made up with scatter points of quarterly frequency (in rhombus) and corresponding average severity (in circle) showing that the dependence exists between counts and severity for most of combinations. This suggests that the average quarterly severity may be used as one of the covariates that impact on the quarterly counts of uniquely identified combinations.
Relationships between breach counts and classified characteristic combinations and severity dependency are significant among quarters. In this regard, we investigate the group specific variations by treating related covariate coefficients as multivariate normal random variables centering around a mean showed in (1). Coefficients can be decomposed into fixed effects representing overall magnitude for a given quarter and random effects representing the quarterly variation among quarters.
Besides within quarter fixed effects and among quarter random effects, there is potentially a time series relationship if we treat quarterly counts in a sequence timely manner. Figure 3b shows breach counts upon total 69 quarters in time sequence. The time series effect shows a polynomial trend which could be modeled by cubic polynomial time covariates. Cubic time trend is treated with only fixed effects with the remaining systematic noise being explained by random effects of quarterly variations.
Based on the findings showed above, we choose the following covariate manipulations for the generalized linear model used in (1):
g ( μ i j ) = x i j T β j + z i j T b = l = 1 6 x l , i β l , j + k = 1 3 z k , j b k ,
where { x 1 , i , x 2 , i , x 3 , i } are the non-base level dummy variables of four regions under location covariate for the i j th count (ith combination in jth quarter), { x 4 , i } is the non-base level categories of type of breach for the i j th count, { x 5 , i } is the non-base level category of organization type and { x 6 , i } is the average severity of ith combination, { z 1 , j , z 2 , j , z 3 , j } = { j , j 2 , j 3 } are time, squared time and cubic time terms, measured in quarters. Here the effect of quarterly average severity is used by a numerical indicator to reveal the dependency between the frequency and severity. Details on the specific regions, types of data breaches and types of organizations can be found in Section 2.1. Regarding fix effects and random effects in (2), we assume random effects work on 6 factors which means M j (for fixed effects) are different for different j’s and X j = X (for random effects) is the same for all j’s, and u j follows a 6-dimensional multivariate normal distribution with mean 0 and covariate matrix Σ . Such a parameterization allows us not only to consider subject specific and group specific effects, but also to contain random effects on quarterly related factors other than time trends.

4.2. Posterior Results and Diagnoses

In this subsection, the proposed NB-GLMM is used to analyze the quarterly data breach incidents recorded by PRC database using the M-G sampling algorithm under the Bayesian framework as described in Section 3.2.2. As discussed in Section 3.2.1, a multivariate normal distribution and an inverse-Wishart distribution are chosen as the prior distributions for θ and Σ , respectively. The starting values of hyper-parameters of both prior distributions are showed in Table 4.
The values for μ 0 are set as the mean of negative binomial regression coefficients without intercept, denoted by β ¯ GLM , and for ν 0 is set as 8, which is the number of parameters p = 6 plus 2. Both Λ 0 and S 0 are set as the empirical variance–covariance matrix of regression coefficients, denoted by Σ β GLM . The starting values of β 1 , , β J , b and α used in the MCMC procedure are the negative binomial regression estimates. A total of 69 Markov chains representing 69 quarters are generated at the same time in a matrix form in the model estimation process with 100,000 iterations. In order to reduce autocorrelation, a thinning factor 10 is used. The first 200 iterations are discarded as burn-in samples and the remaining iterations are used for estimating the model parameters. A trace plot and autocorrelation function (ACF) are used to verify the proper convergence of simulation runs.
Table 5 displays the information about the posterior summary statistics of model parameters θ and regression coefficients b , including the posterior mean, standard error, and highest posterior density (HPD) intervals; the posterior means of the elements of the variance-covariance matrix Σ can be found in Appendix A. The results show that West region has the largest effects on number of counts per quarter. This may be because major tech companies are headquartered along the Pacific Coast where valuable gathered data are stored and shared over Internet. External breach type has a higher impact on breach frequency possibly because attackers tend to seek some types of benefit from breaching the victim’s network. Business organizations receive more cyber breaches than non-business organization, which may be resulted from the reality that business organizations have various types of valuable information properties than non-business organizations do. As for the influence of average size, one unit increase in logarithm average severity causes a 0.8437-unit increase in breach counts on average.
For each of the GLMM model parameters, MCMC generates a convergence diagnostic panel, which includes a trace plot, autocorrelation plot and a kernel density plot. We first assess if chains have run long enough for reliable estimations by monitoring convergence of iterative simulations (Brooks and Gelman 1998), and then examine these diagnostic plots. Figure 4 and Figure 5 show selected diagnostics for the slope coefficients θ 4 and b 2 . Figure 4a,b are trace plots that show the number of iterations on the horizontal axis, plotted against the value of accepted coefficient of internal breach type θ 4 and b 2 on the vertical axis, respectively. Since there are no long term trends in these trace plots and the mixing is moving efficiently, we can affirm that the MCMC iteration converges. Figure 5a,b display the ACF values (Cowles and Carlin 1996) of accepted coefficients θ 4 and b 2 , respectively, at lag k on the vertical axis and k on the horizontal axis. Ideally, the autocorrelation at any lag should not be statistically significantly different from zero. It can be seen from the plot that the autocorrelations of θ 4 and b 2 are not significantly far from zero and the estimated autocorrelations are within the 95% confidence interval. These results support the conclusion that our MCMC iterations have converged.

5. Simulation Study and Validation Test

We design a simulation study to verify the accuracy and effectiveness of the parameter estimations and the model predictability. The exploratory data analysis showed in this section should provide supports for the proposed NB-GLMM model. The simulation model is established in accordance with similar assumptions and design scheme of our analytical model. For demonstration purpose, this simulation study uses the same multivariate normal distribution estimated from Section 4.2. Given the sets of coefficients from multivariate normal distribution, we can generate target variable counts from generalized linear relationships. True values of model parameters are taken from Table 5 and Appendix A. According to the hierarchical requirements, we first draw 69 β s from a 6-dimensional multivariate normal model with mean θ and variance Σ ; together with posterior mean of b , they consist 69 sets of independent quarter coefficients. Multiplying 69 sets of coefficients to the manipulated covariates using (7) leads to 69 logarithm mean of the negative binomial distribution. Combining those mean parameters with dispersion parameters we estimated previously, we generate 16 observations on uniquely identified combinations for each quarter, which results a total of 1104 observations. In this way we make sure that the simulated data follows the same patterns as experimental data. The new data set of 1104 testees is generated using the MCMC estimates obtained on the original dataset. Taking these observations as one dataset, we further generate 100 datasets following the same algorithm. Simulated datasets are then investigated under the same procedure as presented in Section 3.2. The estimated hyper-parameters are determined using MCMC and M-G methodologies, as well as maximum likelihood estimation under Bayesian framework. Here the MCMC analyses utilize the same prior distributions and the starting values are the same as obtained from the empirical estimation.
The estimated posterior means of coefficient parameters and the relative differences (errors) between the true and estimated values obtained under our modeling and estimation procedures are displayed in Table 6, where the relative error is calculated by dividing the difference of the estimated value and its corresponding true value by its true value (used for simulation). As seen from Table 6, differences between the true value and the estimated posterior means, illustrated by relative errors, are all relatively small, implying that these estimated posteriors are all centered compactly around their true values. On the other hand, all the estimated results from our simulation study have over 99 % confidence intervals where the true values fall into. All these imply that our estimation algorithm is effective and estimation results are satisfied in terms of their accuracy.
To examine the model predictability and its accuracy under our GLMM settings, we employ 5-fold cross-validation procedure to have an objective evaluation of the prediction performance. Cross-validation was first applied when evaluating the use of a linear regression equation for predicting a criterion variable (Mosier 1951). It provides a more realistic estimate of model generalization error by repeating cross-validations based on the same dataset with large calibration/training samples and small validation/test samples. In particular, we randomly divide the dataset 10 times into five folds; four of them are used to train the GLMM and remaining one is used to compare its predicted values and actual ones. The performance of the test datasets should be similar to that of the training datasets. Our purpose of conducting cross validations is to ensure that our model has not over-fitted the training dataset and that it performs well on the test dataset. In order to testify our GLMM prediction accuracy, we also fit our training dataset to Poisson and NB regression models, respectively. The root mean squared error (RMSE) metric is taken as a summary fit statistic, which can provide useful information for quantifying how well that our GLMM fits the dataset. A good performance with a relative low RMSE indicates that our proposed GLMM is fine-tuned. RMSE values are calculated by
RMSE = 1 n i = 1 n ( y i y ^ i ) 2
where n is the number of tested observations, y i is the ith actual target value, and y ^ i is the ith predicted value based on trained model.
Table 7 gives summary fit statistics for Poisson regression, NB regression, and NB-GLMM on training dataset and test dataset. We first compare training set RMSEs for model accuracy. The predicted accuracy of three models is compared under same training set measured by RMSE. The lowest training RMSE value of GLMM implies that it has the highest prediction level. We then compare GLMM RMSEs between the training set and the test set to test over-fitting. According to our cross validation results, the training set has a mean of 4.6384 RMSE which means that the average deviation between the 69 predicted quarterly counts and the actual quarterly ones is 4.6384 .
A 4.8481 RMSE of the test dataset is close enough to that of the training dataset, which means that our model is not over-fitted. A higher RMSE of the test dataset is judged as an improvement in model fit when using the training dataset to build the model. Given the fact that two RMSEs do not have much difference, there is no evidence showing that our GLMM is over-fitted. These two relatively low values of RMSE also show that our model, GLMM, achieves the best model accuracy for frequency counts predictions among other tested models.

6. Practical Implications

In this section, we discuss the potential applications and practical implications of our modeling results in cyber risk mitigation and management. We have proposed a NB-GLMM with group-specific fixed effects and among group random effects on some featured variables including the type of breached, type of organizations and their geographical location and associated average severity caused by data breaches under these uniquely identified features. We also consider the impact of the trend over time on the breach frequencies. In general, this study can increase the awareness that it is important to analyze the growth trends of cyber incidents frequency among sub-characteristic groups. We discuss below the impact of our modeling and predictive analytic approaches in relation to cyber risks from both the perspective of the organization (potential insured) and the insurance company (insurer), as well as other important stakeholders such as corporate information technology (IT) and data security officers, and data scientists.
From the perspective of organizations, our results provide quantitative insights to organizations with different entity types and locations, which encourages firms to adopt new techniques and technologies in managing risks with respect to the cyber-related risks they are facing. Gordon and Loeb (2002) present an economic model that can be used to determine the optimal amount to invest to protect a given set of information. The model takes into consideration the vulnerability of the information to a security breach and the potential loss it may cause. Given a company’s physical and geographical characteristics, our GLMM model is able to predict their estimated quarterly data breach frequencies so that firms can determine whether to accept the risk or to seek out risk transformation in order to mitigate risks. Mazzoccoli and Naldi (2020) propose an integrated cyber risk management strategy that combines insurance and security investments, and investigate whether it can be used to reduced overall security expenses. The optimal investment for their proposed mixed strategy is derived under several insurance policies. This type of risk management strategies could also include the consideration of the risk over a specified time horizon; our model can provide an effective predictive guidance for managing cyber risks with respect to data breach incidents occurred within a quarterly time interval. The organizations could act based on our findings when they put cyber risk management into practice.
In some cases, managing cyber risks through internal controls would be impractical or too costly especially when organizations are facing high frequency of breach incidents. Consequently, organizations may seek insurance coverage as alternative means to transfer their cyber related risks. Reducing cyber risk exposures by purchasing insurance also take advantage of reducing the capital that must be allocated to the cyber risk management. In general, cyber insurance combined with adequate security system investments should allow organizations to better manage their cyber-related risks. Young et al. (2016) present a framework that incorporates insurance industry operating principles to support quantitative estimates of cyber-related risk and the implementation of mitigation strategies.
From the perspective of insurance companies, besides those incentives from organizations to increase cyber insurance purchases, our results also encourage insurance companies to think about how much premiums they want to collect because they expect to be paid adequately to accept the risk. Current pricing of cyber insurance is based on expert models rather than on historical data. An empirical approach to identifying and evaluating potential exposure measure is important but challenging due to the current scarcity of reliable, representative, and publicly available loss experience for cyber insurance. This paper avoids this limitation by illustrating how to utilize available full exposure data to obtain a quantitative idea of cyber premium pricing. We present a methodology to rigorously classify different risk levels of insureds. Our modeling results can ease one of the problems that cyber risk insurers face, the disparity in premiums with respect to different characteristic groups, by forecasting loss frequency on different characteristic segmentations. Geographical area is one of the most well-established and widely-used rating variables, whereas business type is considered as one of the primary drivers of cyber claims experience.
Ideally, the cyber insurance rating system should consider various rate components, such as business type and geographic location in our model, when calculating the overall premium charged for cyber risks. The portion of the total premium that varies by risk characteristics, shown as a function of the base rate and rate differentials, is referred to as a variable premium (Werner and Modlin 2010). Our work can be directly applied in setting variable premium factors by using posterior frequency distributions upon different risk characteristic segments. The premium P under the standard deviation premium principle (Tse 2009) for pricing variable premium, for example, is given by
P = E [ S ] + θ Var ( S ) ,
where S is the aggregated total loss, and θ is the loading factor. To calculate the premium rate P in this case, the first two moments of the distribution of S need to be determined. We use a quarter as our investigation window period which is the same as our NB-GLMM frequency time interval. The severity portion that we use to calculate the aggregate quarterly loss is based on the latest three years quarterly average loss amount (number of data breaches recorded) for the purpose of simplicity. Using the posterior frequency distributions on characteristic segments obtained in Section 4.2, we generate a set of total 16 aggregate loss distributions for all the level combinations. By using the frequency-severity technique, the aggregated quarterly loss distribution S can be obtained. We then apply log-log model2 raised by Jacobs (2014) (also used in (Eling and Loperfido 2017) to estimate prices for cyber insurance policies) to convert the number of records breached into its corresponding dollar amount loss.
Let S L be the insurance payment per loss with policy limit u and deductible d. The kth moment of S L can be calculated by
E S L k = d u x k f S ( x ) d x + ( d + u ) k ( 1 F S ( d + u ) ) d k ( 1 F S ( d ) ) ,
(Klugman et al. 2012). The mean and variance of S L , E [ S L ] and Var ( S L ) , can be determined by (8) using bootstrap from set of posterior distributions of coefficients.
Table 8 lists predictions of next3 quarter aggregate monetary loss of internal breach types on two representative geographical locations Northeast and West with or without deductible (of amount USD 10,000) and/or policy limit (of amount USD 1 million).
Based on these results, we have several interesting findings from different perspectives. Firstly, there is a significant difference in loss amount between the Northeast and West regions. Estimated loss amount for Northeast region ranges from USD 197,891 to USD 2,283,023, whereas that for West area ranges from USD 1,408,541 to USD 14,661,661. Secondly, non-business organizations face much higher cyber risks than business organizations do according to their more than 10 times estimated loss differences. Furthermore, whether having deductibles makes no big difference in cyber losses as almost the same estimated loss amount with and without a deductible (of amount USD 10,000) is observed. Last but not least, setting a maximum coverage loss amount can reduce covered cyber losses gigantically in non-business organizations compared with that in business organizations. Those insights are worth to consider while setting premium rates and designing insurance products in order to reach an equilibrium covering limited risk by sufficient amount of premiums. These quantitative insights provide relative differential rates information when setting adjusted manual rates in premium pricing. Insurance companies are able to maintain high solvency in the differentiated pricing case compared to the case of non-differentiated pricing (Pal et al. 2017).
In addition to a better idea of defining risk classes, the paper illustrates how to work with current available data and update the model components and parameters by collected cyber related data over time. Our model decomposes risk effects on cyber breach frequencies into fixed effects and random effects based on classified characteristics, average severity and non-linear time trend effects. Bayesian statistics are particularly useful in simulating from the posterior distribution of the number of incidents (claims) in a future quarterly based time period given risk characteristics. Due to the nature of Bayesian methodology, some of the assumptions, such as the polynomial time trend, and parameters choices might be updated in the future once suitable data is available. Moreover, individual features of the model can be refined or replaced to incorporate properties of given internal datasets without changing the overall model structure. The updates and modifications enable our model to be a precise predictor for data breach frequencies.

7. Conclusions

This paper develops a statistical model for cyber breach frequencies that considers not only characteristics such as risk profile, location and industry, but also average loss sizes and time effects. It provides an effective and comprehensive modeling approach for predictive analytics due to the consideration of dependent and correlated risk aspects. We believe that our study makes an important and novel contribution to the actuarial literature in the sense that our NB-GLMM for cyber breach frequencies considers risk category, company census, severity dependence and time trend effects together in quantifying and predicting quarterly number of data breach incidents, a fundamental quantity for appropriately setting the manual rates.
The study of cyber risks is important for insurance companies in mitigating and managing their risks given that the functioning of the insurance business is a complex process. In this view, our study is of practical value for insurance companies, since the consideration of the most dangerous risks for each business entity will allow forming a relevant information security for the company. Enterprises need to take several measures in dealing with cyber risks: operations based on statistical modeling in actuarial analysis process, ensuring the balance and adequacy of tariffs in pricing process and adjusting premium rates in insurance marketing. Our research results can be used as a differential indicator on different organization types and geographical locations. In addition, our study can also be useful for data security officers and scientists, and other potential corporate stakeholders for them to better understand the impact of the cyber risks for business operations.
Another important aspect of this study is the use of the publicly available PRC data on developing actuarial approaches to quantify cyber loss frequencies. However, the quality of available data and whether the data represents well cyber risks in general also lead to a limitation of this paper. The fact that firms do not reveal details concerning security breaches reduces data accuracy, and not voluntarily reporting cyber breaches leads to data inadequacy. Moreover, Privacy Rights Clearinghouse has stopped updating latest breach incidents since 2019, which causes data inconsistency in a time trend manner. The availability of high-quality data such as policy or claim database in the future would open up new research opportunities. Our model is subjective and can be modified to accommodate the features of new dataset and the purpose of prediction.
Despite the limitations, the proposed NB-GLMM makes a notable methodological contribution to the cyber insurance area as it provides a theoretically sound modeling perspective in frequency quantification, and provides a practical and statistical framework and approach for practitioners to customize and update based on their predictive needs. In the next step of our research, we are going to analyze zero-inflated heavy tailed severity (the number of data breached due to breach incidents and their corresponding monetary losses incurred) using finite mixture model and extend the analysis using extreme value theory. Together with GLMM frequency predictive model, we can simulate aggregate full insurance losses for given characteristics. Moreover, we will use a numeric approach to test predicted overall aggregate claim amounts under different factor combinations in any projecting period in order to make characterization of premiums. For instance, pure technical insurance premiums can be expressed as a VaR or TVaR metric and computed from the loss distribution of each risk category. Lastly, this two-part severity-frequency actuarial quantification method seeks to overcome some of above-mentioned data limitations such as inadequacy and inconsistency.

Author Contributions

Author Contributions: Conceptualization, M.S. and Y.L.; methodology, M.S. and Y.L.; software, M.S.; validation, M.S.; formal analysis, M.S.; investigation, M.S.; data curation, M.S.; writing—original draft preparation, M.S.; writing—review and editing, Y.L.; supervision, Y.L.; funding acquisition, Y.L. All authors have read and agreed to the published version of the manuscript.

Funding

This research for Yi Lu was funded by Natural Science and Engineering Research Council of Canada, grant number RGPIN/05640-2019.

Data Availability Statement

Data Availability Statement: Publicly available dataset was analyzed in this study. This data can be found here: https://privacyrights.org/data-breaches (accessed on 1 October 2022).

Acknowledgments

We are grateful to the three anonymous referees for their valuable comments for improving the manuscript. This research was partially supported by Graduate Entrance Dean Scholarship (for Ph.D. Program) of Simon Fraser University for Meng Sun and an NSERC (Natural Science and Engineering Research Council of Canada) individual Discovery Grant for Yi Lu.

Conflicts of Interest

The authors declare no conflict of interest.

Appendix A. Posterior Estimation of Variance–Covariance Matrix

The posterior estimation of variance–covariance matrix Σ :
Σ ^ = ( σ ^ i j ) = 0.0893 0.0513 0.0763 0.0041 0.0002 0.0061 0.0513 0.1005 0.0641 0.0126 0.0097 0.0072 0.0763 0.0641 0.1166 0.0133 0.0066 0.0084 0.0041 0.0126 0.0133 0.0421 0.0115 0.0008 0.0002 0.0097 0.0066 0.0115 0.0199 0.0003 0.0061 0.0072 0.0084 0.0008 0.0003 0.0008
where σ ^ i j is the mean of posterior distribution of σ i j .

Notes

1
Unknown types of breach and business have been eliminated due to their incomplete information.
2
ln ( dollar amount loss ) = 7.68 + 0.76 · ln ( records breached ) .
3
Since the available range of PRC dataset is from 2001 to 2018, here next quarter could be the next quarter after latest available data.

References

  1. Antonio, Katrien, and Jan Beirlant. 2007. Actuarial statistics with generalized linear mixed models. Insurance: Mathematics and Economics 40: 58–76. [Google Scholar] [CrossRef]
  2. BBC News. 2021. US Companies Hit by ‘Colossal’ Cyber-Attack. Available online: https://www.bbc.com/news/world-us-canada-57703836 (accessed on 1 October 2022).
  3. Bessy-Roland, Yannick, Alexandre Boumezoued, and Caroline Hillairet. 2021. Multivariate hawkes process for cyber insurance. Annals of Actuarial Science 15: 14–39. [Google Scholar] [CrossRef]
  4. Bozdogan, Hamparsum. 1987. Model selection and akaike’s information criterion (aic): The general theory and its analytical extensions. Psychometrika 52: 345–70. [Google Scholar] [CrossRef]
  5. Breslow, Norman E., and David G. Clayton. 1993. Approximate inference in generalized linear mixed models. Journal of the American statistical Association 88: 9–25. [Google Scholar]
  6. Brooks, Stephen P., and Andrew Gelman. 1998. General methods for monitoring convergence of iterative simulations. Journal of Computational and Graphical Statistics 7: 434–55. [Google Scholar]
  7. Carfora, Maria Francesca, and Albina Orlando. 2019. Quantile based risk measures in cyber security. Papar presented at 2019 International Conference on Cyber Situational Awareness, Data Analytics And Assessment (Cyber SA), Oxford, UK, June 3–4; pp. 1–4. [Google Scholar]
  8. Casella, George, and Edward I. George. 1992. Explaining the gibbs sampler. The American Statistician 46: 167–74. [Google Scholar]
  9. Chatfield, Christopher, and Alexander J. Collins. 2018. Introduction to Multivariate Analysis. London: Routledge. [Google Scholar]
  10. Chib, Siddhartha, and Edward Greenberg. 1995. Understanding the metropolis-hastings algorithm. The American Statistician 49: 327–35. [Google Scholar]
  11. Cowles, Mary Kathryn, and Bradley P. Carlin. 1996. Markov chain monte carlo convergence diagnostics: A comparative review. Journal of the American Statistical Association 91: 883–904. [Google Scholar] [CrossRef]
  12. Data Accountability and Trust Act. 2019. Available online: https://www.congress.gov/bill/116th-congress/house-bill/1282 (accessed on 1 October 2022).
  13. Data Security and Breach Notification Act. 2015. Available online: https://www.congress.gov/bill/114th-congress/house-bill/1770 (accessed on 1 October 2022).
  14. Dempster, Arthur P. 1968. A generalization of bayesian inference. Journal of the Royal Statistical Society: Series B (Methodological) 30: 205–32. [Google Scholar]
  15. Edwards, Benjamin, Steven Hofmeyr, and Stephanie Forrest. 2016. Hype and heavy tails: A closer look at data breaches. Journal of Cybersecurity 2: 3–14. [Google Scholar] [CrossRef] [Green Version]
  16. Eling, Martin. 2020. Cyber risk research in business and actuarial science. European Actuarial Journal 10: 303–33. [Google Scholar] [CrossRef]
  17. Eling, Martin, and Kwangmin Jung. 2018. Copula approaches for modeling cross-sectional dependence of data breach losses. Insurance: Mathematics and Economics 82: 167–80. [Google Scholar] [CrossRef]
  18. Eling, Martin, and Nicola Loperfido. 2017. Data breaches: Goodness of fit, pricing, and risk measurement. Insurance: Mathematics and Economics 75: 126–36. [Google Scholar] [CrossRef]
  19. Fahrenwaldt, Matthias A., Stefan Weber, and Kerstin Weske. 2018. Pricing of cyber insurance contracts in a network model. ASTIN Bulletin: The Journal of the IAA 48: 1175–218. [Google Scholar] [CrossRef] [Green Version]
  20. Farkas, Sébastien, Olivier Lopez, and Maud Thomas. 2021. Cyber claim analysis using generalized pareto regression trees with applications to insurance. Insurance: Mathematics and Economics 98: 92–105. [Google Scholar] [CrossRef]
  21. FBI. 2000. Internet Crime Complaint Center (IC3). Available online: https://www.fbi.gov/investigate/cyber (accessed on 1 October 2022).
  22. Gamerman, Dani, and Hedibert F. Lopes. 2006. Markov Chain Monte Carlo: Stochastic Simulation for Bayesian Inference. Boca Raton: CRC Press. [Google Scholar]
  23. Garrido, José, and Jun Zhou. 2009. Full credibility with generalized linear and mixed models. ASTIN Bulletin: The Journal of the IAA 39: 61–80. [Google Scholar] [CrossRef] [Green Version]
  24. Geman, Stuart, and Donald Geman. 1984. Stochastic relaxation, gibbs distributions, and the bayesian restoration of images. IEEE Transactions on Pattern Analysis and Machine Intelligence PAMI- 6: 721–41. [Google Scholar] [CrossRef]
  25. Gilks, Walter R. 1996. Introducing markov chain monte carlo. In Markov Chain Monte Carlo in Practice. London: Routledge. [Google Scholar]
  26. Gordon, Lawrence A., and Martin P. Loeb. 2002. The economics of information security investment. ACM Transactions on Information and System Security (TISSEC) 5: 438–57. [Google Scholar] [CrossRef]
  27. Hastings, W. Keith. 1970. Monte Carlo Sampling Methods Using Markov Chains and Their Applications. Oxford: Oxford University Press. [Google Scholar]
  28. Hilbe, Joseph M. 2011. Negative Binomial Regression. Cambridge: Cambridge University Press. [Google Scholar]
  29. Hoff, Peter D. 2009. A First Course in Bayesian Statistical Methods. Berlin and Heidelberg: Springer, vol. 580. [Google Scholar]
  30. IBM. 2021. Security Cost of Data Breach Report. Available online: https://www.ibm.com/downloads/cas/ojdvqgry (accessed on 1 October 2022).
  31. Internet Crime Report. 2020. Available online: https://www.ic3.gov/media/pdf/annualreport/2020{_}ic3report.pdf (accessed on 1 October 2022).
  32. Jacobs, Jay. 2014. Analyzing Ponemon Cost of Data Breach. Available online: http://datadrivensecurity.info/blog/posts/2014/dec/ponemon/ (accessed on 28 September 2022).
  33. Jain, Anil K., M. Narasimha Murty, and Patrick J. Flynn. 1999. Data clustering: A review. ACM Computing Surveys (CSUR) 31: 264–23. [Google Scholar] [CrossRef]
  34. Jeong, Himchan, Emiliano A. Valdez, Jae Youn Ahn, and Sojung Park. 2021. Generalized linear mixed models for dependent compound risk models. Variance 14: 1–18. [Google Scholar] [CrossRef]
  35. Jevtić, Petar, and Nicolas Lanchier. 2020. Dynamic structural percolation model of loss distribution for cyber risk of small and medium-sized enterprises for tree-based lan topology. Insurance: Mathematics and Economics 91: 209–23. [Google Scholar] [CrossRef]
  36. Joe, Harry, and Rong Zhu. 2005. Generalized poisson distribution: The property of mixture of poisson and comparison with negative binomial distribution. Biometrical Journal: Journal of Mathematical Methods in Biosciences 47: 219–29. [Google Scholar] [CrossRef] [PubMed]
  37. Klugman, Stuart A., Harry H. Panjer, and Gordon E. Willmot. 2012. Loss Models: From Data to Decisions. Hoboken: John Wiley & Sons, vol. 715. [Google Scholar]
  38. Kshetri, Nir. 2020. The evolution of cyber-insurance industry and market: An institutional analysis. Telecommunications Policy 44: 102007. [Google Scholar] [CrossRef]
  39. Maillart, Thomas, and Didier Sornette. 2010. Heavy-tailed distribution of cyber-risks. The European Physical Journal B 75: 357–64. [Google Scholar] [CrossRef]
  40. Mazzoccoli, Alessandro, and Maurizio Naldi. 2020. Robustness of optimal investment decisions in mixed insurance/investment cyber risk management. Risk Analysis 40: 550–64. [Google Scholar] [CrossRef] [PubMed]
  41. McCulloch, Charles E. 2006. Generalized linear mixed models. In Encyclopedia of Environmetrics. Hoboken: John Wiley & Sons, vol. 2. [Google Scholar]
  42. McCulloch, Charles E., and Shayle R. Searle. 2004. Generalized, Linear, and Mixed Models. Hoboken: John Wiley & Sons. [Google Scholar]
  43. Metropolis, Nicholas, Arianna W. Rosenbluth, Marshall N. Rosenbluth, Augusta H. Teller, and Edward Teller. 1953. Equation of state calculations by fast computing machines. The Journal of Chemical Physics 21: 1087–92. [Google Scholar] [CrossRef] [Green Version]
  44. Metropolis, Nicholas, and Stanislaw Ulam. 1949. The monte carlo method. Journal of the American Statistical Association 44: 335–41. [Google Scholar] [CrossRef]
  45. Mosier, Charles I. 1951. I. problems and designs of cross-validation 1. Educational and Psychological Measurement 11: 5–11. [Google Scholar] [CrossRef]
  46. NAIC. 2020. National Association of Insurance Commissioners Report on the Cybersecurity Insurance Market. Available online: https://www.insurancejournal.com/app/uploads/2021/11/naic-cyber_insurance-report-2020.pdf (accessed on 1 October 2022).
  47. Pal, Ranjan, Leana Golubchik, Konstantinos Psounis, and Pan Hui. 2017. Security pricing as enabler of cyber-insurance a first look at differentiated pricing markets. IEEE Transactions on Dependable and Secure Computing 16: 358–72. [Google Scholar] [CrossRef] [Green Version]
  48. Piegorsch, Walter W. 1990. Maximum likelihood estimation for the negative binomial dispersion parameter. Biometrics 46: 863–67. [Google Scholar] [CrossRef]
  49. Pinheiro, José C., and Edward C. Chao. 2006. Efficient laplacian and adaptive gaussian quadrature algorithms for multilevel generalized linear mixed models. Journal of Computational and Graphical Statistics 15: 58–81. [Google Scholar] [CrossRef]
  50. PRC. 2019. Privacy Rights Clearinghouse Chronology of Data Breaches. Available online: https://privacyrights.org/data-breaches (accessed on 1 October 2022).
  51. Rathee, Avisha. 2020. Data breaches in healthcare: A case study. CYBERNOMICS 2: 25–29. [Google Scholar]
  52. Raudenbush, Stephen W., Meng-Li Yang, and Matheos Yosef. 2000. Maximum likelihood for generalized linear models with nested random effects via high-order, multivariate laplace approximation. Journal of computational and Graphical Statistics 9: 141–57. [Google Scholar]
  53. Rudolph, Max J. 2022. 15th Annual Survey of Emerging Risks. Available online: https://www.casact.org/sites/default/files/2022-08/15th-survey-emerging-risks.pdf (accessed on 1 October 2022).
  54. Schall, Robert. 1991. Estimation in generalized linear models with random effects. Biometrika 78: 719–27. [Google Scholar] [CrossRef]
  55. Schnell, Werner. 2020. Does Cyber Risk Pose a Systemic Threat to the Insurance Industry? Working Paper. Available online: https://www.alexandria.unisg.ch/260003/ (accessed on 1 October 2022).
  56. Smith, Adrian F. M., and Gareth O. Roberts. 1993. Bayesian computation via the gibbs sampler and related markov chain monte carlo methods. Journal of the Royal Statistical Society: Series B (Methodological) 55: 3–23. [Google Scholar] [CrossRef]
  57. Stroup, Walter W. 2012. Generalized Linear Mixed Models: Modern Concepts, Methods and Applications. Boca Raton: CRC Press. [Google Scholar]
  58. Tierney, Luke. 1994. Markov chains for exploring posterior distributions. the Annals of Statistics 22: 1701–728. [Google Scholar] [CrossRef]
  59. Tse, Yiu-Kuen. 2009. Nonlife Actuarial Models: Theory, Methods and Evaluation. Cambridge: Cambridge University Press. [Google Scholar]
  60. Werner, Geoff, and Claudine Modlin. 2010. Basic Ratemaking. Arlington: Casualty Actuarial Society, vol. 4, pp. 1–320. [Google Scholar]
  61. Wheatley, Spencer, Thomas Maillart, and Didier Sornette. 2016. The extreme risk of personal data breaches and the erosion of privacy. The European Physical Journal B 89: 1–12. [Google Scholar] [CrossRef]
  62. Wolfinger, Russ, and Michael O’connell. 1993. Generalized linear mixed models a pseudo-likelihood approach. Journal of statistical Computation and Simulation 48: 233–43. [Google Scholar] [CrossRef]
  63. Xie, Xiaoying, Charles Lee, and Martin Eling. 2020. Cyber insurance offering and performance: An analysis of the us cyber insurance market. The Geneva Papers on Risk and Insurance-Issues and Practice 45: 690–736. [Google Scholar] [CrossRef]
  64. Xu, Maochao, Kristin M. Schweitzer, Raymond M. Bateman, and Shouhuai Xu. 2018. Modeling and predicting cyber hacking breaches. IEEE Transactions on Information Forensics and Security 13: 2856–871. [Google Scholar] [CrossRef]
  65. Young, Derek, Juan Lopez Jr., Mason Rice, Benjamin Ramsey, and Robert McTasney. 2016. A framework for incorporating insurance in critical infrastructure cyber risk strategies. International Journal of Critical Infrastructure Protection 14: 43–57. [Google Scholar] [CrossRef]
Figure 1. Histograms on different organizations.
Risks 10 00224 g001
Figure 2. Quarterly frequency counts on specified combinations.
Risks 10 00224 g002
Figure 3. Effects decomposition, (a) Scaled frequency and severity, (b) Polynomial time trend effect.
Risks 10 00224 g003
Figure 4. Trace plots, (a) trace plot for θ 4 , (b) trace plot for b 2 .
Risks 10 00224 g004
Figure 5. Autocorrelation plots, (a) autocorrelation plot for θ 4 , (b) autocorrelation plot for b 2 .
Risks 10 00224 g005
Table 1. Covariate level combination.
Chronology Legend LabelsStatistical Inputs
CARDFraud Involving Debit and Credit CardsExternal
HACKHacked by an Outside Party or Infected by Malware
INSDInsiderInternal
PHYSPhysical Paper Documents
PORTPortable Device
STATStationary Computer Loss
DISCOther Disclosure
UNKNNot Enough Information about Breach
BSFBusinesses (Financial and Insurance Services)Businesses
BSRBusinesses (Retail/Merchant including Online Retail)
BSOBusinesses (Other)
EDUEducational InstitutionsNon-Businesses
GOVGovernment and Military
NGONonprofits
UNKNNot Enough Information about Breach
Table 2. Summary statistics.
Entity TypeMinimumMaximumMeanMedianVarianceProportion of Zeros
Non-Medical0202.27726.0140.267
Medical0374.762322.2740.096
Table 3. Goodness-of-fit results.
Entity TypeNon-MedicalMedical
Poisson76175947
Negative Binomial67394552
Zero-inflated Poisson71655657
Zero-inflated Negative Binomial69414555
Table 4. Simulation starting values.
ParameterDistributionStarting Value
θ N ( μ 0 , Λ 0 ) μ 0 = β ¯ GLM ;    Λ 0 = Σ β GLM
ine Σ W 1 ν 0 , S 0 1 ν 0 = p + 2 ;    S 0 = Σ β GLM
Table 5. Posterior summary and interval statistics.
RegressorSymbolMeanStandard Error95% HPD Interval
South θ 1 1.25360.00150.40532.2278
West θ 2 2.20020.00111.48982.9617
Northeast θ 3 0.71150.00110.01411.3812
ine Internal θ 4 −1.41760.0011−2.0852−0.8232
ine Non-Business θ 5 −0.21810.0011−0.98580.3756
ine Ave-Size θ 6 −0.16990.0001−0.2322−0.1103
ine Time 1 b 1 0.5892 9.0579 × 10 5 0.53550.6997
Time 2 b 2 1.4591 × 10 2 2.7746 × 10 6 1.6347 × 10 2 1.2929 × 10 2
Time 3 b 3 1.0075 × 10 4 2.4653 × 10 8 8.5920 × 10 5 1.1628 × 10 4
Note: Time 1 , Time 2 and Time 3 represent the Time to the power 1 , 2 and 3, respectively.
Table 6. Simulation summary results.
RegressorParameterTrue ValuesEstimated MeanRelative Error
South θ 1 1.25361.2018−0.0413
West θ 2 2.20022.25240.0237
Northeast θ 3 0.71150.74290.0442
ine Int. θ 4 −1.4176−1.53680.0841
ine Non-Bus. θ 5 −0.2181−0.23350.0708
ine Ave-Size θ 6 −0.1699−0.17420.0255
ine Time 1 b 1 0.58920.5809−0.0141
Time 2 b 2 1.4591 × 10 2 1.4202 × 10 2 −0.0267
Time 3 b 3 1.0075 × 10 4 0.9913 × 10 4 −0.0161
Note: Time 1 , Time 2 and Time 3 represent the Time to the power 1 , 2 and 3, respectively.
Table 7. Summary fit statistics.
PartitionTraining SetTest Set
ModelPoissonNegative BinomialGLMMGLMM
RMSE 5.1749 5.0516 4.6384 4.8481
Table 8. Quarterly aggregate loss in dollar amount.
LocationBusiness TypeDeductibleMax. CoverageEstimated Loss
NortheastBusiness--USD 197,891
USD 10,000-USD 188,469
-USD 1MUSD 197,891
USD 10,000USD 1MUSD 188,469
Non-Business--USD 2,283,023
USD 10,000-USD 2,273,881
-USD 1MUSD 1,164,335
USD 10,000USD 1MUSD 1,162,902
WestBusiness--USD 1,408,541
USD 10,000-USD 1,398,568
-USD 1MUSD 1,264,013
USD 10,000USD 1MUSD 1,260,245
Non-Business--USD 14,661,661
USD 10,000-USD 14,651,699
-USD 1MUSD 1,680,241
USD 10,000USD 1MUSD 1,680,149
Publisher’s Note: MDPI stays neutral with regard to jurisdictional claims in published maps and institutional affiliations.

