
Unveiling the Role of Investment Tangibility on Financial Leverage: Insights from African-Listed Firms

Department of Economics and Finance, University of the Free State, FGG-C 3rd Floor, Room 348, P.O. Box 339, Bloemfontein 9300, South Africa
Risks 2023, 11(11), 192; https://doi.org/10.3390/risks11110192
Submission received: 12 September 2023
/
Revised: 20 October 2023
/
Accepted: 27 October 2023
/
Published: 1 November 2023
(This article belongs to the Special Issue Corporate Finance and Intellectual Capital Management)
Abstract
:The asset structure of a firm plays a pivotal role in determining its leverage. A higher proportion of physical assets is often associated with high debt ratios. This study explores the impact of investment tangibility on financial leverage, examining both tangible and intangible investments. Using a dynamic panel data model estimated through the two-step system generalized method of moments (GMM), we analyse a dataset encompassing 815 non-financial listed firms from 22 African stock markets. The results show that African firms have higher inclinations to invest in physical assets. We found a statistically significant negative relationship between leverage and tangible and intangible investments. The findings indicate that African firms tend to maintain lower leverages regardless of whether they invest in tangible or intangible assets. The observed relationship aligns with the hypothesis that high-growth firms, in their expansion efforts, strategically tend to opt for low debt to mitigate the agency costs associated with debt and to help prevent underinvestment. This outcome underscores the interconnected nature of financing and investment decisions. This research contributes to the literature on financial leverage and investment by dissecting investments into tangible and non-tangible components and highlighting their distinct impacts on leverage. Moreover, it provides empirical evidence for previously unexplored African firms, shedding light on the reasons behind the relatively low leverage levels observed in African firms.
1. Introduction
Amidst the ongoing industrial revolution, the swift advancement of digitisation, Artificial Intelligence (AI), and big data have elevated the significance of intangible assets, such as data, brand value, and information. Consequently, lenders and investors now shift their focus away from solely valuing physical assets, recognising the equal importance of intangibles in the assessment process. Globally, there has been a growth in the proportion of intangible assets in firm investments (Crouzet and Eberly 2023). For instance, Graham et al. (2015) state that the asset tangibility of US firms has decreased, which is associated with an increase in intangibles over the decades. Jona-Lasinio and Meliciani (2018) note the increase in the importance of intangible assets for economic growth, supported by Corrado et al. (2009), who indicate that in the US, about half of firms’ investments are directed to intellectual property. Intangible investments drive the modern economy with new technology, fundamentally altering the way that business is conducted and the structure of the economy (D’Amato 2021). Traditional financial theory indicates that physical assets form a company’s foundation and make up most of its capital spending. On the other hand, recent developments in financial theory suggest that intangible investments play vital roles in determining a company’s future value and growth opportunities, which may vary based on the nature of the business (Norkio 2023; Lim et al. 2020). Intangible assets are key factors in ensuring innovation, which is a key driver of economic growth (Piekkola 2011).
The composition of assets is a critical determinant of a company’s leverage. Firms with substantial tangible assets typically have and sustain higher debt ratios because financial institutions readily offer loans secured by these physical assets (Köksal et al. 2013). Lim et al. (2020) indicate that collateral is not the only benefit of assets to support debt, but firms can also generate cash and profits through viable assets. Tangible and non-tangible investments fuel growth in a firm’s assets (Long and Malitz 1985). Conventional capital structure theories suggest that leverage increases a firm’s value owing to tax shield benefits (Modigliani and Miller 1963). African firms are characterised by low, rising leverage levels and low investments in asset infrastructure compared to developed economies. This study is rooted in an underexplored aspect of financial leverage within African markets, aiming to uncover the factors contributing to African firms’ low leverage levels.
This study analyses whether low leverage levels are influenced by the poor asset structures associated with African firms. While previous studies have explored the impact of asset structure on financial leverage, these studies principally focused on tangible investments. There is still limited knowledge regarding the debt financing of intangible investments, considering the prospects of rising intangible assets due to digitalisation. Remarkably, no studies, to our knowledge, have ventured into the uncharted territory of evaluating the influence of non-tangible investments on African markets. To attend to this research gap, this study stands as a pioneering effort that extends beyond the existing research. We differentiate between non-tangible and tangible investments and, for the first time, shed light on their distinct effects on leverage in African non-financial listed firms. By doing so, we offer a novel perspective that adds a layer of depth to our understanding of financial decision making in the African context, a testament to the originality of our research. We bridge the gap in knowledge by examining formerly unexplored territory, ultimately providing significant intuitions into the intricate association between leverage and investment composition within once-neglected African markets.
The focus on intangible investments in African firms is significant for several reasons, and its implications extend to investors, firms, and policymakers. Neglecting intangible assets in the study of financial leverage leads to an incomplete financial understanding of African firms. This exclusion can impede the precise evaluation of their overall financial health, asset bases, and risk management strategies. Overlooking intangible investments, such as research and development, can lead to an inadequate comprehension of the competitiveness and potential of African firms in contributing to the region’s economic growth. Innovation and technological progress are closely linked to intangible investments (Jona-Lasinio and Meliciani 2018). African firms may deter their capacities to advance new products and technologies that are essential to stay competitive in today’s ever-changing global markets by neglecting intangible assets. Disregarding intangible investments may limit a firm’s access to crucial financial resources for growth by complicating its ability to attract foreign and domestic investors. Intangible investments may substantially influence a firm’s perceived attractiveness and value to potential investors. Firms may miss out on risk diversification by overlooking intangible investments, potentially exposing firms to unanticipated financial risks. A well-balanced approach to intangible and tangible assets reduces firms’ vulnerability to economic downturns and market fluctuations. From a policy perspective, the non-consideration of intangibles in formulating policies may result in implementing procedures that inadequately address the exclusive needs of enterprises that are heavily reliant on intangible assets.
This study aims to enhance the comprehension of financial leverage and the pivotal roles that tangible and intangible assets play in shaping the financial decisions of firms, particularly in the context of African-listed companies. It delves into the significance of tangible investments, shedding light on their strategic importance in economic decision making. Furthermore, this research investigates the impacts of intangible investments on financial leverage, underlining the growing importance of assets like intellectual property, brand value, and data in the digital era, as previously identified (Ansong and Boateng 2019). This assessment provides valuable insights into the evolving nature of business valuation. Considering the region-specific context of African-listed firms, this study acknowledges Africa’s diversity as an emerging market and recognises its unique economic, regulatory, and cultural factors that influence financial decisions and leverage choices (Liaqat et al. 2021). The insights derived from this research hold significant value for investors and policymakers who are interested in the African market, informing the development of more effective frameworks to support business growth and development. Exploring the interplay between tangible and intangible assets offers practical implications that are particularly relevant to businesses operations in the African market. The practical implications of this research are particularly relevant to businesses operating in the African market. Companies can make more informed decisions regarding their capital structures and financing strategies by comprehending the relationship between investment tangibility and financial leverage. This knowledge empowers businesses to optimise their financial choices and navigate the dynamic economic landscape of the region.
Lately, financial theory development has witnessed a shift from the traditional tax–bankruptcy cost argument as a major determinant of leverage towards the agency cost. It is argued that agency problems may lead to under or over-investment (Myers 1977). In times of financial distress, any losses from risky investments are accrued more by bondholders since shareholders can simply walk away if nothing is left for the firm. In this regard, shareholders may abandon projects with an NPV that is less than the debt issued since all of the benefits from the investment will be accrued in full by the bondholders. This gives rise to underinvestment and asset substitution (Myers 1977). Underinvestment increases with a higher ratio of intangible assets; hence, managers will prefer equity to debt financing, implying a negative relationship between intangibles and financial leverage (Goyal et al. 2002). Bondholders may demand a higher premium and impose restrictive covenants on a firm’s investments to protect their interests. Firms will therefore be limited in the investments and physical assets they can purchase. In theory, bondholders cannot observe asset substitution and estimate underinvestment in the presence of intangible, firm-specific, and unobservable growth opportunities (Myers 1977). They cannot monitor a firm’s investment policy if they cannot estimate the underinvestment. Consequently, the explicit capital market and bonding covenants’ monitoring effectiveness are reduced. The market will limit the leverage for such firms since they cannot be monitored effectively. In that case, lenders limit the amount of credit since they cannot monitor intangible investments effectively (D’Amato 2021). On the other hand, if firms’ investments are tangible, bondholders would be able to approximate the investment opportunity that is set. Consequently, they can anticipate low investment and pay the true debt value. Long and Malitz (1985) claim that firms with tangible investments may sustain more financial leverage since bondholders can estimate the underinvestment and thus observe and monitor the firms’ investment decisions.
Black and Scholes’ (1973) asset substitution theory also reveals that firms can shift from observable to intangible investments, which makes it possible for firms to increase their leverage without the consent of bondholders through intangible assets. Managers are able to increase firm risk over time via the substitution of low-risk assets with high-risk assets when a firm invests in intangible investments (Smith and Warner 1979). For firms with tangible investments, bondholders can easily estimate shareholders’ motivations to substitute riskier investments and observe their contributions to a firm’s risk. Additionally, neither the capital markets nor bondholders can monitor intangible assets since the effect of increasing risk in such investments is not easy to predict (Long and Malitz 1985). Therefore, firms with proportionately higher intangible assets are expected to support less debt than those with more tangible investments.
Harris and Raviv (1991) argue that tangible investments are more liquid than intangible investments; hence, they support higher financial leverage. However, Koralun-Bereźnicka (2013) and Norkio (2023) argue that this relationship can be sector- and country-specific. D’Amato (2021), based on the pecking order theory, argues that firms are induced to have low levels of financial leverage by a higher risk of intellectual assets and their related greater profit opportunities. Subsequently, the channels through which intellectual capital affects firm leverage are firm profitability and risk. Financial literature argues that firms with more intangible assets face higher amounts of agency problems and, hence, low leverage levels. In summary, the literature proposes an inverse relationship between financial leverage and investments in intangible assets. Therefore, we test the following hypothesis:
H1.
Intangible investments are negatively related to financial leverage. Firms with high levels of intangible assets present low levels of financial leverage.
Empirical studies concerning capital structure theories largely illustrate asset structure’s relevance in financing policy. In exploiting variation in the salability of tangible assets, Campello and Giambona (2011) argue that for firms facing credit frictions, tangible asset re-deployability is the main determining factor of firm leverage. Their analysis shows that asset structure drives a firm’s debt-to-equity mix to the degree that they are re-deployable. Heyman et al. (2008), in a study on Belgian firms, concur with the maturity matching principle that long-term assets are financed by long-term debt. This implies that an increase in asset tangibility is associated with an increase in long-term debt, suggesting that firms with fewer physical assets tend to have lower leverage levels. Daskalakis and Thanou (2010) argue that financial distress costs depend heavily on the asset structure employed by a firm. Their analysis suggests that firms with more tangible assets have fewer financial distress costs than firms with more intangible assets. Consequently, firms with fewer tangible assets should have lower leverage levels. These studies primarily emphasise the dominant role of investment tangibility in a firm’s capital structure, suggesting that firms with more tangible investments are more likely to have higher debt ratios, implying a positive relationship between tangible assets and leverage and a negative correlation between tangibility and leverage for firms with more intangible investments.
Lim et al. (2020) contend that more tangible assets are an indication of a stable foundation of return, which enables a firm to generate more cash flow internally and discourages external financing. In this regard, the negative correlation between leverage and asset structure indicates that firms rely more on internal funds that are largely generated by the use of tangible assets, as predicted by the Pecking Order Theory. Daskalakis and Thanou (2010) argue that the negative relationship between leverage and asset structure is possibly explained by the fact that firms employing more tangible assets have stable sources of return, providing them with more internally generated cash flow, and therefore reducing the need for external financing. Deari (2009), in a study involving Macedonian-listed and small to medium-sized firms, observed a negative relationship between leverage and asset tangibility. This suggests that lenders consider additional factors in their evaluation. For example, goodwill, which is used to evaluate firms, highlights the importance of intangible assets in a firm’s creditworthiness and leverage levels. However, other studies stress that a firm can only be competitive if its management mixes intangible and tangible assets efficiently and effectively.
According to Lim et al. (2020), the value of intangible assets is highly sensitive to ownership, but they are not widely preferred as collateral, favouring equity financing more than debt, resulting in a negative relationship between leverage and intangible assets. Some studies suggest a changing perspective on intangible investments as substantial contributors to a firm’s future growth prospects and, consequently, its capacity to service debt (Song 2005). Campello and Giambona (2011) postulate that lenders have more innovative strategies to finance, value, and leverage on liquid and re-deployable intangible assets, which makes them acceptable as collateral, and they also postulate that this may suggest a shift in the hypothesised relationship between leverage and intangible investments.
Norkio (2023) investigated the impacts of non-tangible assets (in the form of entrepreneurial and employee-based intellectual capital (IC)) on financial leverage in Finnish SMEs. Their results indicate that intangible asset-intensive firms exhibit less debt capacity due to high levels of information asymmetry between lenders and borrowers and a lack of pledgeability, which increases creditor risk if distress occurs (Hall 2012). High information asymmetries increase the lemons premium for intangible assets compared to tangible investments (D’Amato 2021). On the same note, Rampini and Viswanathan (2013) put forth that firms with intensive intangible assets experience tighter credit constraints due to the lack of re-deployability of intangible assets. In the event of negative shocks, firms are unlikely to sell their intangible assets. Thus, intangible investments suffer from their irreversibility, increasing the risk associated with such assets compared to physical assets (Lev 2001). Therefore, internal financing becomes the most vibrant source for intangible investments (Thum-Thysen et al. 2019). Norkio (2023) states that R&D investments are venturesome and risky in nature; hence, there is a higher need for internal financing. Thum-Thysen et al. (2019) note that intangible investments depend more on internal financing than tangible ones. The level of risk for tangible assets compared to intangible investments like R&D can be easily assessed; hence, lenders have a higher willingness to fund tangible investments (Norkio 2023). Further, intangible assets are uneasy to value compared to tangible assets. As such, when firms finance intangible assets with debt, the cost of debt should be relatively high, encouraging firms to finance such projects internally and with new equity, resulting in a negative relation between asset intangibility and leverage (D’Amato 2021).
However, there is a strand of studies that reports contrary evidence. In spite of weaker collaterability, Lim et al. (2020) found that firms with identifiable intangible assets engage in more leveraging. Horsch et al. (2021) add that intangible investments in IC are associated with higher financial leverage in publicly listed firms in the US. Ferrando and Preuss (2018) report that large enterprises and SMEs, for their investment activities, indicate distinct financing behaviours. They show a positive relationship between tangible investments and bank financing for SMEs and an internal finance preference for intangible asset investments (Ferrando and Preuss 2018). In analysing Turkey’s listed firms, Köksal et al. (2013) found a positive relationship between long-term debt and asset tangibility and a negative relationship between short-term debt and asset tangibility.
Although many studies concur that tangible investments enable firms to support more leverage, there is no consensus on the effect of intangible investment on leverage. The empirical literature on the impact of intangible assets is more ambiguous (Norkio 2023). For instance, Hall and Lerner (2010) document a negative relationship between IC and financial leverage. On the other hand, Lim et al. (2020) and Horsch et al. (2021) report a positive relationship. At the same time, Sun and Xiaolan (2019) found no association between IC and debt financing. The empirical literature is still inconclusive regarding the impact of intangible investment on other financial decisions. For example, Ehie and Olibe (2010), Boujelben and Fedhila (2011), and Maditinos et al. (2011) found a positive relationship between tangible investments and firm performance. On the other hand, studies like those by Fang and Lin (2010) and Ruiwen and Honghui (2010) demonstrate a negative relationship.
Most studies empirically examined the effects of tangible assets on leverage while neglecting the impact of intangible investment. However, following the fourth industrial revolution, the rapid expansion of digitisation, blockchain, AI, and big data, intangible assets such as data are deemed as valuable as physical assets in today’s technologically apt environment; hence, there is a need to examine the effects of intangible investments. Despite the focus on tangible investment, these studies are concentrated in developed nations with higher debt levels. Therefore, this study sought to analyse African firms in developing economies with low leverage levels. Firms in Africa function in a distinctive economic and market context characterised by varying finance access, diverse industries, and regulatory environments. The low leverage levels of African firms display the distinctive financial landscape of the continent. An understanding of how investment tangibility affects leverage in this context can provide insights into the financial dynamics of the region. Low levels of leverage may be an indication of inadequate access to external financing and risk-averse financial strategies among African firms. Examining investment tangibility can help one to understand how firms in Africa balance the constraint of a low-leverage environment and the need for growth. This is specifically significant for policymakers endeavouring to foster regional economic development. Against this background, this study seeks to investigate the impact of investment tangibility on financial leverage among African-listed firms.
2. Materials and Methods
Building upon the theoretical framework, this study aligns with a positivist paradigm, which is rooted in the idea that research is based on observable, measurable phenomena, which aligns with the objectively measurable quantitative nature of the data for this study and allows for the findings to be generalised. Employing a causal exploratory research approach, this study leverages panel data to thoroughly investigate the influence of investment tangibility on financial leverage. The causal exploratory research approach is ideal for examining cause-and-effect relationships, which is essential when studying how investment tangibility affects financial leverage. This allows the study to identify potential causal links, understand the direction of influence, and facilitate hypothesis testing between investment tangibility and financial leverage. This methodological choice allows for a systematic examination of the cause-and-effect relationships within the context of the research objectives (Park et al. 2020).
2.1. Data and the Variables
The study population comprised 1074 non-financial firms listed across African stock exchanges. Listed firms were used specifically due to reliable publicly available financial data. The final sample constitutes 815 firms drawn from 22 stock exchanges across Africa for the period of 2000 to 2020. In the final sample construction, financial firms were excluded for obvious reasons, which were associated with their sector-specific regulations and complexities in financing strategies, unique assets and liability structures, and the systematic importance of these institutions (Lim et al. 2020; Al-Slehat et al. 2020; Akhtar and Oliver 2009). Firms with less than three years of data were also excluded to allow for instrumentation with the estimation technique adopted. The sample is therefore based on non-financial firms and is biased towards firms with at least a three-year operating period. An unbalanced panel data of 16,300 observations were generated. Panel data can reduce co-linearity in independent variables and enable multiple phenomena observation over multiple periods, hence improving the efficiency of the estimates (Akhtar and Oliver 2009).
This study employed two broader measures of leverage based on book values: long-term debt to total assets and total debt to total assets. Long-term debt emphasises the dominant role of long-term financing on investments (Magli et al. 2018; Aivazian et al. 2005). In line with empirical studies, firm-level investment was defined as a relative investment related to the investment amount per unit of fixed assets (Aivazian et al. 2005; Lang et al. 1996). Three different investment measures were used, including Property, Plant, and Equipment (PPE), advertising, and research and development (R&D), all scaled by net fixed assets.
Consistent with the method used by Long and Malitz (1985) in capturing funds’ flows into alternative investments, research and development (R&D) and advertising expenditures were used as proxies for firm-specific intangible assets. PPE, a physical form of investment, was used to capture expansionary/tangible investments (Muñoz 2013). Typical explanatory variables in finance literature on firm investment were used as control variables. Tobin’s Q ratio was included to capture a firm’s investment opportunities, which were measured as a ratio of market to book value of assets. Cash flows were used as proxies for internal funds’ availability and firms’ financial constraints (Muñoz 2013). Traditional finance literature assumes that financial and operating risks are offsetting decisions, implying that firms with lower financial leverage experience greater operating risks (Long and Malitz 1985). In light of this, this study included asset Beta as a measure of operating risk to separate the effects of investment choice on financial leverage. The firm’s Beta is assumed to capture all of its assets or business risks. The firm’s equity Beta was computed first using the geometric average of returns. The Beta was unlevelled following the Hamada (1972) and Rubinstein (1973) formulation to obtain the asset Beta as follows:
where D is debt, E is equity, and t is the tax rate. The unlevered Beta was used to capture the firms’ operating risk. Depreciation and EBIT were taken as reported on the firm’s income statement and scaled by net fixed assets for standardisation.
Data were obtained from firms’ audited annual financial statements, extracted through the Bloomberg online financial database. While Bloomberg is a reputable data source, the quality and accuracy of the data can vary. It is important to note that, like any financial data source, Bloomberg data may have a time lag, affecting real-time financial data. In addition, errors may occur despite Bloomberg’s efforts to maintain data accuracy. Furthermore, the data are market-oriented and may not capture other aspects of the economy not directly tied to financial markets. Lastly, external providers for some of Bloomberg’s data can introduce their biases or inaccuracies. The researcher made efforts to verify the data by comparing them with the original firm financial statements for validation.
2.2. Model Specification
Leverage specifications of capital structure models are in line with Campello and Giambona (2011) and can be expressed as
where Lev = leverage and Xit is a vector of firm-specific factors that determine the leverage and error term .
In neutralising a firm’s business risk, Long and Malitz (1985) used equal beta portfolios and the pooled OLS technique, which is inefficient in panel data. The OLS technique is inappropriate given the possible endogeneity between leverage and investment relationship (Aivazian et al. 2005). Likewise, the OLS technique does not capture individual firms’ and countries’ effects. This study thus extended the Long and Malitz (1985) formulation to a dynamic panel data model to control for the unobservable, time-invariant features of the firms and countries and to take into account the partial adjustment process of firm leverage. Equation (1) was extended into a dynamic panel data model with fixed effects, as specified by Flannery and Hankins (2013) as follows:
where the cross-sectional dimension is i = 1, …, N and the time dimension is t = 1, …, T. and are the (unobserved) individual and time-specific effects, and X encompasses the explanatory variables. is the error (idiosyncratic) term with E (i,t) = 0, and E (i,tj,S) = δ2 if j = i and t = s, and E (i,tj,S) = 0 otherwise.
Following Equation (2), the specific model estimated takes the following form:
where λi is the unobservable time-invariant features of a firm, UBeta is the unlevered Beta, and Xit captures the other explanatory variables that explain leverage (EBIT, Tobin Q, and Depreciation) scaled by the net fixed assets (NFAs) for standardisation.
2.3. Model Estimation
The system generalised method of moments (GMM) methodology was employed to estimate the dynamic panel models. Blundell and Bond (1998) note that the system GMM performs better in the presence of independent variables that are not strictly exogenous (correlated with past and/or current realisations), fixed individual and country effects, autocorrelation and heteroscedasticity within individual firms, and partial adjustment in this case of leverage. The estimator enhances the Arellano and Bond difference GMM method by introducing an additional assumption that the first differences of the instrumenting variables are uncorrelated with the fixed effects. This follows the introduction of more instruments of the lagged first difference variable, which improves efficiency. Level equations are instrumented with first-differenced instruments and differenced equations instrumented with levels instruments, building a system of equations, including the original and the transformed ones (Roodman 2006). Level and lagged endogenous instruments make predetermined endogenous variables and reduce correlation with the idiosyncratic term. Variations among firms are also partially retained (Antoniou et al. 2008). The term in Equation (3) comprises specific errors and the country’s unobservable effects (.
Through first differencing with the system GMM, model 3 is transformed into
The unobservable firm/country time-invariant features λi (fixed effect) do not vary over time, and they are removed by differencing the regressors. Model 4 will also be transformed as follows:
The lagged dependent variable introduces autocorrelation, which the GMM controls through instrumentation with differenced and past levels of instruments in a system of equations. The application of orthogonal conditions on the variance–covariance capacitates control for the correlation of errors over time, the ability to address the problems of endogeneity, heteroscedasticity in firms, and simultaneity (Antoniou et al. 2008). The system GMM attests to be a handy tool in such considerations (Blundell and Bond 1998).
2.4. Economic Impact of Regression Results
The economic impact of the regression results was calculated following Akande et al. (2018) as follows:
where SDExp Var is the standard deviation of the explanatory variable, and SDDependent VAR is the standard deviation of the dependent variable (investment). The economic impact assesses the effect of one standard deviation change in tangible and intangible investments on the firm’s leverage. This metric captures the sensitivity of the firm’s debt to shifts in investment types.
2.5. Financial Constraints and Tax Shield
Variables suggested by other scholars on leverage were examined for robustness tests. Miller (1977) and DeAngelo and Masulis (1980) document that financial leverage depends on the availability of a tax shield related to investment, such as depreciation and investment tax credit, and financial constraints should also be considered. They argue that corporate capital structure is relevant in the presence of tax shields. Gains from substituting debt for equity are affected by the presence of such non-debt tax shields (Miller 1977). The probability of losing non-debt tax shields increases with financial leverage. Therefore, firms with lower tax shields are expected to employ more debt in their capital structures. The implication is that firms that invest heavily in capital equipment should have less debt because they have more tax shields. Following the literature, the depreciation tax shield was computed as depreciation expense multiplied by the corporate marginal tax rate plus the change in deferred taxes. Total investment-related tax shield was taken as the summation of investment tax credit and depreciation tax shield.
3. Results
The central aim of this study was to investigate the impact of investment tangibility on the financial leverage of African-listed non-financial firms. We employed a dynamic panel data model estimated with the system GMM method to address this research objective. In the following sections, we present the results of our analysis, offering insights into the relationships between investment tangibility and financial leverage. These findings hold significant implications for the existing literature and financial practitioners in the finance field.
3.1. Trend Analysis
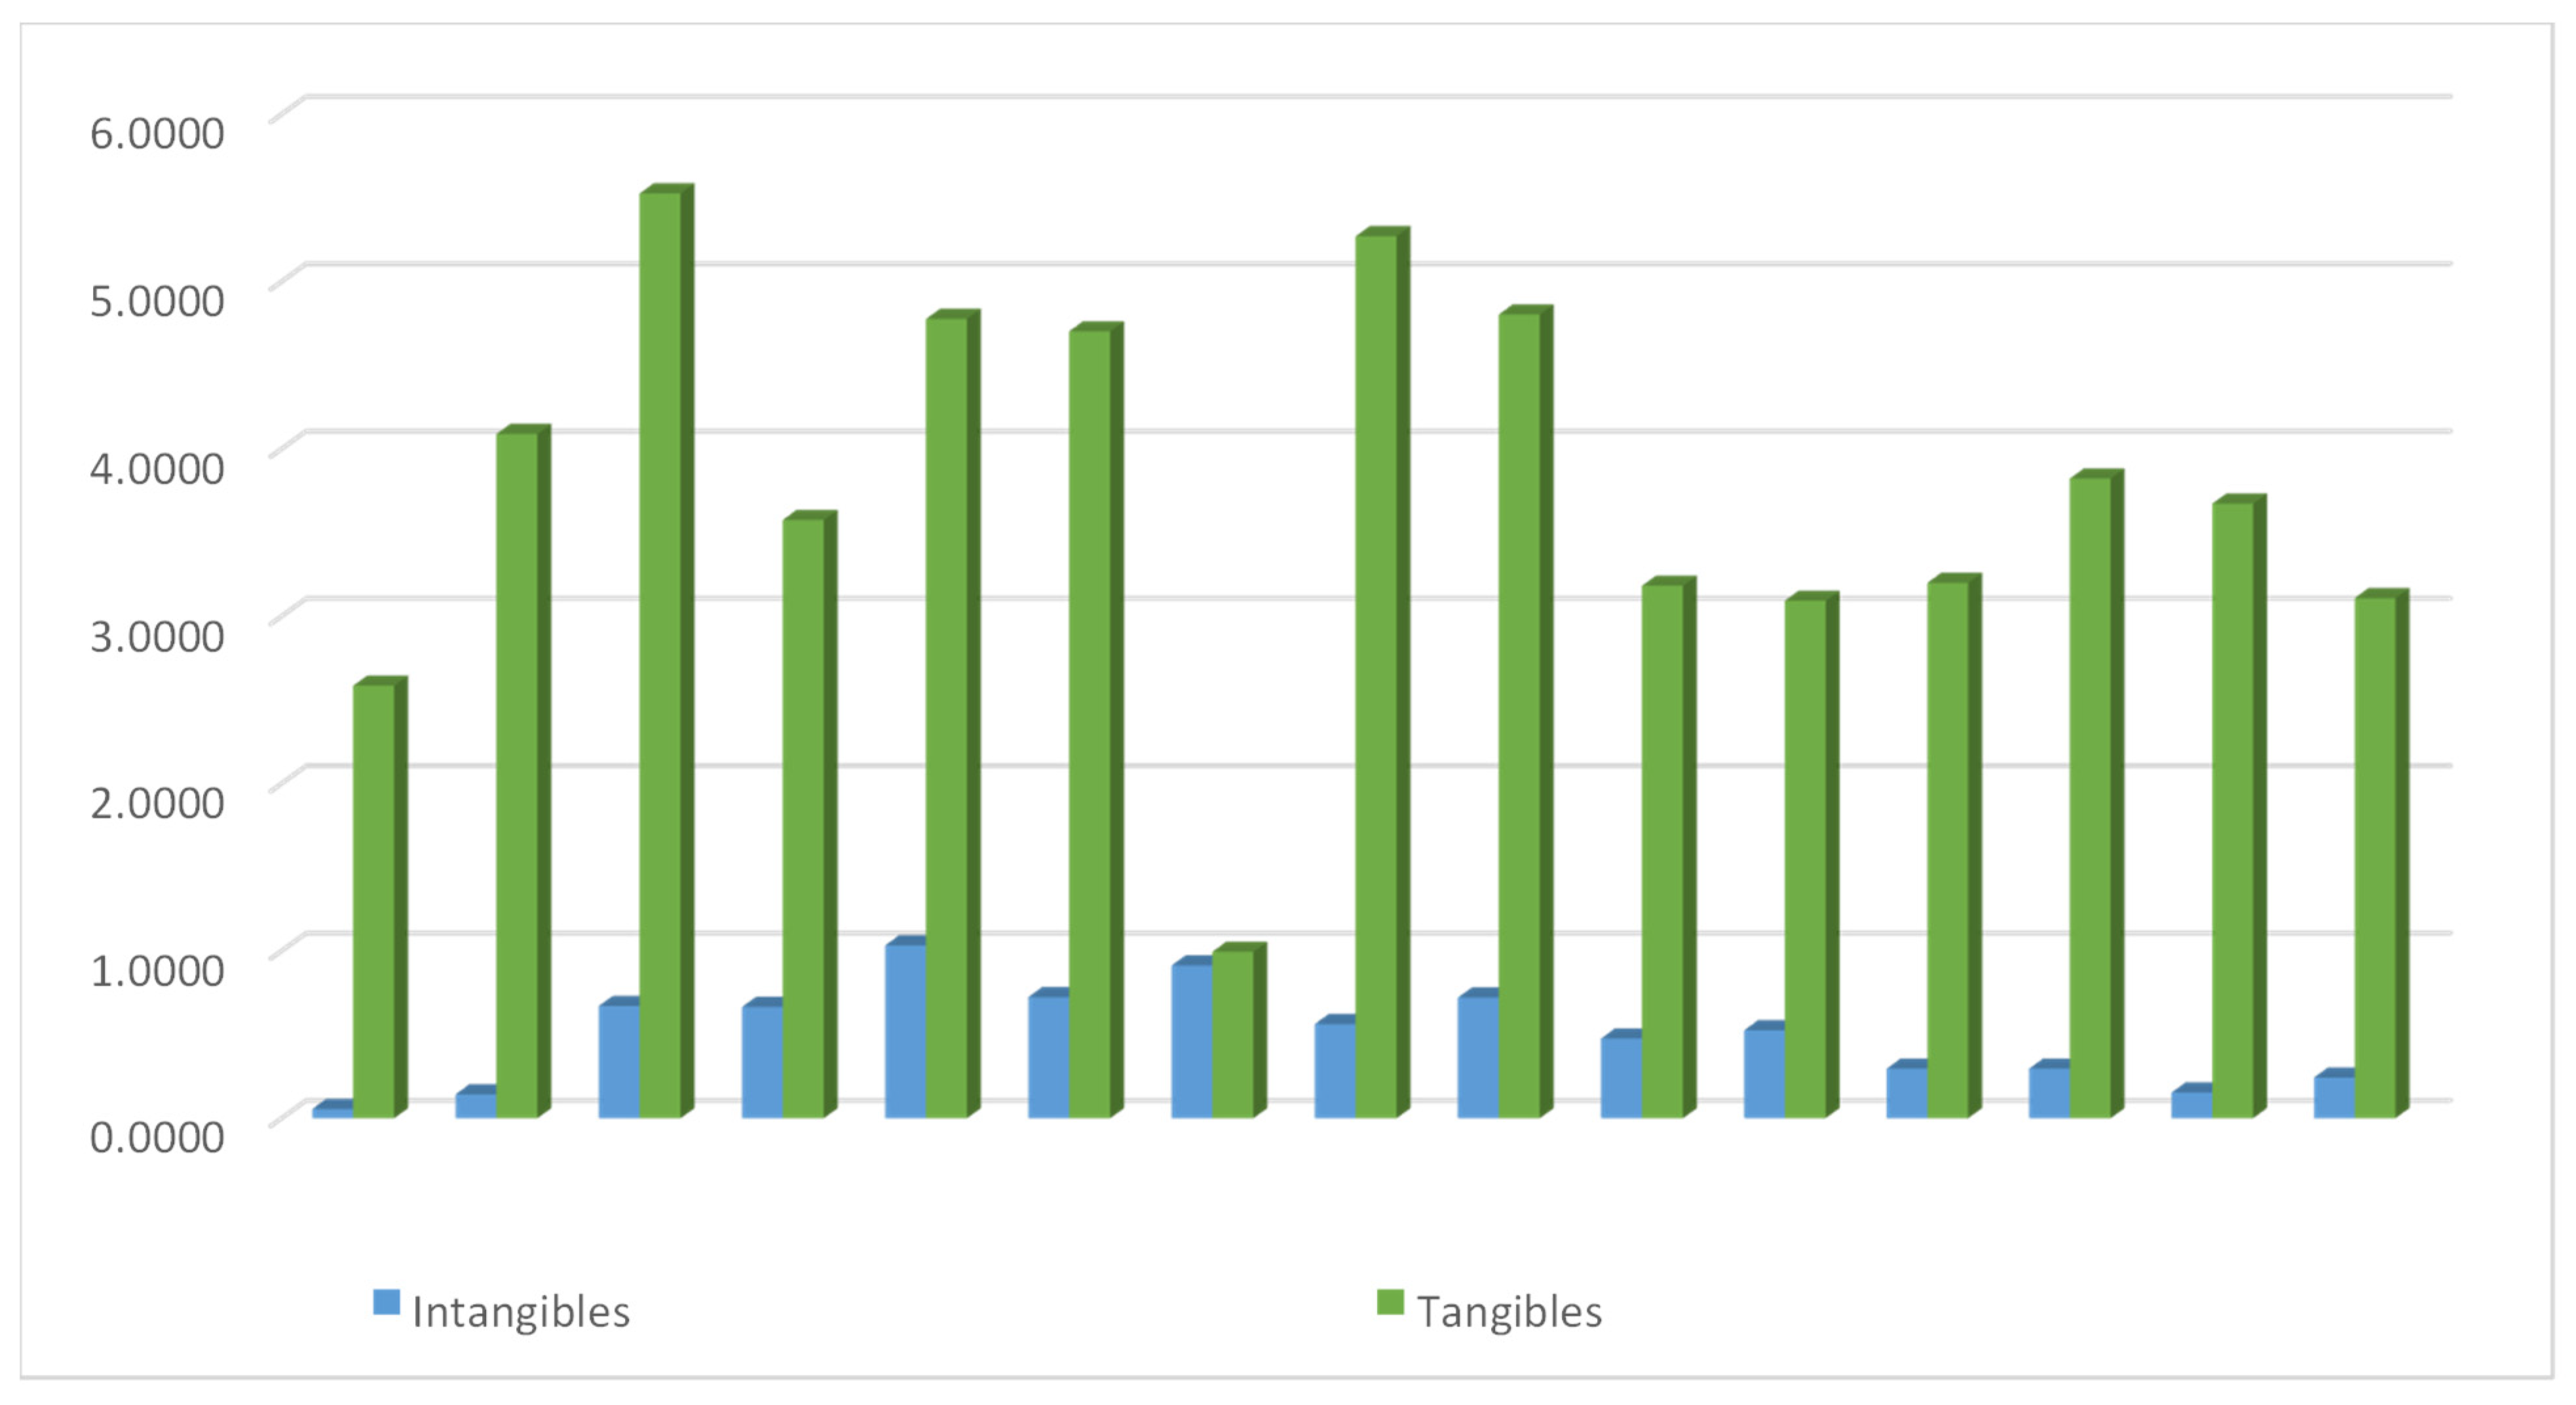
Figure 1 shows the distribution of tangible and intangible investments of African firms for the sample period. The trend analysis of the distribution of the tangible and intangible investments of African firms shows that African firms invest more in real assets than intangible assets, possibly as a way of constructing a shield against uncertainties. The extensive investment in physical assets can be explained by the fact that most African Economies are still in the early stages of development and are associated with poor infrastructure (Ghirmay 2004). The focus is on building physical infrastructure and tangible assets and manufacturing the capacity to support economic growth. Firms need to invest in their infrastructure to support operations and logistics since infrastructure is still developing. This calls for more investments in factories, real estate, and machinery. Africa is rich in natural resources, such as minerals and agricultural products, which require companies in such industries to invest heavily in physical assets like extraction machinery, transportation infrastructure, and processing facilities to fully benefit from such resources. In addition, there is limited financing for firms in Africa; firms rely more on traditional financing methods and bank loans (El Menyari 2019), which are often more readily available for tangible asset investments that can serve as collateral. Tangible assets can store value and be used as collateral in sourcing external financing; hence, there is a higher growth in real investments. In addition, most African countries are associated with unstable economic environments and uncertain political environments. In such conditions, tangible assets provide a sense of stability and security; compared to financial assets, physical assets are less susceptible to expropriation or political instability. Furthermore, firms in African economies invest in real assets that tend to appreciate over time to hedge against high and volatile inflation rates. The high bias towards physical assets can also be explained by the lack of alternative investment opportunities due to Africa’s shallow and less-developed financial markets (Vengesai and Kwenda 2020). Above all, cultural and traditional factors may play roles in investment preferences for African firms. In the African context, cultural preferences favour investments in tangible assets like land and real estate, which are seen as more secure and prestigious.
Lim et al. (2020) contend that more tangible assets indicate a stable foundation of return, which enables a firm to generate more cash flow internally and discourages external financing. The growth in physical investment among African firms may probably be guided by the need for a stable cash flow generation from using physical investments. The increase and value in tangible and physical investment may also show that African firms are still aligned with old technologies and machinery and are slow to adopt innovative technologies. The trend analysis also revealed that African firms invest more in advertising than in research and development. The trend also indicates a decline in tangible and intangible investments over time. Low investment in research and development may be another reason for the decrease in the overall investment levels of African firms due to the lack of innovation from research.
The impact of a substantial commitment to tangible assets has several implications for a company’s leverage and long-term prospects, with both positive and negative effects, which are contingent on factors such as a company’s business strategy, industry, and overall financial well-being. An expansion of the physical asset base supports higher production capacity, enhances competitiveness, and sustains long-term stability and growth (Jona-Lasinio and Meliciani 2018). Physical assets serve as collateral to secure debt financing, enabling firms to raise their capital at a lower cost, which improves leverage ratios and reduces the cost of debt. In addition, some physical assets, such as manufacturing plants and properties, generate revenue, enhancing a firm’s cash flows and reducing financial risk. However, to finance the acquisition of physical assets, firms may need to borrow more, resulting in higher leverage levels and increasing the financial risk and cost of debt (Norkio 2023). In addition, heavy investments in physical assets can reduce the liquidity of a firm since a significant portion of a firm’s capital is tied up in non-liquid assets, limiting the ability to take advantage of lucrative opportunities or respond to unforeseen financial challenges. High maintenance costs and the depreciation of physical assets can also strain a firm’s financial resources, negatively impacting the long-term prospects and profitability of a firm. Further, in today’s rapidly changing business environment, physical assets can become absolute quickly, leading to impairments and writedowns to the detriment of a firm’s financial position. The adoption of asset-light and flexible business models by competitors can cause firms that are heavily invested in physical assets to lose competitiveness and profitability. Above all, current shifts in environmental regulations and the emergence of sustainable business practices can affect the usability and value of some physical assets. Hence, firms should constantly adapt to the changing technological advancements and market conditions to remain competitive and ensure sustainability. However, it is crucial to note that each firm faces a unique situation; hence, the effects of physical asset investments may vary depending on the context and specific circumstances.
3.2. Descriptive Statistics
The descriptive statistics in Table 1 reveal a high variation of intangible asset investment (proxied by advertising and R&D) relative to the mean. This suggests inconsistency in R&D and advertising trends among African firms. Among these variables, PPE investment exhibits the highest mean value (0.2148), indicating that African firms allocate a significant portion of their investments to tangible assets (PPE). In contrast, R&D records the lowest mean (0.0456), indicating relatively lower investments in intangible assets. Tangible asset investment shows a low variation relative to its mean, suggesting stability in tangible investments among African firms.
Furthermore, our data analysis reveals that African firms maintain notably low leverage ratios, with an average long-term debt-to-total-assets ratio of 9 per cent, a stark contrast to developed economies where the averages exceed 40 per cent (Vengesai and Kwenda 2020). The sample mean Tobin’s Q, equal to 1.49, reflects heightened market expectations of growth opportunities for African firms. Relative to the mean, the data also illustrate substantial variations in earnings, cash flows, and sales, indicating significant earnings, sales, and cash flow risks for African firms.
3.3. Regression Results
Table 2 displays the regression output of the leverage investment model, incorporating two leverage measures. The findings reveal a consistent negative relationship between the type of investment and leverage for both measures within the context of African-listed non-financial firms. The results provide compelling evidence that PPE (tangible investment), advertising, and R&D (intangible investments) exert negative impacts on African firms’ long-term debt. This observation suggests that African firms tend to maintain lower leverage levels regardless of whether they invest in tangible or intangible assets. This negative relationship between tangible investment and leverage aligns with the hypothesis that high-growth firms, in their expansion efforts, opt for reduced borrowing to mitigate the agency costs associated with debt, which may otherwise result in underinvestment and a decrease in the firm’s overall value. The negative relationship between intangible investment and financial leverage is consistent with the study by Norkio (2023), who found intensive intangible capital Finnish SMEs to have less debt capacity.
On average, African firms have high growth opportunities, as shown by an average growth opportunity, measured by Tobin’s Q, that is greater than one. In this respect, the suggestion is that growth in tangible assets in high-growth firms sustains the generation of more cash flow for future investment opportunities. Physical assets are not only used as collateral to obtain debt from financial institutions and bondholders. This is consistent with the findings of Lim et al. (2020), who contend that more tangible assets indicate a stable foundation of return, enabling a firm to generate more cash flow internally and discourage external financing. Daskalakis and Thanou (2010) concur that in times of financial hardships, the cheapest source of finance is asset sales; therefore, firms with more physical assets can sell part of their assets to finance their investments rather than borrow. In a study on Greek firms, Daskalakis and Thanou (2010) argued that firms that generate more cash flow from the efficient use of physical assets avoid using debt. This also explains the negative relationship between growth in tangible investment and leverage.
However, the findings contradict the studies by Lim et al. (2020), who found a positive relationship between leverage and intangible assets, and Horsch et al. (2021), who added that intangible investments in IC are associated with higher financial leverage in publicly listed US firms. Köksal et al. (2013) also found a positive relationship between debt financing and investment tangibility in Turkey’s firms. Campello and Giambona (2011) attest that asset tangibility is a significant determinant of leverage. Heyman et al. (2008), in support of the asset’s liability matching principle, document that the growth in a firm’s physical and long-term assets is financed by long-term debt, suggesting a positive relationship between debt and tangible investment. The results also suggest that lenders consider other criteria of intangible assets to evaluate firms, as indicated by Deari (2009), who found that lenders also significantly use a firm’s goodwill in credit valuation. The variations in these results may be explained by the peculiar characteristics that firms face in the heterogeneous economic environments in which they operate and the different life cycles that the firms are in. Song (2005) indicates that the intensity of the relationship between leverage and investment tangibility varies across firms’ life cycles, suggesting that different relationships may exist. In African firms, a negative relationship was found between leverage and tangible investment and the two proxies of intangible investment (advertising and R&D).
African firms with high levels of intangible assets borrow less. The negative relationship between leverage and intangible assets is consistent with the underinvestment and asset substitution hypothesis. Shareholders can easily increase a firm’s risk through intangible assets, which are not easily anticipated nor monitored by bondholders and capital markets (D’Amato 2021). Therefore, due to a higher risk, lack of security, and uncertainty, bondholders and the market are reluctant to lend to such firms, suggesting that firms with more intangible assets are expected to support less debt (Bae et al. 2017). Campello and Giambona (2011) also indicate that firms with intangible assets have less liquidation value, which is a significant determinant of debt financing, suggesting a negative correlation between leverage and intangible investments. Further, intangible assets are uneasy to value compared to tangible assets. As such, when firms finance intangible assets with debt, the cost of debt should be relatively high, encouraging firms to finance such projects internally and with new equity, resulting in a negative relation between asset intangibility and leverage (D’Amato 2021).
The results in Table 2 show that the systematic asset risk, as measured by Beta, also has a negative relationship with financial leverage. Firms with a higher asset risk tend to reduce their leverage levels to avoid financial distress. This is consistent with the financial theory, which argues that risk increases the chances of financial distress. Also, high-risk firms have less access to debt and borrow at higher costs than lower-risk firms; therefore, they will have lower debt levels. The coefficient of the lagged dependent variable is less than one, which is consistent with dynamic stability. The lagged dependent variable is significant and positive, implying consistency in past leverage realisations and a positive effect of past leverage levels on the current levels. The current leverage levels are dependent on past leverage trends. The adjustment coefficient of the lagged dependent leverage variable also indicates a modest speed of adjustment to target leverage levels in African firms. The coefficient of adjustment is specified by one minus the coefficient of the lagged dependent variable, which is 0.656 (1 − 0.444) and 0.569 (1 − 0.431) for the two models of leverage. An inverse relationship exists between the cost of adjustment and the speed of adjustment towards the desired capital structure. The modest adjustment indicates lower adjustment costs in African financial markets. Köksal et al. (2013) describe the adjustment process as a trade-off between the adjustment cost in the direction of the target and the cost of being off target. Firms will adjust slowly if there are higher adjustment costs than the cost of being off target. The analysis shows a modest speed of adjustment in African firms, suggesting low adjustment costs rather than being in disequilibrium. The modest speed can be explained by the adoption of financial liberalisation policies in many African countries.
The modest speed of adjustment to target leverage levels can have several implications for African firms’ financial decision making, as well as consequences for policymakers and investors; a slower adjustment speed implies that firms manage financial risk conservatively, being cautious about rapidly increasing or reducing debt, which could affect the firms’ capacity to take growth opportunities or effectively manage financial distress. Concerning investment decisions, it implies that to finance investments, firms may have an inclination to rely on internally generated funds rather than external financing (debt and equity). This could affect the capacity of firms for capital expenditures, growth initiatives, and research and development. For investors, they may appreciate the predictability and stability that come with a modest speed of leverage adjustment. Investors can have more confidence in the ability of a firm to meet financial obligations, increasing the attractiveness of such firms as investment options. Firms with a modest speed of leverage adjustment are more likely to maintain a consistent dividend payment, enticing investors who are interested in dividend income. However, slower adjustments could imply a conservative debt approach, limiting the ability of the firm to undertake rapid expansion; hence, investors seeking high growth may look elsewhere. From a policy perspective, policymakers may positively view a modest speed of adjustment since it indicates a cautious approach to leverage, which potentially limits systematic instability and financial crisis risk. If the modest speed of leverage adjustment is due to limited financing options, policymakers might encourage diversifying financing sources to support economic growth.
Other variables are as predicted and expected. A negative relationship between growth opportunities and leverage was found. Firms with more investment opportunities borrow less. This is consistent with the Myers (1977) theory that leverage induces underinvestment for high-growth firms. Therefore, they tend to be conservative borrowers so that they can take on investment opportunities as they arise. As expected, earnings are also negatively associated with leverage, which is in line with the findings by Lim et al. (2020). Firms with higher earnings can generate more cash flow to finance their investment needs. Therefore, they borrow less. On the other hand, firms that create low earnings are forced to borrow to finance investment needs and other operational expenses.
3.4. Economic Impact of Regression Results
Table 3 shows the economic impact of investment tangibility on a firm’s leverage policy. The coefficients in our regression analysis provide essential insights into the relationship between different types of investments and leverage. Specifically, we found that a standard deviation increase of one in intangible investment, as represented by R&D and advertising, is associated with a decrease in long-term debt ranging from approximately −0.0372% to −0.079%, respectively. Similarly, for tangible investments, a standard deviation increase of one results in a decrease of approximately −0.0325% to −0.2065% for the two leverage measures. The negative relationship between leverage and tangible investment aligns with the trade-off theory, which argues that firms aim to balance debt tax shields and financial distress costs (Myers and Majluf 1984). Firms investing more in tangible assets may prefer lower leverage levels to minimise financial distress costs (Thum-Thysen et al. 2019). In line with the pecking order theory, if increased physical asset investment can be funded through internal resources, it would decrease leverage, which is consistent with the hypothesis that firms prefer internal financing to external financing (D’Amato 2021). For financial decision making, the findings suggest a conservative financing approach; firms may prioritise retained earnings and other internal sources rather than taking on more debt, thereby reducing leverage. In addition, the results suggest that African firms may be concerned about financial distress costs and prefer to invest in assets that can be financed without a heavy reliance on external debt. Furthermore, the results suggest that African firms focus on financial stability and long-term sustainability through the avoidance of high leverage levels. They aim to minimise financial distress and sustain a stable financial position over time.
These impact values also shed light on the sensitivity of leverage to different types of investments (Vengesai and Kwenda 2018). Notably, they indicate that leverage is more responsive to changes in tangible assets (proxied by PPE) compared to intangible investments (represented by advertising and R&D). This means that for a given change in tangible investment, there is a more pronounced change in leverage compared to changes in advertising and R&D, which are measures of intangible investment. In practice, our results suggest that when African firms increase investment in tangible assets, such as Property, Plant and Equipment, they tend to experience a relatively higher decline in leverage, which is the proportion of debt in their capital structure. Conversely, investment changes related to research and development and advertising (intangible investments) have comparatively more minor impacts on leverage. This insight is valuable for firms’ financial decision making, as it underscores the differing effects of tangible and intangible investments on their leverage and, by extension, their financial risks and capital structures.
3.5. Financial Constraints and Tax Shield
Table 4 presents the regression results, including tax shields, in the leverage model. The results indicate a significant negative relationship between investment-related tax shields and leverage, implying that African capital-intensive firms with high tax shields reduce their leverage levels.
By including investment-related tax shields in our regression model, we also found a significant negative relationship between leverage and all tangible and intangible investments. The inclusion of cash flow as a proxy for financial constraints does not affect the explanatory power of investment types on leverage. Rampini and Viswanathan (2013) suggest that firms finance their investment needs with internally generated funds in the presence of transaction costs since they are less costly. This indicates that firms generating more cash flow must have low leverage levels. On the contrary, we found a positive relationship between cash flow and leverage among African firms, where firms that generate higher cash flows have higher debt levels. The possible explanation for this is that firms with high cash flows are more creditworthy; therefore, they can access and support higher levels of debt, and internally generated funds might be used to finance dividends. Therefore, there is a need to borrow to support a firm’s investment needs.
3.6. Model Specification Tests
The GMM estimation technique is a powerful tool used to estimate parameters for dynamic panel models, especially in the presence of possible endogeneity (Roodman 2006). To ensure the validity of the results, several diagnostic tests were performed. First, the presence of second-order serial autocorrelation in the error terms was examined. The methodology proposed by Arellano and Bond (1991) AR (2) was conducted to assess this. The AR (2) test results, indicated by p-values above 5 per cent for all models, suggest the absence of serial autocorrelation of order two in our models. This supports the validity of our GMM estimates. Second, the over-identification of instruments used in the model was evaluated. The over-identification test helps to ensure that the instruments are correctly specified and not correlated with the error terms. We employed the Hansen two-step test to assess the instruments’ over-identification problems. Again, our results were reassuring, as all models’ p-values for the Hansen two-step test were above 5 per cent. This implies that the instruments used in our estimation are appropriately specified. Our diagnostic tests confirm the reliability of the GMM estimation technique in our models. The correct instrument specification and the absence of second-order serial correlation validate our estimated model parameters’ consistency, reinforcing our findings’ robustness (Vengesai and Kwenda 2018).
4. Summary and Conclusions
The prime objective of this study was to explore the intricate relationship between investment tangibility and financial leverage within the context of non-financial listed African firms. We employed a dynamic panel data model estimated with the system GMM to achieve this objective. In summary, considering the distribution of investment tangibility among African firms, this study’s findings suggest numerous noteworthy trends and implications. The findings consistently demonstrate a statistically significant negative relationship between the type of investment (tangible and intangible) and financial leverage. The results provide compelling evidence that tangible investment, represented by Property, Plant, and Equipment and intangible investments encompassing advertising and R&D, exhibited a negative impact on African firms’ long-term debt.
This observation suggests that African firms tend to maintain lower leverage levels regardless of whether they invest in tangible or intangible assets. The observed negative relationship between tangible investment and leverage aligns with the hypothesis that high-growth firms, in their expansion efforts, tend to opt for reduced borrowing. This strategic choice is intended to mitigate the agency costs associated with debt and helps to prevent underinvestment, thereby safeguarding and potentially enhancing a firm’s overall value (Norkio 2023).
Our analysis indicates that African firms with high investment ratios in tangible and intangible investments tend to maintain lower debt ratios. The results show that African firms exhibit high-growth firm characteristics on average. The negative relationship between tangible investment and leverage in African firms implies that expansion in tangible assets in high-growth firms sustains the generation of ample cash flow for future investment opportunities and operation expansion. This trend is consistent with Myers’s (1977) theory; the more investment opportunities a firm has, the less it borrows, and less debt allows for such firms to remain flexible in seizing growth opportunities. This emphasises the significance of considering a firm’s growth prospects when evaluating financing decisions.
This growth in tangible investments ensures high returns from physical assets, as when firms borrow less to avoid the agency costs of debt, this may lead to underinvestment and a decline in the firm’s value. The robustness of our results was further affirmed through the examination of financial constraints, as we confirmed the negative relationship between leverage and both types of investments even after controlling for these constraints. The inclusion of financial constraints did not affect the explanatory power of the investment types on leverage.
In addition, our findings indicate a preference for tangible assets among African firms. African firms invest more in physical assets than in intangible assets, suggesting that these firms may be using physical assets to mitigate uncertainties and retain value. The heavy investment in tangible investments may indicate that African firms prioritise stability and cash flow generation, aligning with the view that real assets are a basis for stable returns (Lim et al. 2020). On the other hand, the growth in physical assets among African firms also indicates a technological lag; these firms may be slower to adopt modern technologies and smart machinery, potentially remaining aligned with older technologies, which may have negative implications for innovation and competitiveness.
The study uncovers that firms in Africa allocate less resources to research and development (R&D) than advertising. This skewed pattern of investment may result in an overall decrease in the levels of investment over time due to limited innovation from R&D. African firms must consider the potential impact of this imbalance on the firms’ innovation capabilities and long-term sustainability.
The results also indicate a modest speed of adjustment to target leverage levels, implying a cautious approach to capital structure management among African firms. In addition, the results suggest that African firms with higher asset risks tend to lower their leverage levels to avoid financial distress; this is shown by the negative relationship between systematic asset risk (Beta) and financial leverage. This study also confirms the negative relationship between earnings and financial leverage. Firms with robust earnings can generate more cashflows, facilitating internal investment financing.
In conclusion, these findings compellingly illustrate that investments in tangible and intangible assets have a negative relationship with financial leverage. This outcome underscores a prevalent trend among African firms, which maintains lower levels of leverage, regardless of their investment choices in tangible or intangible assets. In addition, African-listed firms demonstrate a preference for tangible assets, hypothetically for stability and cash flow generation. However, this inclination may compromise innovation and technological adoption. Furthermore, more resource allocation towards advertising over R&D may limit the abilities of firms to innovate and compete effectively. This study also features the importance of earnings, systematic risk, and growth opportunities in shaping the financing decisions of African firms. Understanding these trends and implications is valuable for investors and policymakers looking to engage and support African businesses.
The findings provide empirical evidence that financing and investment decisions are not independent but somewhat interdependent. The results are consistent with empirical studies that suggest that leverage constrains investment. Consequently, we propose that firms should keep lower debt levels to facilitate increased investment. African firms may benefit more from relying more on internally generated funds and contemplating lower pay-out policies to reduce their reliances on external debt financing, thereby enhancing their levels of investment. Maintaining lower leverage levels can enable the expansion of physical and non-physical assets, fostering sustainable growth. Furthermore, we recommend that African firms should consider boosting their investments in R&D to stimulate innovation and lay the foundation for future investment endeavours.
This study also comes with shortfalls that need to be acknowledged. It heavily relies on accounting data, which can be susceptible to management manipulation or variations in presentation. In cases of distorted financial data, the results may not accurately reflect the proper relationship between the variables under investigation, limiting the validity and generalisability of the findings. However, the use of audited financial statements provides some assurance regarding the data’s validity.
While the research concentrates on listed firms in Africa, The African region is notably diverse in terms of regulatory environments, cultural influences, and economic conditions. Consequently, the findings may not fully capture the heterogeneity across various African markets, implying limited generalisability. Future research could delve deeper into these aspects. It might explore how different regional economic settings moderate the relationship between investment tangibility and leverage. This approach could offer insights into the unique dynamics at play in specific African regions. Additionally, extending the analysis to particular industries within African markets could uncover variations in the relationship between investment tangibility and leverage, as different sectors often have distinct characteristics influencing this connection. Moreover, future studies could investigate the role of alternative financing sources in shaping leverage and investment decisions among African firms. This would provide a more comprehensive understanding of the financial strategies employed in the African business landscape.
Funding
This research received no external funding.
Data Availability Statement
The data can be obtained from the Bloomberg online financial database.
Conflicts of Interest
The author declares no conflict of interest.
References
- Aivazian, Varouj A., Ying Ge, and Jiaping Qiu. 2005. The impact of leverage on firm investment: Canadian evidence. Journal of Corporate Finance 11: 277–91. [Google Scholar] [CrossRef]
- Akande, Joseph Olorunfemi, Farai Kwenda, and Dimu Ehalaiye. 2018. Competition and commercial banks risk-taking: Evidence from Sub-Saharan Africa region. Applied Economics 50: 4774–87. [Google Scholar] [CrossRef]
- Akhtar, Shumi, and Barry Oliver. 2009. Determinants of capital structure for Japanese multinational and domestic corporations. International Review of Finance 9: 1–26. [Google Scholar] [CrossRef]
- Al-Slehat, Zaher Abdel Fattah, C. Zaher, and A. Fattah. 2020. Impact of financial leverage, size and assets structure on firm value: Evidence from industrial sector, Jordan. International Business Research 13: 109–20. [Google Scholar] [CrossRef]
- Ansong, Eric, and Richard Boateng. 2019. Surviving in the digital era–business models of digital enterprises in a developing economy. Digital Policy, Regulation and Governance 21: 164–78. [Google Scholar] [CrossRef]
- Antoniou, Antonios, Yilmaz Guney, and Krishna Paudyal. 2008. The determinants of capital structure: Capital market-oriented versus bank-oriented institutions. Journal of Financial and Quantitative Analysis 43: 59–92. [Google Scholar] [CrossRef]
- Arellano, Manuel, and Stephen Bond. 1991. Some tests of specification for panel data: Monte Carlo evidence and an application to employment equations. The Review of Economic Studies 58: 277–97. [Google Scholar] [CrossRef]
- Bae, John, Sang-Joon Kim, and Hannah Oh. 2017. Taming polysemous signals: The role of marketing intensity on the relationship between financial leverage and firm performance. Review of Financial Economics 33: 29–40. [Google Scholar] [CrossRef]
- Black, Fischer, and Myron Scholes. 1973. The pricing of options and corporate liabilities. Journal of Political Economy 81: 637–54. [Google Scholar]
- Blundell, Richard, and Stephen Bond. 1998. Initial conditions and moment restrictions in dynamic panel data models. Journal of Econometrics 87: 115–43. [Google Scholar] [CrossRef]
- Boujelben, Saoussen, and Hassouna Fedhila. 2011. The effects of intangible investments on future OCF. Journal of Intellectual Capital 12: 480–94. [Google Scholar] [CrossRef]
- Campello, Murillo, and Erasmo Giambona. 2011. Capital Structure and the Redeployability of Tangible Assets. Amsterdam: Tinbergen Institute. [Google Scholar]
- Corrado, Carol, Charles Hulten, and Daniel Sichel. 2009. Intangible capital and US economic growth. Review of Income and Wealth 55: 661–85. [Google Scholar] [CrossRef]
- Crouzet, Nicolas, and Janice Eberly. 2023. Rents and intangible capital: A q+ framework. The Journal of Finance 78: 1873–916. [Google Scholar] [CrossRef]
- D’Amato, Antonio. 2021. Does intellectual capital impact firms’ capital structure? Exploring the role of firm risk and profitability. Managerial Finance 47: 1337–56. [Google Scholar] [CrossRef]
- Daskalakis, Nikolaos, and Eleni Thanou. 2010. Capital Structure of SMEs: To What Extent Does Size Matter? Available online: https://ssrn.com/abstract=1683161 (accessed on 23 July 2023).
- DeAngelo, Harry, and Ronald W. Masulis. 1980. Optimal capital structure under corporate and personal taxation. Journal of Financial Economics 8: 3–29. [Google Scholar] [CrossRef]
- Deari, Fitim. 2009. The determinants of capital structure: Evidence from Macedonian listed and unlisted companies. Analele Stiintifice ale Universitatii “Alexandru Ioan Cuza” din Iasi-Stiinte Economice 56: 91–102. [Google Scholar]
- Ehie, Ike C., and Kingsley Olibe. 2010. The effect of R&D investment on firm value: An examination of US manufacturing and service industries. International Journal of Production Economics 128: 127–35. [Google Scholar]
- El Menyari, Younesse. 2019. Financial development, foreign banks and economic growth in Africa. African Development Review 31: 190–201. [Google Scholar] [CrossRef]
- Fang, Wen-Shwo, and Hsiu-Kan Lin. 2010. Do R&D expenditure, royalty and technology licensing expenses increase operational performance of the biotech industry in Taiwan? Problems and Perspectives in Management 8: 80–91. [Google Scholar]
- Ferrando, Annalisa, and Carsten Preuss. 2018. What finance for what investment? Survey-based evidence for European companies. Economia Politica 35: 1015–53. [Google Scholar] [CrossRef]
- Flannery, Mark J., and Kristine Watson Hankins. 2013. Estimating dynamic panel models in corporate finance. Journal of Corporate Finance 19: 1–19. [Google Scholar] [CrossRef]
- Ghirmay, Teame. 2004. Financial development and economic growth in Sub-Saharan African countries: Evidence from time series analysis. African Development Review 16: 415–32. [Google Scholar] [CrossRef]
- Goyal, Vidhan K., Kenneth Lehn, and Stanko Racic. 2002. Growth opportunities and corporate debt policy: The case of the US defense industry. Journal of Financial Economics 64: 35–59. [Google Scholar] [CrossRef]
- Graham, John. R., Mark T. Leary, and Michael R. Roberts. 2015. A century of capital structure: The leveraging of corporate America. Journal of Financial Economics 118: 658–83. [Google Scholar] [CrossRef]
- Hall, Bronwyn H., and Josh Lerner. 2010. The financing of R&D and innovation. In Handbook of the Economics of Innovation. Amsterdam: North-Holland, vol. 1, pp. 609–39. [Google Scholar]
- Hall, Thomas W. 2012. The collateral channel: Evidence on leverage and asset tangibility. Journal of Corporate Finance 18: 570–83. [Google Scholar] [CrossRef]
- Hamada, Robert S. 1972. The effect of the firm’s capital structure on the systematic risk of common stocks. The Journal of Finance 27: 435–52. [Google Scholar] [CrossRef]
- Harris, Milton, and Artur Raviv. 1991. The theory of capital structure. The Journal of Finance 46: 297–355. [Google Scholar] [CrossRef]
- Heyman, Dries, Marc Deloof, and Hubert Ooghe. 2008. The financial structure of private held Belgian firms. Small Business Economics 30: 301–13. [Google Scholar] [CrossRef]
- Horsch, Philipp, Philip Longoni, and David Oesch. 2021. Intangible capital and leverage. Journal of Financial and Quantitative Analysis 56: 475–98. [Google Scholar] [CrossRef]
- Jona-Lasinio, Cecilia, and Valentina Meliciani. 2018. Productivity growth and international competitiveness: Does intangible capital matter? Intereconomics 53: 58–62. [Google Scholar] [CrossRef]
- Koralun-Bereźnicka, Julia. 2013. How does asset structure correlate with capital structure?: Cross-idustry and cross-size analysis of the EU countries. Universal Journal of Accounting and Finance 1: 19–28. [Google Scholar] [CrossRef]
- Köksal, Bülent, Cüneyt Orman, and Arif Oduncu. 2013. Determinants of Capital Structure: Evidence from a Major Emerging Market Economy. MPRA Paper 48415. Munich: University Library of Munich. [Google Scholar]
- Lang, Larry, Eli Ofek, and RenéM Stulz. 1996. Leverage, investment, and firm growth. Journal of Financial Economics 40: 3–29. [Google Scholar] [CrossRef]
- Lev, Baruch. 2001. Intangibles: Management, Measurement, and Reporting. Washington, DC: The Brookings Institution. Lanham: Rowman & Littlefield. [Google Scholar]
- Liaqat, Idrees, Muhammad Asif Khan, József Popp, and Judit Oláh. 2021. Industry, firm, and country level dynamics of capital structure: A case of Pakistani firms. Journal of Risk and Financial Management 14: 428. [Google Scholar] [CrossRef]
- Lim, Steve C., Antonio J. Macias, and Thomas Moeller. 2020. Intangible assets and capital structure. Journal of Banking & Finance 118: 105873. [Google Scholar]
- Long, Michael S., and Ileen B. Malitz. 1985. Investment patterns and financial leverage. In Corporate Capital Structures in the United States. Chicago: University of Chicago Press, pp. 325–52. [Google Scholar]
- Maditinos, Dimitrios, Dimitrios Chatzoudes, Charalampos Tsairidis, and Georgios Theriou. 2011. The impact of intellectual capital on firms’ market value and financial performance. Journal of Intellectual Capital 12: 132–51. [Google Scholar] [CrossRef]
- Magli, Francesca, Alberto Nobolo, and Matteo Ogliari. 2018. The effects on financial leverage and performance: The IFRS 16. International Business Research 11: 76–89. [Google Scholar] [CrossRef]
- Miller, Edward M. 1977. Risk, uncertainty, and divergence of opinion. The Journal of Finance 32: 1151–68. [Google Scholar] [CrossRef]
- Modigliani, Franco, and Merton H. Miller. 1963. Corporate income taxes and the cost of capital: A correction. The American Economic Review 53: 433–43. [Google Scholar]
- Muñoz, Francisco. 2013. Liquidity and firm investment: Evidence for Latin America. Journal of Empirical Finance 20: 18–29. [Google Scholar] [CrossRef]
- Myers, Stewart C. 1977. Determinants of corporate borrowing. Journal of Financial Economics 5: 147–75. [Google Scholar] [CrossRef]
- Myers, Stewart C., and Nicholas S. Majluf. 1984. Corporate financing and investment decisions when firms have information that investors do not have. Journal of Financial Economics 13: 187–221. [Google Scholar] [CrossRef]
- Norkio, Antti. 2023. Intangible capital and financial leverage in SMEs. Managerial Finance ahead-of-print. [Google Scholar] [CrossRef]
- Park, Yoon Soo, Lars Konge, and Anthony R. Artino Jr. 2020. The positivism paradigm of research. Academic Medicine 95: 690–94. [Google Scholar] [CrossRef] [PubMed]
- Piekkola, Hannu. 2011. Intangible capital: The key to growth in Europe. Intereconomics 46: 222–28. [Google Scholar] [CrossRef]
- Rampini, Adriano A., and Sridhar Viswanathan. 2013. Collateral and capital structure. Journal of Financial Economics 109: 466–92. [Google Scholar] [CrossRef]
- Roodman, David. 2006. How To Do xtabond2: An Introduction to Difference and System GMM in Stata. Center for Global Development Working Paper 103. Available online: https://www.cgdev.org/publication/how-do-xtabond2-introduction-difference-and-system-gmm-stata-working-paper-103 (accessed on 23 July 2023).
- Rubinstein, Mark E. 1973. A mean-variance synthesis of corporate financial theory. The Journal of Finance 28: 167–81. [Google Scholar]
- Ruiwen, Zhang, and Guan Honghui. 2010. An empirical test of the impact of intangible assets on enterprise performance of Chinese social services listed companies. Paper presented at the 7th International Conference on Innovation & Management, Amsterdam, The Netherlands, October 23–25; pp. 1373–77. [Google Scholar]
- Smith, Clifford W., Jr., and Jerold B. Warner. 1979. On financial contracting: An analysis of bond covenants. Journal of Financial Economics 7: 117–61. [Google Scholar] [CrossRef]
- Song, Han-Suck. 2005. Capital Structure Determinants an Empirical Study of Swedish Companies. Stockholm: KTH Royal Institute of Technology. [Google Scholar]
- Sun, Qi, and Mindy Z. Xiaolan. 2019. Financing intangible capital. Journal of Financial Economics 133: 564–88. [Google Scholar] [CrossRef]
- Thum-Thysen, Anna, Peter Voigt, Beñat Bilbao-Osorio, Christoph Maier, and Diana Ognyanova. 2019. Investment dynamics in Europe: Distinct drivers and barriers for investing in intangible versus tangible assets? Structural Change and Economic Dynamics 51: 77–88. [Google Scholar] [CrossRef]
- Vengesai, Edson, and Farai Kwenda. 2018. The impact of leverage on discretionary investment: African evidence. African Journal of Economic and Management Studies 9: 108–25. [Google Scholar] [CrossRef]
- Vengesai, Edson, and Farai Kwenda. 2020. Firm Investment Behaviour and Stock Market Liquidity: Evidence from African Listed Firms. African Journal of Business & Economic Research 15: 165–84. [Google Scholar]
Figure 1.
Tangible and intangible investment trends. Source: own calculation based on sample data.

Table 1.
Descriptive statistics.
| Variable | Obs. | Mean | SD | 25% | Median | 75% |
|---|---|---|---|---|---|---|
| PPE | 5,557,000 | 0.2148 | 0.2630 | 0.0570 | 0.1444 | 0.2800 |
| LTD/TA | 6,368,000 | 0.0848 | 0.1136 | 0.0000 | 0.0351 | 0.1313 |
| TD/TA | 6,644,000 | 0.5010 | 0.1953 | 0.3612 | 0.4969 | 0.6381 |
| R&D | 1,999,000 | 0.0455 | 0.1361 | 0.0000 | 0.0000 | 0.0000 |
| Advertising | 1,139,000 | 0.4609 | 10,876 | 0.0415 | 0.1460 | 0.4126 |
| CF | 5,848,000 | 0.3922 | 0.6214 | 0.0858 | 0.2700 | 0.5588 |
| Sales | 6,549,000 | 51.151 | 63.849 | 13.275 | 28.807 | 61.229 |
| Tobin Q | 5,887,000 | 14.908 | 0.8242 | 0.9395 | 12.349 | 17.775 |
| EBIT | 6,167,000 | 0.4808 | 0.6005 | 0.1246 | 0.3041 | 0.6175 |
| DEPR | 5,600,000 | 0.1364 | 0.0986 | 0.0717 | 0.1129 | 0.1754 |
| Beta | 4,176,000 | 0.7672 | 58.145 | −0.1194 | 0.6043 | 16.347 |
Source: own calculations based on collected raw sample data.
Table 2.
Dynamic panel—estimation, investment tangibility, and leverage.
| Leverage | Leverage | |
|---|---|---|
| LTD/NFA | TD/NFA | |
| Lev (t − 1) | 0.344 *** (149.66) | 0.431 *** (307.11) |
| PPE | −0.0892 *** | −0.0241 *** |
| (−51.28) | (−7.36) | |
| R&D | −0.0321 *** | −0.0702 *** |
| (−35.99) | (27.42) | |
| Advertising | −0.00417 *** | −0.0142 *** |
| (−8.24) | (−7.84) | |
| Beta | −0.000675 *** | −0.000492 *** |
| (−63.05) | (−7.61) | |
| Tobin’s Q | −0.00444 *** | −0.00488 *** |
| (−15.40) | (−6.29) | |
| EBIT | −0.00173 *** | −0.0124 *** |
| (−3.62) | (−4.72) | |
| DEPR | 0.00499 ** | 0.0828 *** |
| (3.06) | (5.62) | |
| AR (2) Hansen test | 0.0890.99 | 0.650.98 |
t-statistics are provided in parenthesis below the coefficients’ estimates. AR (2) is used to test for serial autocorrelation, and the Hansen test is used to test for over-identification of instruments. *, **, and *** denote significance at the 10%, 5%, and 1% levels, respectively.
Table 3.
Economic impact of the regression estimates.
| Variable | Leverage | |
|---|---|---|
| LTD | TA | |
| PPE | −0.2065 | −0.0325 |
| R&D | −0.0372 | −0.0473 |
| Advertising | −0.0399 | −0.079 |
| Beta | −0.0085 | −0.0146 |
| EBIT | −0.0914 | −0.0381 |
| Depreciation | 0.0043 | 0.0418 |
Source: own calculations based on sample data.
Table 4.
Financial constraints and investment-related tax shield.
| Constant | t-Statistic | Std. Err | |
|---|---|---|---|
| PPE | −0.0976 *** | (−15.09) | 0.006495 |
| R&D | −0.0409 *** | (17.83) | 0.00229 |
| Advertising | −0.0105 *** | (−14.88) | 0.0007 |
| Beta | −0.00061 *** | (−3.53) | 0.00017 |
| Tobin’s Q | −0.00461 *** | (−8.39) | 0.00055 |
| EBIT | −0.0165 *** | (−5.55) | 0.0029773 |
| DEPR | 0.238 *** | (11.02) | 0.02157 |
| Leverage | 0.544 *** | (110.37) | 0.004927 |
| CF | 0.00577 ** | (3.41) | 0.00169 |
| Tax shield | −0.00330 *** | (−26.85) | 0.00122 |
| AR (2) | 0.60 | ||
| Hansen test | 0.79 |
AR (2) test for serial autocorrelation and the Hansen test for over-identification of instruments. *, **, and *** denote significance at the 10%, 5%, and 1% levels, respectively.
Disclaimer/Publisher’s Note: The statements, opinions and data contained in all publications are solely those of the individual author(s) and contributor(s) and not of MDPI and/or the editor(s). MDPI and/or the editor(s) disclaim responsibility for any injury to people or property resulting from any ideas, methods, instructions or products referred to in the content. |
© 2023 by the author. Licensee MDPI, Basel, Switzerland. This article is an open access article distributed under the terms and conditions of the Creative Commons Attribution (CC BY) license (https://creativecommons.org/licenses/by/4.0/).
Share and Cite
MDPI and ACS Style
Vengesai, E. Unveiling the Role of Investment Tangibility on Financial Leverage: Insights from African-Listed Firms. Risks 2023, 11, 192. https://doi.org/10.3390/risks11110192
AMA Style
Vengesai E. Unveiling the Role of Investment Tangibility on Financial Leverage: Insights from African-Listed Firms. Risks. 2023; 11(11):192. https://doi.org/10.3390/risks11110192
Chicago/Turabian StyleVengesai, Edson. 2023. "Unveiling the Role of Investment Tangibility on Financial Leverage: Insights from African-Listed Firms" Risks 11, no. 11: 192. https://doi.org/10.3390/risks11110192
Note that from the first issue of 2016, this journal uses article numbers instead of page numbers. See further details here.