Abstract
The global trends in taxation have generated a “race to the bottom” in capital income taxation, which is intended to be stopped by OECD through the introduction of a global minimum tax rate (15% of effective average tax rate—EATR). The question is whether the defined tax competition floor would have heterogeneous implications in different economies. The aim of this paper is to examine the long-term relationship between the EATR and FDI, and between the EATR and budget balance (BB) in European OECD economies in the period 1998–2021, using non-stationary, heterogeneous panels. According to the linear PMG model, a significant negative long-term relationship was revealed between the EATR and FDI and between the EATR and BB, while the error-correction parameters are significant and heterogeneous, showing that the speed of adjustments towards equilibrium is different across the analyzed economies. However, the nonlinear PMG results revealed asymmetry as the magnitude of the influence of an EATR reduction has a greater effect on FDI attraction and deficit deepening than an increase in the EATR on the opposite tendencies of FDI and deficit. Policymakers are facing a trade-off related to FDI attraction/budget deficit deepening when making decisions in relation to the EATR, and they are mostly oriented toward FDI inflow using EATR reduction in the analyzed economies.
1. Introduction
One of the most important instruments that policymakers use to promote economic growth and prosperity in the economy is tax policy; however, different countries’ tax regimes cannot be analyzed in isolation. Tax regimes and tax rates could significantly affect decisions about the localization of production and investment in open economies due to capital mobility across borders. In the context of tax competition, countries fight for businesses and jobs in an environment where labor and/or capital are highly mobile. On the other hand, tax competition could negatively affect the budget balance (BB). Growing empirical evidence indicates that tax policy decisions made by the OECD and the EU should consider the corporate tax system diversity in Europe. Namely, understanding the tax burden dynamics on investment localization and budget balance requires knowing the changes in tax systems over time in the OECD and EU member states.
In the last two decades, policymakers have been faced with specific tax policy challenges due to a “race to the bottom” in capital income taxation becoming the global trend in taxation. With the aim to attract foreign direct investments (FDI) and to foster economic growth, tax rates and bases are being lowered, improving competitiveness (Elschner and Vanborren 2009). The intention to create favorable tax systems implies corporate income tax rate cuts, particularly the effective average tax rate—that is, the EATR (Arnold et al. 2011). The EATR is of specific importance as it measures the real profitability of FDI; namely, the difference between the net present value of FDI profitability before and after taxes (Egger et al. 2009; Devereux et al. 2002). As a reaction, the OECD proposed a global minimum tax rate (15% of EATR) in 2022, and it has been accepted in EU economies and over 135 economies worldwide, generating another global trend related to tax coordination. The question is whether the defined tax competition floor would have a heterogeneous implication in different economies, measured through the impact of the EATR reduction on the attraction of FDI. In addition to the primary goal of attracting FDI, tax competition may have other consequences. Thus, applying competitive tax strategies could impose some risks (Podviezko et al. 2019): the decline in the corporate income tax (both statutory and effective) rate may have a negative impact on the budget balance.
This paper’s two main objectives are to empirically evaluate the effect of EATR changes on the decision to localize FDI and the relationship between the EATR and BB in the European OECD economies using the available empirical data from the period 1998–2021. The paper analyzes tax competitiveness in the specific sample of European OECD economies. In those economies, there are tendencies towards tax harmonization; however, EU economies have maintained fiscal sovereignty, which gives them the ability to establish heterogenous tax policies within the EU boundaries. Therefore, the sample is heterogeneous and could be separated into two sub-groups: emerging European OECD economies and developed European OECD economies. These goals are analyzed in the framework of cross-sectional dependent, non-stationary, heterogeneous panels, using the (Pooled) Mean Group (PMG/MG) estimator to reveal the long-run relationship between the EATR and FDI and between the EATR and BB, as well as using heterogeneous error-correction parameters. The third goal is to analyze the asymmetric effects of the EATR—namely whether an increase vs drop in EATR has a greater impact on the FDI and BB in European OECD economies—using non-linear PMG vs. MG estimation. As a robustness check, the Common Correlated Effects model (CCE) is implemented. Therefore, the hypotheses tested in this paper, based on the literature—Bénassy-Quéré et al. (2005), Bellak and Leibrecht (2005), Egger et al. (2009), Barrios et al. (2014), Todorova (2019), Glavaški et al. (2022b), Fernández-Rodríguez et al. (2023)—are:
Hypothesis (H1).
There is a significant negative long-term relationship between the EATR and FDI, while the error-correction parameters are significant and heterogeneous, showing that the speed of adjustments towards equilibrium is different across European OECD economies.
Hypothesis (H1a).
The long-run relationship between the EATR and FDI differs in two clusters: developed vs. emerging European OECD economies.
Hypothesis (H1b).
Long-run relationship between EATR and FDI differs in two subperiods: pre-crisis and crisis period.
Hypothesis (H1c).
The decrease in EATR has a stronger effect on FDI attraction in comparison to an increase in EATR.
Hypothesis (H2).
There is a significant positive long-term relationship between the EATR and BB, while the error-correction parameters are significant and heterogeneous, showing that the speed of adjustments towards equilibrium is different across European OECD economies.
Hypothesis (H2a).
The long-run relationship between EATR and BB differs in two clusters: developed vs. emerging European OECD economies.
Hypothesis (H2b).
The long-run relationship between EATR and BB differs in two subperiods: pre-crisis and crisis period.
Hypothesis (H2c).
The effect of the decrease in EATR on deficit deepening is more intensive in comparison to the contribution of an EATR increase.
The remainder of the paper is organized as follows. After the Introduction section, in Section 2, the empirical literature’s current evidence is reviewed. Section 3 deals with changes in the effective average tax rates, FDI, and budget balance in the European OECD economies over the analyzed period. Section 4 presents the methodology and data used, while Section 5 discusses the estimation results. The last part of the paper outlines the concluding remarks.
2. Literature Review
The literature on competitive tax policies in European OECD Economies is consulted in this paper. Despite retaining fiscal sovereignty among EU members, EU institutions have been advocating for tax harmonization in order to prevent harmful tax competition across member states (Glavaški et al. 2022b; Beljić et al. 2023). As Marques et al. (2019) point out in their research, it is desirable to govern tax policies on the supranational level due to: (a) the reduction in the aggressive multinational corporations’ tax planning, and (b) strengthening the neutrality of the tax systems of EU member states. However, in their study, Gropp and Kostial (2000) note that the tax harmonization in EU, given the variety of tax strategies applied by EU members, could cause divergent (positive vs. negative) repercussions. According to the results, harmonization would benefit high-tax economies while harming low-tax countries in response to changes in FDI flows. Namely, tax coordination can harm certain economies, given the diversity of their structure and size (Milton 2017); thus, economic policymakers, especially in emerging economies (Matthews 2011; Van Ganzen 2023), often opt for tax strategies that ensure tax competitiveness (Gunter et al. 2021). Tax competition is the result of a market struggle to attract foreign capital; thus, many economic policymakers choose to lower tax rates, considering that this encourages work, savings, and investments (Gale and Samwick 2014). Bellak and Leibrecht (2005) empirically confirm that high tax burdens in emerging EU economies act as an obstacle to FDI inflows as they negatively affect the investments’ profitability. Arnold et al. (2011) indicate that the most detrimental impact on GDP per capita is caused by corporate income taxes. However, Anguelov’s (2017) results imply that lower corporation tax rates could increase foreign direct investment (FDI) while reducing annual GDP growth, suggesting that although tax competition may attract investment, it may not always foster overall economic expansion. Furthermore, Talpoş and Vancu’s (2009) research findings show that corporate tax revenue has a negative effect on economic growth in developing economies, while having a beneficial impact in developed countries. Namely, the research of Thanh and Canh (2020) suggests that developed countries have the possibility to maintain or increase the corporate tax rate to increase corporate income tax revenue, while in developing countries, the opposite effect occurs: with the tax burden growth, capital accumulation decreases.
A series of papers underline the impact of the EATR. Bénassy-Quéré et al. (2005) asserted that investors may be misled following statutory tax rates. The tax burden may remain the same even though the statutory tax rate is reduced. Thus, FDI asymmetry can be a result of tax strategies applying profit-related incentives or credits to achieve tax competitiveness. Furthermore, tax competition often results in a convergence of tax rates to the lowest continental level in an integrated region like the EMU, where the majority of FDI originates from economies implementing incentives. Accordingly, an effective tax rate is more suitable (as it reflects tax incentives) for investment location decisions (Barrios et al. 2014); thus, corporations’ production and location decisions are greatly impacted by effective tax rates. Egger et al.’s (2009) results show a negative correlation between bilateral effective tax rates and outbound foreign direct investment (FDI). Furthermore, there is a positive correlation between the tax burdens of the parent and host countries. The effective tax rate represents how much companies really pay after deductions, tax credits, write-offs, and foreign income allocations (Auerbach 2013). Namely, the EATR correctly reflects tax incentives and is more suitable to evaluate the taxation impact on FDI allocation decisions by companies (Barrios et al. 2014). Glavaški et al. (2022b) revealed a significant long-run relationship between EATR dynamics and FDI in emerging EU economies. Specifically, their research shows that small open economies that use tax competition by decreasing the EATR have succeeded in attracting FDI. Furthermore, it is also confirmed that almost all emerging EU economies have achieved an equilibrium between the EATR and FDI inflow quicker as a result of joining the EU due to the increased mobility of capital, labor, products, and services among members. Beljić et al.’s (2023) findings indicate that there is a negative relationship between the EATR and FDI for EU members; however, when including the pandemic crisis in the model, the results show a limited ability of tax strategies to attract FDI, suggesting that FDI is more sensitive to crisis conditions than to changes in tax policies.
Furthermore, the asymmetric effects of tax competitiveness are a current topic of academic discourse. Papers analyzing the influence of the EATR on FDI and the budget balance are therefore particularly important. On one hand, almost all of the EU’s national governments aim to attract FDI as investments are a component of the gross domestic product (GDP) and they contribute to economic expansion. As result, FDI creates increased employment, competition, technology transfer (Stanišić 2008), improved market position, export growth, and inflow of foreign currency (Ercegovac and Beker Pucar 2022; OECD 2008). However, to increase tax competitiveness, economic policymakers are compelled to reduce labor and capital taxes (rates and tax base), which has the unintended consequence of causing budgetary instability (Todorova 2019). Dabla-Norris and Lima’s (2023) findings imply that base broadening, as opposed to rate hikes, during fiscal consolidations causes less output and employment declines. On the other hand, the opposite effects may occur when the EATR drops as it could cause budget deficit deepening. Fernández-Rodríguez et al. (2023) conclude that the tax burden, measured through the EATR in the G7 countries (developed economies), is lower than in the BRICS countries (emerging economies). However, in exchange, to finance public spending, the G7 nations need to incur greater debt and a larger deficit. The purpose of this paper is to fill the gap in the existing literature regarding the asymmetric EATR impact on FDI influx and BB in European OECD economies using the (non)linear (Pooled) Mean Group Estimator and the Common Correlated Effects Estimator, considering the apparent scarcity of scientific papers dealing with this subject for European economies that are Member States of both the EU and OECD.
3. Descriptive Analysis: EATR, FDI, and BB
Tax policies influence the capital owners’ decisions on the investments’ localization, given that the main goal of business is profit maximization. Differences in tax rates, especially corporate income tax rates, determine the location of investments. However, the statutory tax rate is not a relevant signal for capital owners. Therefore, for investment decision-making regarding the ‘host’ country, effective average tax rates are applicable. The EATR includes the impact of the nominal tax rate and, in addition, depreciation, as well as various tax benefits and exemptions, such as: (a) tax holidays; (b) R&D double deduction; (c) royalty income relief; (d) incentives for investments in newly established companies that perform innovative activities (Andresen et al. 2018). The EATR can be defined as the quotient of the present discounted value of taxes and the present discounted value of the profit that would be realized if there were no taxes (Arsić and Ranđelović 2017):
where R* represents the present discounted value of the economic rent that is distributed in the absence of taxes, R is the present discounted value of the economic rent in the presence of taxes, while π is the net profit before tax and r is the interest rate.
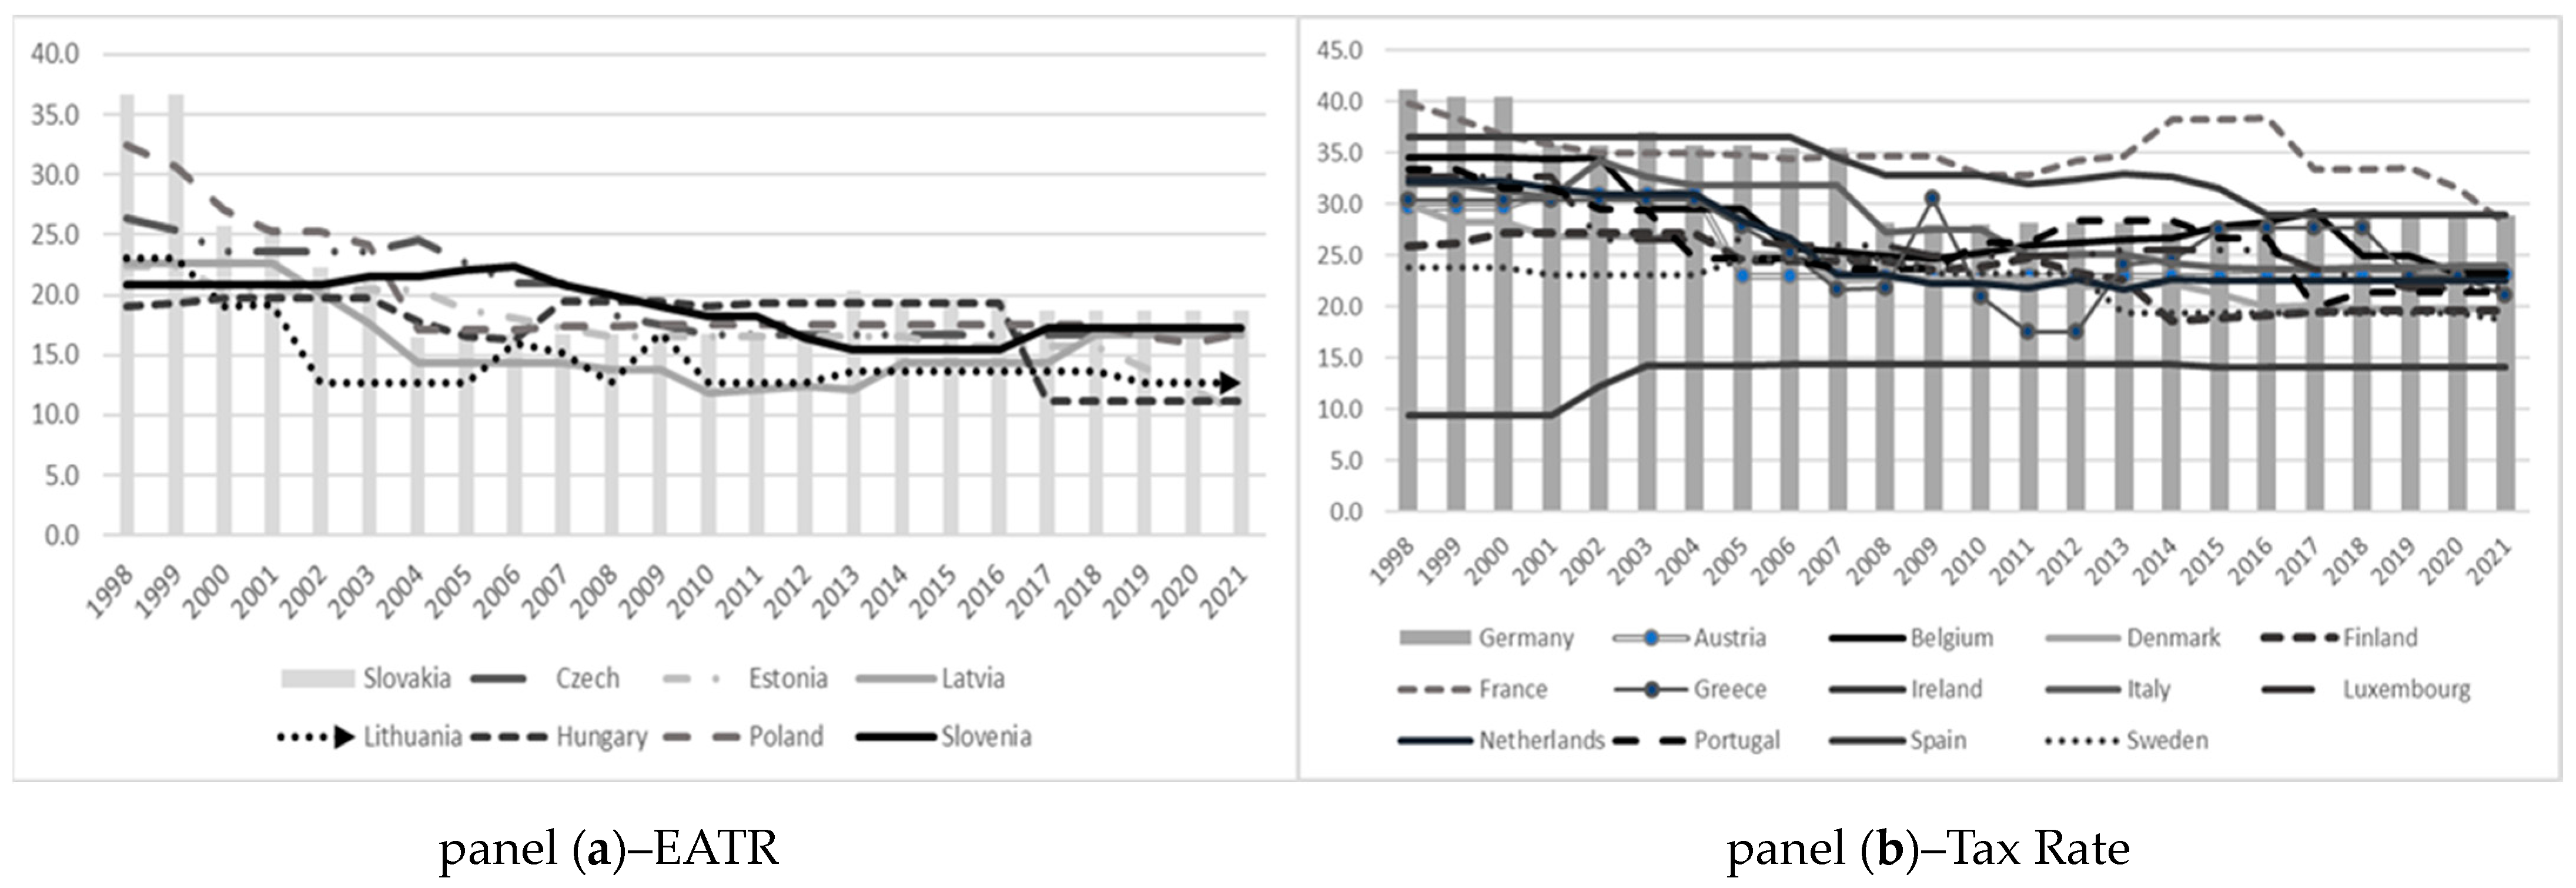
Empirical data related to European OECD economies show that the EATR has displayed decreasing tendencies from 1998 to 2021 (Figure 1). Furthermore, most of the observed economies, especially the emerging, followed the EATR in Ireland. One of the most important reasons for Ireland’s success has been recorded as being its low EATR; namely, the tax rate is notably below average, between 9.4% and 14.1% (Figure 1, panel (b)). In the group of emerging economies, Slovakia notably decreased the EATR between 1998 and 2004, from 36.7% to 16.5%, slightly increasing it after 2013. Poland lowered the EATR even before EU membership, from 32.4% to 17.1%; however, after the membership year, the EATR was slightly raised to 17.5% and again lowered to 16% in 2019 (Figure 1, panel (a)). In the group of developed economies, Germany and France had the highest rate of EATR; however, France constantly decreased their EATR in the observed period, from 39.2% to 28.1%. Another developed economy, Portugal, also applied a competitive tax strategy of lowering the EATR between 1998 (33.4%) and the global financial crisis (23.7%); subsequently, the EATR was increased (max to 28.4%) and again reduced to 21.4% (Figure 1, panel (b)).
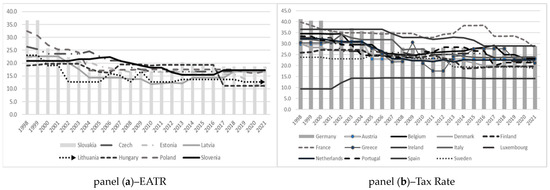
Figure 1.
Effective average tax rates in European OECD economies in the period 1998–2021. Source: Authors’ presentation based on World bank data.
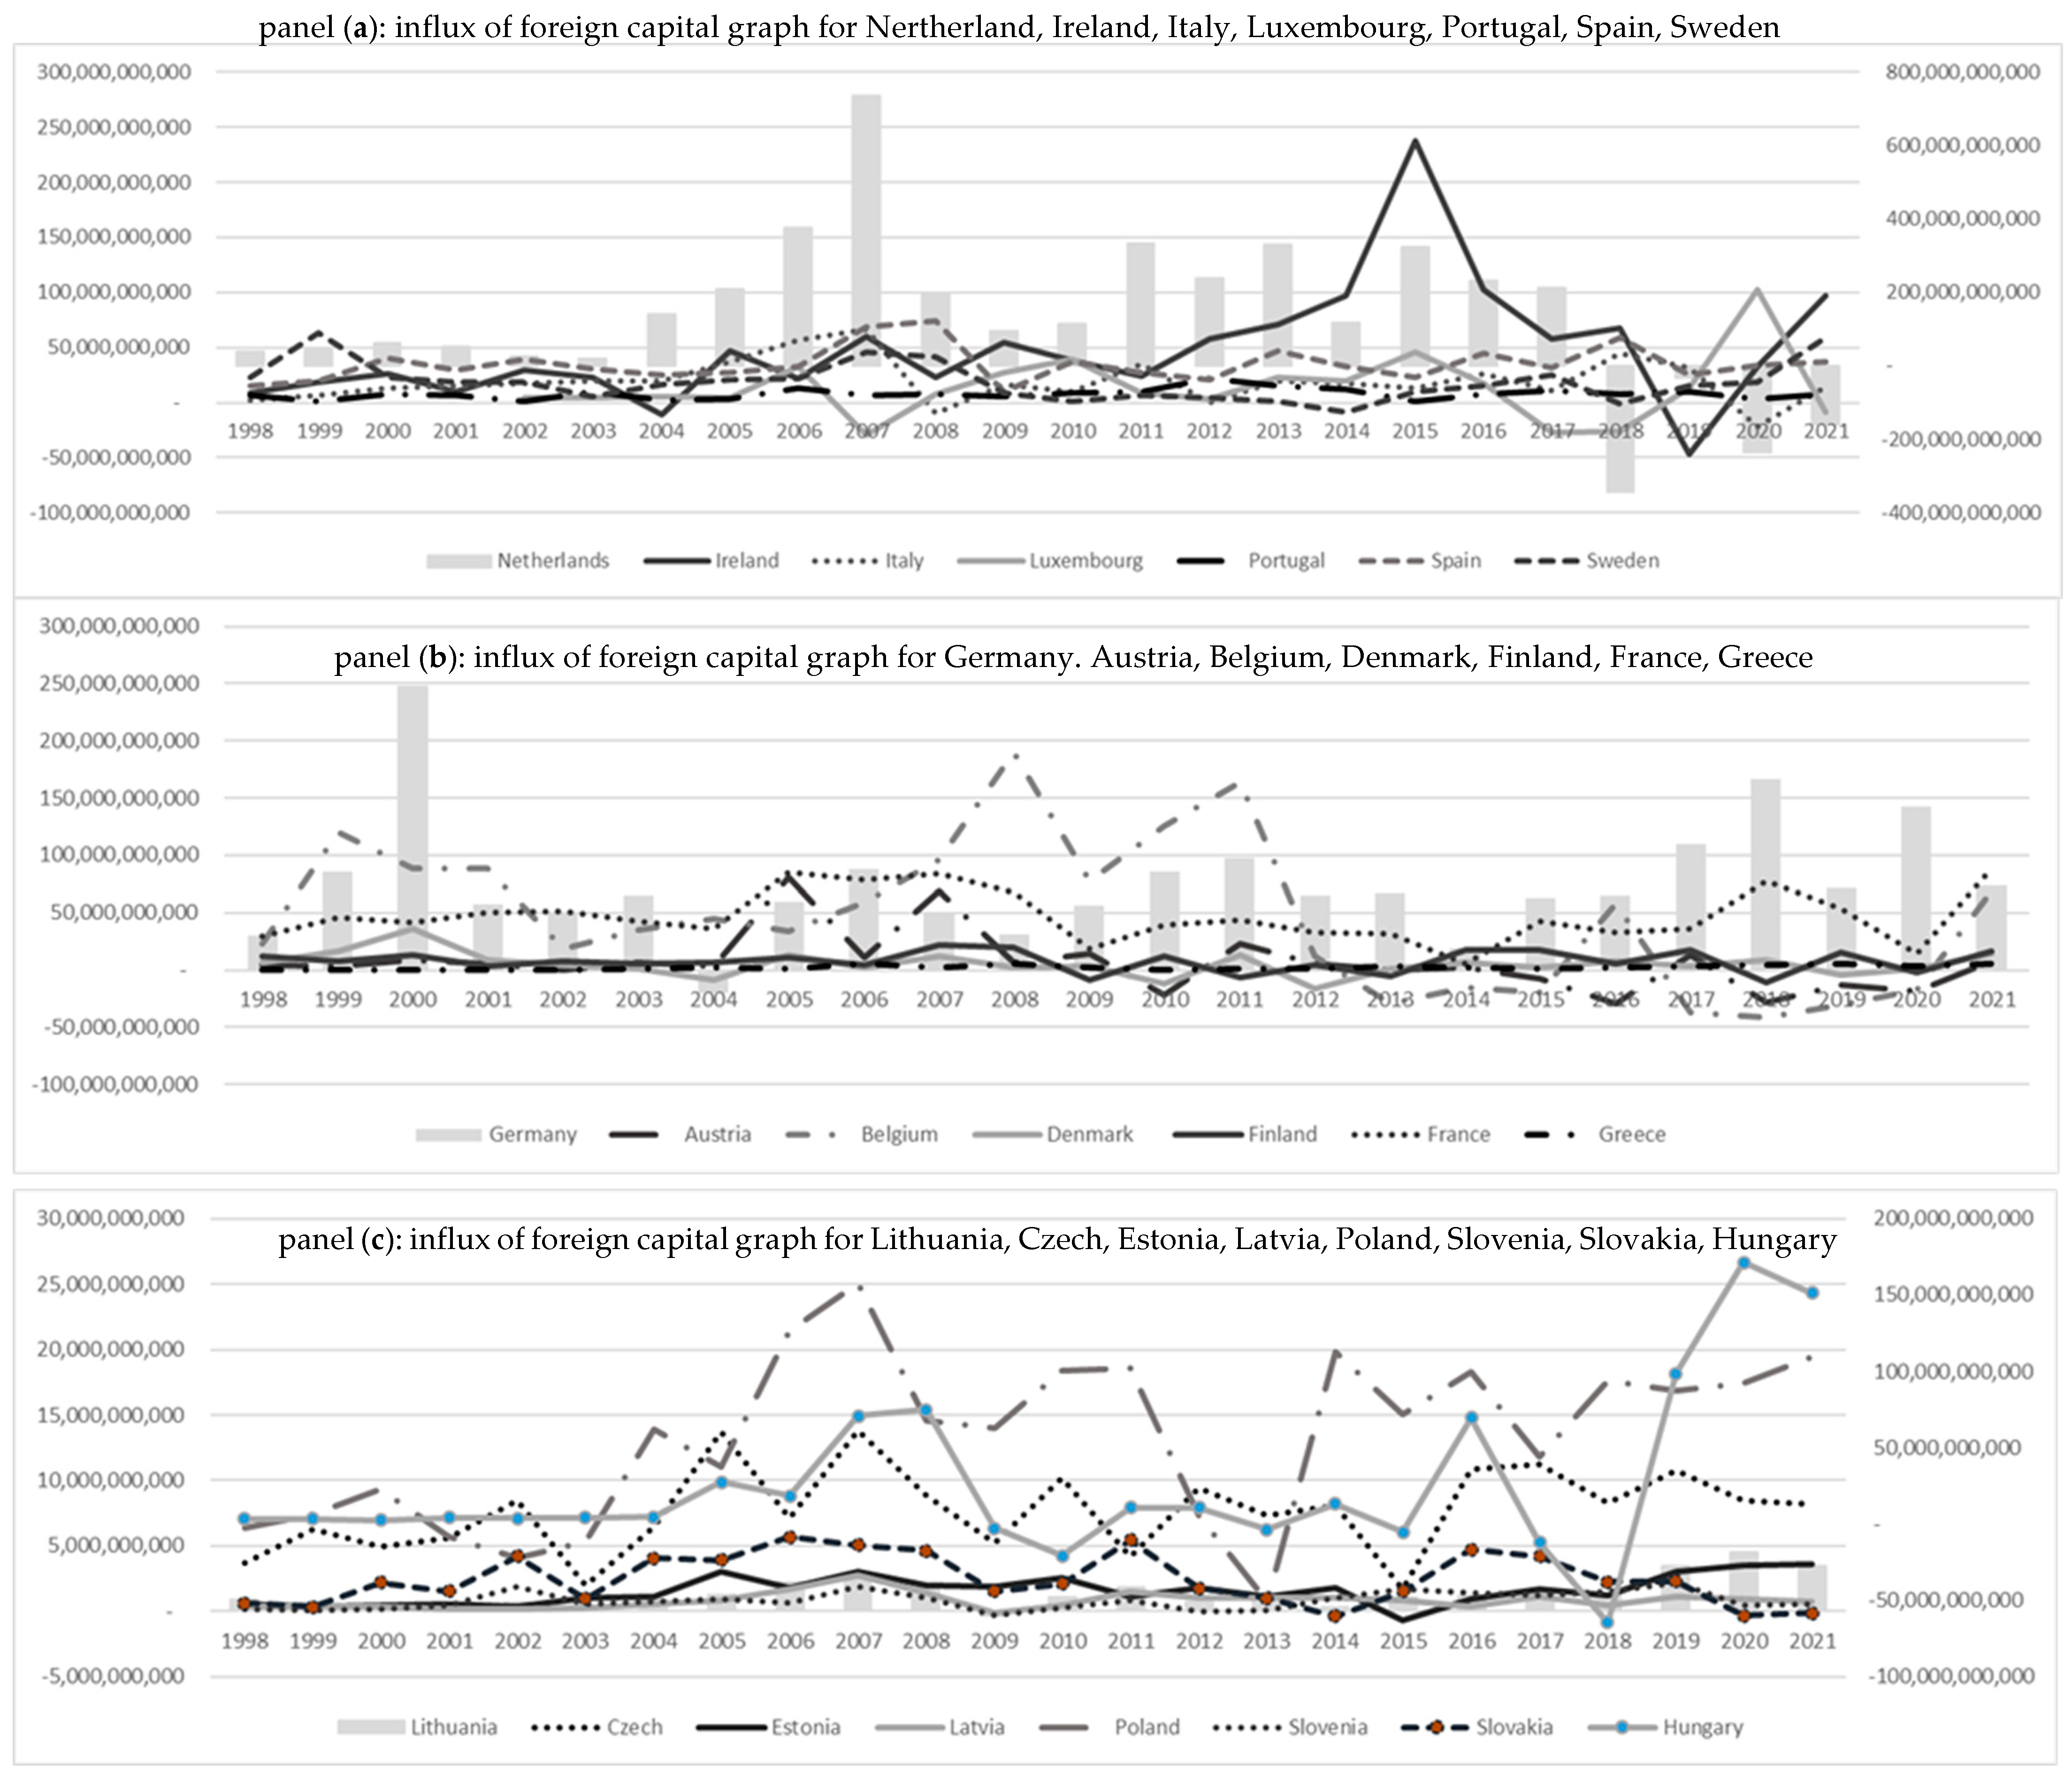
FDI is a key element in the accelerated evolution of economic integration, as well as globalization. FDI provides direct, long-term, and stable connections between economies, and also improves the competitive position of the “host” economy. Namely, the FDI inflow represents a significant source of capital, and, in addition, it encourages the exchange of technology transfer and knowledge between economies (Stanišić 2008), which further enables the “host” economies to penetrate international markets (OECD 2008). With the right policy framework, FDI can ensure financial stability, promote economic development, and improve the well-being of societies (Kostin et al. 2021). Therefore, FDI has become the primary focus of economic policymakers as a result of its increasing significance over time (Moosa and Merza 2022). Namely, national governments are motivated to adopt tax strategies that provide incentives, i.e., represent a stimulus for the FDI influx.
From the beginning of the observed period until 2003, most of the 22 European OECD economies detected a rise in the influx of foreign capital (Figure 2). However, prior to joining the EU, emerging economies, such as the Czech Republic, Slovakia, and Lithuania, experienced a drastic drop (Figure 2, panel (a)). A significant decline in FDI inflow in the observed European OECD economies was recorded after the outbreak of the global financial crisis and after pandemic crisis. Consequently, FDI inflows did not return to their pre-crisis level despite their continued growth in most of the observed economies, with the exception of the following developed economies: France, Spain, Poland (Figure 2, panel (b)).
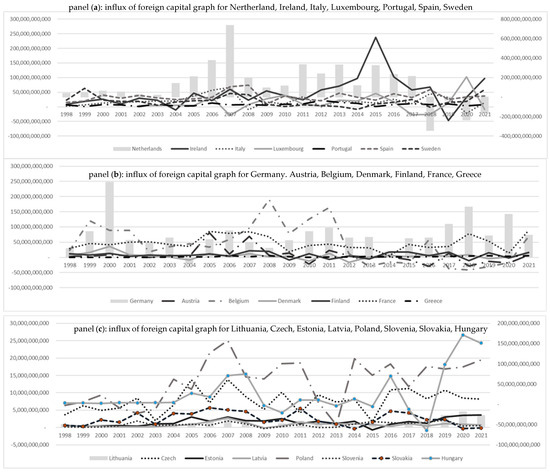
Figure 2.
FDI in dollars in European OECD economies in the period 1998–2021. Source: Authors’ presentation based on World bank data.
The EU’s fiscal framework has two dimensions: (a) the establishment of a fiscal union through greater risk sharing, shared borrowing, and a common EU budget in terms of size and utilisation; (b) the creation and implementation of fiscal regulations at the EU level that are applied to national fiscal policies (Blanchard et al. 2021). However, due to fiscal sovereignty, the design of fiscal rules is of primary importance. There are undoubtedly a variety of elements that affect the financial effort that policymakers can sustain. The functioning of fiscal policy is becoming more heterogeneous as a result of pressure from the divergences among key macroindices in the EU economies (Glavaški et al. 2022a). Thus, budget balance depends on current government expenditures, on one hand, and government revenue levels, on the other hand, and, consequently, on the ability to raise tax rates and broaden tax bases.
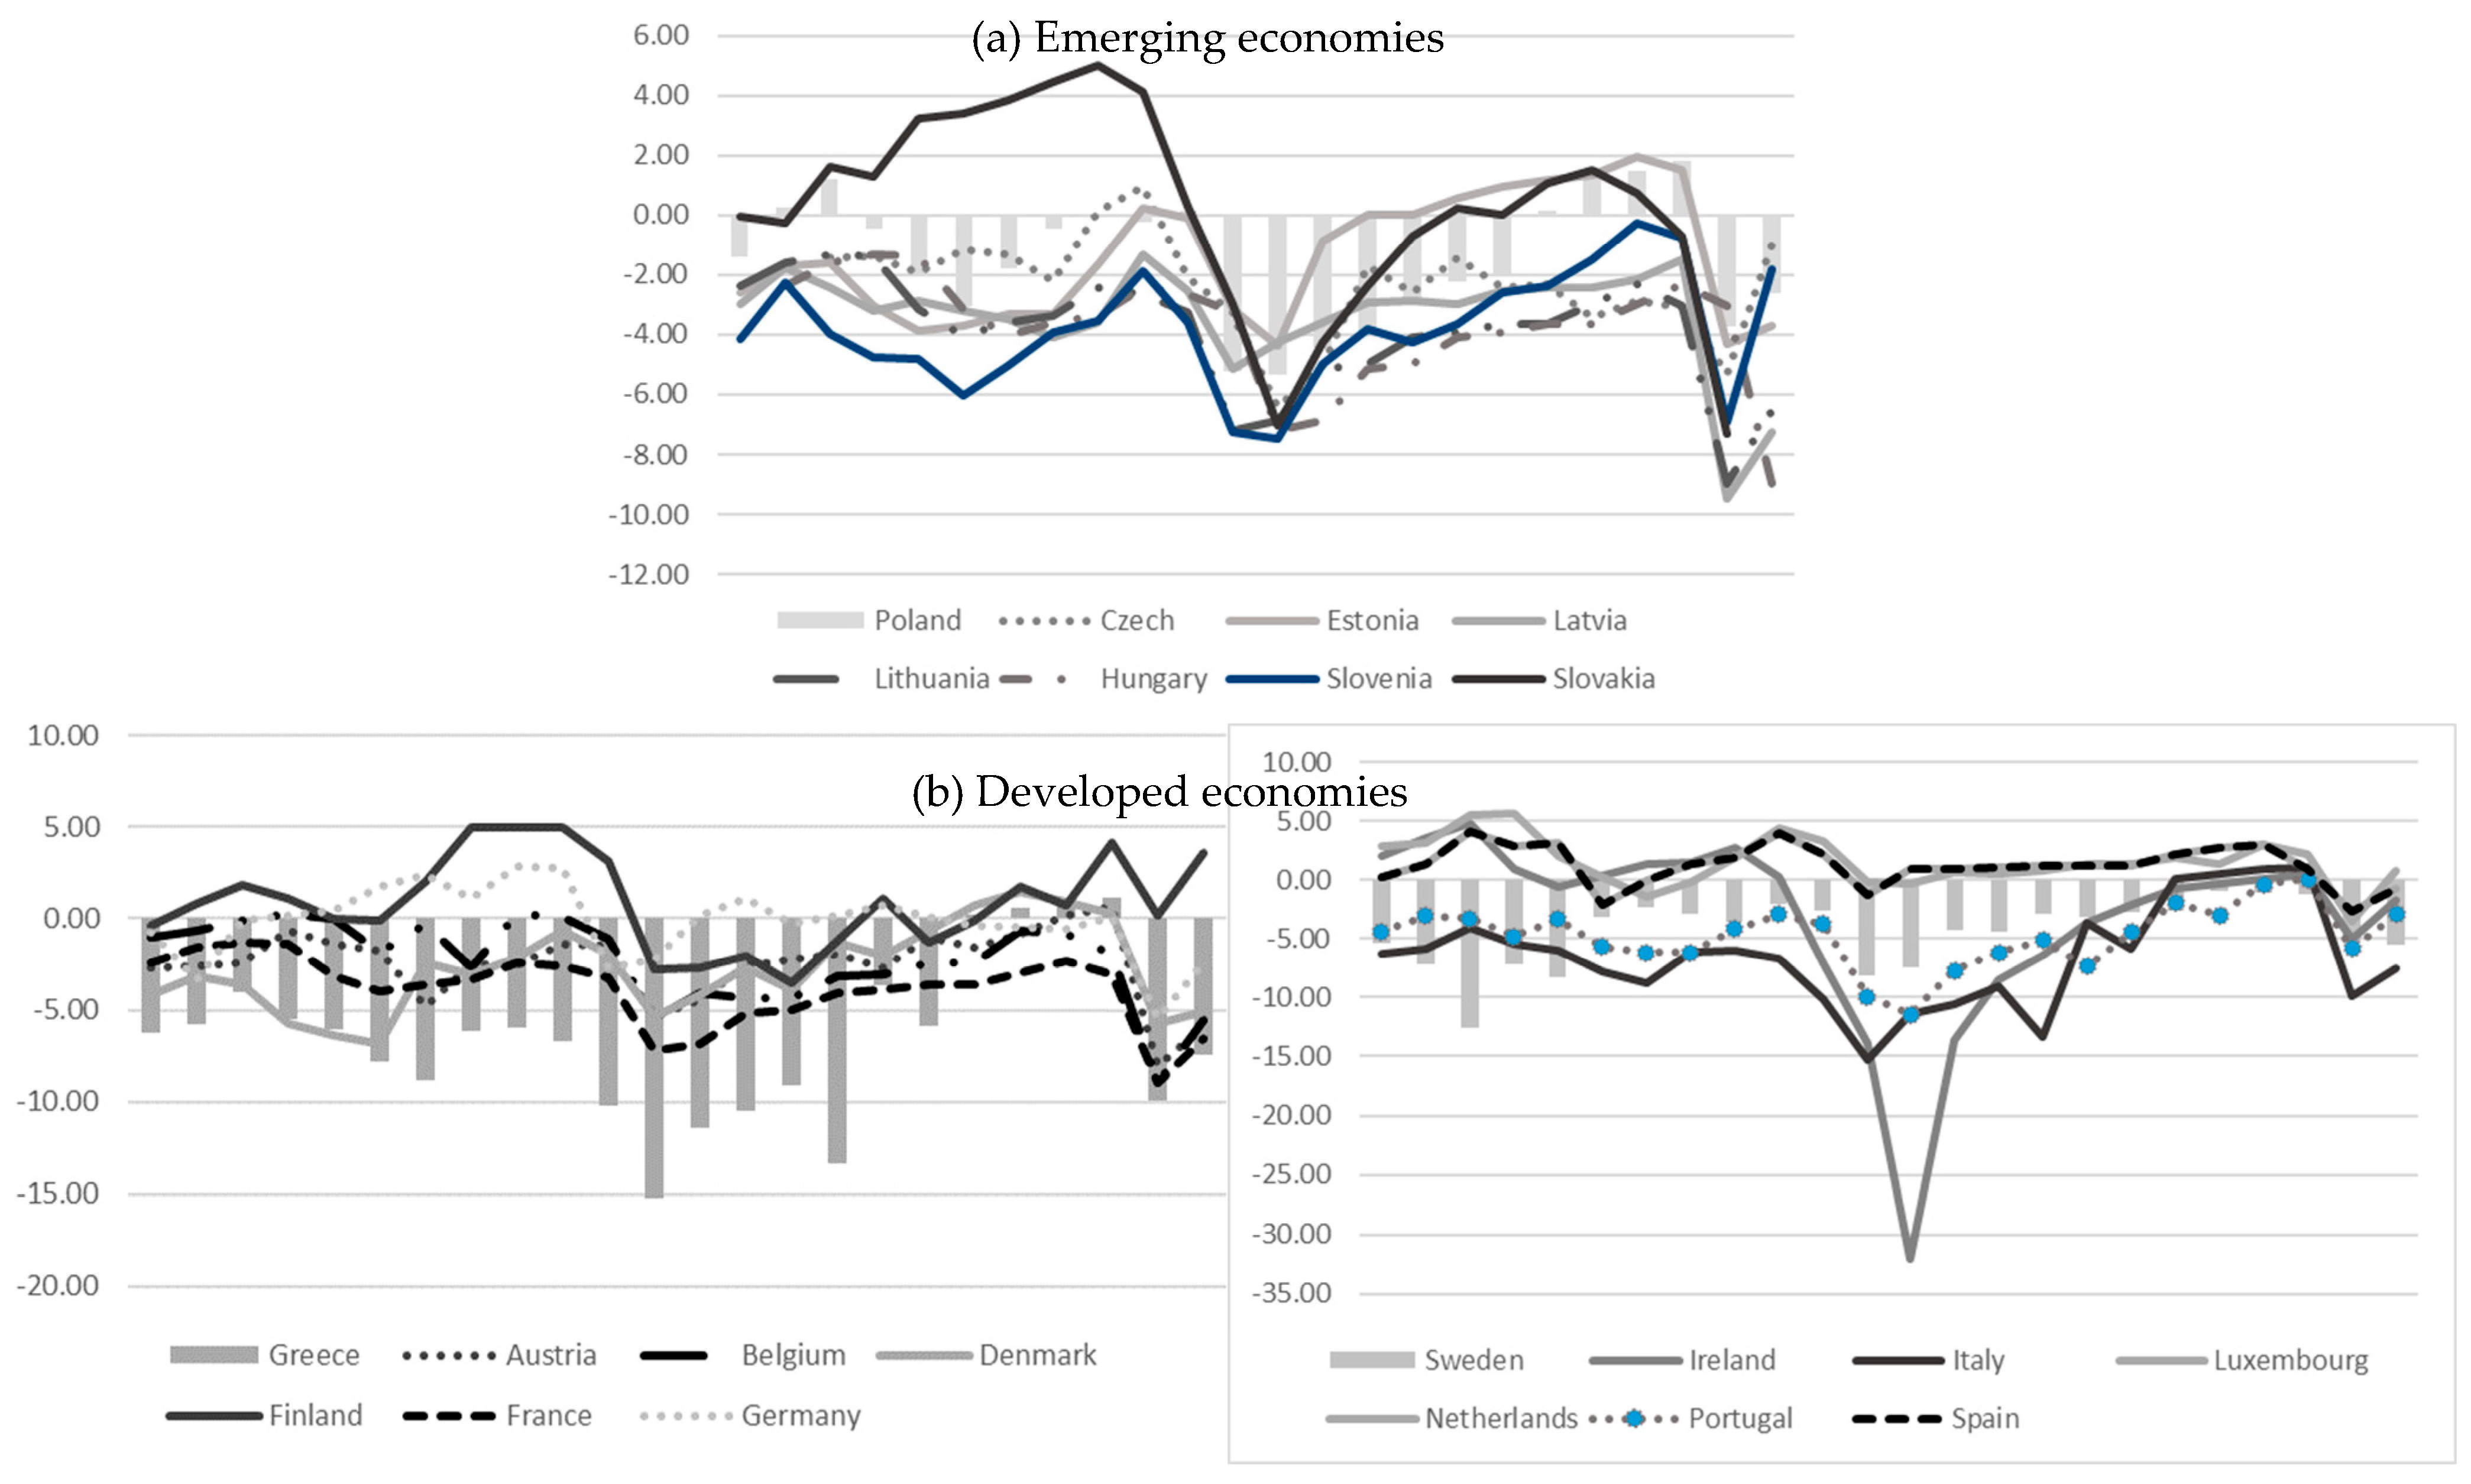
Many EU economies suffered from a high deficit and entered into an excessive deficit procedure (Figure 3). The global crisis caused higher indebtedness in the period 2008–2010, which accompanied the decrease in GDP in the years of the global, which crisis determined a sharp increase in public expenditure, creating a deeper budget deficit. In the period 2011–2019, the fiscal balance positions of the European OECD economies were improved, until the pandemic crisis.
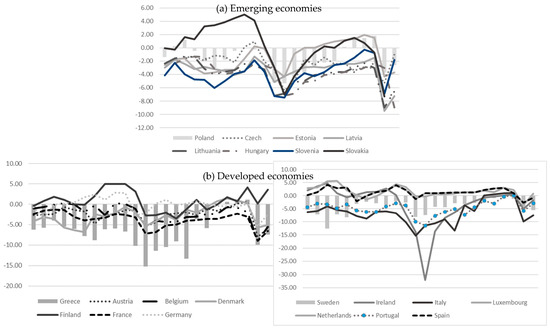
Figure 3.
Budget balance as percentage of GDP in European OECD economies in the period 1998–2021. Source: Authors’ presentation based on World bank data.
4. Methodology and Data
The research panel data econometric framework enables the investigation of the long-term relationships over time and across European OECD countries between the EATR and FDI, as well as between the EATR and BB. The whole sample contains the data on 22 European OECD economies (N = 22), 14 developed and 8 emerging economies, and the total observed period is 1998–2021 (T = 24), meaning a large panel (macro panel). Given the availability of EATR-related data, that was the longest period. Longer time dimensions require taking cross-section dependence, heterogeneity between panels, and (non)stationarity into consideration. Specifically, compared to the asymptotic of conventional large N and small T dynamic panels, the asymptote of large N and large T dynamic panels differs. (Blackburne and Frank 2007). Small T panel estimation usually relies on fixed- or random-effects estimators, based on pooling individual groups and allowing only the intercepts to differ across the groups. Nonetheless, it is frequently incorrect to assume that the slope parameters are homogeneous in large T panels. In this paper, we use methods with large T dynamic panels in order to analyze: (a) Hypotheses (H1, H1a, H1b), (H2, H2a, H2b), using MG vs PMG Estimator; (b) Hypotheses (H1c), (H2c) through non-linear PMG vs. MG Estimator; (c) robust panel estimation through CCE.
4.1. Pooled Mean Group vs. Mean Group Estimator
In macro panels, the assumptions of the stationarity and homogeneity of the slope parameters are often incorrect (Im et al. 2003); therefore, we used Mean-Group (MG) and Pooled Mean-Group (PMG) techniques to estimate non-stationary heterogeneous panels. While PMG is based on an equal long-run relationship across all panel units and the averaging of coefficients, MG is based on the estimation of N time-series regressions and averages coefficients. The only distinction between the two models is the restriction in long-run coefficients as the short-run adjustments are heterogeneous in both. The Hausman test could be used to distinguish whether to use the MG or PMG estimator (Hausman 1978). As those methods are defined as panel error-correction models, the model could be described as:
where the cross-section units are represented by i = 1, 2,…, N; the number of periods t = 1, 2,…, T; Xit is a kx1 vector of explanatory variables; is the error-correction parameter, indicating the speed of adjustment to a long-run equilibrium relationship for each European OECD economy. If a long-run relationship exists and the variables indicate a return to the long-run equilibrium, the error correction parameter should be significantly negative; otherwise, = 0 means that there is no evidence regarding long-run equilibrium. represents a long-run equilibrium relationship between variables; is the coefficient of the lagged dependent variable; δit is the short-run parameter for each panel unit (European OECD economy); represents individual effects; and uit is the stochastic disturbance term.
Using the described specification, we estimated the following models:
where the dependent variable FDI represents foreign direct investment in USD of 22 European OECD economies during the period 1998–2021 obtained by the World Bank.
where the dependent variable BB represents the budget balance as percentage of GDP for 22 OECD, while the variable EATR shows the effective average tax rates for each European OECD economy during the period 1998–2021, based on the Devereux/Griffith methodology available in the paper by Spengel et al. (2019). Using the Devereux/Griffith methodology, we downloaded data from the EU project, Effective tax levels. This provided accurate data on the effective average tax rates, which we identified to be more reliable for our analysis than corporative tax rates. In the case of FDI localization and its relationship with the EATR, as well the relationship between the EATR and budget balance in examining the long-term relationship between those variables, PMG and MG estimators are especially useful and might be anticipated to be homogeneous across the European OECD economies. On the contrary, short-run coefficients would differ depending on the characteristics of the European OECD economies and would indicate how quickly the long-run relationship is adjusted. Hypotheses H1a and H2a are tested on the sample adjusted in the dimension N, separating the data into two clusters, developed and emerging European OECD economies, while hypotheses H1b and H2b are tested on the sample adjusted in the dimension T, separating the data into two sub-periods, precrisis (1998–2007) and crisis period (2008–2021).
Non-Linear Pooled Mean Group Estimator
The specification of the nonlinear asymmetric model, established by Shin et al. (2014), decomposes the EATR into a partial sum of the decomposition of positive and negative changes (EATRincre and EATRincre, respectively). Partial sum processes of positive and negative changes are defined as:
Those positive and negative changes are included in the model, represented by Equation (7) and (8), defining the new specifications:
4.2. Robust Check—Common Correlated Effects (CCE)
As the aforementioned models do not include cross-sectional dependence, the method of Common Correlated Effects (CCE) is applied in the research in order to check the robustness of the PMG model. Common factor model representation allows for nonstationarity in dependent variables, observed and unobserved factors, various types of cointegration (between dependent and explanatory variables, between dependent, explanatory variables and some of the unobserved factors), heterogeneity of parameters, endogeneity, and cross-section dependency. Moreover, the common factor approach is able to separate the impact of regressors and the impact of unobserved common factors when the same common factor drives both inputs and outputs (Eberhardt and Teal 2009). The most famous method for common factor model estimation is Pesaran’s (2006) Common Correlated Effects (CCE) method, which is robust for cross-section dependency and allows for parameter heterogeneity. In this paper, we are interested in methods which are robust to cross-section dependency, and which allows heterogeneous parameters and heterogeneous factor loadings, such as the CCE method, in order to undertake robustness check.
5. Empirical Results and Discussion
5.1. Heterogeneous Effects of EATR on FDI and BB: Pooled Mean Group vs. Mean Group Estimator Results
The following empirical steps are part of the process used to determine the short- and long-term dynamic estimates and relationship between the EATR and FDI and the EATR and BB (Hypotheses (H1) and (H2)). Considering the analyzed sample in the longest possible period (1998–2021) for the 22 European OECD economies, the cross-sectional dependence (CSD) in the panel is tested first. The results of the Pesaran CD test are presented in Table 1 and simultaneously represent the analysis related to Hypothesis (H1) (for EATR and FDI) and Hypothesis (H2) (for EATR and BB), implying that the null hypothesis of cross-section independency must be rejected for the variables EATR, FDI, and BB. The strong institutional framework in EU economies and common policies—such as the common market, common agricultural policy, customs union, tax harmonisation, and finally monetary union for some of the European OECD economies—which inevitably result in connections, spillover effects, and dependencies between EU countries, are the causes of the detected dependence (Glavaški et al. 2022b).

Table 1.
Pesaran CD test, Pesaran CIPS test and Westerlund cointegration test.
Due to the CSD test results, the Pesaran CIPS test (2007), a second-generation panel unit root test, is utilized, allowing for CSD. Unit root tests do not reject the null hypothesis of non-stationarity, which means that the variables FDI and EATR are non-stationary, as well as the variable BB. After that, the stationarity of the first differences was tested, and the results show that all variables are stationary (Table 1). Due to the existence of CSD, a robust version of Westerlund’s test is used to test the cointegration. According to the Westerlund test results, the alternative hypothesis of cointegration is accepted for both models, and the null hypothesis of no cointegration is rejected. (Table 1).
The homogeneous coefficients in the model estimated by PMG and MG are shown in Table 2 (panel (a)). In the case of PMG, the cointegration vector is significant and between 0 and 1, indicating a negative long-run relationship between FDI and the EATR. A negative relationship is expected as the EATR reduction affects the FDI influx. A long-term relationship between the EATR and the FDI was found using the Mean Group estimator, as well as significant and heterogeneous error-correction parameters, indicating that the rate of adjustment towards equilibrium differs. The error-correction coefficients show a fiscal adjustment—about 70.3% of the deviations from the long-run equilibrium relationship are corrected in one year according to the PMG method, and in the case of the MG method, 72.4% of deviations are corrected. However, using the Hausman test, the PMG model was revealed to be more efficient, and thus the dynamics of the heterogeneous adjustment coefficient were analyzed using the PMG model. Furthermore, we separately analyzed two clusters (Table 2, panel (c), (e)). One represents 14 high-income (developed) economies and the second represents 8 low-income (emerging) European OECD economies. Using divided models, the results from PMG suggest that there is a more intensive long-term relationship between FDI and the EATR in developed (−1.678) than in emerging European OECD economies (−1.271). The error correction shows a fiscal adjustment—about 86.2% (developed economies) and 66% (emerging economies). Thus, developed economies are more successful (in comparison to emerging economies) in attracting FDI through tax competitiveness—i.e., by decreasing the EATR.
Table 2.
PMG and MG estimator results for homogeneous coefficient for European OECD economies (developed and emerging) in the period 1998–2021.
As that Hausman test suggested that the PMG method of estimation is more efficient, the heterogeneous adjustment coefficients will be analyzed using the PMG estimator (Table 3).
Table 3.
PMG estimator results for heterogeneous coefficient for European OECD economies in the period 1998–2021.
The primary advantage of using heterogenous panels is the estimates of each European OECD economy in the context of error-correction parameters. The correction of the equilibrium error (Table 3, panel (a)), which indicates adjustments towards long-term equilibrium is significant and negative in emerging European OECD economies, including Czech Republic, Estonia, Latvia, Lithuania, Hungary, Poland, Slovenia, Slovakia, and developed European OECD economies: Austria, Belgium, Denmark, Finland, France, Germany, Greece, Ireland, Italy, Luxembourg, Netherlands, Portugal, Spain, Sweden. In one emerging economy (Czech Republic) and in four developed economies (Denmark, Finland, Italy, and Spain), an adjustment coefficient greater than 1 was detected, indicating overcorrection. Therefore, the speed of adjustment towards equilibrium is highest in: (a) France, followed by Portugal, meaning that those open developed economies are using tax competition in the context of EATR reduction (from 39.8% to 33.5%; from 33.4% to 21.4%, respectively); (b) Slovakia—a small open emerging economy which has sharply reduced the EATR in the context of tax competition (from 36.7% to 18.7%). On the other hand, the error-correction parameter is not significant in Lithuania and Hungary (constant EATR about 19% till 2016), indicating that FDI influx in those countries is determined more by other factors rather than tax competition.
Hypothesis (H2) is oriented to the impact of changes in the EATR towards BB in European OECD economies. The homogeneous coefficients in the budget balance model (Table 2, panel (b)) show that the cointegration vector is significant and between 0 and 1, indicating a positive long-run relationship between the EATR and BB. This means that an increase in the EATR could affect budget surpluses, while an EATR reduction could negatively affect budget balance. The error-correction coefficients show a fiscal adjustment—about 44.6% of the deviations from a long-run equilibrium relationship are corrected in one year according to the PMG method, whereas in the case of the MG method, 48.6% of deviations are corrected. The Hausman test indicated that PMG is the optimal model. The homogeneous coefficients in the budget balance models for two clusters (developed and emerging) (Table 2, panel (d) and (f)) show that the cointegration vector is significant and between 0 and 1, indicating a long-run relationship between the EATR and BB, meaning that an EATR reduction could negatively affect budget balance in both group of economies. The vulnerability to deficit deepening due to tax reduction is similar in both groups of economies. Thus, our primary conclusion based on the whole sample is confirmed due to the similar long-run and error-correction parameters in the developed and emerging European OECD economies.
Furthermore, the homogeneous coefficients in the preferred Pooled Mean Group estimator revealed a long-run relationship between the EATR and BB, while the error-correction parameters are significant and heterogeneous, showing that the speed of adjustment towards equilibrium is different. The error-correction term indicating correction towards long-run equilibrium is significantly negative (Table 3, panel (b)) in emerging European OECD economies, such as Czech Republic, Estonia, Latvia, Hungary, Poland, Slovenia, and in developed European OECD economies: Austria, Belgium, Denmark, Finland, Germany, Ireland, Italy, Luxembourg, Netherlands, Portugal, Spain, Sweden. The speed of adjustment towards equilibrium is highest in: (a) Luxembourg, meaning that in this small open developed economy, tax competition is used in the context of effective average tax rates (from 32.6% to 21.8%); (b) Czech Republic, indicating that, in the context of effective average tax rates, this open emerging economy uses tax competition (from 26.4% to 17.0%). On the other hand, the error-correction parameter is not significant in Lithuania, Slovakia, France, and Greece, implying that other factors are dominant in explaining the budget balance, in addition to the EATR.
It appears that while making decisions on the EATR, policymakers are primarily focused on FDI inflow via EATR reduction in European OECD economies, and that they are faced with a trade-off between FDI attractiveness and budget deficit widening due to tax competition. For economies with an already high EATR rate, a worldwide minimum tax rate initiative would thus have less detrimental consequences and limited beneficial implications on budget balance.
5.2. Asymmetric Effects of EATR on FDI and BB: Before and after Crisis (Pooled) Mean Group Estimator Results
Section 3, related to the descriptive analysis of key variables in the analysis, showed that European OECD economies were affected by the global financial crisis (2008–2009), indebtedness crisis (2008–2010), and pandemic crisis (2020–2021). Due to the spillover effects of these crisis in the European OECD economies, we separated the sample into two sub-samples: first, covering the relatively stable period of 1998–2007 (pre-crisis period), and second, covering the period characterized by global instabilities, 2008–2021 (crisis period).
The homogeneous coefficients in the models (pre-crisis and crisis period) estimated by PMG and MG are shown in Table 4 (panel (a), (c)). In the case of the PMG model for the observed period before the global financial crisis, the cointegration vector is significant and between 0 and 1, indicating a long-run relationship between FDI and the EATR. A negative relationship is expected as an EATR reduction affect FDI influx. Furthermore, a negative relationship is revealed for the PMG model which includes global crises (financial, debt, and pandemic crisis). The long-run relationship is higher in the model that estimated the period before crisis (−1.957). Namely, it was a phase of expansion, during which greater FDI inflows and tax competition occurred; i.e., the policy of decreasing the EATR began. The subsequent FDI influx drop was a result of the global financial and pandemic crises; thus, the EATR reduction did not significantly attract FDI.
Table 4.
PMG and MG estimator results for homogeneous coefficient for European OECD economies in two subperiods: 1998–2007 and 2008–2021.
The homogeneous coefficients in both the pre-crisis and crisis budget balance models (Table 4, panel (b), (d)) show that the cointegration vector is significant and between 0 and 1, indicating a positive long-run relationship between the EATR and BB, meaning that an EATR reduction could negatively affect budget balance. However, the impact of changes in the EATR towards BB in European OECD economies before and during the crisis significantly differs (0.764 and 0.078; respectively). The tax policies before the crisis had a notably greater influence on the budget balance; however, after the crisis, other factors determined deficit deepening; namely, high deficits were not primarily a consequence of cutting the EATR.
5.3. Asymmetric Effects of EATR on FDI and BB: Nonlinear Pooled Mean Group vs. Nonlinear Mean Group Estimator Results
The homogeneous coefficients in the model (FDI and EATR) estimated using nonlinear PMG and MG are shown in Table 5 (panel (a)). The results of the nonlinear PMG show the asymmetric effects of EATR changes on FDI in European OECD economies in the observed period (H1a). The negative sign indicates that an increase in EATR discourages investments, while a decrease in the EATR increases FDI—the main results are unchanged. The asymmetry is indicated by the magnitude of their different coefficient values. The homogeneous coefficients of the preferred (based on Hausman test) nonlinear Pooled Mean Group estimator revealed a long-run relationship between the EATR decrease and the FDI, showing that a decrease in the EATR (0.2664) has a stronger effect on FDI attraction in comparison to an increase in EATR (0.125). Furthermore, the positive sign indicates that a decrease in EATR deepens the budget deficit, while an increase in EATR decreases the deficit (Table 5, panel (b)). Again, the main results are unchanged—the asymmetry is indicated only by the magnitude of their different coefficient values (H2a). The homogeneous coefficients of the preferred nonlinear Pooled Mean Group estimator revealed a long-run relationship and indicated that a decrease in EATR (0.338) again has a more intensive effect on deficit deepening in comparison to the contribution of an EATR increase (0.214) on deficit reduction.
Table 5.
Nonlinear PMG and MG estimator results for homogeneous coefficients for European OECD economies in the period 1998–2021.
Finally, the results of the nonlinear PMG showed that a decrease in the EATR has stronger effect on FDI attraction in comparison to an increase in EATR, which is recognized by policymakers. Both positive and negative changes to the EATR have a significant effect on FDI, but negative EATR changes have a greater impact on FDI attraction than positive EATR changes on FDI dislocation. On the other hand, the nonlinear PMG indicated that the effect of a decrease in the EATR on deficit deepening is more intensive in comparison to the contribution of an EATR increase. Therefore, policymakers are facing a trade-off related to FDI attraction/budget deficit deepening when they make decisions in relation to the EATR.
5.4. Robustness Check
A robustness check using different methods of estimation was conducted using the Pesaran (2006) CCEMG method (Table 6). In the first part of Table 6, the homogeneous parameters are represented. According to the homogenous parameters, EATR lowering has positive effects on FDI influx, which is in accordance with the PMG estimation results. Other significant control variables included in the model are the long-run interest rate and dummy variable representing crisis conditions (dummy variable takes value 1 during the crisis 2008–2010 and 2020–2021, otherwise 0). Lowering the interest rate attracts FDI, while in the crisis years, the inflow of FDI was reduced. Moreover, the negative relationship revealed by PMG, between EATR and BB, is confirmed. Table 6represents a model that focuses on the EATR as a key variable; however, we included other control variables in the model, such as GDP per capita growth and labor force (labor). Those variables positively affect the budget balance, insuring a lowering of the budget deficit. It is expected that the reduction in the EATR has a negative impact on budget balance, which is confirmed in the CCE model with the positive sign and significant variable EATR. Otherwise, increasing the EATR would lead to positive effects on BB.
Table 6.
Nonlinear PMG and MG estimator results for homogeneous coefficient for European OECD economies in the period 1998–2021.
The conclusions related to the robustness check using the alternative method are: (1) the same variables, EATR, with the same sign, significantly determine FDI, as in the case of the previously applied PMG method; (2) EATR with the same sign and similar intensity influences budget balance, meaning that a decrease in EATR deepens the budget balance. Hence, we could claim that the results are stable across the alternative estimators.
6. Conclusions
Tax competition between economies imposes constant competition that involves lowering corporate income tax rates and narrowing tax bases in order to attract FDI and increase economic growth. However, there is a risk that such tax strategies could have negative repercussions on tax revenues, and more precisely, on the budget balance in European OECD economies. This research contributes to the literature that analyzes the impacts of EATR changes on FDI localization by focusing on European OECD economies, which includes a heterogeneous sample, including both developed and emerging economies. The paper’s main findings can be summarized as follows: (i) The results of the panel models (PMG estimator) based on twenty-two European OECD economies for the period 1998–2021 show that a significant long-run relationship between EATR dynamics and FDI inflow exists, while the error-correction parameters show significant heterogeneity, indicating that the speed at which European OECD economies adjust to equilibrium differs. However, the highest adjustment parameter is estimated in the economies that have reduced the EATR the most (emerging economies: Slovakia—reduction of 18%, developed economies: Portugal—reduction 12%). Meanwhile, in some economies, the adjustment is not significant—in these cases, the fluctuations of FDI inflow could not be explained predominantly by a lowering of the EATR; rather, it is necessary to take a broader set of potential determinants of FDI localization into consideration. (ii) Furthermore, the results of the nonlinear PMG showed that a decrease in the EATR has a stronger effect on FDI attraction in comparison to an increase in EATR, which is recognized by policymakers. This study finds that positive and negative EATR changes significantly affect FDI; hence, the long-run asymmetry is discovered by identifying the unequal coefficient values between an increase and decrease in EATR, while an EATR decrease has a greater effect on FDI than an EATR increase. This means that both long-run EATR positive and negative changes have a significant effect on FDI, but negative EATR changes have a greater impact on FDI attraction than positive EATR changes on FDI dislocation. (iii) The results showed that an EATR reduction can influence fiscal deficit deepening, with heterogeneous effects in European OECD economies. According to the empirical analysis, we concluded that the speed of adjustments towards equilibrium is different across European OECD economies (emerging economies: Czech Republic, developed economies: Luxemburg), while in some economies, adjustment is not significant, meaning that the EATR is not a crucial factor for the sustainability of public finance in those economies. (iv) The more detailed, nonlinear PMG indicated that the effect of a decrease in the EATR on deficit deepening is more intensive in comparison to the contribution of an EATR increase. (v) The clusters’ differentiations show a stronger long-run relationship between FDI and an EATR reduction in developed in comparison to emerging European OECD economies, while the vulnerability to deficit deepening due to an EATR reduction is similar in both groups of economies. (vi) The PMG estimator’s findings indicate that the long-term relationship was stronger prior to the crisis as the global crises lowered the ability of tax policy (cutting EATR) to attract FDI. (vii) The Common Correlated Effects model is implemented as a robustness check as this method includes cross-sectional dependence. The CCE model confirmed the conclusions based on the PMG model in relation to the long-run relationship between the EATR and FDI, and between the EATR and BB.
In summary, due to tax competition, it seems that policymakers are facing a trade-off related to FDI attraction/budget deficit deepening when they make decision regarding the EATR, and that they are mostly oriented toward FDI inflow through EATR reduction in European OECD economies. Therefore, a global minimum tax rate initiative would have fewer negative effects on economies with an already higher EATR rate and a limited positive impact on budget balance. Thus, it is imperative for policymakers to: (i) further evaluate the benefits/drawbacks of tax competition, given that tax competition, in addition to the confirmed success of FDI influx, may also negatively affect budget balances; (ii) examine the specific effects of tax coordination/competition on crucial macroeconomic variables (economic growth, budget balance, FDI inflow, equality, public revenues) in heterogenous economies worldwide in order to prevent further harmful spillover to the most vulnerable economies. In future research, we would also include an exemplary new Fourier-based type-2 fuzzy neural network method (Mohammadzadeh et al. 2023), which is simple and effective for high-dimensional problems; moreover, it can be used as an approach for modeling and analyzing uncertain data.
Author Contributions
Conceptualization, M.B. and O.G.; methodology, M.B. and O.G.; software, M.B., O.G. and S.S.; validation, O.G., E.B.P. and J.P.; formal analysis, O.G. and E.B.P.; investigation, M.B.; resources, M.B.; data curation, M.B. and S.S.; writing—original draft preparation, M.B. and O.G.; writing—review and editing, M.B. and O.G.; visualization, S.S. and J.P.; supervision, E.B.P.; project administration, O.G. and J.P.; funding acquisition, O.G. All authors have read and agreed to the published version of the manuscript.
Funding
The research is funded by the Provincial Secretariat for Higher Education and Scientific Research, Autonomous Province of Vojvodina, Republic of Serbia within the project: Coordination of Economic Policies in the Function of European Integration, number 142-451-2650/2021-01/2.
Data Availability Statement
FDI: https://data.worldbank.org/indicator/BX.KLT.DINV.CD.WD; Budget balance: https://data.worldbank.org/indicator/BN.CAB.XOKA.GD.ZS; EATR: Spengel, Christoph et al. (2020): Effective tax levels using the Devereux/ Griffith methodology, ZEW-Gutachten und Forschungsberichte, ZEW-Leibniz-Zentrum für Europäische Wirtschaftsforschung, Mannheim: https://taxation-customs.ec.europa.eu/system/files/2021-02/final_report_2020_effective_tax_levels_revised_en.pdf; Long_IR: https://data.oecd.org/interest/long-term-interest-rates.htm; gdppc_growth: https://data.worldbank.org/indicator/NY.GDP.PCAP.KD.ZG; labor: https://data.worldbank.org/indicator/SL.TLF.TOTL.IN, all accessed on 5 November 2023.
Acknowledgments
The first draft of this paper: The Implications of Tax Competition on FDI vs. Budget Balance in European OECD Economies: Heterogeneous Panel Approach, was presented at 5th Warsaw Money-Macro-Finance Conference, 21–22 September 2023, Warsaw, Poland We are grateful to conference participants for helpful comments and suggestions.
Conflicts of Interest
The authors declare no conflict of interest.
References
- Andresen, Maria R., Benjamin R. Kett, and Erik von Uexkull. 2018. Corporate Tax Incentives and FDI in Developing Countries. In Global Investment Competitiveness Report 2017/2018 Foreign Investor Perspectives and Policy Implications. Washington, DC: World Bank. [Google Scholar] [CrossRef]
- Anguelov, Nikolay. 2017. Lowering the Marginal Corporate Tax Rate: Why the Debate? Economic Affairs 37: 2. [Google Scholar] [CrossRef]
- Arnold, Jens Matthias, Bert Brys, Christopher Heady, Asa Johansson, Cyrille Schwellnus, and Laura Vartia. 2011. Tax Policy for Economic Recovery and Growth. The Economic Journal 12: 59–80. [Google Scholar] [CrossRef]
- Arsić, Milojko, and Saša Ranđelović. 2017. Ekonomija Oporezovanja: Teorija i Politika. Beogradu: Centar za izdavačku delatnost Ekonomskog fakulteta u Beogradu. ISBN 978-86-403-1529-6. [Google Scholar]
- Auerbach, Alan. 2013. Capital Income Taxation, Corporate Taxation, Wealth Transfer Taxes and Consumption Tax Reforms. Chicago: The Empirical Foundations of SupplySide Economics, The Becker Friedman Institute, University of Chicago. [Google Scholar]
- Barrios, Salvador, Gaëtan Nicodème, and Antonio Jesus Sanchez Fuentes. 2014. Effective Corporate Taxation, Tax Incidence and Tax Reforms: Evidence from OECD Countries. Working Paper Series 5017. CESifo. Brussels: European Commission. [Google Scholar]
- Beljić, Marina, Olgica Glavaški, and Jovica Pejčić. 2023. Tax Strategies and FDI Sensitivity in Crisis Conditions: The Case of EU. Paper presented at 28th International Scientific Conference Strategic Management and Decision Support Systems in Strategic Management-SM 2023, Subotica, Serbia, May 18–19; pp. 166–74. [Google Scholar]
- Bellak, Christian, and Markus Leibrecht. 2005. Do Low Corporate Income Tax Rates Attract FDI? Evidence from Eight Central and East European Countries. Research paper series Globalisation, Productivity and Technology. Nottingham: University of Nothingham. [Google Scholar] [CrossRef]
- Bénassy-Quéré, Agnès, Lionel Fontagné, and Amina Lahrèche-Révil. 2005. How Does FDI React to Corporate Taxation? International Tax and Public Finance 12: 583–603. [Google Scholar] [CrossRef]
- Blackburne, Edward, and Mark Frank. 2007. Estimation of Nonstationary Heterogeneous Panels. Stata Journal 7: 197–208. [Google Scholar] [CrossRef]
- Blanchard, Olivier, Alvaro Leandro, and Zettelmeyer Jeromin. 2021. Redesigning EU Fiscal Rules: From Rules to Standards. Economic Policy 36: 195–236. Available online: https://academic.oup.com/economicpolicy/article/36/106/195/6122701 (accessed on 17 September 2023). [CrossRef]
- Dabla-Norris, Era, and Federico Lima. 2023. Macroeconomic Effects of Tax Rate and Base Changes: Evidence from Fiscal Consolidations. European Economic Review 153: 104399. [Google Scholar] [CrossRef]
- Devereux, Michael, Rachel Griffith, and Alexander Klemm. 2002. Corporate income tax reforms and international tax competition. Economic Policy 17: 449–95. [Google Scholar] [CrossRef]
- Eberhardt, Markus, and Francis Teal. 2009. A common factor approach to spatial heterogeneity in agricultural productivity analysis. MPRA Paper, 15810. [Google Scholar]
- Egger, Peter, Simon Loretz, Michael Pfaffermayr, and Hannes Winner. 2009. Bilateral Effective Tax Rates and Foreign Direct, Investment. International Tax Public Finance 16: 822–49. [Google Scholar] [CrossRef]
- Elschner, Christina, and Werner Vanborren. 2009. Corporate Effective Tax Rates in an Enlarged European Union. Directorate General Taxation and Customs Union, European Commission, Taxation Papers 14. Brussels: European Commission. [Google Scholar]
- Ercegovac, Dajana, and Emilija Beker Pucar. 2022. The Nexus Between FDI and External Balance in Selected Emerging European Economies—A panel data approach. The Annals of the Faculty of Economics in Subotica 58: 147–64. [Google Scholar] [CrossRef]
- Fernández-Rodríguez, Elena, Roberto García-Fernández, and Antonio Martínez-Arias. 2023. Institutional Determinants of the Effective Tax Rate in G7 and BRIC countries. Economic Systems 47: 101079. [Google Scholar] [CrossRef]
- Gale, G. William, and Andrew A. Samwick. 2014. Effects of Income Tax Changes on Economic Growth. The Brookings Institution. [Google Scholar] [CrossRef]
- Glavaški, Olgica, Emilija Beker Pucar, and Stefan Stojkov. 2022a. Public Revenues and Public Expenditure Nexus: Evidence of Eurozone Heterogeneity. The Annals of the Faculty of Economics in Subotica 58: 083–099. [Google Scholar] [CrossRef]
- Glavaški, Olgica, Emilija Beker Pucar, Marina Beljić, and Stefan Stojkov. 2022b. Coordination vs. Competitiveness of Effective Average Tax Rates in Relation to FDI: The Case of Emerging EU Economies. Sustainability 15: 227. [Google Scholar] [CrossRef]
- Gropp, Reint, and Kristina Kostial. 2000. The Disappearing Tax Base: Is Foreign Direct Investment Eroding Corporate Income Taxes? Working Paper 31. Frankfurt am Main: European Central Bank. [Google Scholar]
- Gunter, Samara, Riera-Crichton Daniel, Carlos A. Vegh, and Guillermo Vuletin. 2021. Non-linear Effects of Tax Changes on Output: The Role of the Initial Level of Taxation. Journal of International Economics 131: 103450. [Google Scholar] [CrossRef]
- Hausman, Jerry A. 1978. Specification Tests in Econometrics. Econometrica 46: 1251–71. [Google Scholar] [CrossRef]
- Im, Kyung So, Hashem M. Pesaran, and Yongcheol Shin. 2003. Testing for Unit Roots in Heterogeneous Panels. Journal of Econometrics 115: 53–74. [Google Scholar] [CrossRef]
- Kostin, Konstantin B., Philippe Runge, and Ronald Adams. 2021. Investment Strategies in Pandemic Situations: An analysis and Comparison of Prospective Returns between Developed and Emerging Markets. Strategic Management 26: 034–052. [Google Scholar] [CrossRef]
- Marques, Mario, Carlos Pinho, and Tania Menezes Montenegro. 2019. The Effect of International Income Shifting on the Link Between Real Investment and Corporate Taxation. Journal of International Accounting, Auditing and Taxation 36: 100268. [Google Scholar] [CrossRef]
- Matthews, Stephen. 2011. Trends in Top Incomes and their Tax Policy Implications. OECD Taxation Working Papers, No. 4. Paris: OECD Publishing. [Google Scholar] [CrossRef]
- Milton, Ayoki. 2017. Estimating the Revenue Impacts of Tax Harmonization. Institute of Policy Research and Analysis, MPRA Paper No. 83548. Available online: https://mpra.ub.uni-muenchen.de/83548/ (accessed on 11 November 2023).
- Mohammadzadeh, Ardashir, Chunwei Zhang, Khalid A. Alattas, Fayez F. M. El-Sousy, and Mai The Vu. 2023. Fourier-Based Type-2 Fuzzy Neural Network: Simple and Effective for High Dimensional Problems. Neurocomputing 547: 126316. [Google Scholar] [CrossRef]
- Moosa, A. Imad, and Ebrahim Merza. 2022. The effect of COVID-19 on Foreign Direct Investment Inflows: Stylized Facts and Some Explanations. Future Business Journal 8: 20. [Google Scholar] [CrossRef]
- OECD. 2008. Tax Effects on Foreign Direct Investment. Paris: Organization for Economic Co-Operation and Development, Policy Brief. Available online: https://www.oecd.org/investment/investment-policy/40152903.pdf (accessed on 11 November 2023).
- Pesaran, Hashem. M. 2006. Estimation and inference in large heterogeneous panels with a multifactor error structure. Econometrica 74: 967–1012. [Google Scholar] [CrossRef]
- Podviezko, Askoldas, Lyudmila Parfenova, and Andrey Pugachev. 2019. Tax Competitiveness of the New EU Member States. Risk Financial Management 12: 34. [Google Scholar] [CrossRef]
- Shin, Yongcheol, Byungchul Yu, and Matthew Greenwood-Nimmo. 2014. Modelling Asymmetric Cointegration and Dynamic Multipliers in a Nonlinear ARDL Framework. Festschrift in Honor of Peter Schmidt, 281–314. [Google Scholar]
- Spengel, Christopher, Frank Schmidt, Jost H. Heckemeyer, Katharina Nicolay, Alexandra Bartholmeß, Christopher Ludwig, Daniela Steinbrenner, Peter Buchmann, Anna Theresa Bührle, Verena Fischer Dutt, and et al. 2019. Effective Tax Levels Using the Devereux/Griffith Methodology, Project for the EU Commission TAXUD/2019/DE/312: Final Report 2019. ZEW-Gutachten und Forschungsberichte. Mannheim: ZEW-Leibniz-Zentrum für Europäische Wirtschaftsforschung. [Google Scholar]
- Stanišić, Nenad. 2008. Do Foreign Direct Investments Increase the Economic Growth of Southeastern European Transition Economies? South-Eastern Europe Journal of Economics 6: 29–38. Available online: http://www.asecu.gr/Seeje/issue10/stanisic.pdf (accessed on 11 November 2023).
- Talpoş, Ioan, and Ionel Vancu. 2009. Corporate Income Taxation Effects on Investment Decisions in the European Union. Annales Universitatis Apulensis Series Oeconomica 1: 513–18. Available online: https://EconPapers.repec.org/RePEc:alu:journl:v:1:y:2009:i:11:p:51 (accessed on 11 November 2023).
- Thanh, Su Dihn, and Nguyen Phuc Canh. 2020. Taxation and Capital Formation: Non-linear Effects and Asymmetry between Developing and Developed countries. The Journal of Economic Asymmetries 22: e00174. [Google Scholar] [CrossRef]
- Todorova, P. Tanya. 2019. Government Budget Balance and Economic Growth. Journal of International Scientific Publications 13: 1689–99. [Google Scholar]
- Van Ganzen, Bastiaan. 2023. Determinants of Top Personal Income Tax Rates in 19 OECD Countries, 1981–2018. Journal of Public Policy 43: 401–26. [Google Scholar] [CrossRef]
Disclaimer/Publisher’s Note: The statements, opinions and data contained in all publications are solely those of the individual author(s) and contributor(s) and not of MDPI and/or the editor(s). MDPI and/or the editor(s) disclaim responsibility for any injury to people or property resulting from any ideas, methods, instructions or products referred to in the content. |
© 2023 by the authors. Licensee MDPI, Basel, Switzerland. This article is an open access article distributed under the terms and conditions of the Creative Commons Attribution (CC BY) license (https://creativecommons.org/licenses/by/4.0/).