1. Introduction
CEOs are responsible for the firm’s operation and performance. To attract, retain, and motivate the CEO of the quality required to improve the firm’s performance, his/her remuneration should be enough (
Zheng 2020). When they are successful in achieving the set targets, they are rewarded in different ways, for instance through bonus payments (e.g.,
Atif et al. 2020). The CEO’s remuneration is viewed as a corporate governance mechanism to encourage the CEO to achieve shareholders’ aims (
Oehmichen et al. 2020). However, particularly after the 2008 financial crisis, there have been some concerns about high CEO remuneration. Nonetheless, this controversy is less evident when remuneration is linked with better financial performance (
Afrifa and Adesina 2018;
Elsayed and Elbardan 2018).
The income of the executives in large corporations has always deserved special attention, namely when the company is involved in a scandal or when a (world) crisis occurs. For example, it is often heard that employees have to be laid off to reduce costs, or fewer dividends will be distributed, but in rare cases, the remuneration of the CEO is reduced (
Sommer 2020). Even during the COVID-19 pandemic, the remuneration of the DAX CEOs decreased negligibly while the net profit of the shareholders decreased by 3.5 billion euros (
Spiegel.de 2021). Due to CEOs’ responsibility, it is expected that they have a higher remuneration than other board members. But is that additional remuneration a real booster of higher performance?
According to managerial hegemony theory, CEOs, in general, have the power to determine their own contracts (
Bebchuk et al. 2002). However, remuneration can be used as a mechanism to improve firms’ performance, not only as compensation for the CEO’s knowledge and effort (tournament theory) (
Connelly et al. 2014), but also as an agency conflicts reduction (
Jensen and Murphy 1990).
Some studies have found that CEO remuneration positively impacts firm performance (
Afrifa and Adesina 2018;
Akter et al. 2020;
Azim et al. 2011;
Elsayed and Elbardan 2018). Agency theory suggests that CEO remuneration is a way to reduce the conflict of interests between the agent and the principals by aligning their interests and reducing CEOs’ opportunistic behaviors (
Jensen and Murphy 1990). When rewarded, the CEO can be motivated to increase his/her efficiency, which can lead to an increase in the firm’s performance (
Doucouliagos et al. 2007). Moreover, tournament theory suggests that when CEOs feel rewarded, they try to be more efficient, which can result in an increase in the firm’s performance (
Connelly et al. 2014). CEO remuneration is defined by the board, which is the body responsible not only for defining the CEO’s compensation, but also for monitoring whether its decisions are in line with the interests of the principal (
Ozdemir and Upneja 2012). The question that arises is whether the definition of this remuneration, which is higher than the average remuneration of the board itself, in fact promotes financial performance.
This paper aims to understand the relationship between additional CEO remuneration and future firm performance. Most studies analyzed the impact of CEO remuneration, but according to the recent trends in CEO compensation, it is suggested that compensation can be an incentive system when there is a pay gap between the CEO and other executives (
Ullah et al. 2022). In this way, it is intended to analyze if the higher remuneration of the CEO, compared with the mean remuneration of other board members, is a driver of firms’ financial performance. Moreover, we not only analyze the additional total remuneration, but we split it into its components: salary, bonus, grants, and pension. The impact of remuneration on a firm’s performance can be singular, depending on the type of remuneration, as suggested by previous researchers (e.g.,
Azim et al. 2011;
Banker et al. 2013;
Smirnova and Zavertiaeva 2017), and the CEO can have a different remuneration package when compared with the board. An unbalanced panel data of listed firms in DAX from 2006 to 2019 is analyzed. Financial performance is measured using two alternative perspectives, one accounting-based measurement (ROA—return on assets) and one market-based measurement (Tobin’s Q) (
Sharma and Carney 2012).
This study makes several contributions to the literature and to the practice. First, to the best of our knowledge, it is the first study that focuses on the impact of additional remuneration on future performance. We focus on additional remuneration instead of on remuneration, as most works do. Tournament theory suggests that a person works harder when he/she can win the highest remuneration as a premium. Therefore, we analyze if CEO efficiency, and in turn the firm’s performance, increases when the additional remuneration over the average value of the board of directors is higher. Some works, such as
Balafas and Florackis (
2014) and
Zheng (
2020), have analyzed CEO abnormal remuneration, comparing firms from the same industry and size or estimating it through a model, although each firm has a specific strategy and remuneration can be different even for firms operating in the same industry. Therefore, we focus on the additional remuneration of the CEO compared with the other board members to understand the motivational effect. Furthermore, we believe that the motivational effect of additional remuneration is not immediate (contrary to what most studies consider). In this way, the analysis is conducted with the additional remuneration lagged by one year, following
Balafas and Florackis (
2014). Moreover, there is no consensus about the impact of remuneration on firm performance; it remains a controversial issue, so studying this theme is still relevant to contributing to its debate and explanation. The current literature has essentially been carried out in the United Kingdom, Bangladesh, Australia, and the USA (e.g.,
Afrifa and Adesina 2018;
Aslam et al. 2019,
Azim et al. 2011,
Banker et al. 2013). By analyzing German listed firms, we are expanding the literature review. We chose Germany since listed firms are obligated to publish information about each executive’s remuneration, and the CEO is controlled by the supervisory board, contrary to firms from the USA (
Beck et al. 2020). Finally, our model includes remuneration components, as well as control variables from the group of firms’ financial characteristics, corporate governance, and macroeconomic factors to explain performance, allowing for a better understanding of firm performance.
The remaining paper is organized as follows. After the introduction,
Section 2 provides a literature review of the topic and presents the research hypotheses. The research methods, namely the model and sample, are explained in
Section 3, followed by the empirical results. The main conclusions are drawn in the last section.
2. Literature Review
The relationship between remuneration and performance has been addressed in the literature and it is usually explained based on different theoretical supports: (i) agency theory; (ii) the managerial hegemony perspective; (iii) tournament theory; and (iv) stewardship theory.
Agency theory states that the separation between ownership and control may cause conflicts of interest. CEOs have more information about the company and can use it to satisfy personal objectives, expropriating the firm’s wealth (
Jensen and Meckling 1976). One way to overcome these conflicts is through increased monitoring of CEOs’ decisions (
Fama and Jensen 1983). Another way is by increasing the CEO’s remuneration (
Jensen and Murphy 1990). When certain targets of firm performance are achieved, CEOs will be compensated, so they have the additional incentive to increase performance to earn more money. This theory suggests a positive connection between compensation and firm performance when perfect contracts are established (
Azim et al. 2011).
The managerial hegemony perspective suggests that the CEO has enough power to influence their own remuneration package. Therefore, incentives may not be linked with higher performance (
Bebchuk et al. 2002).
Tournament theory does not focus on the link between compensation and performance but wants to justify high CEO remuneration. Tournament theory suggests that CEOs are more motivated to increase performance when they need to work harder and remuneration depends on the firm’s performance, rather than on absolute levels of output (
Connelly et al. 2014). This suggests that to promote an increase in the CEO’s efficiency and the firm’s performance, his/her remuneration should also increase, i.e., remuneration should be aligned with firm performance.
Finally, stewardship theory has a different perspective on CEOs’ behavior. This theory argues that CEOs are professional and want to do their best on the job without the need for an inner motivation (
Donaldson and Davis 1991). This theory does not defend the financial or personal motivations of CEOs (
Afrifa and Adesina 2018). Therefore, the firm’s performance depends on how CEOs can effectively decide. Based on this theory, CEOs do not need superior remuneration, but instead, they need a structure that helps them to effectively make the best decisions to increase the firm’s performance.
Based on the previous theories, when the CEO is motivated to perform at their best with financial incentives, the incentives between the CEO and the principals are aligned, and agency problems are reduced. Moreover, the CEO tends to employ his/her skills to achieve the firm’s goals, which in turn has a positive effect on remuneration and performance (
Jensen and Murphy 1990;
Connelly et al. 2014). From this perspective, the agents’ motivation is mainly financial, to satisfy self-interests, contrary to the suggestion by stewardship theory that CEOs draw intrinsic satisfaction from doing a job well. Although this may happen only when a CEO feels that his/her work is being valued, following tournament theory, it means that this may occur when there is a remuneration gap that justifies the CEO to increase his/her work effort (
Lin and Lu 2009).
Previous researchers have not found a unique impact of CEO remuneration on firm performance.
Akter et al. (
2020) found that higher remuneration is not enough to increase the firm’s performance. Focusing on textile companies listed on the stock exchange in Bangladesh (Dhake Stock Exchange), they found a significant negative link between the two dependent variables, ROA and ROE (return on equity), and the total compensation, which can be explained due to the illiquid capital market in Bangladesh and the lack of share-based remuneration.
Banker et al. (
2013), analyzing US firms from 1993 to 2006, found the opposite effect: salary and total remuneration are positively related to ROE. Similar conclusions were found by
Chen and Huang (
2010), who also analyze firms from the USA.
Smirnova and Zavertiaeva (
2017), analyzing listed firms from Great Britain, Germany, France, Switzerland, Italy, Spain, and the Netherlands from 2009 to 2013, found that total remuneration positively impacts ROA and bonus remuneration positively impacts the Sharpe index.
Elsayed and Elbardan (
2018), analyzing FTSE 350 firms (UK) over the period from 2010 to 2014, also found a positive impact of CEO remuneration on firm performance.
Other authors found mixed results, depending on the type of remuneration and firm performance measure.
Azim et al. (
2011), when analyzing listed firms from Australia during the years 2007–2008, found a negative impact on CEO salary and the accounting variable ROI (return on investment), but a positive impact on other remunerations, mainly bonuses and options and the market-based performance measure EPS (earnings per share). Also,
Aslam et al. (
2019), when analyzing listed firms in Pakistan from 2009 to 2016, found that cash-based remuneration negatively impacts Tobin’s Q and EPS, but non-cash compensation is positively related to firms’ performance.
Nonetheless,
Afrifa and Adesina (
2018) found evidence of a non-linear relationship between performance and remuneration. Higher remuneration leads to an increase in firm performance only to a certain point. After the breakpoint is reached, an increase in remuneration reduces the performance of the company. It was a new approach that the authors followed, as previous studies mostly assumed a linear relationship.
Our study does not focus on remuneration, but on additional CEO remuneration compared with the mean of the board remuneration (remuneration gap). The analysis differs from the approach of
Balafas and Florackis (
2014), who analyzed abnormal CEO remuneration compared to companies in the same sector. We also differ from
Zheng (
2020), who estimates the difference between the remuneration provided and the expected remuneration considering a set of characteristics. The intention is to verify whether the board, by setting a remuneration (and the respective components) above the average of those who have the role of setting and monitoring the CEO, causes a motivating effect and is reflected in a superior financial performance. This is because, in accordance with tournament theory, a large compensation gap may be a company performance promotor (
Wang et al. 2021). When the gap pay scheme is structured in a way that encourages competition, this may lead to a greater effort to improve performance to justify this difference. Additionally, as a motivating driver (
Ullah et al. 2022) and in line with
Balafas and Florackis (
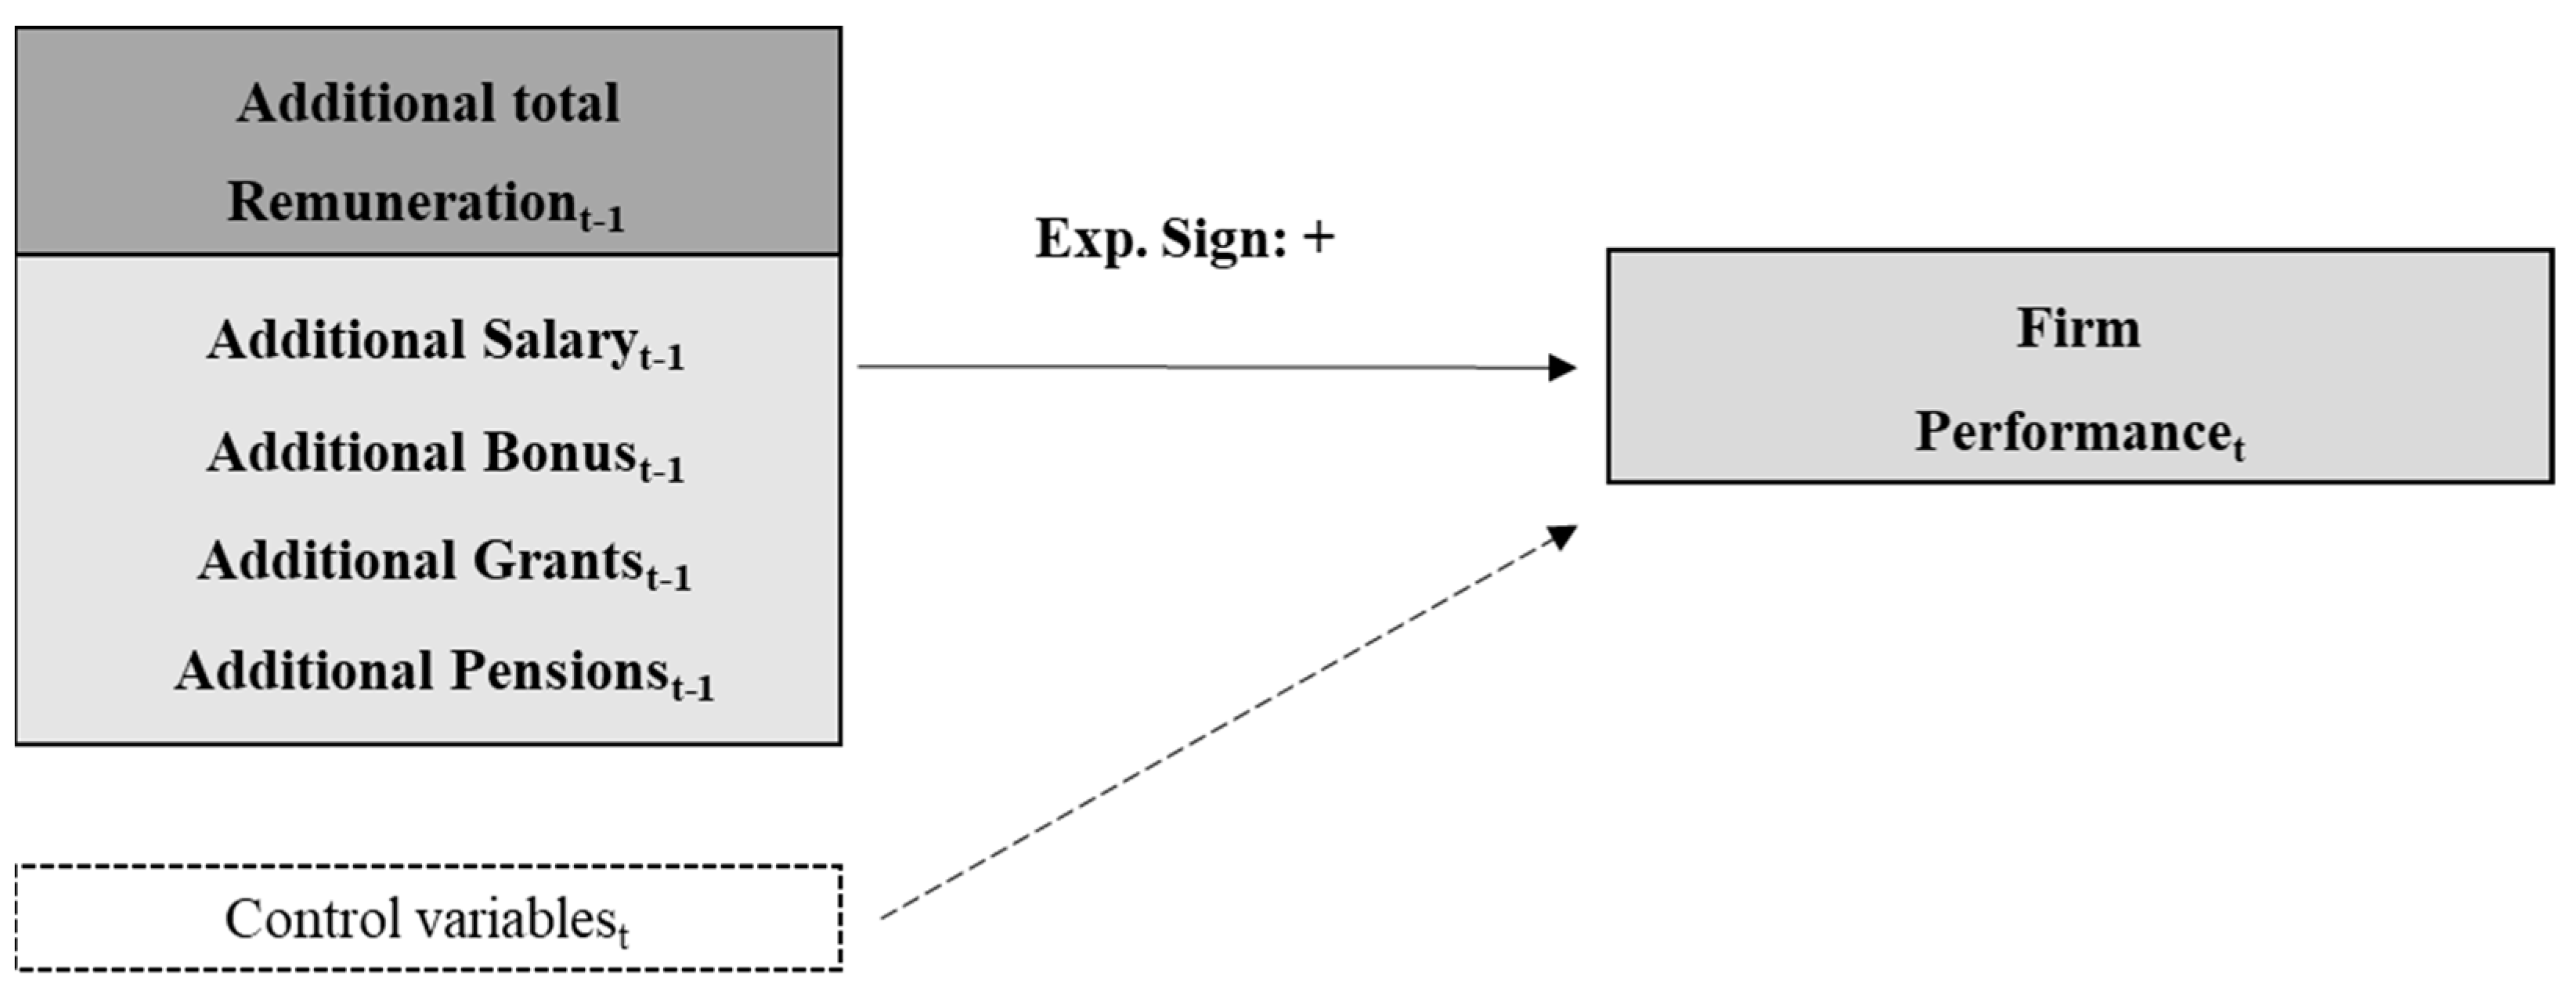
2014), it is believed that the effect does not have immediate repercussions. Therefore, considering the literature above, it is expected that an increase in CEO additional remuneration in the previous year leads to higher levels of current financial performance. Thus, the following hypothesis is established:
Hypothesis 1. There is a positive impact of the CEO’s additional remuneration from the previous year on the current firm’s performance.
Moreover, as shown before, the type of remuneration can cause a singular impact on firms’ performance. Total remuneration can be divided into different components, such as the base salary, bonus, grants, pension, and other benefits (
Smirnova and Zavertiaeva 2017). Regarding the base salary, it is a remuneration component that is contractually fixed. Bonuses, on another side, are a variable remuneration component that can incentivize the CEO to achieve the firm’s targets (
Atif et al. 2020). Therefore, the bonus component is the main driver for a significant pay-performance relationship, and it may drive the inner motivation of the CEO (
Smirnova and Zavertiaeva 2017). Moreover, firms sometimes pay grants, pension benefits, and/or offer one-time payments as a premium for managers’ efforts. According to
Beck et al. (
2020), all firms listed in DAX use a base salary to pay executives. Most of them use a variable short-term component (90% in 2018), and several use stock options (70%) and pensions (80%).
Considering tournament theory, better-paid executives tend to achieve more improvements in firm performance and reduce agency conflicts. Hence, we also analyze the impact of each type of remuneration on firms’ performance. Based on the literature review and the hypothesis mentioned above, the proposed conceptual research model is as follows (
Figure 1):
4. Results
Figure 2 shows the evolution of the mean value of the additional remuneration per type and year.
Handschumacher-Knors (
2022) found that the higher component of remuneration of the board members of German listed firms is the variable component bonus. Analyzing
Figure 2, we see that CEOs receive, on average, higher remuneration, especially the component bonus, compared with other board members. Moreover, additional remuneration (mainly in terms of bonuses) decreased from 2007 to 2009, the years of the international financial crisis of 2007/2008 (with the peak in 2018).
Table 1 provides the main descriptive statistics, namely the mean, median, standard variation, minimum, and maximum of the variables used.
Firm performance (ROA and TQ) is, in mean, positive, suggesting the firm’s ability to generate earnings (ROA—mean value 6.1%) and a positive investor perception about the firm’s value compared to its book value (TQ—mean value 1.4). However, both measures present a high range, meaning that not all firms perform in the same way, especially regarding the TQ measure, which varies from undervalued firms (minimum value −24.8) to overvalued (maximum value 12.1).
Regarding the additional remuneration (DSalary, DBonus, DGrants, DPension, DTotal), the mean values are positive, which means that CEOs earn more than the average remuneration of the board members in all components. In contrast, for pensions some firms pay less to CEOs compared to other board members (the minimum value is negative). This fact shows the relevance of analyzing not only the total remuneration but also each component, as the compensation package of the CEO can be singular compared to the other board members. Moreover, the remuneration descriptive statistics corroborate the analysis performed in
Figure 2.
Concerning control variables, size, measured as the natural logarithm of total assets, has a mean of 17.9, while age, measured as the natural logarithm of age, is on average 4.1. Assets turnover is 0.65 on average, and sales growth is positive, suggesting that the firms in the sample present growth opportunities. On average, 24% of the firm’s assets are financed through debt, meaning that the business is mainly operated by equity. The board size, measured as the natural logarithm of board members, is on average 1.9, and the board remains active for around 8.5 years. GDP growth is on average positive over the period analyzed, as is the inflation rate, suggesting that the German economy grew from 2006 until 2019.
Table 2 displays the correlation matrix among the variables as well as the VIF (variance inflation factor) analysis.
ROA and TQ are positively correlated, which is expected since they are both performance measures, albeit from different perspectives. Moreover, all types of additional remuneration considered are positively related to TQ, but only the additional bonus is positively correlated with ROA, which suggests that additional remuneration impacts firms’ performance. For additional total remuneration, the correlation with performance measures is not statistically significant, which calls for the need to explore different types of remuneration instead of total remuneration. The control variables are not always statistically correlated to both performance measures, suggesting that the way performance is evaluated (accounting- or market-based) caused an impact on the results. Moreover, none of the variables are highly correlated, nor have high VIF values (variance inflation factor).
Table 3 and
Table 4 show the results obtained with the application of Equation (1) for the different types of remuneration and performance (ROA and Tobin’s Q).
Analyzing the results presented in
Table 3 and
Table 4, the Sargan test presents
p-values greater than 5%, showing that the instruments are valid; the Wald test has a
p-value of less than 5%, meaning that the joint significance and the coefficients are significantly distributed; and the AR(2) reveals that there is no second-order correlation problem in the model.
Over time, firms maintain similar performance, which means that the ROA and TQ performances of the previous year (ROA
t−1 and TQ
t−1) explain current performances (ROAt and TQt), as is proposed by
Aslam et al. (
2019) and
Banker et al. (
2013).
Moreover, the fact that additional salary, grants, and total remuneration lagged one year positively explains firm performance measured by ROA, while when it is measured by TQ, all additional remuneration components, as well as total additional remuneration, are statistically and positively significant. The results suggest that an increase in CEO remuneration over the mean value of the board’s remuneration contributes to increasing the firm’s performance. This result corroborates Hypothesis 1 and is in line with tournament theory. The CEO is more motivated to increase performance when there is more competition, and he/she feels that his/her hard work is compensated.
Banker et al. (
2013),
Chen and Huang (
2010),
Smirnova and Zavertiaeva (
2017), and
Elsayed and Elbardan (
2018), among others, found that an increase in CEO remuneration increases firm performance. Here we go a step further by showing that when remuneration is higher than the average remuneration of the board members, the firm performance increases, so remuneration is not only an incentive to monitor managers, as suggested by agency theory, but it is also a motivation to increase the CEO’s efficiency.
1 The difference between the two measures of performance relates to bonus and pension, two performance-related elements of remuneration (
Zheng 2020). Therefore, our results suggest that these components of remuneration do not contribute to increasing the firm’s earnings, and in turn return on assets, while they do impact the market-to-book value.
Regarding the control variables, the firm’s size is not always statistically significant, but when it is, it has a positive impact on the firm’s performance (measured by both ROA and TQ). The results suggest that large-size firms have better performances because these firms are usually more diversified, can benefit from economies of scale, and because a larger size can reduce uncertainties which can damage the firm’s performance. Similar results were found by
Afrifa and Adesina (
2018) and
Aslam et al. (
2019). Older firms have more knowledge about the market and more experience, and so show better performance. Our results corroborate those of
Afrifa and Adesina (
2018) and
Aslam et al. (
2019). More efficient firms with greater asset turnover show better performance since these firms are more efficient in generating revenue and it positively impacts the firm’s earnings, returns, and value.
Akter et al. (
2020) also found a positive impact of asset turnover on ROA. Companies with the highest growth exhibit higher performance. When annual sales increase, firms can increase their market share and its earnings, returns, and values. This result is in line with that of
Smirnova and Zavertiaeva (
2017). The firm’s leverage is not always relevant to explain the firm’s performance, but when it is statistically significant, it causes a positive impact on firm performance. Debt is an external mechanism to monitor CEOs’ opportunistic behaviors, so it can enhance performance by aligning interests between the principal and CEOs. Even if on one side more leveraged firms have more financial costs which decrease the firm profits, its positive effect is more prominent in this sample.
Concerning the board size, it is only relevant to explain performance when it is measured by TQ. Larger boards can attract more resources and are more efficient in controlling CEOs’ opportunistic behaviors, which leads to better performance. The board time positively influences ROA, suggesting that the higher the number of years the board has been active, the greater their experience, which leads to an increase in ROA.
Finally, the macroeconomic variables GDP growth and inflation rate positively impact firm performance. In moments of economic development, firms can increase their activity and performance. Even if prices increase, which can cause a negative impact on sales, as the economy is growing, the firm’s activity also increases, contributing to an increase in firms’ return and value.
5. Conclusions
This paper aimed to understand the impact of CEO additional remuneration on firm performance. Previous works found that remuneration impacts performance as it is an incentive to control CEOs’ opportunism and reduce agency problems. Based on tournament theory, this study attempted to analyze if the difference between CEO remuneration and the mean of the board members’ remuneration can be a performance driver. We wanted to analyze if the higher CEO remunerations (and their components) are justified by their follow-up with higher levels of performance, i.e., whether the wage gap has a motivating effect and allows for increased performance.
Based on secondary data from 2006 to 2019 from companies listed in Germany, our results prove that the additional variables of remuneration contribute to increasing the firm’s financial performance. Even if CEO remuneration is a controversial issue, our results show that a higher remuneration gap contributes to maximizing the firm’s value and thus that CEOs are being compensated for their effort. This result is consistent with all remuneration components and analyzing performance from a historical perspective (accounting measure ROA) and a forecast perspective (market measure TQ). Moreover, our work shows that performance-related remuneration components (bonus and pension) impact the forecast perspective of financial performance, but not the historical perspective (ROA). Firms’ performance also increases with firm size, age, asset turnover, growth, debt, board size, board time, and macroeconomic factors.
This study contributes to the literature in several ways. First, it is the first work, as far as we are aware, that analyzes the impact of additional remuneration on firm performance. Therefore, it contributes to enriching the themes of remuneration and performance. Studies that analyze the impact of remuneration on firm performance do not achieve a consensus. We approached this theme in a different way, i.e., we analyzed if the remuneration gap is justifiable with a performance increase. Moreover, not only the total remuneration was analyzed but also its components, and two perspectives of performance were taken into account, allowing an overall picture of the relationship between remuneration and financial performance. Finally, there are few studies that focus on the impact of remuneration on performance, so this work expands the literature review.
Results are also relevant to practice. CEOs can justify their high remuneration as a motivational effect, investors can understand the impact of higher CEO remuneration on firm performance, and shareholders can comprehend how they can reduce the conflicts of interest between CEOs and the principal and the benefits of establishing perfect remuneration contracts. Creditors and other stakeholders can understand which factors contribute to increasing firms’ performance.
For future work, this analysis can be expanded to other companies and countries. Our results are specific to the largest firms in Germany and cannot be extrapolated to other firms. Moreover, even if we have tested a non-linear relationship between remuneration and performance and did not find any relevant conclusion, analyzing other samples or sample periods could be useful, as after a time CEOs may not feel motivated to continue to increase the firm performance even if remuneration also increases. Tournament theory suggests that CEOs are only incentivized to increase performance until ‘winning the tournament’. Industry effects of macroeconomic impacts such as the financial crisis of 2007/2008 or the COVID-19 can have an impact on results and can also be included in the analysis to verify if they cause some impact. Finally, other corporate governance variables, such as gender diversity, can also explain performance. Some works found that female presence on the board, as an executive or other board member, impacts the firm’s risk, capital structure, and other factors. Moreover,
Handschumacher-Knors (
2022) found that women who are board members of German listed companies receive, on average, lower compensation than men, but are still underrepresented on the boards. Therefore, the female additional remuneration gap impact on firm performance should also be addressed.


