Abstract
Corporate indebtedness is a powerful tool in determining a company’s financial health with impacts on its image and reputation. The main objective of this research is to study the determining factors in corporate indebtedness in Portugal. It also has the secondary objectives of creating clusters of companies’ behaviour in relation to the use of credit and verifying their differences in relation to the characteristics of the companies. It uses a quantitative methodology based on a questionnaire survey of 1957 Portuguese companies. The results of the factor analysis show the formation of six determining factors in corporate indebtedness, namely the negotiating relationship with banks, financing, cycle and indebtedness, company operating performance, guarantees used to obtain bank financing and financing risk analysis as well as secondary forms of bank financing. The application of cluster analysis to the six factors formed led to the classification of companies into three clusters: the resilient financial cluster, the operational excellence cluster and the strategic financial cluster. There are several statistically significant differences in the corporate financing factors in relation to the clusters to which they belong. The evidence of the factors and clusters explaining company financing provides insights for improving credit access practices and for implementing public policies that facilitate access to credit and promote economic development.
1. Introduction
Financial ratios are strong indicators of a company’s likelihood of bankruptcy (Magnanelli and Izzo 2017). According to Pacheco et al. (2019), the ratios that demonstrate the greatest predictive power of bankruptcy are indebtedness, solvency, return on equity, return on assets, financial autonomy and the ratios Working Capital/Total Assets; EBIT/Total Assets and Turnover/Total Assets. In addition to the financial variables, the authors refer to two non-financial variables, namely exports and the number of employees, which are negatively related to company bankruptcy in the construction sector in Portugal. This indicates that companies in this sector with a greater presence abroad are less likely to go bankrupt, as is the size effect.
For Tavares et al. (2021) and Santos et al. (2022), image risks are linked to the company’s reputation, which it transfers abroad. On the other hand, these authors consider that financial risks are associated with the economic and financial capacity of companies and the way they carry out their business, an idea corroborated by Almeida (2023). Financial risks are distinguished between short-term and medium- and long-term risks. In the short term, the importance of liquidity is emphasised in order for companies to maintain a positive and balanced net cash position. In the medium and long term, there is a focus on solvency, which reduces the likelihood of bankruptcy (Santos et al. 2022). According to Tavares et al. (2021), strategic planning is essential for companies, as they need to have a clear vision of the economic, social and political changes that are taking place in the ecosystem in which they operate.
Many family businesses survive over generations when management is professionalised and there is a separation between ownership and control of the company, which increases the company’s chances of growth (Santos et al. 2022). The perception of operational risk positively influences the perception of financial risk in family businesses. In a family business, its longevity leads to the consolidation of the link between the company name and the family name (Tavares et al. 2015; Santos et al. 2022).
The aspects that are most evident in the perception of risk management planning are having a management plan that includes the relationship with customers, suppliers and employees (medium and long term) and also an up-to-date security plan (Tavares et al. 2023). There are statistically significant differences in risk management planning, with the larger the organisation, the greater the importance given to risk management planning (Forti et al. 2011).
Authors such as Mutamimah et al. (2021), Zhang et al. (2022), and Ogunmokun et al. (2024) argue that the provision of credit to companies is based on the analysis of corporate information to assess repayment capacity. However, the information asymmetry between banks and companies poses a challenge, making credit risk a critical concern. These same authors point to the relationship between banks and companies as one of the factors reducing information asymmetry, creating better conditions for companies to obtain credit.
Bhatia and Kumar (2023) investigated the relationship between the debt efficiency, operational efficiency and performance of Indian companies in the period between 2013 and 2019. The authors found evidence through a GLS regression model of a positive association between operational efficiency and business performance, as well as the cost of capital. They highlighted operational efficiency as a relevant factor in corporate financial performance and debt acquisition, and these findings are supported by Aziz and Abbas (2019), Boshnak (2023), and Ye et al. (2023).
The main objective of this work is to study the determining factors in corporate indebtedness in Portugal. Its secondary objectives are to create clusters of companies’ behaviour in relation to the use of credit and to verify their differences in relation to the characteristics of the companies. The present study represents a significant advancement in the investigation of financing for Portuguese SMEs, notable for its originality in employing cluster analysis. By addressing existing gaps in the literature concerning this market, it provides a broader and more detailed perspective on SME financing dynamics, contributing to a more robust and informed knowledge base in this field of the Portuguese economy. In order to achieve the proposed objectives, this work is divided into five sections. In addition to this introduction, the next section reviews the literature. Then, the methodology is presented, and in the fourth section, the results are presented and discussed. Finally, the conclusions are presented.
2. Literature Review
2.1. Corporate Reputation and the Business Relationship with Banks
For Mehtap and Kokalan (2013), corporate reputation is an increasingly emphasised issue in management and organisational studies and is considered a very valuable intangible asset that is determined by the evaluations and perceptions of the parties. Thus, according to the authors, different groups and stakeholders can perceive a company’s reputation from different points of view and different perspectives.
Companies whose boards are larger become less effective because problems and parasitism arise and decisions are more difficult to make in a timely manner (O’Sullivan et al. 2016). But, on the other hand, with a larger board it is easier to detect the sometimes opportunistic behaviour of managers. However, too many directors and managers become difficult to control and will jeopardise performance (Forti et al. 2011). The presence of women on boards of directors reduces debt costs and perceptions of default risk by fund providers, while board independence and board size do not have a significant impact on debt costs (Aksoy and Yilmaz 2023). The results indicate that corporate social responsibility reporting has a positive association with debt access and a negative association with its cost of debt (Uyar et al. 2024).
2.2. Financing, Growth Cycle and Indebtedness
According to Rodrigues et al. (2018), earnings before interest on taxes (EBIT) are not relevant to indebtedness, but they are relevant to investment. For the authors, the same can be said for return on equity (ROE). However, the tangibility of the asset, the cost of debt and the value of the asset are relevant when it comes to debt. Rosa et al. (2018) assessed the impact of corporate social performance (CSP) on the cost of debt capital and leverage. The authors found that the level of corporate social performance significantly affects the cost of debt capital and leverage in times of stability, because in times of crisis, companies are expected to focus their efforts on maintaining profitability and the manifestation of corporate social responsibility is generally understood by creditors as a strategy that companies adopt to hide negative performance. According to Rodrigues et al. (2018), the tangibility of assets is important for accessing debt. The cost of debt (interest payable) restricts access to debt. According to Rosa et al. (2018), the higher the social performance, the better they are able to grow, in their opinion, because they disclose more information about future strategies. Creating a more transparent and cooperative corporate culture reduces suspicions of opportunistic behaviour, creates trust between stakeholders and promotes involvement, thereby reducing information asymmetries, agency costs and capital restrictions. The relationship between the cost of debt and indebtedness naturally involves the company’s ability to pay. Although companies always seek the best composition of the capital structure, their freedom to achieve an optimal capital structure faces problems due to the set of restrictions that characterise imperfect capital markets (Rodrigues et al. 2018).
Rosa et al. (2018) observed that companies with higher CSP not only have a stronger corporate image but also create expectations of better ongoing financial performance and lower exposure to risk. In times of economic stability, lenders tend to perceive CSP as a strategic project and companies that adopt this approach can obtain loans at lower interest rates. According to Lemma (2015), high levels of perceived corruption lead companies to use higher levels of perceived corruption lead companies to use higher levels of short-term leverage, lower levels of long-term leverage and debt with shorter maturities.
For Ghouma et al. (2018), a stronger board of directors (in terms of composition and structure) ensures greater protection of investors’ rights and therefore reduces agency problems within the company. These reduced agency problems within the company represent an important aspect that allows companies to enjoy a lower cost of debt financing. Lower information asymmetry, through the company’s disclosure policy, also explains the negative relationship between the cost of debt and the quality of corporate governance (Tavares et al. 2023). Rosa et al. (2018) also found a positive correlation between company size and corporate social performance and that the impact of corporate social performance on the cost of debt capital is more significant for small companies. The authors understand that lenders perceive that small companies are generally less inclined to intervene in corporate social performance due to budgetary constraints, so they are more willing to finance small companies when they decide to engage in corporate social performance.
Magnanelli and Izzo (2017) conclude that there is a positive relationship between corporate social performance and the cost of debt, demonstrating that corporate social responsibility is a value factor with an impact on the company’s risk profile. Companies in countries with higher levels of perceived leverage in terms of corruption respond to the weaknesses of enforcement institutions through greater concentration of ownership and greater participation in the control block (Chai et al. 2019). Corruption makes law enforcement institutions ineffective and therefore distorts corporate governance (Lemma 2015).
Magnanelli and Izzo (2017) recommend publishing and disseminating non-financial information about the company, as this strengthens relations between key stakeholders and can stabilise the market. The effective implementation of corporate social responsibility activities has an effect on risk reduction (Pacheco et al. 2019; Tavares et al. 2021). Magnanelli and Izzo (2017) conclude that the higher the risk of companies, the higher the cost applied by banks, and the better the reputation for responsibility or performance of companies, the lower the risk and consequently the cost of debt financing.
2.3. Company Operating Performance
According to Forti et al. (2011), performance measured by return on assets (ROA) and market value assessed by the market-to-book ratio are positively affected by companies’ cash retention. They also consider, with regard to the relationship between cash management and business performance, that effective cash management is an important contribution to maximising operating profit. In this way, companies that adopt efficient cash management that is consistent with a contemporary view of the subject have a better chance of prospering in today’s competitive environment.
According to Soares et al. (2012), companies’ financial statements and public information can be used to determine the credit ratings of Brazilian companies with reasonable accuracy. According to the authors, an increase in the generation of operating income over total financial expenses reduces credit risk and increases the credit rating.
The characteristics of loans to small- and medium-sized enterprises (size of the loan, length of the loan, information required that is not always complete) require concern on the part of financial institutions in order to assess their creditworthiness (Chai et al. 2019). Thus, because of the asymmetric information and nature of loans to companies, it is very difficult for financial institutions to accurately assess their credit risk, and restricted access to finance hinders the development of companies.
Yazdanfar and Öhman (2015) confirm that debt ratios in terms of trade credit, short-term debt and long-term debt negatively affect the performance of companies in terms of profitability. On the other hand, a high debt ratio increases agency costs and the risk of losing control of the company, owners and managers of small and medium enterprises (SMEs), which tend to finance their businesses with equity to a fairly high degree, according to Rosa et al. (2018). Chai et al. (2019) believe that due to the very different nature of the various sectors and the great variation in the size and terms of loans between the different sectors, it is not appropriate to assess credit risk for all companies using the same credit rating system. These authors have shown that for small companies, non-financial factors are more influential in predicting default risks than financial factors.
Yazdanfar and Öhman (2015) confirmed that profitable SMEs tend to use equity and retained earnings more than external financing. They also found that SMEs use short-term debt more than medium- and long-term debt, which can reduce costs related to information asymmetry and agency conflicts. The lower the level of leverage, the lower the agency costs of external investments, the lower the debt and the higher the company’s profitability (Rosa et al. 2018). According to Yazdanfar and Öhman (2015), there is a negative relationship between age and profitability, which can be explained by the life cycle theory.
Ugwueze et al. (2019) point out that in the presence of asymmetric information, a company is financed more by internally generated funds than by external funds. The authors conclude that long-term debt and retained earnings are not statistically significant in turnover, unlike short-term debt. To reduce information asymmetry and moral hazards between SMEs and financial institutions such as banks, SME owners and managers should also be aware of the importance of transfer measures that can improve their relationship with financial institutions in the business environment (Yazdanfar and Öhman 2015). According to Amarna et al. (2024), in a study conducted on European companies, investors negatively value Environmental Social Governance disclosure, leading to an increase in the cost of equity capital, while creditors positively value it, resulting in a reduction in the cost of debt.
2.4. Guarantees Used to Obtain Bank Financing
The deficiency in the process of analysing companies’ credit leads to the existence of non-performing loans (Manuel et al. 2018). According to Jucá et al. (2016), the higher the levels of assets that can be used as collateral, the higher the level of financial leverage; the higher the level of non-current assets (fixed assets), the higher the maturity of the debts; the higher the level of current assets (stocks and accounts receivable), the lower the maturity of the debts and the assets that can be used as collateral are more relevant for companies that contract bank debts. Thus, the authors conclude that assets that can be used as collateral are of fundamental importance in contracting long-term debt, while stocks and receivables are more geared towards making short-term debt viable. These assets are more relevant for companies that do not have access to the capital markets, i.e., that rely on bank debt (Tavares et al. 2015). Sometimes some investment projects do not meet the necessary conditions for approval, but when it comes to projects linked to state initiatives, public banks are called upon to support them (Manuel et al. 2018). In their study, Ogunmokun et al. (2024) found that during periods of economic restructuring, the lack of government intervention and the presence of banks have a negative and significant impact on loans to small businesses.
Ono and Uesugi (2009) consider that the use of collateral is complementary to relationship-based financing and point out that collateral plays an important role in facilitating the relationship between borrowers and lenders. In this way, they understand that banks whose claims are backed by collateral monitor more intensively, and that borrowers who have a long-term relationship with their main banks are more likely to offer collateral. Unlike collateral, personal guarantees have a weaker complementarity with relationship-based financing (Manuel et al. 2018). For Calcagnini et al. (2014) the presence of guarantees, mainly collateral, affects the cost of credit for Italian companies, systematically reducing interest rates on loans. Guarantees are a more powerful instrument for riskier borrowers than for safer ones (Jucá et al. 2016).
Ono and Uesugi (2009) found that personal guarantees are more often required of smaller, more owner-orientated companies, with the aim of limiting the risk of mixing the personal assets of business representatives. According to Calcagnini et al. (2014), the likelihood of secured loans increases with the company’s higher risk perception and during economic crises. Thus, the probability of posting guarantees is lower the longer the relationship between banks and clients and the greater the number of banks for each company.
Ono and Uesugi (2009) found that the use of collateral was more likely to be associated with the more frequent submission of relevant documents and a longer-term relationship with the bank. For Mayordomo et al. (2021), the use of personal guarantees and collateral by a major Spanish banking group and its subsidiaries increased to improve the credit risk of loans and meet regulatory capital requirements. Personal guarantees were required more often than collateral, especially in subsidiaries with lower capital ratios (Ugwueze et al. 2019). Mayordomo et al. (2021) documented that subsidiaries with lower capital ratios significantly increased the use of personal guarantees after the changes in the collateral policy, highlighting the importance of these changes for the financial institution as a whole and for each of the subsidiaries. On the other hand, Calcagnini et al. (2014) found that during the financial crisis, guarantees helped banks to improve their screening of companies, which resulted in lower interest rates for guaranteed loans. Interest rate variability is higher among larger banks (Manuel et al. 2018).
2.5. Analysing Financing Risk
Tavares et al. (2015) analysed the forms of financing and products most used by SMEs in the Porto district of Portugal. In their study, they found that the most commonly used sources of finance are bank credit, self-financing and, to a lesser extent, European Union funds. As for the importance given to the products used by companies, they concluded that the most important products identified by companies are bank current accounts, medium- and long-term loans, leasing and/or renting, financing of foreign operations, bank guarantees and short-term loans, among other things.
There are signs that better governance practices reduce credit constraints for companies, i.e., companies that adopt better governance practices have greater access to resources in the financial market (Cicogna et al. 2007). The continuous innovation of financial products is a general reality in the financial services industry and is important for maintaining competitiveness (Li and Li 2021). Van Osnabrugge (2000) concludes that venture capitalists are very concerned about exiting their investments in the future and also have higher expected and partially realised rates of return on their venture investments than business angel investors. With regard to the relevance of guarantees for obtaining financing, Tavares et al. (2015) found that the most commonly used guarantees are: the promissory note subscribed by the company with a personal guarantee, the promissory note subscribed by the company, the mutual guarantee, the mortgage guarantee and the pledge of securities.
2.6. Secondary Forms of Bank Financing
Gonçalves et al. (2018), in a study carried out in Brazil, found that self-financing, followed by indebtedness, is the most-used primary source of financing. According to Myers and Majluf (1984), financing begins with the use of equity, followed by external financing through the issue of debt and finally the issue of shares. This hierarchy is justified by the fact that internally generated resources (retained earnings) have no transaction costs for the company to finance itself.
Increased credit risk reduces bank profits (Manuel et al. 2018). Managers should therefore pay more attention to the role of cost efficiency and risk-taking (Belkhaoui et al. 2020).
According to Mura and Buleca (2012), in order to secure investment projects and increase performance, the company needs to finance its own activity. If the company does not have sufficient sources of its own, it will try to obtain it from external sources (Santos et al. 2022).
3. Methodology
3.1. Characterisation of the Population and Sample
The target population for this study is Portuguese companies with a turnover of more than EUR 500,000.00, whose emails were obtained from the SABI database (Iberian Balance Sheet Analysis System). The sampling method used was non-probabilistic for convenience, as only companies included in this database were used. It should be noted that although the sampling method is not probabilistic, all companies that received the invitation by email have the same probability of responding to the questionnaire. The study population comprises Portuguese companies with sales volumes exceeding EUR 500,000.00 in the year 2021, totalling approximately 60,000 companies, from which 1957 valid responses were obtained.
The sample consists of 1957 Portuguese companies that responded to the questionnaire. Regarding the characterisation of the questionnaire respondents, they were mostly male (62.1%, n = 1216) and aged between 20 and 85 years, with an average of approximately 46 years (SD = 10.35). Regarding the roles they perform in their companies, 33.3% (n = 652) were managing partners, 26.3% (n = 514) were administrative, 23.2% (n = 455) were administrators or managers and 17.2% (n = 336) were directors. On average, these companies have been on the market for approximately 25 years (SD = 19.36), with 50% of companies operating on the market for 21 years or less.
Table 1 presents the elements that characterise the responding companies. Thus, of the 1957 companies that participated in the study, the majority (50.6%, n = 991) are characterised by being small companies. The companies belonged to different areas of activity, with commerce, services and industry representing 67.9% (n = 1330) of responding companies, but only 17.3% (n = 340) of companies operated in the international market.

Table 1.
Characterisation of companies.
The majority of companies surveyed were family-owned (67.9%, n = 1328) and the two types of company that stand out most are the limited liability company (81.9%, n = 1603) and the public limited company (17.8%, n = 349). As for companies’ life cycle phases, in general, they were stabilised (49.4%, n = 967) or healthy and fast growing (41.5%, n = 811). Regarding certification, the majority (63.7%, n = 710) had accounts certified by an external entity.
3.2. Data Collection Instruments
The instrument used was a questionnaire survey composed of two parts. In the first part, the respondents were characterised (age, sex and role they perform in the company) and the companies were characterised (number of employees, sector or area of activity, year of founding of the company, main market where it has the largest sales volume, type of company, type of society, phases of the company’s life cycle, certification). In the second part, we analysed the determining factors in corporate debt.
To measure the importance of determining factors in corporate debt, 40 items were used (see Table 2 for a more detailed understanding of the items and corresponding variables), constructed while taking into account the works of (Tavares et al. 2015, 2021, 2023) and using a 5-point Likert scale (1—Not at all important; 5—Very important).
Table 2.
Matrix of factor loadings of the determining factors in corporate debt.
3.3. Data Collection and Analysis Procedures
After a literature review, a questionnaire was created and subjected to a pre-test. After carrying out the pre-test, the proposed suggestions were taken into consideration and the questionnaire was created using the Google Forms tool. Subsequently, between the months of March and May 2021, the questionnaire link was sent to the companies that make up the population under analysis, accompanied by a short text, inviting the companies to participate in the present study. In this invitation, the objectives of the study were defined and the anonymity and confidentiality of the information provided were guaranteed.
After data collection, the IBM SPSS Statistics 28 software was used. To characterise the company representatives in the responses to the questionnaire and characterise the companies, descriptive statistics techniques were used (descriptive measures and absolute and relative frequencies). According to Kline (2016), the sensitivity of the items was initially analysed using the asymmetry (|Sk| ≤ 3) and flatness (|Ku| ≤ 10) coefficients.
The suitability of applying an exploratory factor analysis (AFE) to items that assess the determining factors in corporate debt was assessed using the KMO—the Kaiser–Meyer–Olkin index—and Bartlett’s sphericity test. According to Hair et al. (2014), KMO values greater than 0.8 reveal a good adequacy of the sample and a statistically significant Bartlett’s test of sphericity (p < 0.05) indicates that there are sufficient correlations between the items to continue the analysis. To obtain the determining factors in corporate debt, EFA was applied, using the main components method and the Kaiser criterion (eigenvalues greater than 1) and the varimax method were used to extract the factors. According to Hair et al. (2014), factor loadings must be above 0.50 to translate more than 25% of the variable’s variance.
The reliability of the factors obtained with the application of EFA were evaluated using the calculation of the Cronbach’s alpha value. Values greater than 0.7 are considered acceptable (Hair et al. 2014).
After defining the determining factors of corporate debt, cluster analysis was applied in order to group companies into groups with common characteristics. Finally, to compare, in the clusters found, the determining factors of corporate debt between the various characteristics of the companies, Student’s t-test for independent samples and Welch’s test were applied. In cases where the intention is to compare two independent samples, Student’s t-test was used, and in cases where it is intended to compare more than two independent samples, ANOVA or Welch’s test was used in cases of the violation of the assumption of homogeneity of variances (Marôco 2018).
4. Results and Discussion
4.1. Determining Factors in Business Debt
The Kaiser–Meyer–Olkin (KMO) sampling measure and Bartlett’s sphericity test revealed a very good sample adequacy ( = 37830.95, p < 0.001, KMO = 0.902) for the application of exploratory factor analysis to the 39 items that make up the determining factors in business debt (Hair et al. 2014).
Table 2 shows that six factors were retained, which together explain 58.50% of the total variance. The first factor explains 13.70% of the variance and is the business relationship with banks (items R1, R2, R3, R4, R5, R6, R7, R8 and R9), as it is composed of items that address aspects related to the importance that companies give to the closeness of their relationship with banks.
The second factor refers to items related to a company’s financing decision, are related to the company’s life cycle and also take into account debt at the beginning and end of the financing operation (items F1, F2, F3, F4, F5, F6, F7, F8 and F9). This factor explains 12.42% of the variance and is known as financing, cycle and debt.
The third factor is the company’s operational performance (items D1, D2, D3, D4, D5 and D6) and explains 9.23% of the variance. The items in this factor address aspects related to the importance that companies give to their operational part and to their good structuring and consolidation. The fourth factor explains 7.98% of the variance and involves guarantees used to obtain bank financing (items G1, G2, G3, G4 and G5). The items in this factor refer to essential guarantees, or of first concern, used in company financing. The fifth factor is financing risk analysis (items A1, A2, A3, A4, A5 and A6) and explains 7.76% of the variance. The items in this factor are related to what companies do not consider important when analysing the risk of financing a company, that is, they are aspects that companies tend to underestimate when taking out financing.
The sixth, and last, factor is secondary forms of bank financing (items FS1, FS2, FS3, FS4 and FS5) and explains 7.41% of the variance. The items in this factor relate to the use of bills and promissory notes, factoring and other forms of financing.
Regarding the loading values of all items, these are greater than 0.5 (minimum value of 0.633), which is in accordance with Hair et al. (2014). Regarding the reliability of each factor, this is considered, according to Hair et al. (2014), very good for the factor of business relationship with banks (factor 1: α = 0.913) and good for the remaining factors (factor 2: α = 0.887; factor 3: α = 0.849, factor 4: α = 0.838, factor 5: α = 0.820 and factor 6: α = 0.800).
These results aggregate the determining factors of corporate debt. In short, it can be seen that there are six factors that as a whole are considered when companies resort to debt. Thus, when companies resort to debt, the company’s business relationship with banks, its life cycle and its operational performance, as well as the guarantees required by the bank, are decisive, with the need to carry out a risk analysis financing, as well as secondary forms of bank financing.
4.2. Cluster Analysis
The dendrogram in Figure 1 shows that the six determining factors in corporate debt lead to the formation of three clusters.
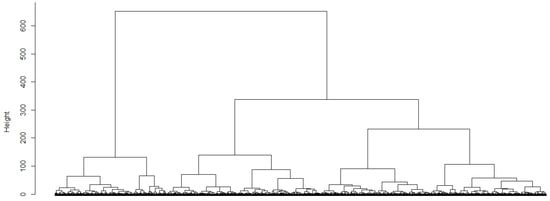
Figure 1.
Dendrogram of clusters related to the determining factors in corporate indebtedness. Source: Own elaboration.
Cluster 1 in Figure 2 contains the largest number of companies (n = 946, 48.3%) and presents high levels in the factors of business relationship with banks (M = 3.88, SD = 0.56) and company operational performance (M = 4.09, SD = 0.49). As for the financing factor, the cycle and debt factor presents reasonable levels (M = 3.28, SD = 0.66). In the remaining factors, the levels are low, falling below the midpoint of the scale used (three points). Thus, cluster 1 will be called the “Resilient Financial Cluster”, as it has a strong relationship with banks and excellent operational performance. The authors Mehtap and Kokalan (2013) and O’Sullivan et al. (2016) mentioned that corporate reputation is a very valuable intangible asset and this helps to maintain a good relationship with banks. Soares et al. (2012) and Chai et al. (2019) refer to the importance of the operational part of the company being healthy, and that in small- and medium-sized companies, non-financial factors are more influential than financial factors.
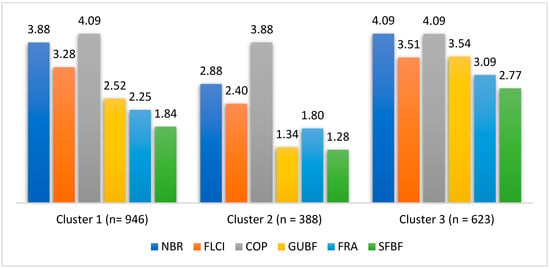
Figure 2.
Averages of the determining factors in corporate debt by cluster. Legend: Cluster 1—Resilient Financial Cluster; Cluster 2—Operational Excellence Cluster; Cluster 3—Strategic Financial Cluster; NBR—negotiating relations with banks; FLCI—financing, life cycle and indebtedness; COP—Company’s operational performance; GUBF—guarantees used to obtain bank financing; FRA—financing risk analysis; SFBF—secondary forms of bank financing. Source: Own preparation.
Cluster 2 is made up of 388 (19.8%) companies and presents a high level only in the company’s operational performance factor (M = 3.88, SD = 0.72). In all other factors, the levels are below the midpoint of the scale. Therefore, cluster 2 will be called the “Operational Excellence Cluster”, reflecting its prominence only in the company’s operational performance factor, while the other factors present levels below average. Santos et al. (2022) state that the perception of operational risk positively influences the perception of financial risk. Also, for Soares et al. (2012) an increase in operating income over total financial expenses reduces credit risk and increases the credit rating.
Cluster 3 consists of 623 (31.8%) companies and is characterised by presenting high average levels in four of the determining factors: business relationship with banks (M = 4.09, SD = 0.50); financing, cycle and debt (M = 3.51, SD = 0.61); company operational performance (M = 4.09, SD = 0.60); and guarantees used to obtain bank financing (M = 3.54, SD = 0.66). The factor of financing risk analysis is slightly above the midpoint of the scale (M = 3.09, SD = 0.71) and the factor of secondary forms of bank financing presents low levels (M = 2.77, SD = 0.91). Taking the above into account, cluster 3 will be called the “Strategic Financial Cluster”, as it stands out by presenting high average levels in four determining factors, indicating a strategic and balanced approach in relation to financial and operational aspects. Strategic planning is essential for companies. Authors such as Tavares et al. (2023), Rodrigues et al. (2018) and Pacheco et al. (2019) allude in their work to strategic planning and risk management, as well as their alignment with the companies’ life cycle.
It should be noted that in all clusters the company’s operational performance factor presents high levels.
4.3. Comparative Analysis by Clusters
In Table 3, after applying Student’s t-test for independent samples, it was observed that, in the Resilient Financial Cluster, there are statistically significant differences in the financing risk analysis factor between family and non-family companies (t = 2.052, p < 0.05), with family companies being those that attribute greater importance to this factor. In the Strategic Financial Cluster, there are statistically significant differences in the factor of secondary forms of bank financing between family and non-family companies (t = −3.022, p < 0.01), with non-family companies being those that attribute greater importance to this factor. This verification is in line with what was mentioned by Santos et al. (2022).
Table 3.
Comparative analysis of the determining factors in corporate indebtedness between family and non-family companies by cluster.
In Table 4, we intend to compare the determining factors of corporate debt between the ages of the companies, by cluster. To this end, two groups were considered, one encompassing companies aged less than 25 years and the other with the remaining companies (the value of 25 is justified as it is the average value of the companies’ ages). Thus, as we want to compare two age groups, we used Student’s t-test for independent samples, and it was observed that, in the Operational Excellence Cluster, there were statistically significant differences in the financing, cycle and debt factor (t = −1.975, p < 0.05), with companies under 25 years old being those that attribute greater importance to this factor. In the Strategic Financial Cluster, there were statistically significant differences in the secondary forms of bank financing factor (t = −2.117, p < 0.05), with companies under 25 years old being those that attribute greater importance to this factor.
Table 4.
Comparative analysis of the determining factors in corporate indebtedness between companies under 25 years old and 25 years old or more by cluster.
In Table 5, we intend to compare the determining factors of corporate debt between certified and non-certified companies, by cluster. Student’s t-test for independent samples was applied, as the aim was to compare two groups of companies (certified and non-certified). The company’s operational development factor is the only one that presents statistically significant differences in the three clusters under analysis, with certified companies being those that attribute greater importance to this factor.
Table 5.
Comparative analysis of the determining factors in corporate indebtedness between certified and non-certified companies by cluster.
From the analysis of Table 6 and applying Student’s t-test for independent samples, it is observed that, in the financing risk analysis factor, there are statistically significant differences in both the Resilient Financial Cluster (t = −3.470, p < 0.01) and the Strategic Financial Cluster (t = −2.288, p < 0.05), with companies with less than 50 employees being those that attach greater importance to this factor. In the Resilient Financial Cluster, there are also statistically significant differences in the business relationship with banks factor (t = 2.325, p < 0.05), with companies with 50 or more employees being those that attribute greater importance to this factor. In the Strategic Financial Cluster, there were statistically significant differences in the guarantees used to obtain bank financing factor (t = 2.095, p < 0.05), with companies with 50 or more employees attaching greater importance to this factor. It appears that small companies are more focused on resilience and larger companies are more focused on strategic planning.
Table 6.
Comparative analysis of the determining factors in corporate indebtedness between companies with less than 50 employees and companies with 50 or more by cluster.
Table 7 shows that, by applying Student’s t-test for independent samples, there are statistically significant differences in the company’s operating performance factor in both the Resilient Financial Cluster (t = −2.846, p < 0.01) and the Strategic Financial Cluster (t = −2.327, p < 0.05), with companies whose life cycle is in the stabilised or declining phases attaching greater importance to this factor. In the Resilient Financial Cluster, there are also statistically significant differences in the business relationship with banks factor (t = −2.010, p < 0.05), with companies whose life cycle is in the stabilised or declining phases being those that attribute greater importance to this factor. In the Strategic Financial Cluster, there were statistically significant differences in the factor of guarantees used to obtain bank financing (t = 3.157, p < 0.01), with companies whose life cycle is in the phases of rapid and healthy growth being those that attribute greater importance to this factor. It appears that the importance given to the guarantees required to obtain bank financing is essential for companies undergoing rapid and healthy growth.
Table 7.
Comparative analysis of the determining factors in corporate indebtedness between the phases of the company’s life cycle by cluster.
In Table 8, after applying Welch’s test as an alternative to ANOVA, the assumption of homogeneity of variances was violated, and it can be seen that, in the secondary forms of bank financing factor, there are statistically significant differences both in the Resilient Financial Cluster (F = 7.357, p < 0.001) and in the Strategic Financial Cluster (F = 3.380, p < 0.05), with companies operating in the national market attaching greater importance to this factor. The Games–Howell multiple comparison test showed that, in the Resilient Financial Cluster, there are significant differences between companies operating in the local market and those operating in the national market (p < 0.001); between those operating in the local market and those that operate in the international market (p < 0.05); and between those that operate in the regional market and those that operate in the national market (p < 0.01). In the Strategic Financial Cluster, there are significant differences only between companies operating in the regional market and those operating in the national market (p < 0.05), with companies operating in the national market being those that attribute greater importance to the factor secondary forms of bank financing.
Table 8.
Comparative analysis of the determining factors in corporate indebtedness between the markets in which companies operate by cluster.
In the Resilient Financial Cluster, there are also statistically significant differences in the financing risk analysis factor (F = 5.203, p < 0.01), with companies operating in the local market being those that attribute greater importance to this factor. Using the Games–Howell multiple comparison test, significant differences were verified between companies operating in the local market and those operating in the international market (p < 0.05) and between those operating in the regional market and those operating in the international (p < 0.05). It was therefore observed that companies operating in the national market give greater importance to secondary forms of bank financing, which is in line with what was mentioned by Tavares et al. (2015).
In Table 9, after applying Student’s t-test to compare two independent samples (private limited company and public limited company), it was observed that there were no statistically significant differences in the determining factors of corporate debt between companies that have limited liability companies and public limited companies in any of the clusters.
Table 9.
Comparative analysis of the determining factors in corporate indebtedness between types of society by cluster.
5. Conclusions
The main objective of this work was to study the determining factors in corporate indebtedness in Portugal. It also had the secondary objectives of creating clusters of companies’ credit behaviour and verifying their differences in relation to company characteristics. Thus, in this study, we can see that the determining factors of corporate indebtedness in Portugal are the negotiating relationship between companies and banks; the intended financing, the company’s level of indebtedness and the stage of its life cycle; the company’s operating performance; the guarantees used to obtain bank financing; the analysis of financing risk; and secondary forms of bank financing. It was also found that the six determining factors in corporate indebtedness lead to the formation of three clusters of companies. One was called the “Resilient Financial Cluster”, which has a strong relationship with banks and an excellent operational performance. The cluster called the “Operational Excellence Cluster” reflects the company’s excellent operational performance, and the cluster called the “Strategic Financial Cluster” is characterised by high average levels in four determining factors, namely strong relationships with banks; desired financing, level of indebtedness and stage of the company’s life cycle; the company’s operational performance; and guarantees used to obtain bank financing.
Through comparative cluster analysis, it is concluded that there are statistically significant differences as follows:
- -
- In the “Strategic Financial Cluster”, in secondary forms of bank financing, where non-family companies attach greater importance to this factor when compared to non-family companies;
- -
- In the “Operational Excellence Cluster”, companies under 25 years old attach greater importance to the financing, cycle and debt factor;
- -
- The “operational development of the company” factor is the only one that presents statistically significant differences in the three clusters, with certified companies attaching greater importance to this factor;
- -
- In the “financial risk analysis” factor, in the “Resilient Financial Cluster” and in the “Strategic Financial Cluster”, companies with less than 50 employees attribute greater importance to this factor;
- -
- In the “operational performance” factor, there are differences in the “Resilient Financial Cluster” and the “Strategic Financial Cluster”, with companies that are in the stabilised or declining phase of the life cycle being those that attach greater importance to this factor;
- -
- In the “business relationship with banks” factor, in the “Resilient Financial Cluster”, companies whose life cycle is in the stabilised or declining phases attribute greater importance to this factor;
- -
- In the factor “secondary forms of bank financing”, there are differences in the “Resilient Financial Cluster” and the “Strategic Financial Cluster”, with companies operating in the national market being those that attach greater importance to this factor;
- -
- In the “financing risk analysis” factor, the “Resilient Financial Cluster” presents differences, with companies operating in the local market being those that attach greater importance to this factor.
Practical Implications for Companies
A practical implication of this study is that understanding the determinants of corporate indebtedness is crucial for companies to grasp the factors influencing their debt and cost of capital, enabling them to gather the necessary information to gain advantages. This study provides data on this research field for market segmentation and financing strategies, through the formation of three distinct clusters. This study points to the need to segment the market and adapt financing strategies according to the specific characteristics of each cluster. Thus, different business groups should have differentiated approaches. A detailed and personalised analysis is required, depending on the cluster to which companies belong. The operational development factor of a company emerges as a key consideration in all clusters, with certified companies assigning greater importance to this aspect. Additionally, the relationship with banks is a crucial element, especially for companies in specific stages of their life cycle. Therefore, strategies aimed at improving operational performance and strengthening bank relations may be prioritised for financial and operational success. For example, family and non-family businesses may have different perspectives on secondary forms of bank financing, while younger companies may prioritise financing and the company’s life cycle. These differences should be taken into account when developing financing and risk management strategies. This work also provides information for policymakers to formulate policies supporting access to credit by Portuguese SMEs. In summary, companies in Portugal should adopt strategic and personalised approaches to financing and risk management, taking into account the determinants of corporate indebtedness and the specific characteristics of each market segment identified by clusters.
It is hoped that this work will contribute to a better understanding of the factors determining bank financing by companies, the banking sector, the community in general and the academic world in particular. It is also expected that it can contribute to the implementation of public policies by the state, so as to better be able to create lines that facilitate access to credit for companies and thus promote economic development.
Author Contributions
Conceptualisation, F.T. and E.S.; methodology, F.T. and E.S.; software, F.T. and E.S.; validation, F.T., E.S., M.F.O. and L.A.; formal analysis, F.T., E.S., M.F.O. and L.A.; investigation, F.T., E.S., M.F.O. and L.A.; resources, F.T., E.S., M.F.O. and L.A.; data curation, F.T.; writing—original draft preparation, F.T. and E.S.; writing—review and editing, F.T., E.S., M.F.O. and L.A.; visualisation, F.T., E.S., M.F.O. and L.A.; supervision, F.T. and E.S. All authors have read and agreed to the published version of the manuscript.
Funding
This research received no external funding.
Data Availability Statement
The data presented in this study are available on request from the corresponding author. The data are not publicly available due to what they achieved through surveys of companies.
Conflicts of Interest
The authors declare no conflicts of interest.
References
- Aksoy, Mine, and Mustafa Kemal Yilmaz. 2023. Does board diversity affect the cost of debt financing? Empirical evidence from Turkey. Gender in Management 38: 504–24. [Google Scholar] [CrossRef]
- Almeida, Luís. 2023. Risk and Bankruptcy Research: Mapping the State of the Art. Journal of Risk and Financial Management 16: 361. [Google Scholar] [CrossRef]
- Amarna, Khayria, Raquel Garde Sánchez, Maria Victoria López-Pérez, and Mahmoud Marzouk. 2024. The effect of environmental, social, and governance disclosure and real earning management on the cost of financing. Corporate Social Responsibility and Environmental Management, 1–13. [Google Scholar] [CrossRef]
- Aziz, Sohail, and Ulfat Abbas. 2019. Effect of debt financing on firm performance: A study on non-financial sector of Pakistan. Open Journal of Economics and Commerce 2: 8–15. [Google Scholar] [CrossRef]
- Belkhaoui, Samir, Naif Alsagr, and Stefan F. van Hemmen. 2020. Financing modes, risk, efficiency and profitability in Islamic banks: Modeling for the GCC countries. Cogent Economics & Finance 8: 1750258. [Google Scholar] [CrossRef]
- Bhatia, Prince, and Rahul Kumar. 2023. Do debt, and operating efficiency contributes to corporate performance? International Journal of System Assurance Engineering and Management 15: 1203–9. [Google Scholar] [CrossRef]
- Boshnak, Helmi. 2023. The impact of capital structure on firm performance: Evidence from Saudi-listed firms. International Journal of Disclosure and Governance 20: 15–26. [Google Scholar] [CrossRef]
- Calcagnini, Giorgio, Fabio Farabullini, and Germana Giombini. 2014. The impact of guarantees on bank loan interest rates. Applied Financial Economics 24: 397–412. [Google Scholar] [CrossRef]
- Chai, Nana, Bi Wu, Weiwei Yang, and Baofeng Shi. 2019. A multicriteria approach for modeling small enterprise credit rating: Evidence from China. Emerging Markets Finance and Trade 55: 2523–43. [Google Scholar] [CrossRef]
- Cicogna, Maria Paula Vieira, Rudinei Toneto Junior, and Maurício Ribeiro do Valle. 2007. O impacto da adesão a padrões mais elevados de governança sobre o financiamento empresarial. Revista de Administração 42: 52–63. [Google Scholar]
- Forti, Cristiano Augusto Borges, Fernanda Maciel Peixoto, and Kellen Silva Freitas. 2011. Retenção de caixa, desempenho operacional e valor: Um estudo no mercado de capitais brasileiro. Revista de Contabilidade e Organizações 5: 20–33. [Google Scholar] [CrossRef]
- Ghouma, Hatem, Hamdi Ben-Nasr, and Ruiqian Yan. 2018. Corporate governance and cost of debt financing: Empirical evidence from Canada. The Quarterly Review of Economics and Finance 67: 138–48. [Google Scholar] [CrossRef]
- Gonçalves, Tadeu Junior, Anderson Roberto Pires, and Pedro Borges Junior. 2018. A forma de financiamento das companhias abertas sob os pressupostos da pecking order theory e trade off theory. Revista Evidenciação Contábil & Finanças 6: 101–18. [Google Scholar] [CrossRef]
- Hair, Joseph F., William C. Black, Barry J. Babin, and Rolph E. Anderson. 2014. Multivariate Data Analysis, 7th ed. Edinburgh: Pearson. [Google Scholar]
- Jucá, Michele Nascimento, Anderson Luís Saber Campos, Douglas Dias Bastos, and Eduardo Alexandre Mendes. 2016. Endividamento e estrutura de ativos: Evidências no Brasil. Revista de Finanças Aplicadas 7: 1–19. [Google Scholar]
- Kline, Rex B. 2016. Principles and Practice of Structural Equation Modeling. New York: Guilford Press. [Google Scholar]
- Lemma, Tesfaye T. 2015. Corruption, debt financing and corporate ownership. Journal of Economic Studies 42: 433–61. [Google Scholar] [CrossRef]
- Li, Luya, and Hongxun Li. 2021. Analysis of financing risk and innovation motivation mechanism of financial service industry based on Internet of things. Complexity 2021: 5523290. [Google Scholar] [CrossRef]
- Magnanelli, Barbara Sveva, and Maria Federica Izzo. 2017. Corporate social performance and cost of debt: The relationship. Social Responsibility Journal 13: 250–65. [Google Scholar] [CrossRef]
- Manuel, Benedito, Fernando Oliveira Tavares, and Luís Pacheco. 2018. Decisões de financiamento bancário por parte da banca angolana: O caso do Banco de Poupança e Crédito. e3-Revista de Economia, Empresas e Empreendedores na CPLP 4: 55–80. [Google Scholar] [CrossRef]
- Marôco, João. 2018. Análise Estatística com o SPSS Statistics 25, 7th ed. Lisboa: ReportNumber. [Google Scholar]
- Mayordomo, Sergio, Antonio Moreno, Steven Ongena, and Maria Rodriguez-Moreno. 2021. Bank capital requirements, loan guarantees and firm performance. Journal of Financial Intermediation 45: 100825. [Google Scholar] [CrossRef]
- Mehtap, Ozge, and Ozgur Kokalan. 2013. The relationship between corporate reputation and organizational citizenship behavior: A comparative study on TV companies and banks. Quality & Quantity 47: 3609–19. [Google Scholar] [CrossRef]
- Mura, Ladislav, and Ján Buleca. 2012. Evaluation of financing possibilities of small and medium industrial enterprises. Procedia Economics and Finance 3: 217–22. [Google Scholar]
- Mutamimah, Mutamimah, Mochammad Tholib, and Robiyanto Robiyanto. 2021. Corporate governance, credit risk, and financial literacy for small medium enterprise in Indonesia. Business: Theory and Practice 22: 406–13. [Google Scholar] [CrossRef]
- Myers, Stewart C., and Nicholas S. Majluf. 1984. Corporate financing and investment decisions when firms have information that investors do not have. Journal of Financial Economics 13: 187–221. [Google Scholar] [CrossRef]
- Ogunmokun, Olapeju Comfort, Oluwasoye Mafimisebi, and Demola Obembe. 2024. Bank lending behaviour and small enterprise debt financing. Journal of Entrepreneurship in Emerging Economies 16: 675–97. [Google Scholar] [CrossRef]
- Ono, Arito, and Iichiro Uesugi. 2009. Role of collateral and personal guarantees in relationship lending: Evidence from Japan’s SME loan market. Journal of Money, Credit and Banking 41: 935–60. [Google Scholar] [CrossRef]
- O’Sullivan, Jennifer, Abdullah Mamun, and M. Kabir Hassan. 2016. The relationship between board characteristics and performance of bank holding companies: Before and during the financial crisis. Journal of Economics and Finance 40: 438–71. [Google Scholar] [CrossRef]
- Pacheco, Luís Miguei, Raquel Rosa, and Fernando Oliveira Tavares. 2019. Risco de falência de PME: Evidência no setor da construção em Portugal. Innovar 29: 143–57. [Google Scholar] [CrossRef]
- Rodrigues, Santiago Valcacer, Elton Eustáquio Casagrande, and David Ferreira Lopes Santos. 2018. A interdependência das decisões empresariais de investimento e endividamento na América Latina. Enfoque: Reflexão Contábil 37: 1–20. [Google Scholar] [CrossRef]
- Rosa, Fabio, Giovanni Liberatore, Francesco Mazzi, and Simone Terzani. 2018. The impact of corporate social performance on the cost of debt and access to debt financing for listed European non-financial firms. European Management Journal 36: 519–29. [Google Scholar] [CrossRef]
- Santos, Eulalia, Vasco Tavares, Fernando Oliveira Tavares, and Vanessa Ratten. 2022. How is risk different in family and non-family businesses? A comparative statistical analysis during the COVID-19 pandemic. Journal of Family Business Management 12: 1113–30. [Google Scholar] [CrossRef]
- Soares, Gustavo de Oliveira Godoy, Eduardo Senra Coutinho, and Marcos Antônio de Camargos. 2012. Determinantes do rating de crédito de companhias brasileiras. Contabilidade Vista & Revista 23: 109–43. [Google Scholar]
- Tavares, Fernando Oliveira, Eulália Santos, and Vasco Capela Tavares. 2021. Risk categorization in Portuguese organizations in times of the COVID-19 pandemic—An exploratory statistical analysis. Journal of Entrepreneurship and Public Policy 10: 306–22. [Google Scholar] [CrossRef]
- Tavares, Fernando Oliveira, Eulália Santos, Vasco Capela Tavares, and Vanessa Ratten. 2023. Risk Planning and Management in Portuguese Companies—A Statistical Approach. Journal of Risk and Financial Management 16: 314. [Google Scholar] [CrossRef]
- Tavares, Fernando Oliveira, Luís Pacheco, and Emanuel Ferreira Almeida. 2015. Financiamento das pequenas e médias empresas: Análise das empresas do distrito do Porto em Portugal. Revista de Administração 50: 254–67. [Google Scholar] [CrossRef]
- Ugwueze, Catherine Amaka, C. E. Nwoha, and Uche Lucy Onyekwelu. 2019. Effect of financing decisions on operational performance of pharmaceutical firms in Nigeria. Academic Journal of Current Research 6: 3244–5621. [Google Scholar]
- Uyar, Ali, Nouha Ben Arfa, Cemil Kuzey, and Abdullah S. Karaman. 2024. Do creditors appreciate CSR transparency and credibility in emerging markets? Journal of Accounting Literature ahead-of-print. [Google Scholar] [CrossRef]
- Van Osnabrugge, Mark. 2000. A comparison of business angel and venture capitalist investment procedures: An agency theory-based analysis. Venture Capital: An International Journal of Entrepreneurial Finance 2: 91–109. [Google Scholar] [CrossRef]
- Yazdanfar, Darush, and Peter Öhman. 2015. Debt financing and firm performance: An empirical study based on Swedish data. Journal of Risk Finance 16: 102–18. [Google Scholar] [CrossRef]
- Ye, Zhiwei, Yasir Shahab, Yasir Riaz, and Collins G. Ntim. 2023. Strategic deviation and the cost of debt financing. Economic Modelling 125: 106371. [Google Scholar] [CrossRef]
- Zhang, Wen, Shaoshan Yan, Jian Li, Xin Tian, and Taketoshi Yoshida. 2022. Credit risk prediction of SMEs in supply chain finance by fusing demographic and behavioral data. Transportation Research Part E: Logistics and Transportation Review 158: 102611. [Google Scholar] [CrossRef]
Disclaimer/Publisher’s Note: The statements, opinions and data contained in all publications are solely those of the individual author(s) and contributor(s) and not of MDPI and/or the editor(s). MDPI and/or the editor(s) disclaim responsibility for any injury to people or property resulting from any ideas, methods, instructions or products referred to in the content. |
© 2024 by the authors. Licensee MDPI, Basel, Switzerland. This article is an open access article distributed under the terms and conditions of the Creative Commons Attribution (CC BY) license (https://creativecommons.org/licenses/by/4.0/).