Article

Development of the Black–Scholes Model for Determining Insurance Premiums to Mitigate the Risk of Disaster Losses Using the Principles of Mutual Cooperation and Regional Economic Growth

1
Department of Statistics, Universitas Padjadjaran, Sumedang 45363, Indonesia
2
Department of Mathematics, Universitas Padjadjaran, Sumedang 45363, Indonesia
3
Doctoral Program of Mathematics, Universitas Padjadjaran, Sumedang 45363, Indonesia
4
Program Study of Statistics, Matana University, Banten 45363, Indonesia
5
Department of Marine Science, Universitas Padjadjaran, Sumedang 45363, Indonesia
*
Author to whom correspondence should be addressed.
Risks 2024, 12(7), 110; https://doi.org/10.3390/risks12070110
Submission received: 6 May 2024 / Revised: 25 June 2024 / Accepted: 28 June 2024 / Published: 3 July 2024

Abstract

:
The frequency and economic damage of natural disasters have increased globally over the last two decades due to climate change. This increase has an impact on the disaster insurance field, particularly in the calculation of premiums. Many regions have a shortcoming in employing insurance because the premium is too high compared with their budget allocation. As one of the solutions, the premium calculation can be developed by applying the cross-subsidies mechanism based on economic growth. Therefore, this research aims to develop premium models of natural disaster insurance that uniquely involve two new variables of an insured region: cross-subsidies and the economic growth rate. Another novelty is the development of the Black–Scholes model, considering the two new variables, and it is used to formulate the premium model. Following the modeling process, this study uses the model to estimate the premiums for natural disaster insurance in each province of Indonesia. The estimation results show that all new variables involved in the model novelties significantly affect the premiums. This research can be used by insurance companies to determine the premium of natural disaster insurance, which involves cross-subsidies and economic growth.

1. Introduction

An intriguing area of study within actuarial science is mathematical modelling as it relates to disaster insurance. The use of claims reserves, premiums, claims volume, and claim magnitude, which insurance companies are obligated to prepare, can be achieved through the utilization of mathematical modelling (Kalfin et al. 2021; Joyette et al. 2015; Peng et al. 2014; Skees et al. 2008; Linnerooth-Bayer and Amendola 2000). Insurance participants who are exposed to the risk of loss as a result of natural disasters are obligated to pay a premium that is computed using a mathematical model for determining disaster insurance premiums (Ermolieva et al. 2017; Paudel et al. 2015; Philippi and Schiller 2024; Reijnen et al. 2005; Ismail 2016; Tao et al. 2009). When developing insurance premium models, it is customary to account for various risk factors associated with natural disasters, including claim frequency and severity. Insurance companies can establish competitive and suitable premium rates and effectively manage adequate claims reserves by considering the aforementioned factors (Johny et al. 2021; Sukono et al. 2022). In order to mitigate the potential for claim failure, which occurs when an insurance company is unable to remit claims submitted by policyholders, it is imperative that the model used to calculate disaster insurance premiums is precisely established (Chen et al. 2012; Subartini et al. 2018; Supian and Mamat 2022). Sewu et al. (2022) and Kunreuther (1996) list a few examples of the factors that can contribute to the possibility of claim failure: modelling errors, extreme natural disasters, and claims errors. According to Jametti and von Ungern-Sternberg (2004) and Kousky and Michel-Kerjan (2017), the estimated frequency and severity of claims may not be accurate if the model used to represent them does not match the data’s properties. This phenomenon may result in insurance companies establishing excessively high or low premiums, thereby reducing their profitability or competitiveness. Extreme natural disasters, on the other hand, transpire infrequently but have a profound effect on the losses incurred by insurance participants (Kunreuther 2015; Kunreuther and Lyster 2016; Chen and Yang 2023). Pandemics, earthquakes, tsunamis, floods, and fires are all instances of extreme events or natural disasters. These incidents may increase claims to the point where the insurance company’s ability to pay them is exceeded.
Prior studies in the field of disaster insurance have devised models to ascertain the cost of insurance premiums. Picard (2008) devised a cross-subsidy model to ascertain the premiums for disaster insurance. The devised model distinguishes between locations with high and low potential for natural disasters. Subsidies will be allocated to regions exhibiting a high propensity for disasters, whereas less susceptible areas will be subjected to taxation. Additionally, the study conducted by Subartini et al. (2018) employed the Tsukamoto method, which is a fuzzy inference system (FIS) technique, to ascertain the insurance premium amounts. This study ascertains the most advantageous flood disaster insurance premiums for communities along river coasts. Sukono et al. (2022) devised a collective risk model-based framework to ascertain insurance premiums for natural disasters. Using the pure premium principle, the devised model incorporates the distribution level of natural disaster risks in Indonesia. In addition, Supian and Mamat (2022) constructed a predictive model for natural disaster insurance premiums through the integration of Picard’s (2008) findings. The devised model implements a cross-subsidy system and a collective risk model approach in determining insurance premiums. Based on previous research, there are gaps in the models that have been developed. In the insurance premium determination model from the research results (Sukono et al. 2022; Subartini et al. 2018), the model focuses on collective risk and has not considered the natural disaster potential index and economic growth rate. While in other research findings (Supian and Mamat 2022; Picard 2008), the insurance premium determination model has considered collective risk and the natural disaster potential index. However, the insurance premium determination model has not considered the economic growth rate. In the research by Chen and Yang (2023), they used the Black–Scholes model in determining insurance premiums. However, in determining insurance premiums, they focus on environmental pollution. Thus, the insurance premium determination model has not considered collective risk, the disaster potential index, and the economic growth index.
Insurance companies must choose a model that suits the characteristics of their claims data, such as distribution, dependency, and heterogeneity. Insurance companies must also periodically validate and evaluate models to ensure that they are still relevant to current conditions (Kalfin et al. 2022b; Cahyandari et al. 2023). Insurance companies must set premiums that reflect the risks faced by insurance participants, such as the type of natural disaster, location, or characteristics of the insured object. Insurance companies must also consider other factors influencing insurance market demand and supply, such as government regulations, market competition, or consumer preferences. In addition, insurance companies must provide sufficient claims reserves to cover claims that may occur in the future (McAneney et al. 2016; Quan and Valdez 2018). Claim reserves are funds set aside by insurance companies to pay claims that have not been resolved or reported (Suwandani and Purwono 2021; Fang et al. 2016). Insurance companies must estimate claims reserves using appropriate statistical or actuarial methods. One of the efforts that can be made to avoid the risk of default is to diversify and reinsure. Insurance companies must diversify their portfolio by offering different insurance products to different insurance participants (Lee 2020). Of course, each product provides a premium according to field needs. Diversifying the insurance product portfolio can reduce the risk of concentrating on one type of product or one group of insurance participants. Diversification of insurance product portfolios can also increase insurance company revenues and profitability (Lee 2017; Acha and Ukpong 2012). Meanwhile, reinsurance is a process in which the insurance company hands over some of the risks to the reinsurance company in exchange for a premium. Reinsurance can help insurance companies overcome the risk of failure to pay claims due to extreme events or natural disasters. Reinsurance can also help insurance companies increase the capacity and solvency of insurance companies (Powell and Sommer 2005; Aduloju and Ajemunigbohun 2017; Bressan 2018).
This research was driven by the objective of developing a model that could ascertain the premiums for natural disaster insurance, as evidenced by the problem description. In addition to considering the economic growth rate, the devised model formulation employs a cross-subsidy system and a collective risk coefficient. The devised model is novel in that it incorporates the rate of economic expansion in each region when calculating insurance premiums. According to a study by Lima and Barbosa (2019), regions prone to frequent natural disasters will observe a reduction in their economic development. This finding forms the foundation of this innovation. Disproportionate impacts will result from the substantial insurance premiums that must be paid in regions characterized by a high potential index for natural disasters and a sluggish economic growth rate. Consequently, subsidy provision is necessary for regions characterized by low economic growth rates and high natural disaster potential indices. Establishing insurance premiums that are affordable and commensurate with the rate of economic expansion in each region is the objective of devising a model for calculating disaster insurance premiums. Efficient insurance claim reserves can be generated from the insurance premiums through the implementation of the developed model. In addition, historical data from natural disasters are utilized to simulate the developed model. The anticipated outcome of the conducted research is that the findings may furnish the government with a comprehensive outline of policy recommendations pertaining to the implementation of the natural disaster insurance system. Insurance companies, meanwhile, can be consulted for guidance on how to calculate premiums for natural disaster insurance.

2. Materials and Methods

2.1. Materials

The model employed in this study was finalized using sample data pertaining to the frequency of occurrences, incurred losses, and the natural disaster potential index. Aside from that, the economic development index for each region was incorporated into the data. Data on the frequency of occurrence, losses incurred, and the index of potential natural disasters were obtained through the National Disaster Management Agency in Indonesia through the websites http://dibi.bnpb.go.id and http://bnpb.cloud (accessed on 1 May 2024). In addition, the data considered the economic growth index in each region in Indonesia as obtained through the website https://www.bps.go.id (accessed on 1 May 2024). The focal research entities for the purpose of simulating the developed model were the thirty-four provinces of Indonesia. The utilized data pertaining to the frequency of disaster events and losses span the years 2000 to 2019. The collected data were then checked and analyzed. The data analysis was carried out in the form of modeling the frequency data of natural disasters using compound Poisson with jump processes and modeling disaster loss data using normal distribution. In contrast, the data utilized for the calamity potential index and economic development in each province was limited to the year 2019. Using these sample values, the simulation of determining natural disaster insurance premiums was constructed. The purpose of conducting the simulation was to evaluate the applicability of the developed model to natural disaster data in Indonesia.

2.2. Method

A concise description of the research methodologies employed to model the premium of natural disaster insurance is provided, considering the economic growth rate and the cross-subsidy mechanism. The approaches consist of the Black–Scholes model and the compound Poisson process with jumping, normal distribution models, and collective risk models. In determining insurance premiums, there are several factors that affect the amount of premiums. In the insurance premium determination model that was developed, the variables of concern are the frequency of occurrence, economic losses, and the potential disaster index.

2.2.1. Modelling Frequencies of Disaster Events

Several methods and statistical techniques that are tailored to the data’s characteristics and intended use can be employed to model disaster event frequency data. Compound Poisson with jump processes were utilized to model it in this research. Capturing random jumps in natural disasters, where the frequency fluctuates arbitrarily between two jumps, is an advantage of the jumping processes method. Equation (1) represents compound Poisson with jump processes Y t t 0 via random addition (Gikhman and Skorokhod 2004; Berger 1993):
Y t = Z 1 + Z 2 + + Z N t = k = 1 N t Z k :   t 0 ,
where N t represents homogeneous Poisson process with intensity λ > 0 , and Z i i = 1,2 , 3 , represents random variable sequences that are independent and identically distributed (i.i.d.). It represents the economic loss jump of i -th natural disasters. The expectation of the compound Poisson process Y t t 0 for a given t can be determined by multiplying the mean jump size by the average number of jump times, as given in Equation (2):
E Y t = E N t E Z = λ t E Z ,
where E represents expectation under the same probability measure. Meanwhile, the variance of Y t for fixed t is the multiplication between the average number of jump times and the second moment of the size. It is mathematically given in Equation (3) as follows (Osaki 1992):
V a r Y t = E N t E Z 2 = λ t E Z 2 .
The advantage of the jumping processes method is that it can capture random event jumps. While in previous studies, in determining insurance premiums, the standard Poisson process was still used, which only had a jump size of +1 and a constant path between the two jumps. Compound Poisson with jump processes can be used for those with randomly sized jumps. Compound Poisson with jump processes considers the jump process that has a random size, while the standard Poisson process is limited to developing models whose jumps are constant in size. Based on these circumstances, in determining natural disaster insurance premiums, compound Poisson with jump processes is used when the frequency of natural disaster events has a random size between the two jumps and, in accordance with the model developed, by considering random event data in each of its data jumps.

2.2.2. Modeling Disaster Loss

In this study, disaster loss modeling uses a normal distribution. This refers to the Black–Scholes model, for the form of data used is normally distributed. Estimation of the risk of natural disaster losses in this study was deducted by calculating the average value and standard deviation of the available loss data (Li et al. 2022b). In the estimation carried out, the average value indicated the expected level of loss, while the standard deviation indicated how much variation in losses may occur. Using a normal distribution, we calculated the probability of natural disaster losses falling within a certain range (Shi et al. 2020). Determination of the expected value and variance of the normal distribution for natural disaster losses is formulated as Equations (4) and (5) (Bryc 1995; Luis 2015):
E X = λ X
and
V a r X = σ X 2 ,
where X is random variable representing economic loss of the natural disaster.

2.2.3. Collective Risk Model

A collective risk model is a mathematical model used to calculate the expected number of claims from a group of mutually independent and identically distributed risks. In addition, this model considers interdependent variables, meaning that they have a relationship or dependency on each other. In the context of a collective risk model, these variables can be connected through some copulas. Copulas are mathematical functions that connect the distributions of several random variables into a joint distribution. Thus, by using copulas, we can model the dependency between the frequency of events and aggregate losses in a collective risk model. This model is often used in the insurance sector, especially life insurance, health insurance, and casualty insurance. This model consists of two components, namely frequency and severity. Frequency is the number of claims that occur in one insurance period, while severity is the number of claims per incident. Mathematically, it is formulated as follows (Dickson 2016; Ma and Ma 2013; Li et al. 2022a; Ma et al. 2017):
S = X 1 + X 2 + + X N t = i = 1 N t X i ,
where X i i = 1,2 , 3 , represents i.i.d. random variables representing the economic damage of the i -th natural disasters. The expectation and the variance of collective risk, S , are formulated in Equations (7) and (8) as follows (Syuhada et al. 2024; Kalfin et al. 2022a):
E S = E Y t E ( X )
and
V a r S = E Y t V a r X + V a r Y E 2 X ,

2.2.4. Black–Scholes Model

In determining the Black–Scholes PDE for a call option on a stock that does not pay dividends with strike K and maturity T , it is assumed that the stock price follows a geometric Brownian motion so that
d S t = μ S t   d t + σ S t   d W t
where W t is the standard Brownian motion. It is assumed that the interest rate is constant so that 1 unit of currency invested in a cash account at time 0 will be worth B t = e x p ( r t ) at time t . So, it can be stated that C ( S , t ) is the value of a call option at time t . Furthermore, by referring to the Ito lemma, it is obtained that
d C S , t = μ S t C S + C t + 1 2 σ 2 S 2 2 C S 2   d t + σ S t   C S   d W t
Furthermore, assume that at any time t , we hold x t units of cash and y t units of stock. Then P t , the time t value of this strategy, satisfies
P t = x t B t + y t S t
We choose x t and y t such that the strategy reflects the option value. The self-financing assumption implies that
d P t = x t d B t + y t d S t
d P t = r x t B t d t + y t μ S t d t + σ S t d W t
d P t = r x t d B t + y t μ S t d t + y t σ S t d W t
Furthermore, by paying attention to Equation (10), which corresponds to Equation (14), we obtain
y t = C S
r x t d B t = C t + 1 2 σ 2 S 2 2 C S 2
If we set C 0 = P 0 , the initial value of the self-financing strategy, then it must be that C t = P t for all t because C and P have the same dynamics. By substituting Equations (15) and (16) into Equation (11), we obtain the Black–Scholes PDE.
r S t C S + C t + 1 2 σ 2 S 2 2 C S 2 r C = 0
A mathematical model that is employed to ascertain option prices, spWecifically the right to purchase or sell an asset at a specified time and price, is the Black–Scholes model. The equations representing the Black–Scholes model are (18) and (19) as follows (Pascucci 2011; Bloch 2023; Morales-Bañuelos et al. 2022; Giudice et al. 2015; Shinde and Takale 2012):
C S , t = S e δ t N d 1 K e r t N d 2
P S , t = K e r t N d 2 S e δ t N d 1
where d 1 and d 2 are given in Equations (20) and (21) as follows:
d 1 = l n S e δ t K e r t + 0.5 σ 2 t σ t = l n S K + r + δ + 0.5 σ 2 t σ t
and
d 2 = l n S e δ t K e r t + 0.5 σ 2 t σ t = l n S K + r δ + 0.5 σ 2 t σ t .
In detail, C S , t is the call option price, P S , t is the put option price, S is the initial stock price, K is the option strike price, μ is the deviation rate of S in a year, σ represents the standard deviation of stock movements, t represents time, δ represents the dividend rate (stock profit), N ( x ) represents the normal cumulative distribution function, and r represents the annual risk-free interest rate. The Black–Scholes model can be applied in the insurance sector to calculate insurance premium prices by assuming that the value of insurance benefits is an option purchased by the policyholder.

3. Results

3.1. The Developed Black–Scholes Model

The equation in the Black–Scholes model is used to determine the price of put and buy options. However, determining the price of a put option is similar to determining the price of insurance premiums. Because there are several similarities between the price of the put option and the determination of the insurance premium, the price (premium) can be determined in the same way as the price of the put option. Of course, insurance premium prices are adjusted to the variables used.
The developed model was designed based on the Black–Scholes formula for put options written in Equations (19) through (21). In insurance against losses due to disasters, the insurance payment value (payout) always depends on the severity of an event that creates a risk of economic loss, which is mathematically designed as a put option as follows:
P a y o u t = K ; R < R T 0 ; O t h e r ,
where K represents the insurance coverage price for the insured who experienced economic losses due to natural disasters and R T represents the benchmark value defined as the average annual economic losses due to natural disasters. In this study, the insurance coverage price is calculated based on the average (expected) aggregate loss risk per year based on Equation (7). Hence, we approximate K = E ( S ) . Based on Equation (22), the insurance premium for economic losses due to natural disasters is calculated as follows:
P B S = K e τ t N d 2 = E ( S ) e τ t N d 2
where P B S premiums are calculated using the Black–Scholes method and the cumulative distribution d 2 is formulated in the equation as Equation (24):
d 2 = l n R 0 R T + τ σ 2 2 t σ t .
In detail, R 0 is the number of losses from the last natural disaster, R T is the benchmark value for losses from natural disasters, σ is the standard deviation of natural disaster risk, and τ is the unexpected risk level (loading factor). Additionally, if the model is constructed with the potential for natural disasters and cross-subsidies in mind, Equation (25) can be used to formulate the Black–Scholes model for calculating insurance premiums when cross-subsidies are considered, as indicated by Equation (23) as follows:
P [ B S ] i * = π i E ( S ) e τ t N d 2 + ς ; 0 π i 0.5 π i E ( S ) e τ t N d 2 ς ; 0.5 < π i 1 ,
where ς represents the natural disaster insurance subsidy, the “ + ” sign represents providing the subsidy, and the “ ” sign represents receiving the subsidy. Furthermore, π i is the disaster potential index in each region. While d 2 is formulated as follows:
d 2 = l n R 0 R T + τ σ 2 2 t σ t .
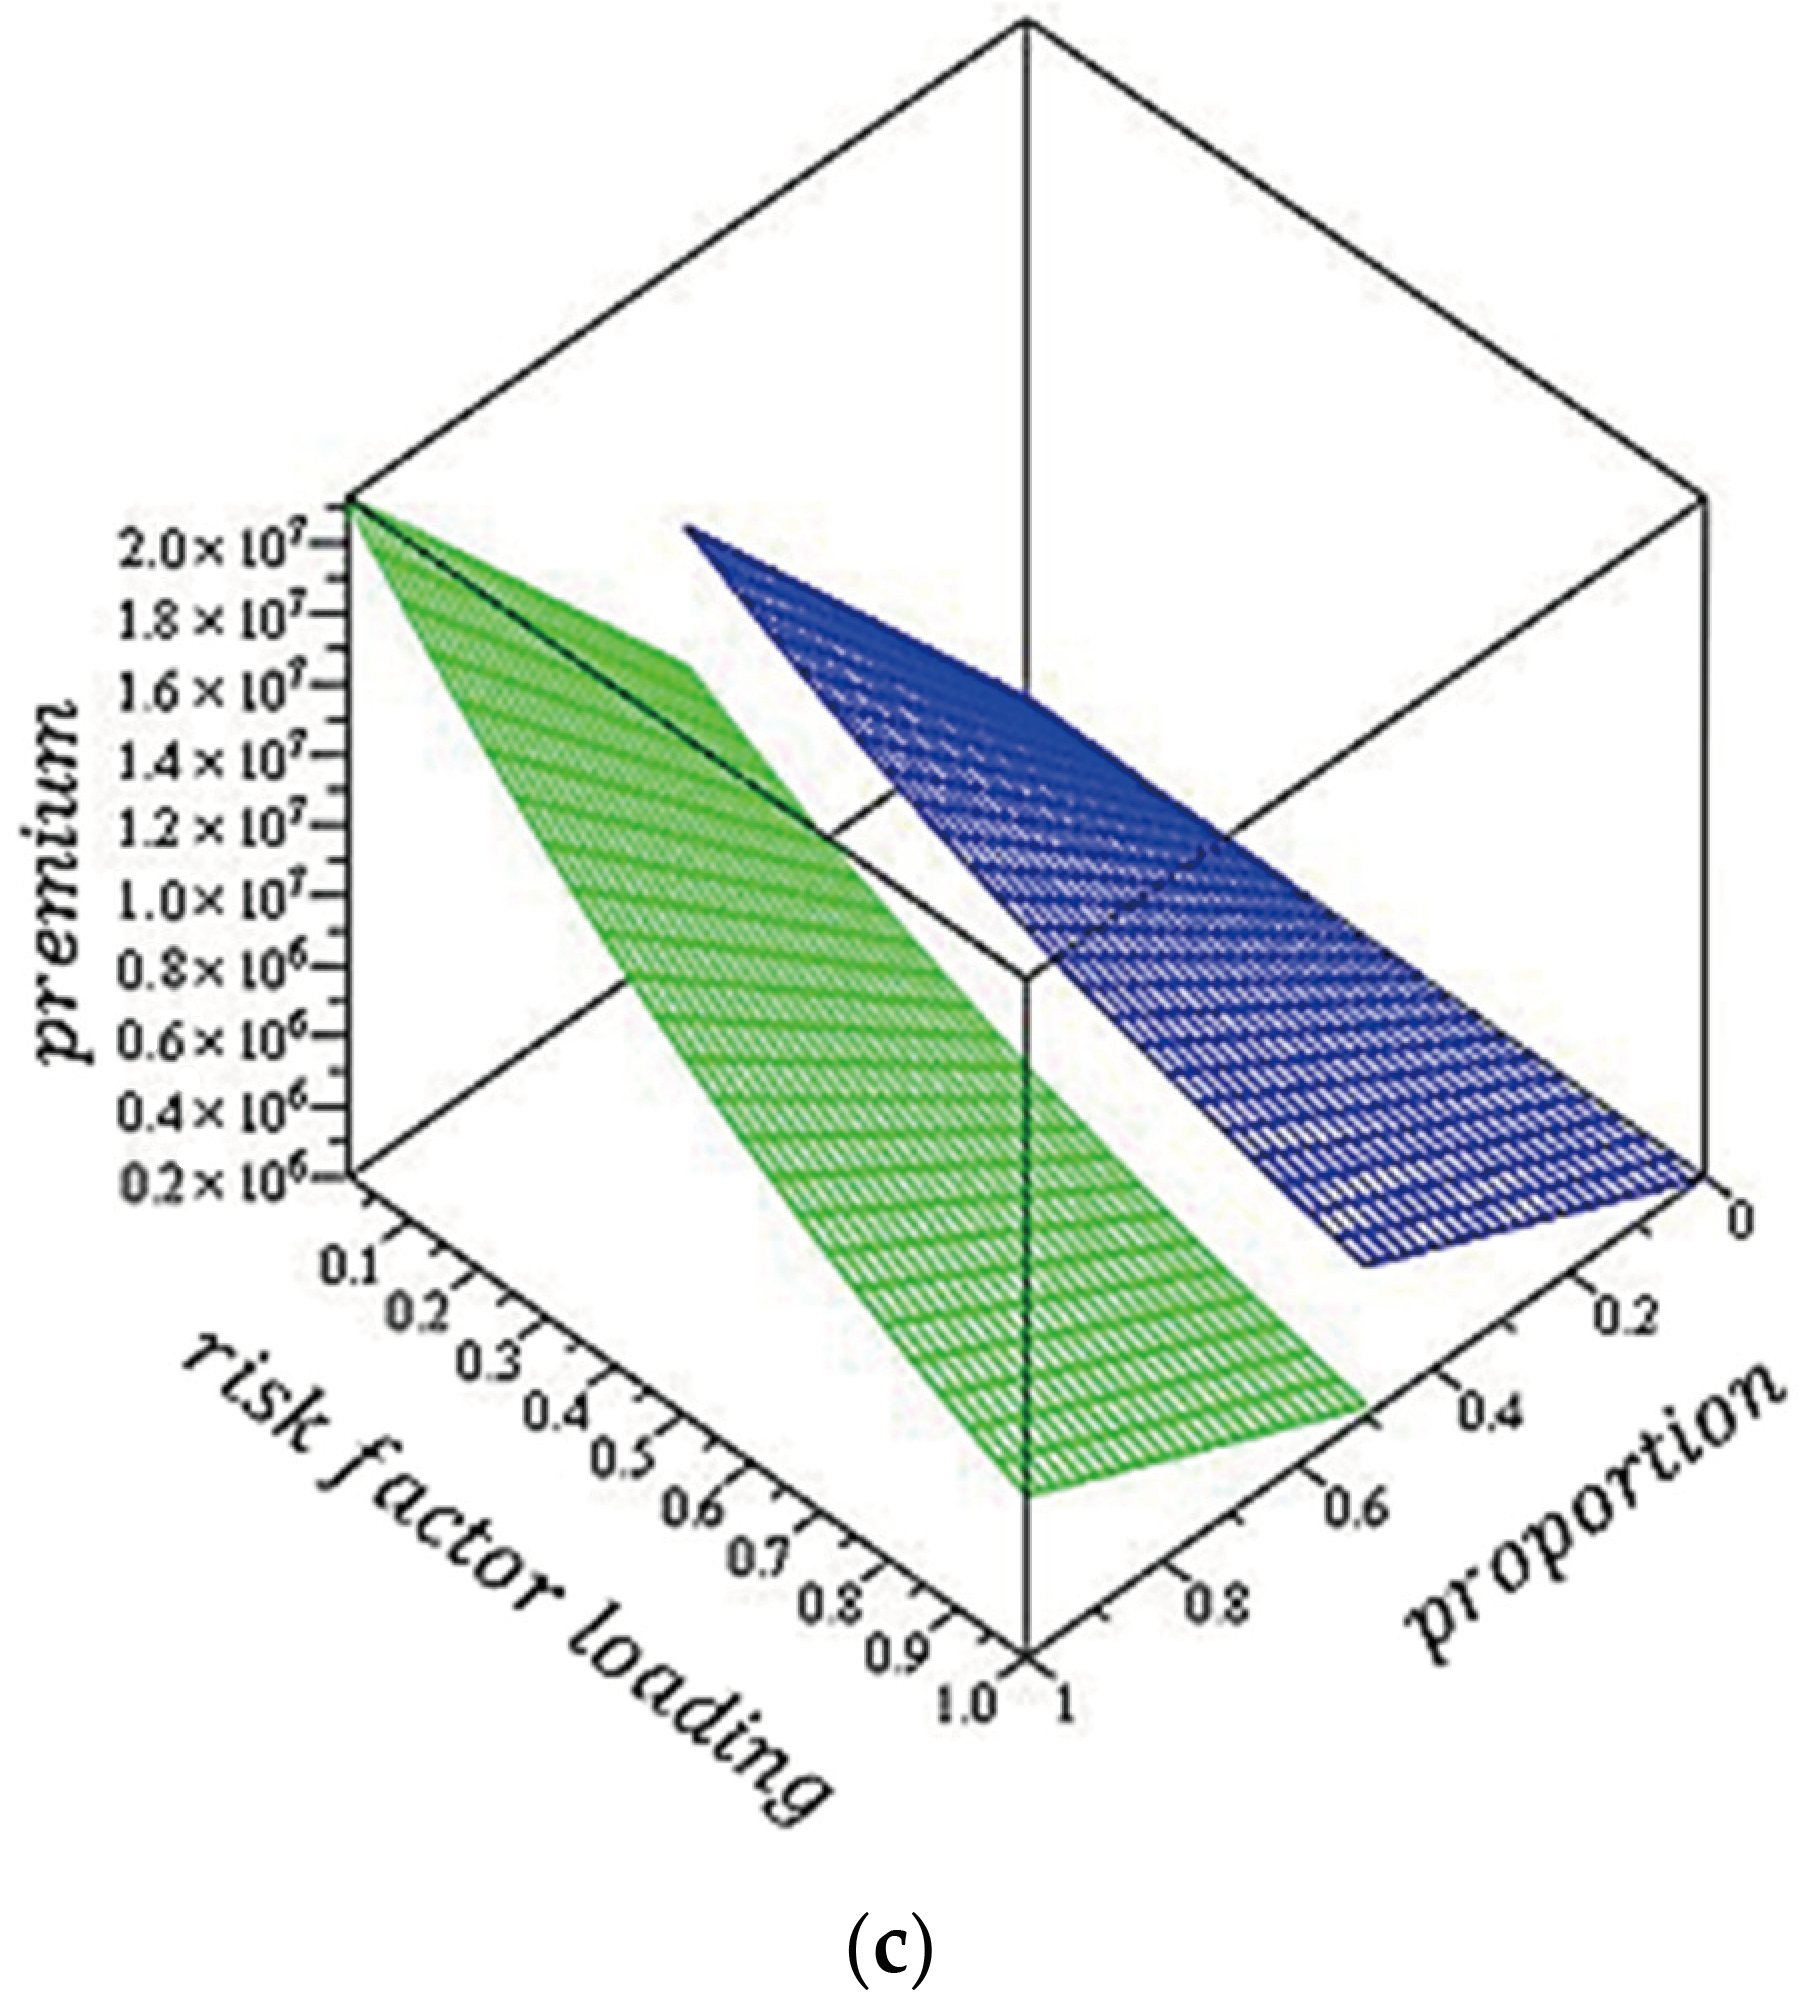
Based on Equation (25), numerical simulations were carried out to obtain results as given in Figure 1.
Figure 1 illustrates the distribution of points for natural disaster insurance premiums. Figure 1c depicts the intersection of insurance premiums. This intersection is impacted by the cross-subsidy system, which introduces deductions for receiving subsidies and additions for giving subsidies into the premium calculation. Subsidy-providing regions are indicated by the shading of insurance premium distribution points in blue. Meanwhile, the insurance premium distribution points that are shaded green are areas that receive subsidies.
Assume that each area’s economic growth rate ( γ i ) is considered while developing the model. Under such circumstances, Equation (27) can be used to build the Black–Scholes model for calculating insurance premiums using the rate of economic growth as follows:
P B S i * = π i E S e τ t N d 2 + γ i ς ; 0 π i 0.5 ;   γ i 5 % π i E S e τ t N d 2 ; 0.5 < π i 1 ;   γ i 5 % a t a u   0 π i 0.5 ; γ i < 5 % π i E S e τ t N d 2 γ i ς ; 0.5 < π i 1 ; γ i < 5 %
where d 2 is formulated as follows:
d 2 = l n R 0 R T + τ σ 2 2 t σ t .
Based on Equation (27), collective risk expectations E(S) are related to natural disaster conditions. This includes factors such as the frequency and losses of natural disasters. This collective risk cannot be avoided, so it needs to be taken into account in determining insurance premiums. Furthermore, based on the premium model of natural disaster insurance in Equation (27), a numerical simulation is carried out to show the point distribution of disaster insurance premiums. The results of the numerical simulation of model Equation (27) are given in Figure 2.
Three sections make up the distribution points of insurance premiums, as shown in Figure 2. The places at the top of the distribution points for natural disaster insurance premiums (blue) are considered subsidy-producing zones because they have a high natural disaster potential index with a low economic growth rate. Places with a low risk of natural disasters and slow rates of economic development or places with a high risk of natural disasters and rapid economic growth rates are the middle points of the natural disaster insurance premium distribution (green). One may alternatively characterize this situation as one in which no subsidies are given or received. Subsidized regions are those with poor rates of economic development and a high probability of natural disasters; the red areas on the distribution curve of natural disaster insurance premiums show these areas. It is evident from Figure 2 that the likelihood of natural disasters influences disaster insurance rates. An increased insurance premium for natural disasters with a higher potential index is required.
Subsequently, development is conducted in accordance with Equation (27) by incorporating the loss distribution model and transitioning from natural disaster occurrences. Three conditions must be met for the insurance premium to be calculated correctly. These are that events must follow a Poisson process with jumping events and that economic losses must be estimated using a normal distribution model that takes economic growth into account. The aforementioned are (1) 0 π i 0.5 ;   γ i 5 % ; (2) 0.5 < π i 1 ;   γ i < 5 % ; and (3) 0.5 < π i 1 ;   γ i 5 %   or   0 π i 0.5 ;   γ i < 5 % .
1.
The conditions 0 π i 0.5 and γ i 5 % .
For this condition, the following equation applies:
P [ B S ] i * = π i E ( S ) e τ t N d 2 + γ i ς .
Employing Equation (7), as well as for the subsidy ς = π i E ( X ) in Equation (29), this equation can be rewritten into Equation (30) as follows:
P [ B S ] i * = π i E Y E X e τ t N d 2 + γ i π i E X ,
where E(X) is the risk of loss due to natural disasters. Furthermore, by using Equation (2) in Equation (30), it can be reformulated into (31) as follows:
P B S i * = e τ t N d 2 π i λ N λ Z t λ X + π i γ i λ X , = π i e τ t N d 2 λ N λ Z t λ X + γ i λ X , = π i λ X λ N λ Z t e τ t N d 2 + γ i .
2.
The conditions 0.5 < π i 1 and γ i < 5 % .
For this condition, the following equation applies:
P [ B S ] i * = π i E ( S ) e τ t N d 2 γ i ς .
Employing Equation (7), as well as for the subsidy ς = π i E ( X ) in Equation (32), this equation can be rewritten into Equation (33) as follows:
P [ B S ] i * = π i E Y E X e τ t N d 2 γ i π i E X .
Furthermore, by using Equation (2) in Equation (33), it can be reformulated into (34) as follows:
P [ B S ] i * = e τ t N d 2 π i λ N λ Z t λ X π i γ i λ X , = π i e τ t N d 2 λ N λ Z t λ X γ i λ X , = π i λ X λ N λ Z t e τ t N d 2 γ i .
3.
The conditions 0.5 < π i 1 and γ i 5 % or 0 π i 0.5 and γ i < 5 % .
For this condition, the following equation applies:
P [ B S ] i * = π i E ( S ) e τ t N d 2 .
Employing Equation (7), as well as for the subsidy ς = π i E ( X ) in Equation (35), this equation can be rewritten into Equation (36) as follows:
P [ B S ] i * = π i E Y E X e τ t N d 2 .
Furthermore, by using Equation (2) in Equation (36), it can be reformulated into (37) as follows:
P B S i * = π i λ N λ Z t λ X e τ t N d 2 .
Based on these three conditions, we obtained the premium model of natural disaster insurance given in Equation (38) as follows:
P B S i * = π i λ X λ N λ Z t e τ t N d 2 + γ i ; 0 π i 0.5 ;   γ i 5 % π i λ N λ Z t λ X e τ t N d 2 ; 0.5 < π i 1 ;   γ i 5 % o r   0 π i 0.5 ; γ i < 5 % π i λ X λ N λ Z t e τ t N d 2 γ i ; 0.5 < π i 1 ; γ i < 5 % ,
where
d 2 = l n R 0 R T + τ σ 2 2 t σ t .
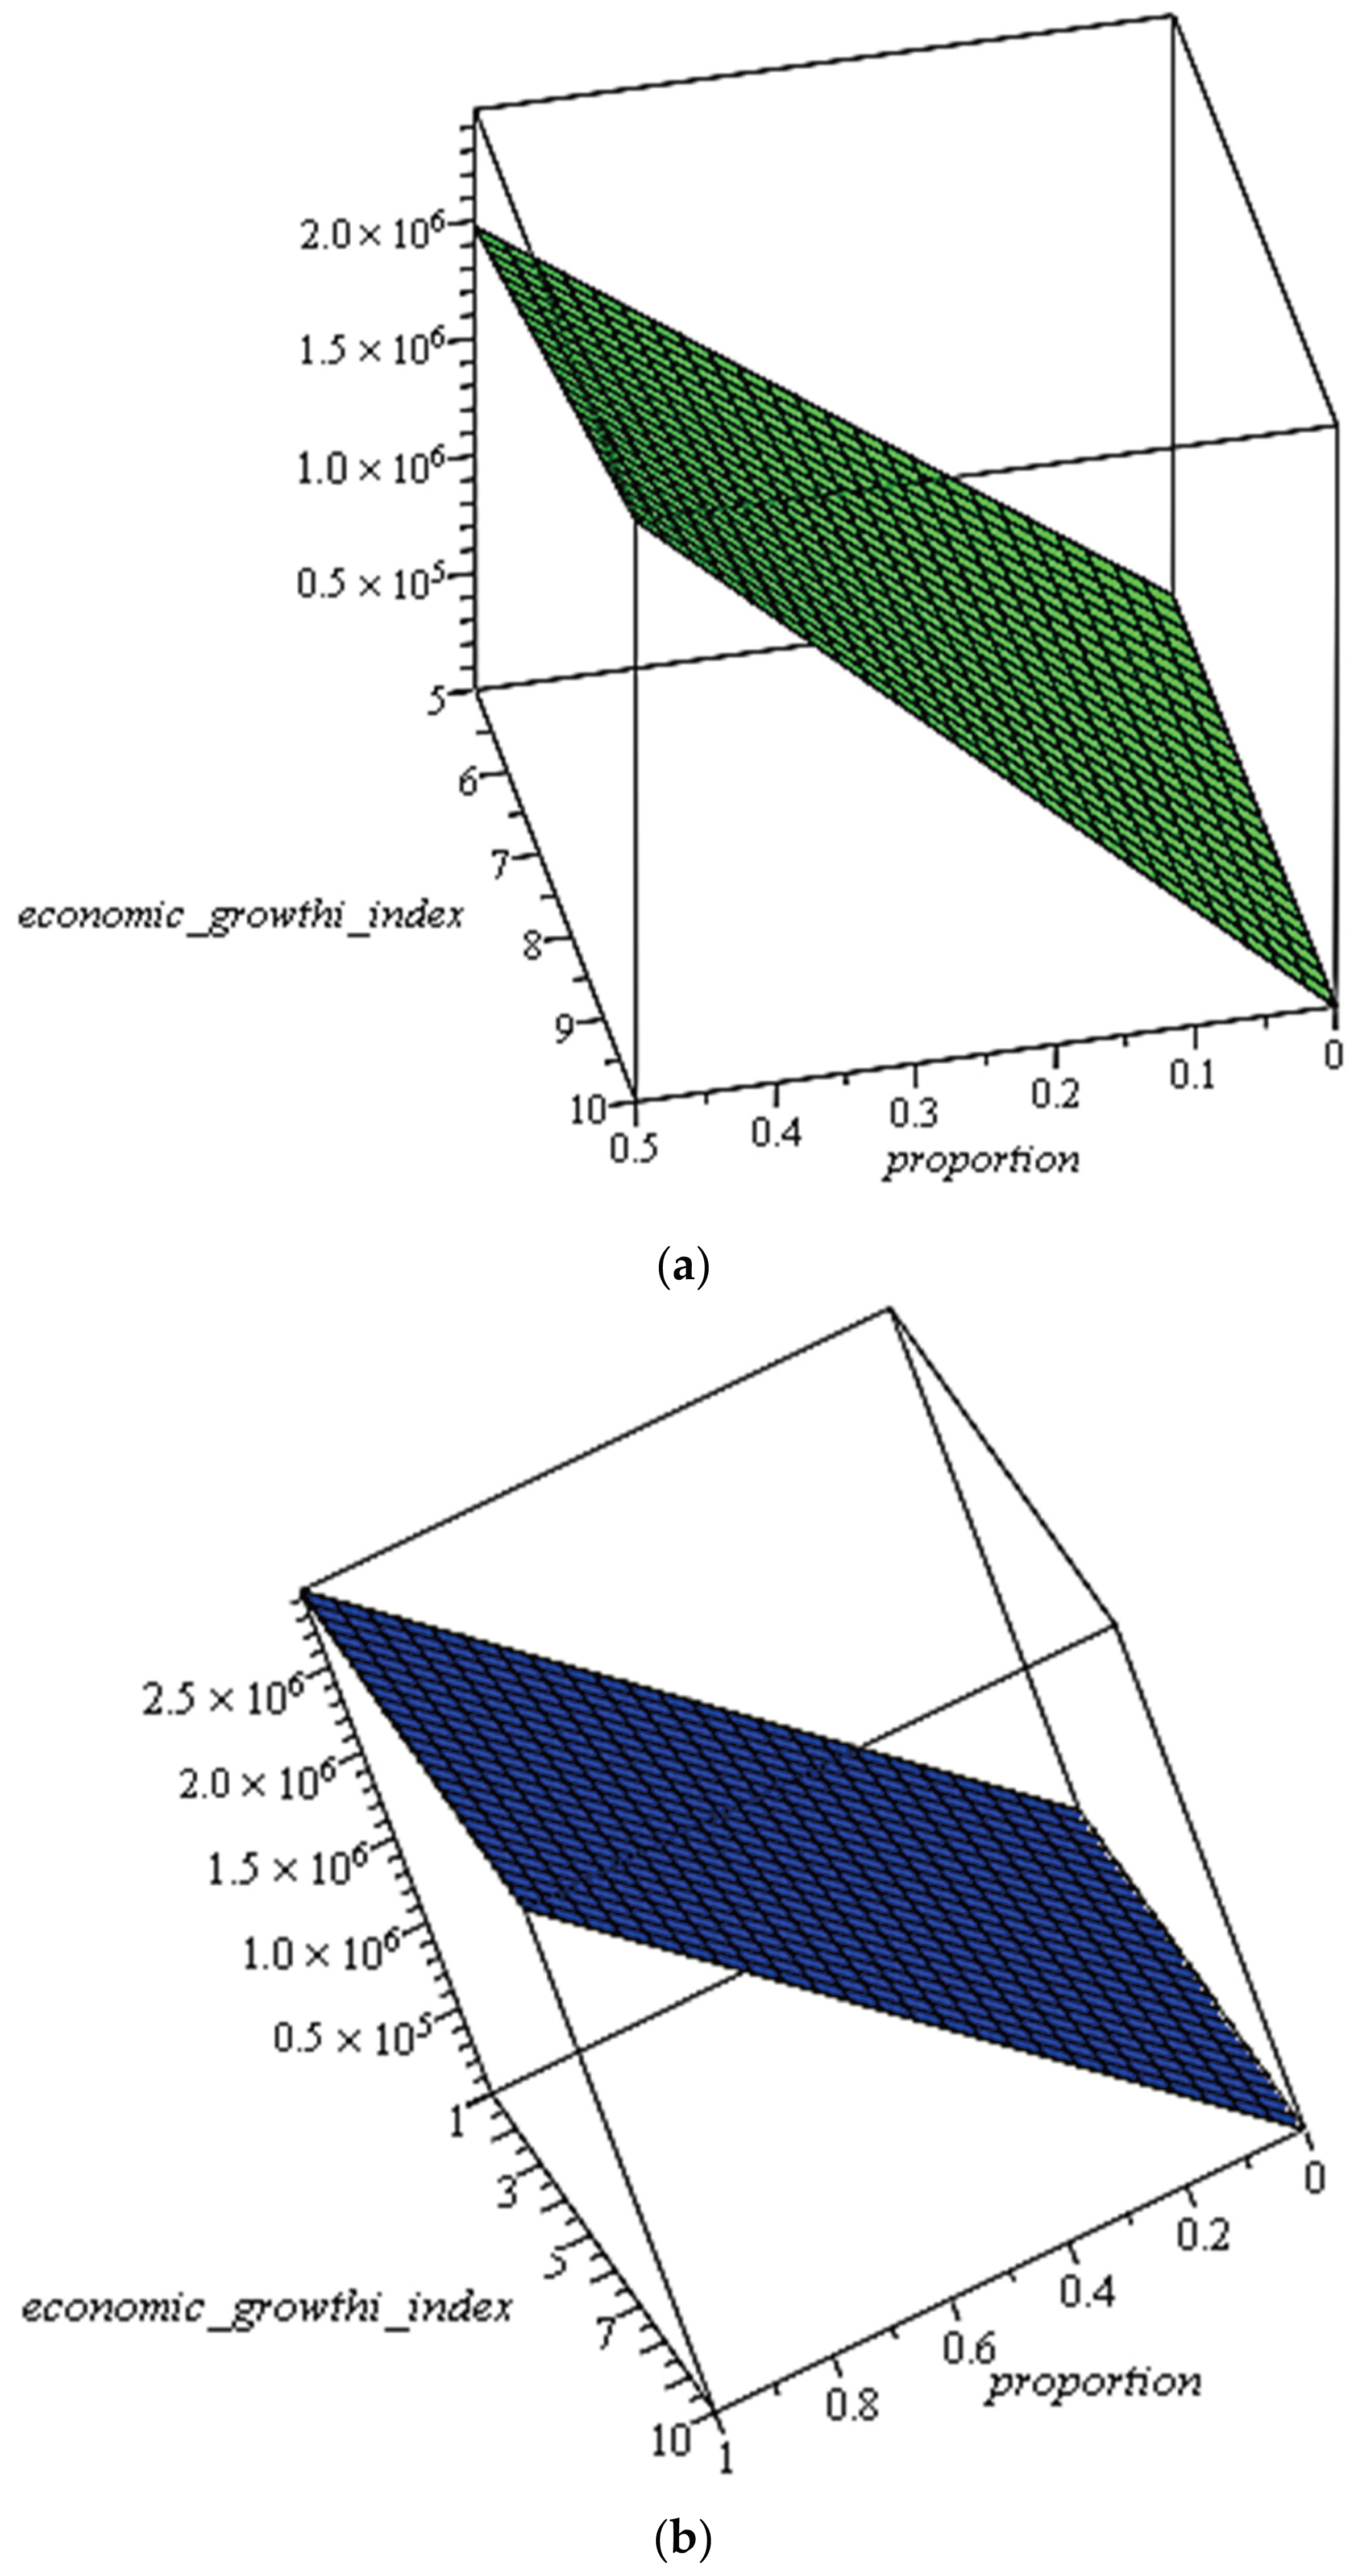
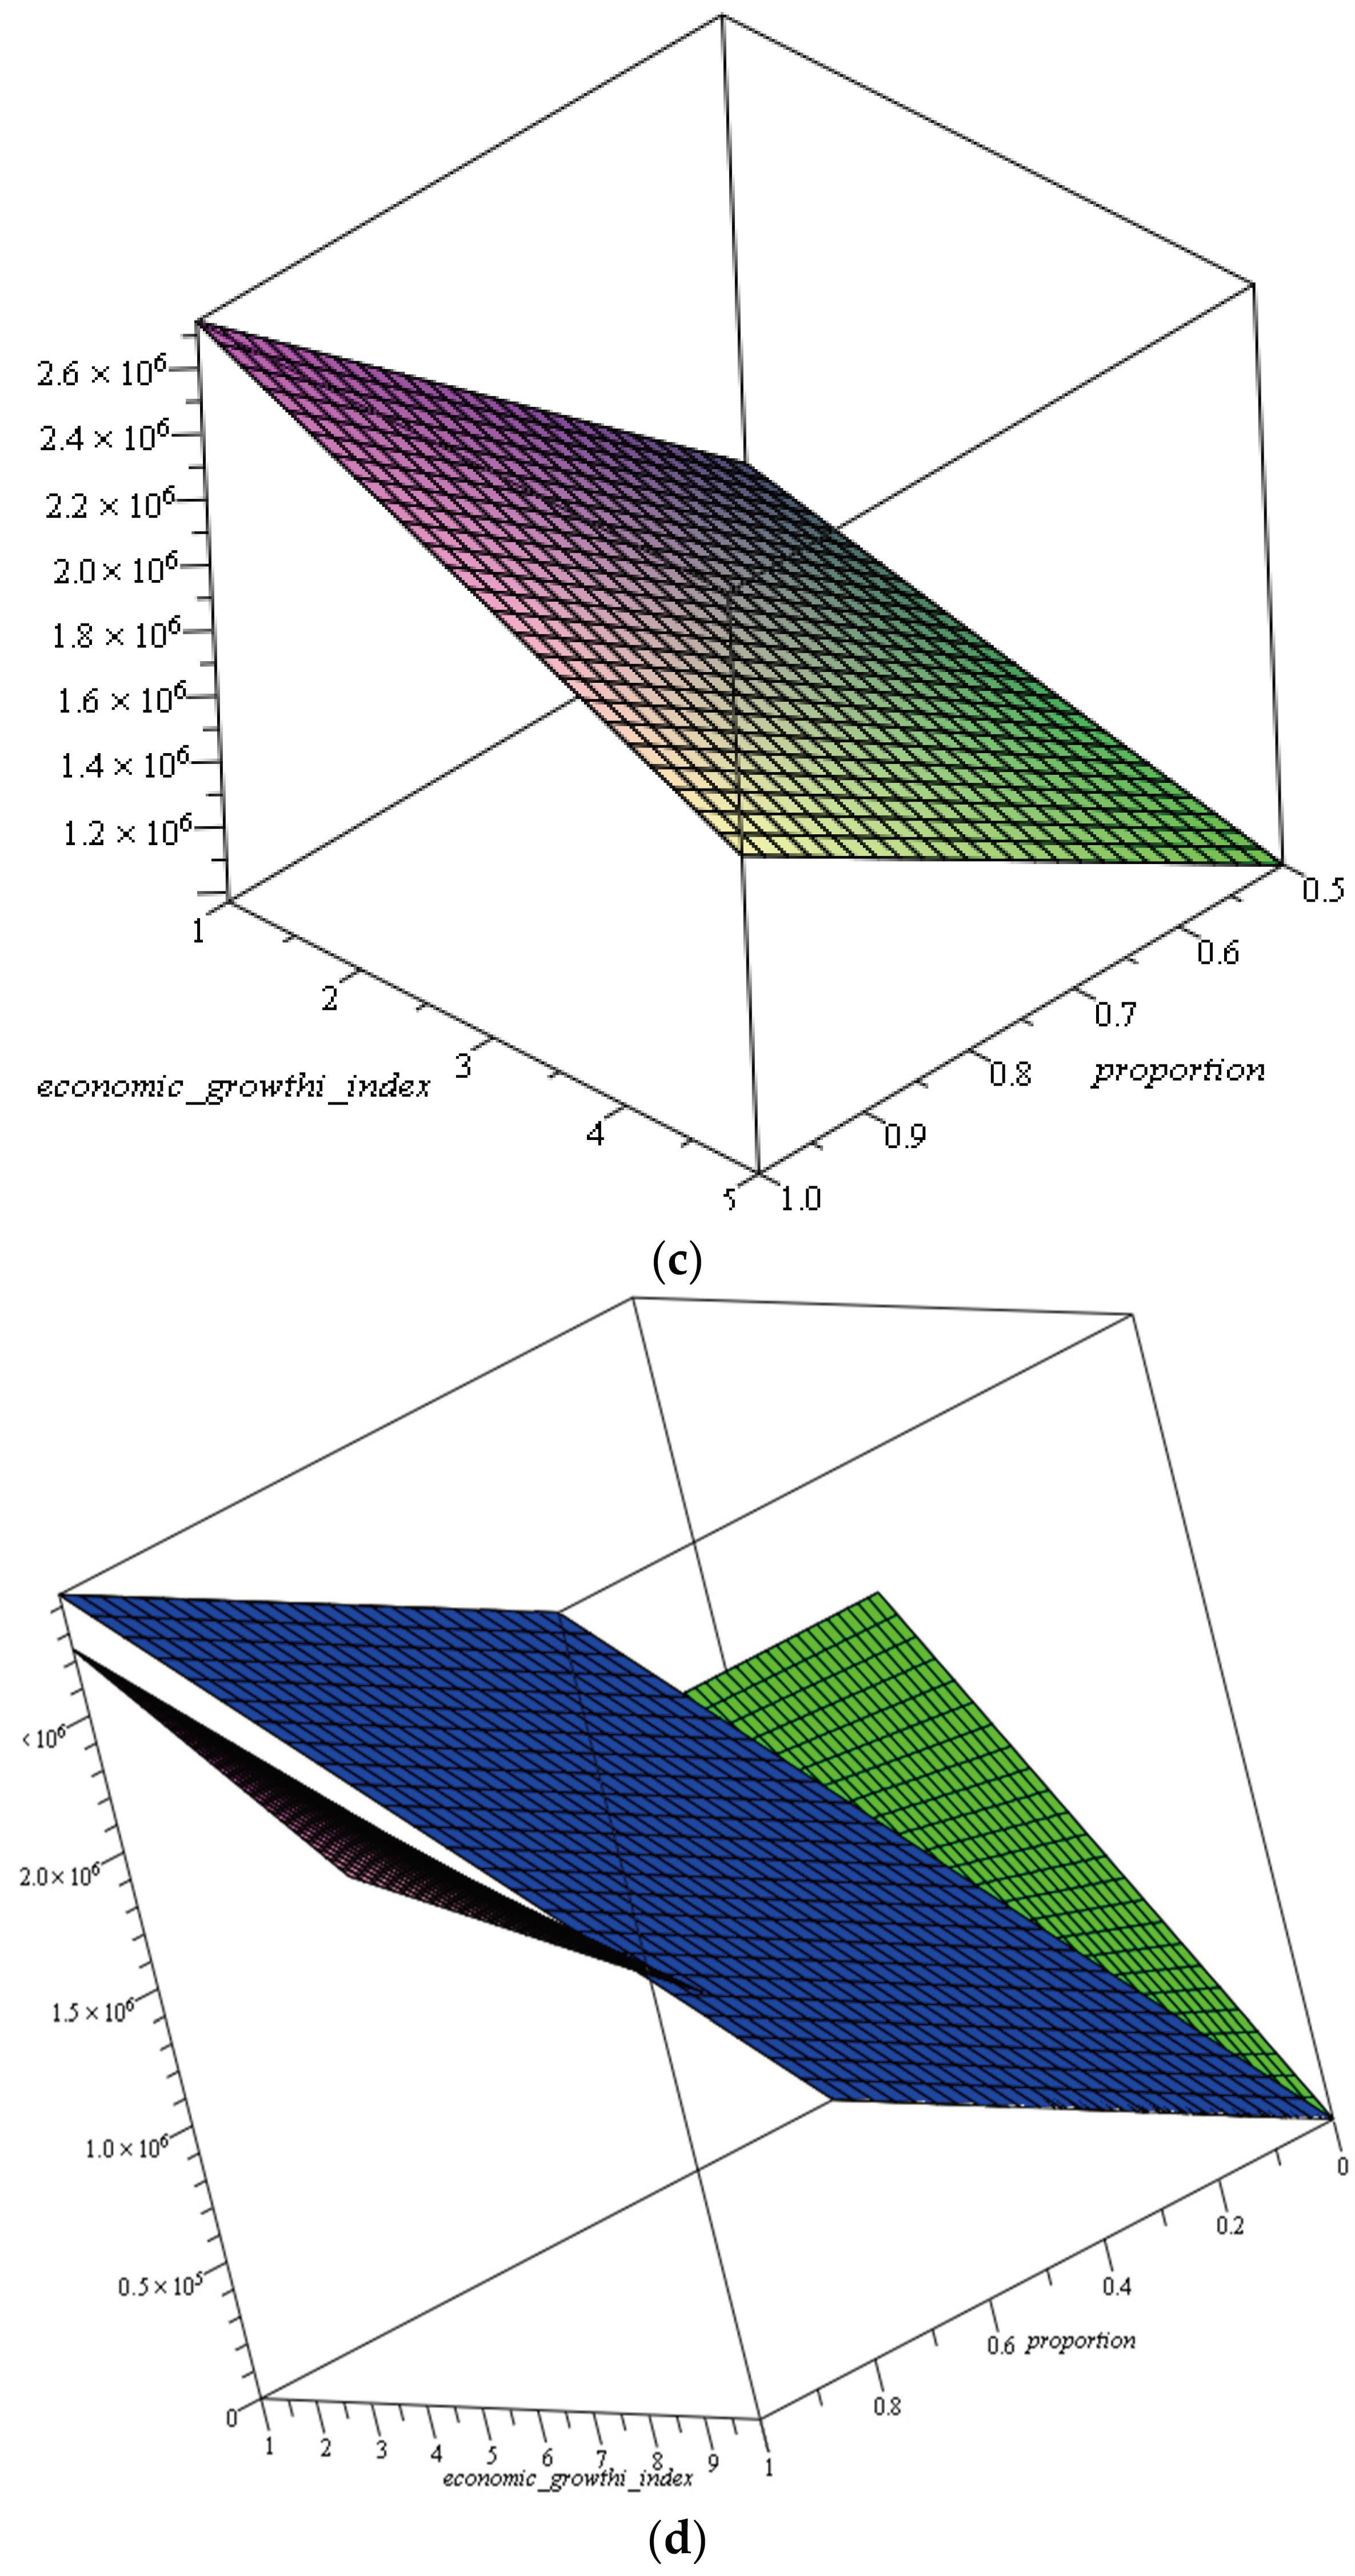
Based on the equation function of the premium model of natural disaster insurance in Equation (38), a numerical simulation is carried out to show the area of points that form the premium of natural disaster insurance. The numerical simulations are based on the variables of the proportion of economic growth and the natural disaster indices, and the other variables are considered constant. Figure 3 illustrates the results of the numerical simulations carried out.
In accordance with three conditions, Figure 3 partitions the overall distribution of points for disaster insurance premiums. The magnitude of the disaster proportion index and the economic growth index exert an influence on the allocation of premium points for disaster insurance. An area’s mandatory insurance premiums will increase proportionately with the disaster proportion index. A rise in the regional economic development index may have a comparable effect on mitigating the impact of the mandatory insurance premium increase.

3.2. Black–Scholes Model Simulation on the Natural Disaster and Economic Growth Rate Data

The model was simulated using the data specified in Equation (38), which comprised natural disaster occurrences and losses, natural disaster potential indices, and economic growth rates for 34 provinces in Indonesia. Table 1 provides a concise summary of the average estimation results derived from the data utilized in all provinces of Indonesia.
Table 1 maps the 34 provinces of Indonesia into three categories: First, regions with strong economic development and low risk of natural disasters, which will provide subsidies 0 π i 0.5 ;   γ i 5 % . Second, subsidies will not be given or received in places with low economic growth and low potential for natural disasters or in areas with strong economic growth potential and high potential for natural disasters 0.5 < π i 1 ;   γ i 5 % . Third, subsidies will be given to locations 0 π i 0.5 ;   γ i < 5 % that have a high probability of natural disasters and poor rates of economic development. According to Table 1’s requirements, up to 19 out of Indonesia’s 34 provinces use a system for figuring insurance rates that neither provides nor accepts subsidies. In addition, 10 provinces have put a system in place where insurance rates are decided upon via the receipt of subsidies. The insurance rates in the other five provinces are set by means of subsidies.
The simulation using the Black–Scholes model for determining the premiums of natural disaster insurance refers to Equation (38). Meanwhile, the data makes use of Table 1, which are estimated data. The risk factor loading level used in this simulation is 1%. The premium burden incurred by the relevant party increases with the value of the risk loading factor. Therefore, the risk factor loading must be maintained so that it does not exceed the specified tolerance limit, for which determination is based on the Indonesian government’s regulations which are in the range of 0.1–1%. Table 2 presents insurance premiums from 34 Indonesian provinces based on the analysis’s findings.
Each Indonesian province has a different disaster insurance premium calculation, which is based on the data in Table 2. The kind and frequency of disasters that strike each province have an impact on them. The insurance company bears a greater risk of loss in the event of more frequent and severe disasters. As a result, the rates for disaster insurance will be modified based on the degree of risk in each province. In this simulation, insurance premiums for natural disasters that affect each province in Indonesia are determined using three categories: regions that provide subsidies, regions that do not provide or receive subsidies, and regions that do receive subsidies.

4. Discussion

The Black–Scholes model is applicable to the calculation of insurance premiums due to the comparable characteristics exhibited by insurance and options. A contract in which the buyer is granted the right but not the obligation to purchase or sell an asset at a predetermined price is known as an option. Insurance is a contract that grants the policyholder the right to receive insurance funds in the event of a disaster occurrence, such as a natural disaster. By employing the Black–Scholes model to calculate insurance premiums, it is anticipated that more optimal insurance premiums can be generated in consideration of field conditions. A multitude of variable factors that impact the calculation of insurance premiums are incorporated into the developed model. In developing the model, factors including the disaster potential index, the frequency of natural disaster occurrences and losses, and the economic growth rate in 34 provinces of Indonesia are taken into account. The developed model also incorporates a cross-subsidy mechanism. The insurance premium determination model’s cross-subsidy system can assist regions with a low economic growth rate and a high potential risk index for natural disasters in obtaining insurance coverage at a lower cost. The cross-subsidy system reduces insurance premiums in regions with high economic growth and a low natural disaster risk potential index by utilizing a portion of insurance premiums from regions with a low natural disaster risk potential index and high economic growth.
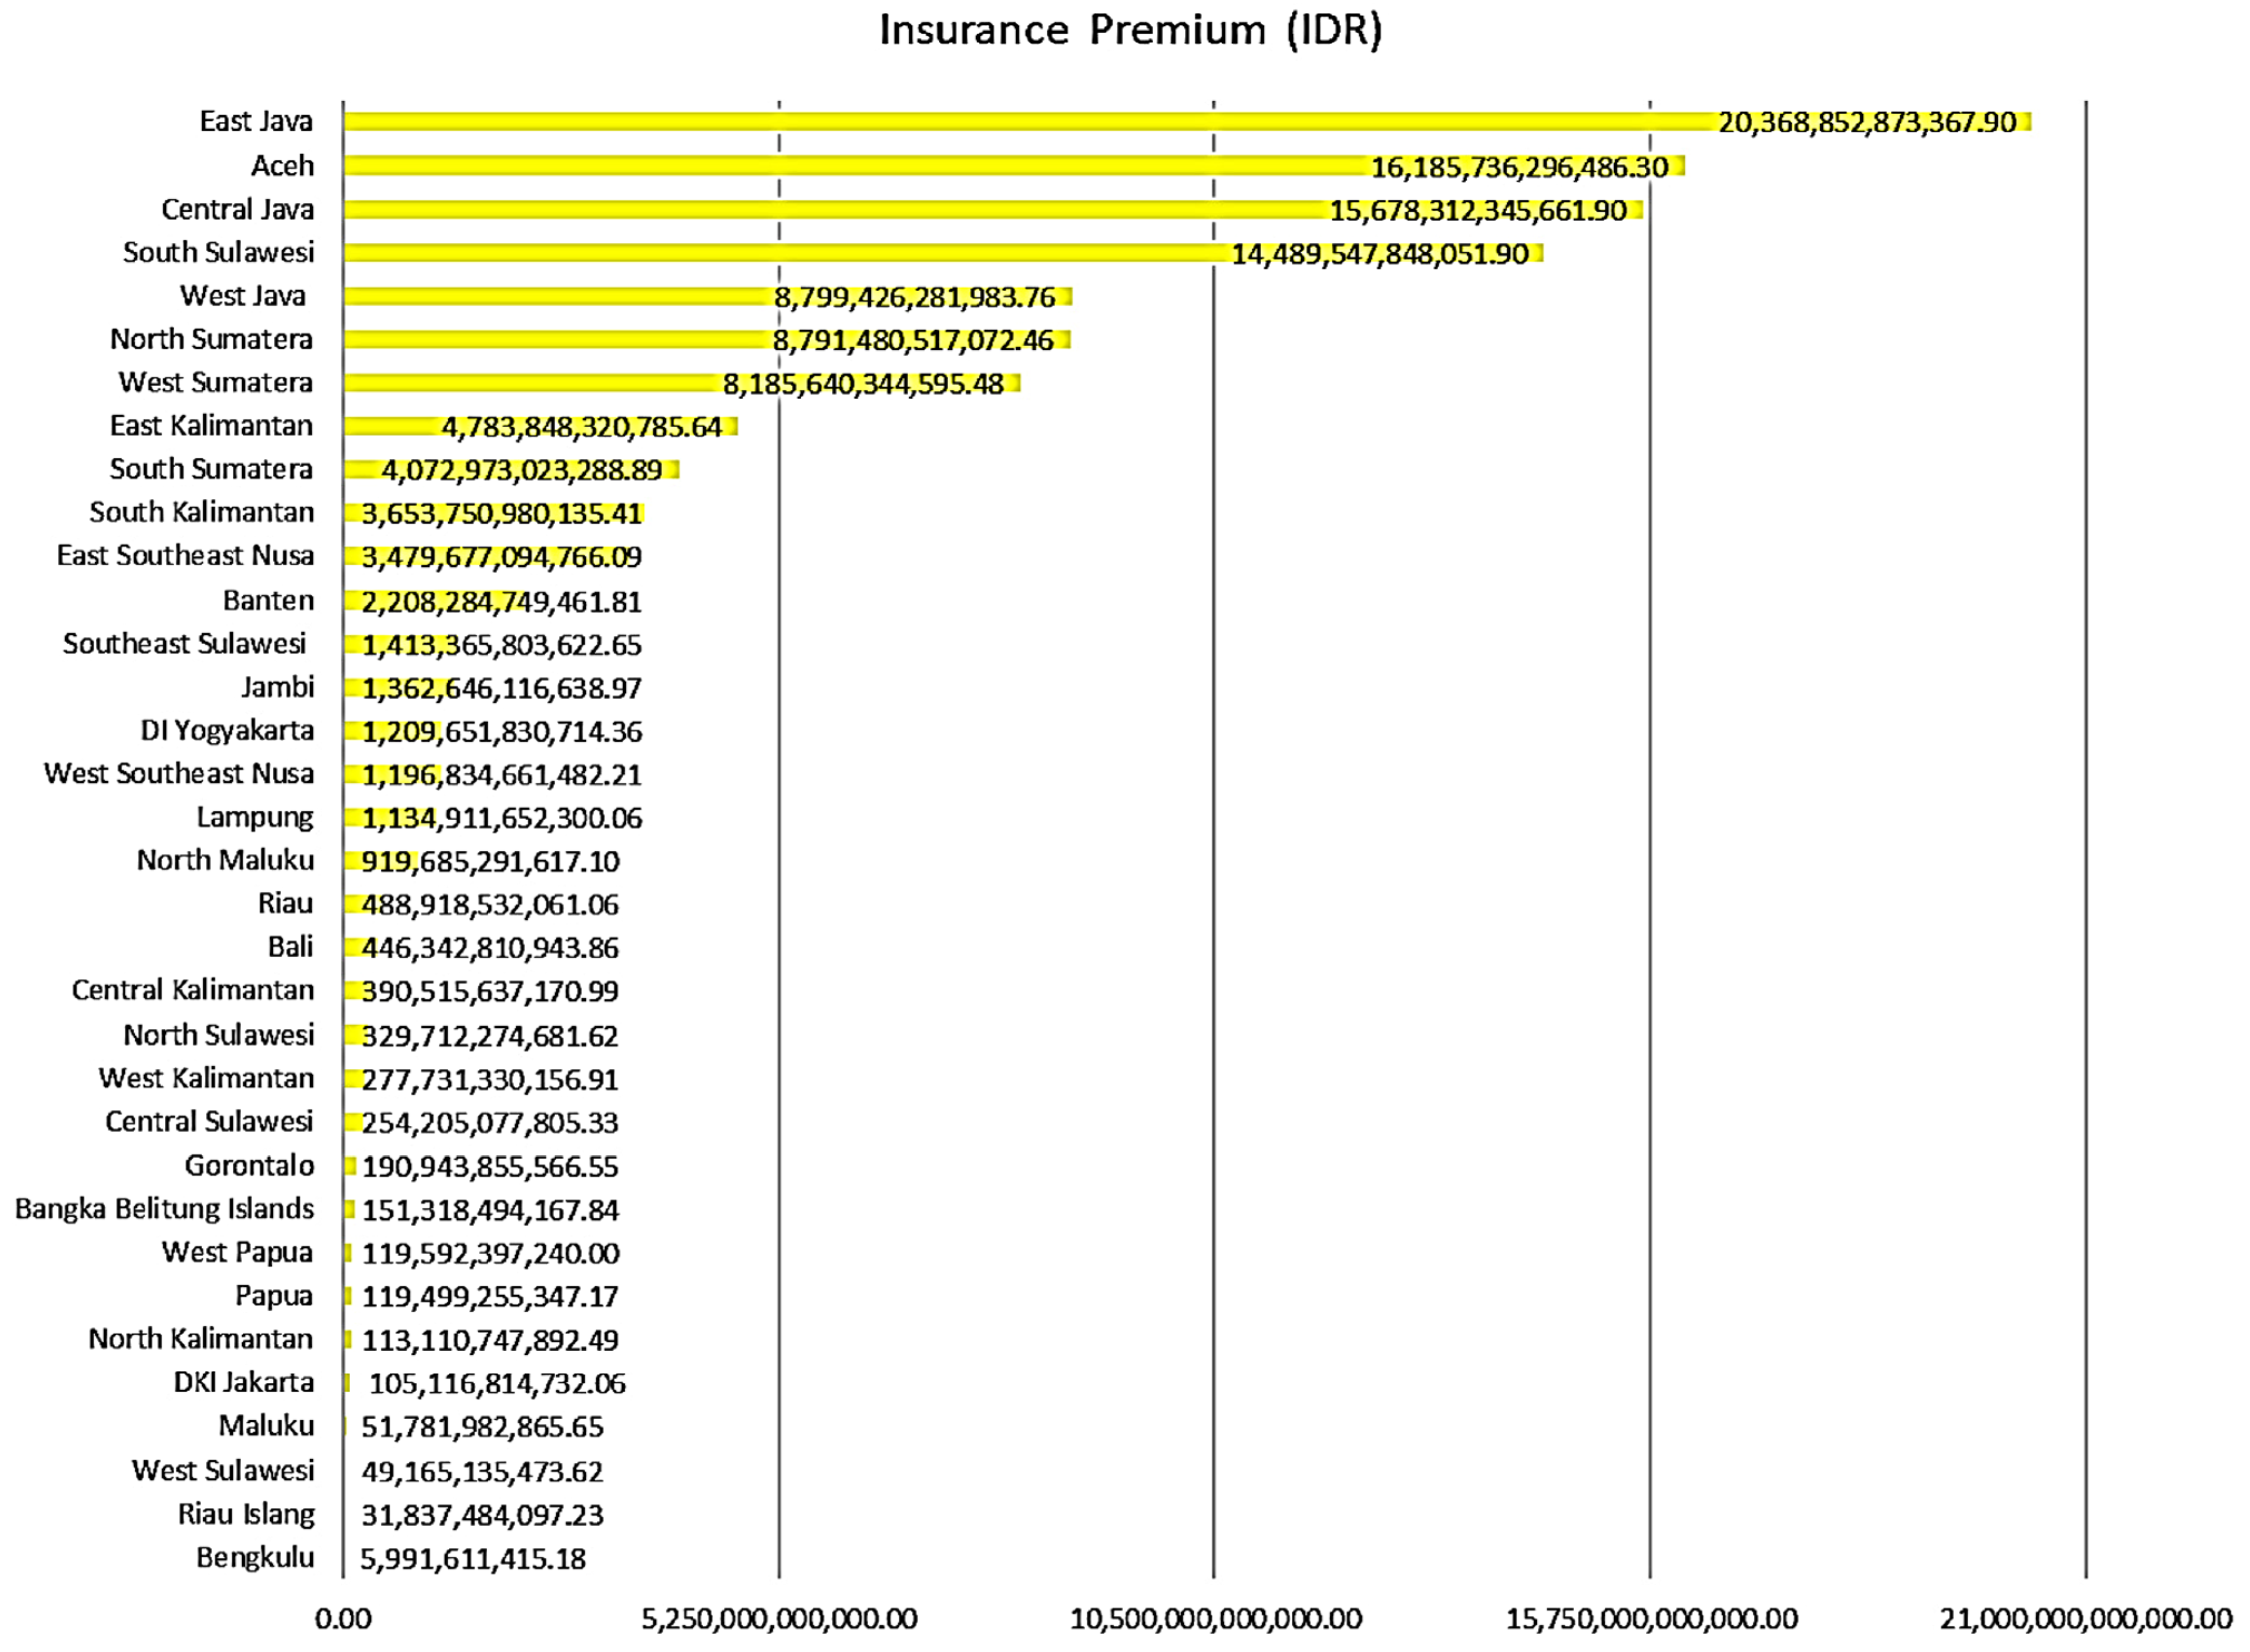
The Black–Scholes model that has been developed has advantages over other insurance premium determination models. The developed model has considered jumping processes so that it can accommodate extreme events against natural disasters that often occur in Indonesia. In addition, the premium determination model has also implemented a cross-subsidy system, which considers the conditions in the field. The cross-subsidy system means that areas that have a high risk of natural disasters and low economic growth will receive a reduction (receive a subsidy) for the insurance premium to be paid. Furthermore, areas that have a low risk of natural disasters and have high economic growth will be taxed (provide a subsidy) for insurance premiums. Of course, this developed model can help regions with the burden of large insurance premiums due to the risk of natural disasters being high. In general, the model developed in this study has advantages, first in determining premiums considering random jumps, which denote natural disaster events in Indonesia. Second, in terms of economy, for areas with high natural disaster cases, while the economic growth rate is low, it is necessary to receive subsidies from other areas with high economic growth while the risk of natural disasters is low. The determination of natural disaster insurance premiums by considering the level of economic growth in each region has not been carried out by previous researchers. As depicted in Figure 4, it was determined, through the execution of simulations, that the insurance premiums for each province varied.
As seen in Figure 4, there are significant differences in the insurance premium comparisons across all Indonesian provinces. A number of provinces have relatively high insurance premiums, while a number of other provinces have relatively low insurance premiums. After analyzing the data, it is clear that East Java pays the highest insurance premium in comparison to other provinces, with an IDR 20,368,852,873,367.90 required for payment. Comparing other provinces with a premium of IDR 5,991,611,415.18 that needs to be paid, Bengkulu province has the lowest premium. The primary factor influencing the amount of insurance premiums for natural disasters is the frequency of events and the extent of loss resulting from localized natural disasters. The insurance premiums that Indonesian provinces are required to pay differ. The most critical factor in determining insurance premium amounts is the frequency of disaster events and losses. The province is required to pay an insurance premium that increases with the frequency of natural disasters and losses.
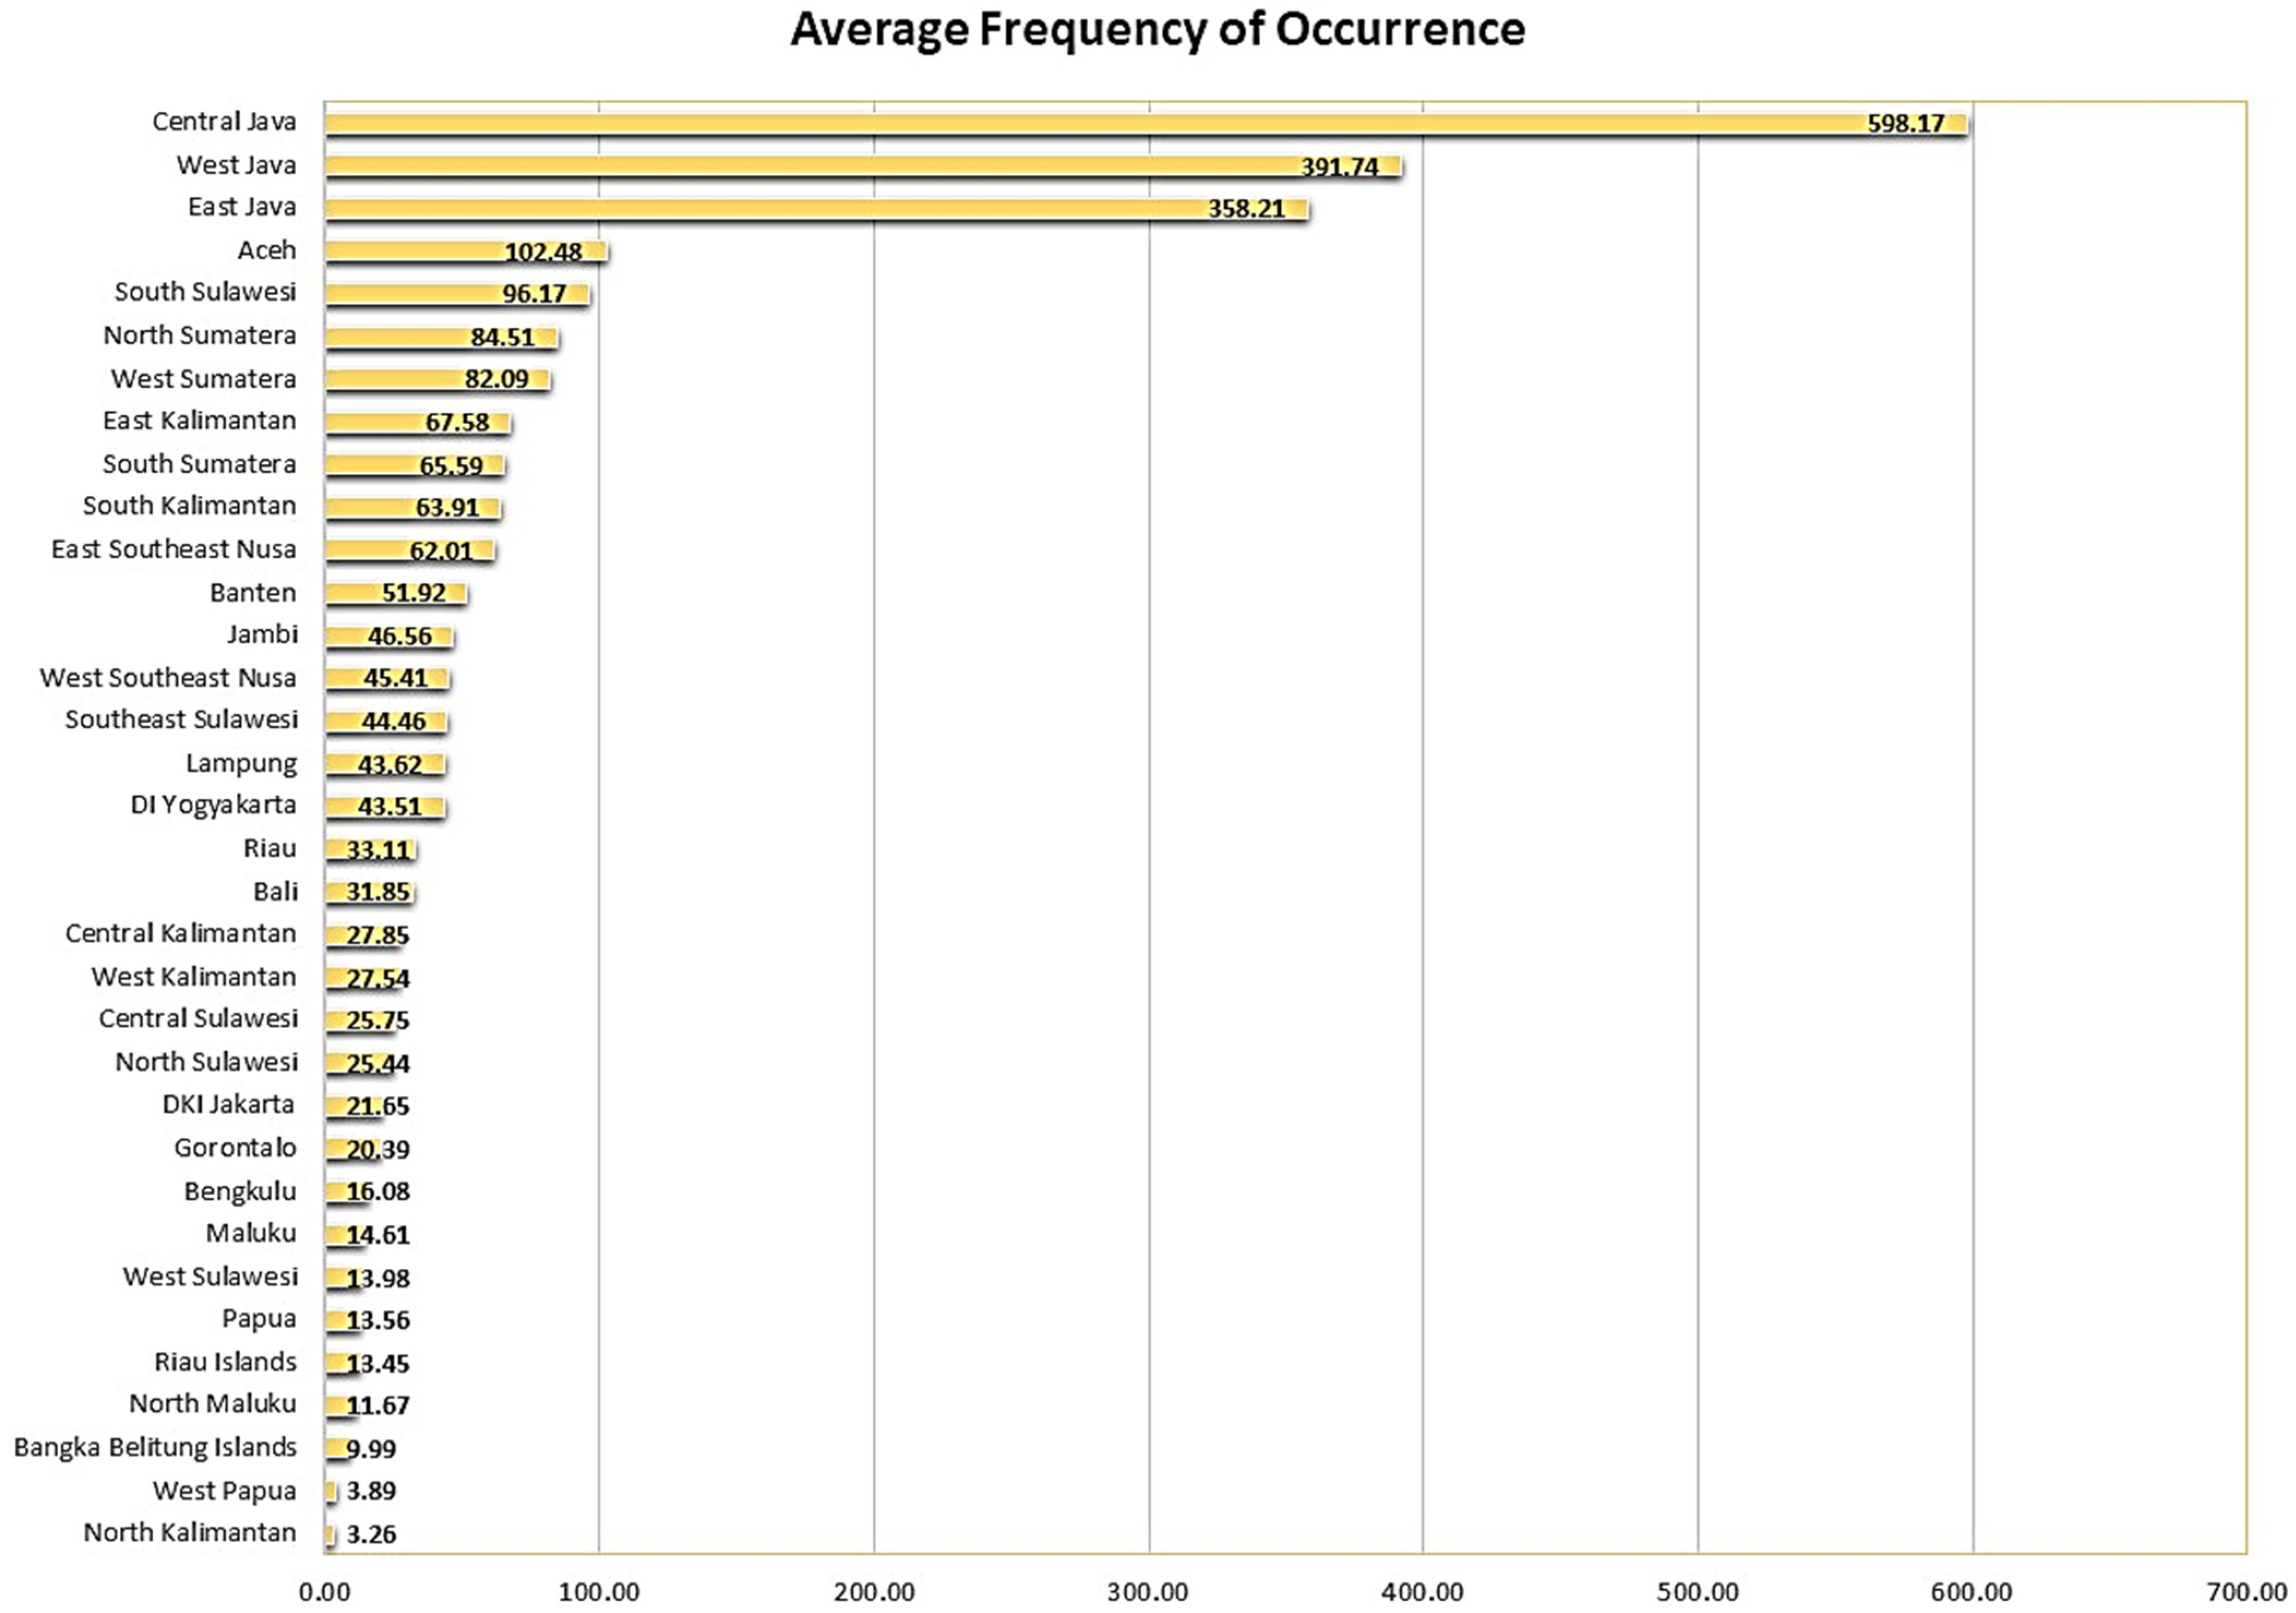
Based on Figure 5, it can be seen that the four provinces with the highest frequency of disaster are the provinces of Central Java, West Java, East Java, and Aceh. Furthermore, compared to Figure 4, it can be seen that the provinces with the largest insurance premiums are the provinces of East Java, Aceh, Central Java, and South Sulawesi. It can be said that the frequency of natural disasters certainly has a significant impact on the calculation of natural disaster insurance premiums.

5. Conclusions

The development of research in formulating models for determining disaster insurance premiums has become an exciting and relevant topic. Seeing that climate change is occurring, the potential for natural disasters has increased. Natural disasters can cause significant losses to areas affected by the disaster. The premium determination model is an essential component in natural disaster insurance because it determines how much benefit the company can receive if a claim occurs. Insurance premiums must also be set relatively and in accordance with the level of risk faced by the customer. In modelling disaster insurance premiums, this research uses a mathematical and statistical model to describe the relationship between variables that influence the amount of insurance premiums. The Black–Scholes model considers factors such as the frequency and intensity of natural disasters, the value of economic losses, the economic growth rate, and geographic conditions. Apart from that, the model developed uses a cross-subsidy system. In this model, the mapping is based on economic growth and potential disasters in each region. The model developed is very suitable for countries where the mapping of potential natural disasters is divided based on each region. Based on the simulation results on natural disaster data in Indonesia, insurance premiums from 34 provinces in Indonesia vary. This phenomenon is, of course, influenced by the frequency of events and economic losses due to natural disasters that occur in each province. For future research, it is recommended to include a sensitivity analysis of model parameters to verify the robustness of the model. Of course, with a sensitivity analysis of model parameters, we can identify risks and uncertainties in the model. By evaluating how changes in input variables affect the results, we can anticipate potential risks.

Author Contributions

Conceptualization, T.P. and Y.H.; methodology, S. (Sukono); software, K.; validation, T.P., Y.H., and S. (Sukono); formal analysis, S. (Sukono); investigation, K.; resources, K.; data curation, K.; writing—original draft preparation, R.A.I.; writing—review and editing, R.A.I.; visualization, K.; supervision, T.P.; project administration, S. (Subiyanto); funding acquisition, T.P. All authors have read and agreed to the published version of the manuscript.

Funding

This research was funded by the Ministry of Education, Culture, Research and Technology of the Republic of Indonesia in 2023, grant number 3018/UN6.3.1/PT.00/2023.

Data Availability Statement

Data are included within the article.

Acknowledgments

We would like to thank the Ministry of Education, Culture, Research and Technology of the Republic of Indonesia, and Universitas Padjadjaran funded the article processing charge.

Conflicts of Interest

The authors declare no conflicts of interest.

References

  1. Acha, Ikechukwu, and Mfon Sampson Ukpong. 2012. Micro-Insurance: A Veritable Product Diversification Option for Micro-Finance Institutions in Nigeria. Research Journal of Finance and Accounting 3: 78–85. [Google Scholar]
  2. Aduloju, Sunday Adekunle, and Sunday Stephen Ajemunigbohun. 2017. Reinsurance and Performance of the Ceding Companies: The Nigerian Insurance Industry Experience. Economics and Business 31: 19–29. [Google Scholar] [CrossRef]
  3. Berger, Marc A. 1993. Markov Jump Processes. In An Introduction to Probability and Stochastic Processes. New York: Springer, pp. 121–38. [Google Scholar] [CrossRef]
  4. Bloch, Daniel Alexandre. 2023. A Review of ‘The Pricing of Options and Corporate Liabilities’. SSRN Electronic Journal. [Google Scholar] [CrossRef]
  5. Bressan, Silvia. 2018. The impact of reinsurance for insurance companies. Risk Governance and Control: Financial Markets & Institutions 8: 22–29. [Google Scholar]
  6. Bryc, Wlodzimierz. 1995. Normal Distributions. In The Normal Distribution, Characterizations with Application. 100 vols. New York: Springer, pp. 23–38. [Google Scholar] [CrossRef]
  7. Cahyandari, Rini, Kalfin, Sukono, Sri Purwani, Dewi Ratnasari, Titin Herawati, and Sutiono Mahdi. 2023. The Development of Sharia Insurance and Its Future Sustainability in Risk Management: A Systematic Literature Review. Sustainability 15: 8130. [Google Scholar] [CrossRef]
  8. Chen, Cheng-Wu, Chun-Pin Tseng, Wen-Ko Hsu, and Wei-Ling Chiang. 2012. A Novel Strategy to Determine the Insurance and Risk Control Plan for Natural Disaster Risk Management. Natural Hazards 64: 1391–403. [Google Scholar] [CrossRef]
  9. Chen, Shuai, and Jiameng Yang. 2023. Environmental Pollution Liability Insurance Pricing and the Solvency of Insurance Companies in China: Based on the Black–Scholes Model. International Journal of Environmental Research and Public Health 20: 1630. [Google Scholar] [CrossRef] [PubMed]
  10. Dickson, D. C. M. 2016. The Collective Risk Model. In Insurance Risk and Ruin. Cambridge: Cambridge University Press, pp. 53–94. [Google Scholar]
  11. Ermolieva, Tatiana, Tatiana Filatova, Yuri Ermoliev, Michael Obersteiner, Karin de Bruijn, and Adriaan Jeuken. 2017. Flood Catastrophe Model for Designing Optimal Flood Insurance Program: Estimating Location-Specific Premiums in the Netherlands. Risk Analysis 37: 82–98. [Google Scholar] [CrossRef] [PubMed]
  12. Fang, Kuangnan, Yefei Jiang, and Malin Song. 2016. Customer Profitability Forecasting Using Big Data Analytics: A Case Study of the Insurance Industry. Computers & Industrial Engineering 101: 554–64. [Google Scholar] [CrossRef]
  13. Gikhman, Iosif Ilyich, and Anatoli Vladimirovich Skorokhod. 2004. Jump Processes. In The Theory of Stochastic Processes II. Berlin: Springer, pp. 187–257. [Google Scholar] [CrossRef]
  14. Giudice, Manlio Del, Federica Evangelista, and Matteo Palmaccio. 2015. Defining the Black and Scholes Approach: A First Systematic Literature Review. Journal of Innovation and Entrepreneurship 5: 5. [Google Scholar] [CrossRef]
  15. Ismail, Emad. 2016. The Complementary Compound Truncated Poisson-Weibull Distribution for Pricing Catastrophic Bonds for Extreme Earthquakes. British Journal of Economics, Management & Trade 14: 1–9. [Google Scholar] [CrossRef]
  16. Jametti, Mario, and Thomas von Ungern-Sternberg. 2004. Disaster Insurance or a Disastrous Insurance-Natural Disaster Insurance in France. SSRN Electronic Journal. [Google Scholar] [CrossRef]
  17. Johny, Mohammad, Bambang Purwoko, and Endang Etty Merawaty. 2021. Effect of Gross Premiums, Claims Reserves, Premium Reserves, and Payment 418 of Claims to ROA: A Survey of General Insurance Companies Is Recorded in IDX. International Journal of Economics, Management, Business and Social Science 1: 31–43. [Google Scholar]
  18. Joyette, Antonio R. T., Leonard A. Nurse, and Roger S. Pulwarty. 2015. Disaster Risk Insurance and Catastrophe Models in Risk-prone Small Caribbean Islands. Disasters 39: 467–92. [Google Scholar] [CrossRef] [PubMed]
  19. Kalfin, Sukono, Sudradjat Supian, and Mustafa Mamat. 2021. Mitigation and Models for Determining Premiums for Natural Disaster Insurance Due to Excessive Rainfall. Journal of Physics: Conference Series 1722: 012058. [Google Scholar] [CrossRef]
  20. Kalfin, Sukono, Sudradjat Supian, and Mustafa Mamat. 2022a. Insurance Premium Determination Model as Natural Disaster Mitigation Effort in Indonesia with A Cross Subsidy System. International Journal of Agricultural and Statistical Sciences 18: 539–46. [Google Scholar]
  21. Kalfin, Sukono, Sudradjat Supian, and Mustafa Mamat. 2022b. Insurance as an Alternative for Sustainable Economic Recovery after Natural Disasters: A Systematic Literature Review. Sustainability 14: 4349. [Google Scholar] [CrossRef]
  22. Kousky, Carolyn, and Erwann Michel-Kerjan. 2017. Examining Flood Insurance Claims in the United States: Six Key Findings. Journal of Risk and Insurance 84: 819–50. [Google Scholar] [CrossRef]
  23. Kunreuther, Howard. 1996. Mitigating Disaster Losses through Insurance. Journal of Risk and Uncertainty 12: 171–87. [Google Scholar] [CrossRef]
  24. Kunreuther, Howard. 2015. The Role of Insurance in Reducing Losses from Extreme Events: The Need for Public–Private Partnerships. The Geneva Papers on Risk and Insurance-Issues and Practice 40: 741–62. [Google Scholar] [CrossRef]
  25. Kunreuther, Howard, and Rosemary Lyster. 2016. The Role of Public and Private Insurance in Reducing Losses from Extreme Weather Events and Disasters. Asia Pacific Journal of Environmental Law 19: 29–54. [Google Scholar] [CrossRef]
  26. Lee, Chen-Ying. 2017. Product Diversification, Business Structure, and Firm Performance in Taiwanese Property and Liability Insurance Sector. The Journal of Risk Finance 18: 486–99. [Google Scholar] [CrossRef]
  27. Lee, Chen-Ying. 2020. The Impact of Product Diversification on Risk-Taking Behavior in Property and Liability Insurance Firms. Journal of Applied Finance and Banking 10: 177–97. [Google Scholar]
  28. Li, Jiayi, Zhiyan Cai, Yixuan Liu, and Chengxiu Ling. 2022a. Extremal Analysis of Flooding Risk and Its Catastrophe Bond Pricing. Mathematics 11: 114. [Google Scholar] [CrossRef]
  29. Li, Wenping, Yuming Wu, Xing Gao, and Wei Wang. 2022b. Characteristics of Disaster Losses Distribution and Disaster Reduction Risk Investment in China from 2010 to 2020. Land 11: 1840. [Google Scholar] [CrossRef]
  30. Lima, Ricardo Carvalho de Andrade, and Antonio Vinícius Barros Barbosa. 2019. Natural Disasters, Economic Growth and Spatial Spillovers: Evidence from a Flash Flood in Brazil. Papers in Regional Science 98: 905–25. [Google Scholar] [CrossRef]
  31. Linnerooth-Bayer, Joanne, and Aniello Amendola. 2000. Global Change, Natural Disasters and Loss-Sharing: Issues of Efficiency and Equity. The Geneva Papers on Risk and Insurance-Issues and Practice 25: 203–19. [Google Scholar] [CrossRef]
  32. Luis, Alamilla-López Jorge. 2015. An Approximation to the Probability Normal Distribution and Its Inverse. Ingeniería, Investigación y Tecnología 16: 605–11. [Google Scholar] [CrossRef]
  33. Ma, Zong-Gang, and Chao-Qun Ma. 2013. Pricing Catastrophe Risk Bonds: A Mixed Approximation Method. Insurance: Mathematics and Economics 52: 243–54. [Google Scholar] [CrossRef]
  34. Ma, Zonggang, Chaoqun Ma, and Shisong Xiao. 2017. Pricing Zero-Coupon Catastrophe Bonds Using EVT with Doubly Stochastic Poisson Arrivals. Discrete Dynamics in Nature and Society 2017: 1–14. [Google Scholar] [CrossRef]
  35. McAneney, John, Delphine McAneney, Rade Musulin, George Walker, and Ryan Crompton. 2016. Government-Sponsored Natural Disaster Insurance Pools: A View from down-Under. International Journal of Disaster Risk Reduction 15: 1–9. [Google Scholar] [CrossRef]
  36. Morales-Bañuelos, Paula, Nelson Muriel, and Guillermo Fernández-Anaya. 2022. A Modified Black-Scholes-Merton Model for Option Pricing. Mathematics 10: 1492. [Google Scholar] [CrossRef]
  37. Osaki, Shunji. 1992. Poisson Processes. In Applied Stochastic System Modeling. Berlin and Heidelberg: Springer, pp. 63–82. [Google Scholar] [CrossRef]
  38. Pascucci, Andrea. 2011. Black-Scholes Model. In PDE and Martingale Methods in Option Pricing. Milano: Springer, pp. 219–56. [Google Scholar] [CrossRef]
  39. Paudel, Youbaraj, Wouter Botzen, Jeroen Aerts, and Theo Dijkstra. 2015. Risk Allocation in a Public–Private Catastrophe Insurance System: An Actuarial Analysis of Deductibles, Stop-loss, and Premiums. Journal of Flood Risk Management 8: 116–34. [Google Scholar] [CrossRef]
  40. Peng, Jiazhen, Xiaojun Gene Shan, and Yang Gao. 2014. Modeling the Integrated Roles of Insurance and Retrofit in Managing Natural Disaster Risk: A Multi-Stakeholder Perspective. Natural Hazards 74: 1043–68. [Google Scholar] [CrossRef]
  41. Philippi, Tim, and Jörg Schiller. 2024. Abandoning disaster relief and stimulating insurance demand through premium subsidies. Journal of Risk and Insurance 91: 339–82. [Google Scholar] [CrossRef]
  42. Picard, Pierre. 2008. Natural Disaster Insurance and the Equity-Efficiency Trade-Off. Journal of Risk and Insurance 75: 17–38. [Google Scholar] [CrossRef]
  43. Powell, Lawrence S., and David W. Sommer. 2005. Internal versus External Capital Markets in the Insurance Industry: The Role of Reinsurance. SSRN Electronic Journal. [Google Scholar] [CrossRef]
  44. Quan, Zhiyu, and Emiliano A. Valdez. 2018. Predictive Analytics of Insurance Claims Using Multivariate Decision Trees. Dependence Modeling 6: 377–407. [Google Scholar] [CrossRef]
  45. Reijnen, Rajko, Willem Albers, and Wilbert C. M. Kallenberg. 2005. Approximations for Stop-Loss Reinsurance Premiums. Insurance: Mathematics and Economics 36: 237–50. [Google Scholar] [CrossRef]
  46. Sewu, Pan Lindawaty Suherman, Rahel Octora, and Floria Lusiana. 2022. Analysis of the Existence of Insurance Fraud in the Case of Insurance Claim Payment Failure and the Legal Protection for Insurance Clients in the Insurance Company’s Failure to Pay Claims. European Journal of Law and Political Science 1: 79–86. [Google Scholar] [CrossRef]
  47. Shi, Peijun, Tao Ye, Ying Wang, Tao Zhou, Wei Xu, Juan Du, Jing’ai Wang, Ning Li, Chongfu Huang, Lianyou Liu, and et al. 2020. Disaster Risk Science: A Geographical Perspective and a Research Framework. International Journal of Disaster Risk Science 11: 426–40. [Google Scholar] [CrossRef]
  48. Shinde, Akank Sha, and Kalyanrao Chimaji Takale. 2012. Study of Black-Scholes Model and Its Applications. Procedia Engineering 38: 270–79. [Google Scholar] [CrossRef]
  49. Skees, Jerry R., Barry J. Barnett, and Anne G. Murphy. 2008. Creating Insurance Markets for Natural Disaster Risk in Lower Income Countries: The Potential Role for Securitization. Agricultural Finance Review 68: 151–67. [Google Scholar] [CrossRef]
  50. Subartini, Betty, Puri Puspa Damayanti, Sudradjat Supian, Ruly Budiono, Mohd Khairul Amri Kamarudin, Adiana Ghazali, and Muhammad Barzani Gasim. 2018. Fuzzy Inference System of Tsukamoto Method in Decision Making on Determination of Insurance Premium Amount for Due Damages of Flood Natural Disaster. Journal of Fundamental and Applied Sciences 10: 79–94. [Google Scholar]
  51. Sukono, Sukono, Kalfin Kalfin, Riaman Riaman, Sudradjat Supian, Yuyun Hidayat, Jumadil Saputra, and Mustafa Mamat. 2022. Determination of the Natural Disaster Insurance Premiums by Considering the Mitigation Fund Reserve Decisions: An Application of Collective Risk Model. Decision Science Letters 11: 211–22. [Google Scholar] [CrossRef]
  52. Supian, Sudradjat, and Mustafa Mamat. 2022. Insurance Premium Determination Model and Innovation for Economic Recovery Due to Natural Disasters in Indonesia. Computation 10: 174. [Google Scholar] [CrossRef]
  53. Suwandani, Ria Novita, and Yogo Purwono. 2021. Implementation of Gaussian Process Regression in Estimating Motor Vehicle Insurance Claims Reserves. Journal of Asian Multicultural Research for Economy and Management Study 2: 38–48. [Google Scholar] [CrossRef]
  54. Syuhada, Khreshna, Venansius Tjahjono, and Arief Hakim. 2024. Compound Poisson–Lindley process with Sarmanov dependence structure and its application for premium-based spectral risk forecasting. Applied Mathematics and Computation 467: 128492. [Google Scholar] [CrossRef]
  55. Tao, Zhengru, Xiaxin Tao, and Ping Li. 2009. Pricing Model for Earthquake CAT Bonds. Paper presented at the 2009 International Conference on Business Intelligence and Financial Engineering, Beijing, China, July 24–26; Piscataway: IEEE, pp. 740–44. [Google Scholar] [CrossRef]
Figure 1. Insurance premiums with the formula π i E ( S ) e τ t N d 2 + ς ;   0 π i 0.5 (a), π i E ( S ) e τ t N d 2 ς ;   0.5 < π i 1 (b), and combine conditions π i E ( S ) e τ t N d 2 + ς ;   0 π i 0.5 and π i E ( S ) e τ t N d 2 ς ;   0.5 < π i 1 (c).
Risks 12 00110 g001aRisks 12 00110 g001b
Figure 2. Spread of insurance premiums from the Black–Scholes model in Equation (27).
Risks 12 00110 g002
Figure 3. Insurance premiums with the formula π i λ X λ N λ Z t e τ t N d 2 + γ i ;   0 π i 0.5 ;   γ i 5 % (a), π i λ N λ Z t λ X e τ t N d 2 ;   0.5 < π i 1 ;   γ i 5 %   o r   0 π i 0.5 ;   γ i < 5 % (b), π i λ X λ N λ Z t e τ t N d 2 γ i ;   0.5 < π i 1 ;   γ i < 5 % (c), and combine conditions (ac) of the insurance premium formula (d).
Risks 12 00110 g003aRisks 12 00110 g003b
Figure 4. Insurance premiums in all provinces in Indonesia using the Black–Scholes model.
Risks 12 00110 g004
Figure 5. Average frequency of disaster events in each province.
Risks 12 00110 g005
Table 1. Parameter estimation results for premium model of natural disaster insurance in all provinces in Indonesia.
Region γ i π i λ N λ Z λ X (IDR)
Provinces with a high economic growth rate and low potential disaster index
DKI Jakarta5.460.225604821.70.630,106,909,810.95
Central Java5.170.4686533598.216.04,530,651,960.62
Central Kalimantan6.530.467631427.90.738,729,763,312.62
North Sulawesi5.240.491488725.40.735,368,311,283.38
Gorontalo7.230.446276120.40.528,353,108,132.67
Provinces with a low economic growth rate and low potential disaster index or provinces with a high economic growth rate and high potential disaster index
Jambi4.460.488563846.61.264,744,471,582.52
South Sumatera4.110.490678265.61.891,197,630,272.00
Riau Island−0.080.410190613.50.418,707,206,026.95
DI Yogyakarta4.780.496598443.51.260,506,118,714.15
East Java4.880.4735869358.29.616,222,654,836.86
Banten5.060.545757951.91.472,198,125,152.80
Bali3.900.45610831.80.944,283,463,877.29
West Southeast Nusa1.100.451244945.41.263,136,821,231.57
East Southeast Nusa3.980.496492762.01.786,228,527,891.81
West Kalimantan5.540.542762567.61.893,974,480,554.34
East Kalimantan10.090.54135293.30.1831,739,925,812.43
North Kalimantan4.170.488035227.50.738,291,312,893.05
Central Sulawesi7.700.510835325.80.735,806,761,702.95
South Sulawesi6.330.562038696.22.6133,727,296,033.42
Southeast Sulawesi 6.100.555801244.51.261,821,469,972.86
West Sulawesi5.270.586706514.00.419,437,955,538.77
Maluku5.720.565738814.60.420,314,856,377.91
North Maluku5.990.513196411.70.4498,079,366,701.85
Papua−16.360.433096413.61.418,853,357,354.28
Provinces with a low economic growth rate and high potential disaster index
Aceh3.450.54121192.32.7142,496,297,300.00
North Sumatera3.610.511610684.52.3117,504,637,634.15
West Sumatera3.140.526939882.12.2114,143,189,167.33
Riau2.510.518975733.10.946,037,265,555.57
Bengkulu4.490.570883816.10.422,360,957,148.43
Lampung4.180.517248943.61.260,652,270,041.48
Bangka Belitung Islands3.950.569262810.03.013,884,254,974.09
West Java 4.300.5138307391.710.55,407,552,799.76
South Kalimantan3.260.510863.91.788,859,230,409.23
West Papua−0.130.51079653.90.1544,701,230,441.91
Table 2. Estimation results for premium of natural disaster insurance in all provinces in Indonesia.
ProvinceInsurance Premium (IDR) N d 2
Insurance premiums for provinces that provide subsidies
DKI Jakarta105,116,814,732.06 0.7787
Central Java15,678,312,345,661.900.7787
Central Kalimantan390,515,637,170.990.7787
North Sulawesi329,712,274,681.620.7787
Gorontalo190,943,855,566.550.7787
Insurance premiums for provinces that do not provide or receive subsidies
Jambi1,362,646,116,638.970.7787
South Sumatera4,072,973,023,288.890.7787
Riau Islang31,837,484,097.230.7787
DI Yogyakarta1,209,651,830,714.360.7787
East Java20,368,852,873,367.900.7787
Banten2,208,284,749,461.810.7787
Bali446,342,810,943.860.7787
West Southeast Nusa1,196,834,661,482.210.7787
East Southeast Nusa3,479,677,094,766.090.7787
West Kalimantan277,731,330,156.910.7787
East Kalimantan4,783,848,320,785.640.7787
North Kalimantan113,110,747,892.490.7787
Central Sulawesi254,205,077,805.330.7787
South Sulawesi14,489,547,848,051.900.7787
Southeast Sulawesi 1,413,365,803,622.650.7787
West Sulawesi49,165,135,473.620.7787
Maluku51,781,982,865.650.7787
North Maluku919,685,291,617.100.7787
Papua119,499,255,347.170.7787
Insurance premiums for provinces that receive subsidies
Aceh16,185,736,296,486.300.7787
North Sumatera8,791,480,517,072.460.7787
West Sumatera8,185,640,344,595.480.7787
Riau488,918,532,061.060.7787
Bengkulu5,991,611,415.180.7787
Lampung1,134,911,652,300.060.7787
Bangka Belitung Islands151,318,494,167.840.7787
West Java 8,799,426,281,983.760.7787
South Kalimantan3,653,750,980,135.410.7787
West Papua119,592,397,240.000.7787
Disclaimer/Publisher’s Note: The statements, opinions and data contained in all publications are solely those of the individual author(s) and contributor(s) and not of MDPI and/or the editor(s). MDPI and/or the editor(s) disclaim responsibility for any injury to people or property resulting from any ideas, methods, instructions or products referred to in the content.