Article

Uncovering the Impact of Digitalization on the Performance of Insurance Distribution

1
Department of Cooperative Studies, Berlin School of Economics and Law, 10315 Berlin, Germany
2
Assekurum GmbH, 15366 Hoppegarten, Germany
*
Author to whom correspondence should be addressed.
Risks 2024, 12(8), 129; https://doi.org/10.3390/risks12080129
Submission received: 24 June 2024 / Revised: 11 August 2024 / Accepted: 12 August 2024 / Published: 14 August 2024

Abstract

:
This study explores the impact of digitalization on the performance of insurance intermediaries, who still play a key role in the revenue generation of insurance companies. By using an interdisciplinary approach, this study is the first to examine the extent and type of digital technologies used by intermediaries, their impact on performance with respect to revenue, productivity, and interaction with clients, and the role of digital stress in this context. The research is exploratory, which is why a research model with many variables and relationships between them was built. The quantitative multivariate method of Partial Least Squares Structural Equation Modeling (PLS-SEM) was applied as it allows the simultaneous estimation of models with multiple dependent variables and their interconnections. In this context, data collected in 2022 from 671 insurance intermediaries from Germany, whose demographic distribution in the sample is representative of the German insurance market, were analyzed. The findings show that insurance intermediaries use many digital technologies compared to other industries, particularly those that create added value in their daily work. Empirical evidence also showed that using digital technologies positively affects performance but induces perceived digital stress. As this study reveals, the latter diminishes the positive effects on performance. Technology optimism, technological skills, and organizational support reduce the severity of stress. This means that insurers can start here to support intermediaries to mitigate the performance-limiting effects. This study adds to the insurance literature by providing a broader understanding of how insurance intermediaries deal with digitalization and what it means for their performance.

1. Introduction

Digitalization found its way into the insurance industry some time ago. This was enhanced by the COVID-19 pandemic (Flückiger and Duygun 2022). Almost all parts of the value chain are affected (Eling and Lehmann 2018). In this context, the potential applications of digital technologies along the value chain have been examined (Eling and Lehmann 2018; Eckert et al. 2022), up to and including the transformation of the business model into Insurance 4.0 (Nicoletti 2021). Other studies focus on: the transformative role of InsurTechs (Braun and Schreiber 2017; Greineder et al. 2020; Sosa and Montes 2022); the effects on innovation capacity (Lanfranchi and Grassi 2022); the positive effects of digital applications, such as the increase in quality, accessibility, and efficiency (Eckert et al. 2022); the relationship with company performance (Bohnert et al. 2019; Fritzsch et al. 2021); the usage of specific digital applications such as AI (Owens et al. 2022) and their risks (Amerirad et al. 2023); or the impact on the back office of insurance companies (Schwarzbach et al. 2023).
Regarding digitalization in insurance distribution, early work on the implications of digital technology for insurance intermediation was mainly concerned with new online distribution channels (Garven 2002; Dumm and Hoyt 2003). The current literature is related to new digital business models (InsurTechs, insurers as a part of ecosystems, peer-to-peer, etc.), comparison websites, or web-based direct distribution, supplemented by comparison and chat applications, robo-advisors, and direct data access by the customer in customer portals, or—in this context—regulatory aspects, but does not refer to (human) insurance intermediaries (Braun and Schreiber 2017; Eling and Lehmann 2018; Stöckli et al. 2018; Zeier Röschmann 2018; Cappiello 2020; Nicoletti 2021; Eckert et al. 2022; Fritzsche and Bohnert 2022; Sosa and Montes 2022; Sosa Gómez and Montes Pineda 2023; Marano and Li 2023).
Surprisingly, the effects of digitalization on distribution through insurance intermediaries have hardly been examined in detail, although insurance distribution in general and intermediaries in particular play a key role in the sales success of insurance products (Cummins and Doherty 2006; Hilliard et al. 2013; Dominique-Ferreira 2018; Eckert et al. 2021; Marano 2021). There are several reasons why insurance intermediaries are so important: the intermediaries serve as the critical link between insurance companies seeking to place insurance policies and consumers seeking to procure insurance coverage. They provide added value because an insurance product is a low-interest product (Köhne 2024), it has credence goods characteristics, and confidence is needed to make the right purchase decision with respect to products that lead to lock-in effects due to the long-term nature of some insurance products (Eckardt 2007; Eckardt and Räthke-Döppner 2010). Trust is therefore necessary, and a personal relationship between the customer and intermediary promotes this trust. Thus, the intermediary’s recommendation plays an important role in insurance sales (Doney and Cannon 1997; Jap 2000; Beloucif et al. 2004; Yu and Tseng 2016; Dominique-Ferreira 2018). This is valid across generations and has also been confirmed among young and digitally oriented GenY customers (Dalla Pozza et al. 2017; Eckert et al. 2021).
In general, research on retail and distribution management in the insurance sector is limited (for the European market, see Dominique-Ferreira 2018; for the German market, see Eckert et al. 2021), even though in most European countries (including Germany), personal selling by insurance intermediaries dominates in the non-life insurance sector (Hilliard et al. 2013; Köhne and Brömmelmeyer 2018; Insurance Europe 2022; GDV 2022). Research on the digitalization of insurance intermediaries is even more limited. Only a few studies refer entirely or at least partially to the digitalization of insurance intermediaries or the digital support of their work. Eastman et al. were the first to examine the use and attitudes of insurance agents toward e-mail and their own websites (Eastman et al. 2002). Forman and Gron investigated the spread of internet-based customer applications. They found that these applications are implemented significantly faster by exclusive agents than by independent agents (Forman and Gron 2009). Overall, the work of Eckert et al. is the only recent study that focuses on the impact of digital transformation on traditional ways of selling insurance products and aims to investigate the spread of the use of digital technologies in the German market and the intermediaries’ perceptions of the value added by digital applications. Their results confirm Foman and Gron’s statement that exclusive agents can adapt more easily to new circumstances because of the insurers’ support. In addition, their results indicate differences in digital usage and attitudes by age: on average, younger intermediaries are more open-minded. Furthermore, they show that intermediaries’ sales units consider the digital interface with the insurance company more valuable than video chats during the service process (Eckert et al. 2021).
There are many consequences of digitalization: on the one hand, the digitalization of work activities has intended consequences such as higher productivity, accessibility, or efficiency (Ahearne et al. 2008; Forman and Gron 2009). It helps to increase efficiency in sales, reduce errors, and combine personal components with useful digital components, ultimately creating more time for the intermediary to exercise its strengths, namely, the personal exchange with customers in the moments that are critical to success and require trust (Dumm and Hoyt 2003; Ahearne et al. 2008; Forman and Gron 2009; Dalla Pozza et al. 2017; Dominique-Ferreira 2018). Customer experience is also improved by combining the advantages of the digital and analogue worlds (Müller et al. 2015; Dalla Pozza et al. 2017) and by bringing intermediaries up to date with the (communicative) technology of their customers (Eckert et al. 2021).
On the other hand, studies in other industries have shown that digitalization often causes stress among those affected and can be burdening, tiring, and harmful to health in the long run, and ultimately reducing performance (Dragano and Lunau 2020). Studies in this research area have investigated technostress (e.g., Tarafdar et al. 2007; Ragu-Nathan et al. 2008; Ayyagari et al. 2011) and have become increasingly important in the last 15–20 years. They show that information and communication technologies cause stress because they are ubiquitous and require constant connectivity through e-mail, internet, and phone, leading to a feeling of loss of control over time and space; such technologies are also changing rapidly and becoming increasingly complex, making them more difficult to deal with and putting pressure on individuals and companies to keep up with new technologies, requiring more work and demanding multitasking (Ragu-Nathan et al. 2008; Tarafdar et al. 2007). Therefore, technostress “describes the situation of stress experienced by the individual because of an inability to adapt to the introduction of new technology [and to use it] in a healthy manner” (Tarafdar et al. 2015, p. 105). This definition of technostress, which we will refer to as digital stress as this seems more appropriate in the age of digitalization, is also used in this article, as it is based on the widely accepted transactional stress model and the extended stress model based on it by Semmer and Zapf (2018).
As research on the digitalization of insurance intermediaries is very limited and the increasing digitalization highlights the need to understand its impact on the work and performance of insurance intermediaries, this study intends to contribute to closing this research gap. The overarching research question is, therefore, how digitalization influences the success of insurance. To accomplish this, we first examine how digital insurance intermediaries operate, i.e., which digital technologies or tools they use in their daily work and to what extent. Furthermore, we determine the effects on the performance of insurance intermediaries and which conditions have a positive and negative impact.
In order to obtain insightful findings, an interdisciplinary approach is used to process findings from insurance economics, business informatics, and business psychology. Since the research objective is to analyze various effects of digitalization simultaneously, a model with numerous constructs, variables, and structural paths is built. This model was analyzed using the multivariate method Partial Least Squares Structural Equation Modeling (PLS-SEM) because PLS-SEM, as a second-generation quantitative multivariate data analysis method, combines aspects of factor analysis and regression, overcomes the limitations of simple model structuring by providing the ability to estimate complex relationships among multiple dependent and independent (latent) variables simultaneously, and is exploratory and prediction-oriented (Gefen et al. 2011; Hair et al. 2021). In this research context, data collected in March and April 2022 from 671 insurance intermediaries in Germany, including exclusive tied agents, multi-tied agents, and brokers, were analyzed.
This study fills a gap in the existing literature as it explores the impact of digitalization on the performance of insurance intermediaries, who still play a key role in the revenue generation of insurance companies. Using an interdisciplinary approach, this is the first study to examine: the extent and type of digital technologies used by intermediaries; their impact on performance with respect to revenue, productivity, and interaction with clients; and the role of digital stress in this context. The latter is motivated by the findings of Tarafdar et al. (2014), who explained that professional salespeople, in particular, are exposed to technostress resp. digital stress. The results of our study show that, compared to other industries, insurance intermediaries use many digital tools, some of which they use frequently in their daily work. This is quite remarkable because the insurance sector is not necessarily considered innovative (Eling and Lehmann 2018; Cappiello 2020). The results should be beneficial to insurance companies and intermediaries, as they empirically prove that the use of digital tools increases the performance of insurance intermediaries. This means that the goals of the digitalization initiatives are achieved in principle. At the same time, however, their impact is reduced by digital stress. In particular, some aspects strongly pronounced among insurance intermediaries in the context of the stressors overload, unreliability, and omnipresence have a counterproductive effect. At the same time, this study shows that three personal and organizational conditions that have a positive influence on stressors also seem to apply to insurance intermediaries: if insurance companies succeed in promoting technology optimism, technology capabilities, and organizational support among intermediaries, it has a positive effect on digital stress and thus on performance. In other words, insurance companies and intermediaries can use accompanying measures to increase the efficiency, productivity, and customer-loyalty effects intended by investments in digitalization.
This paper is structured as follows: In Section 2, based on theories of insurance economics, business informatics, and business psychology, we develop hypotheses and build the research model. Section 3 provides an overview of the methodological aspects and data sources. Section 4 is dedicated to descriptive results, the measurement model, and the structural model. Finally, Section 5 concludes by discussing results, addressing limitations, and indicating future scientific research questions.

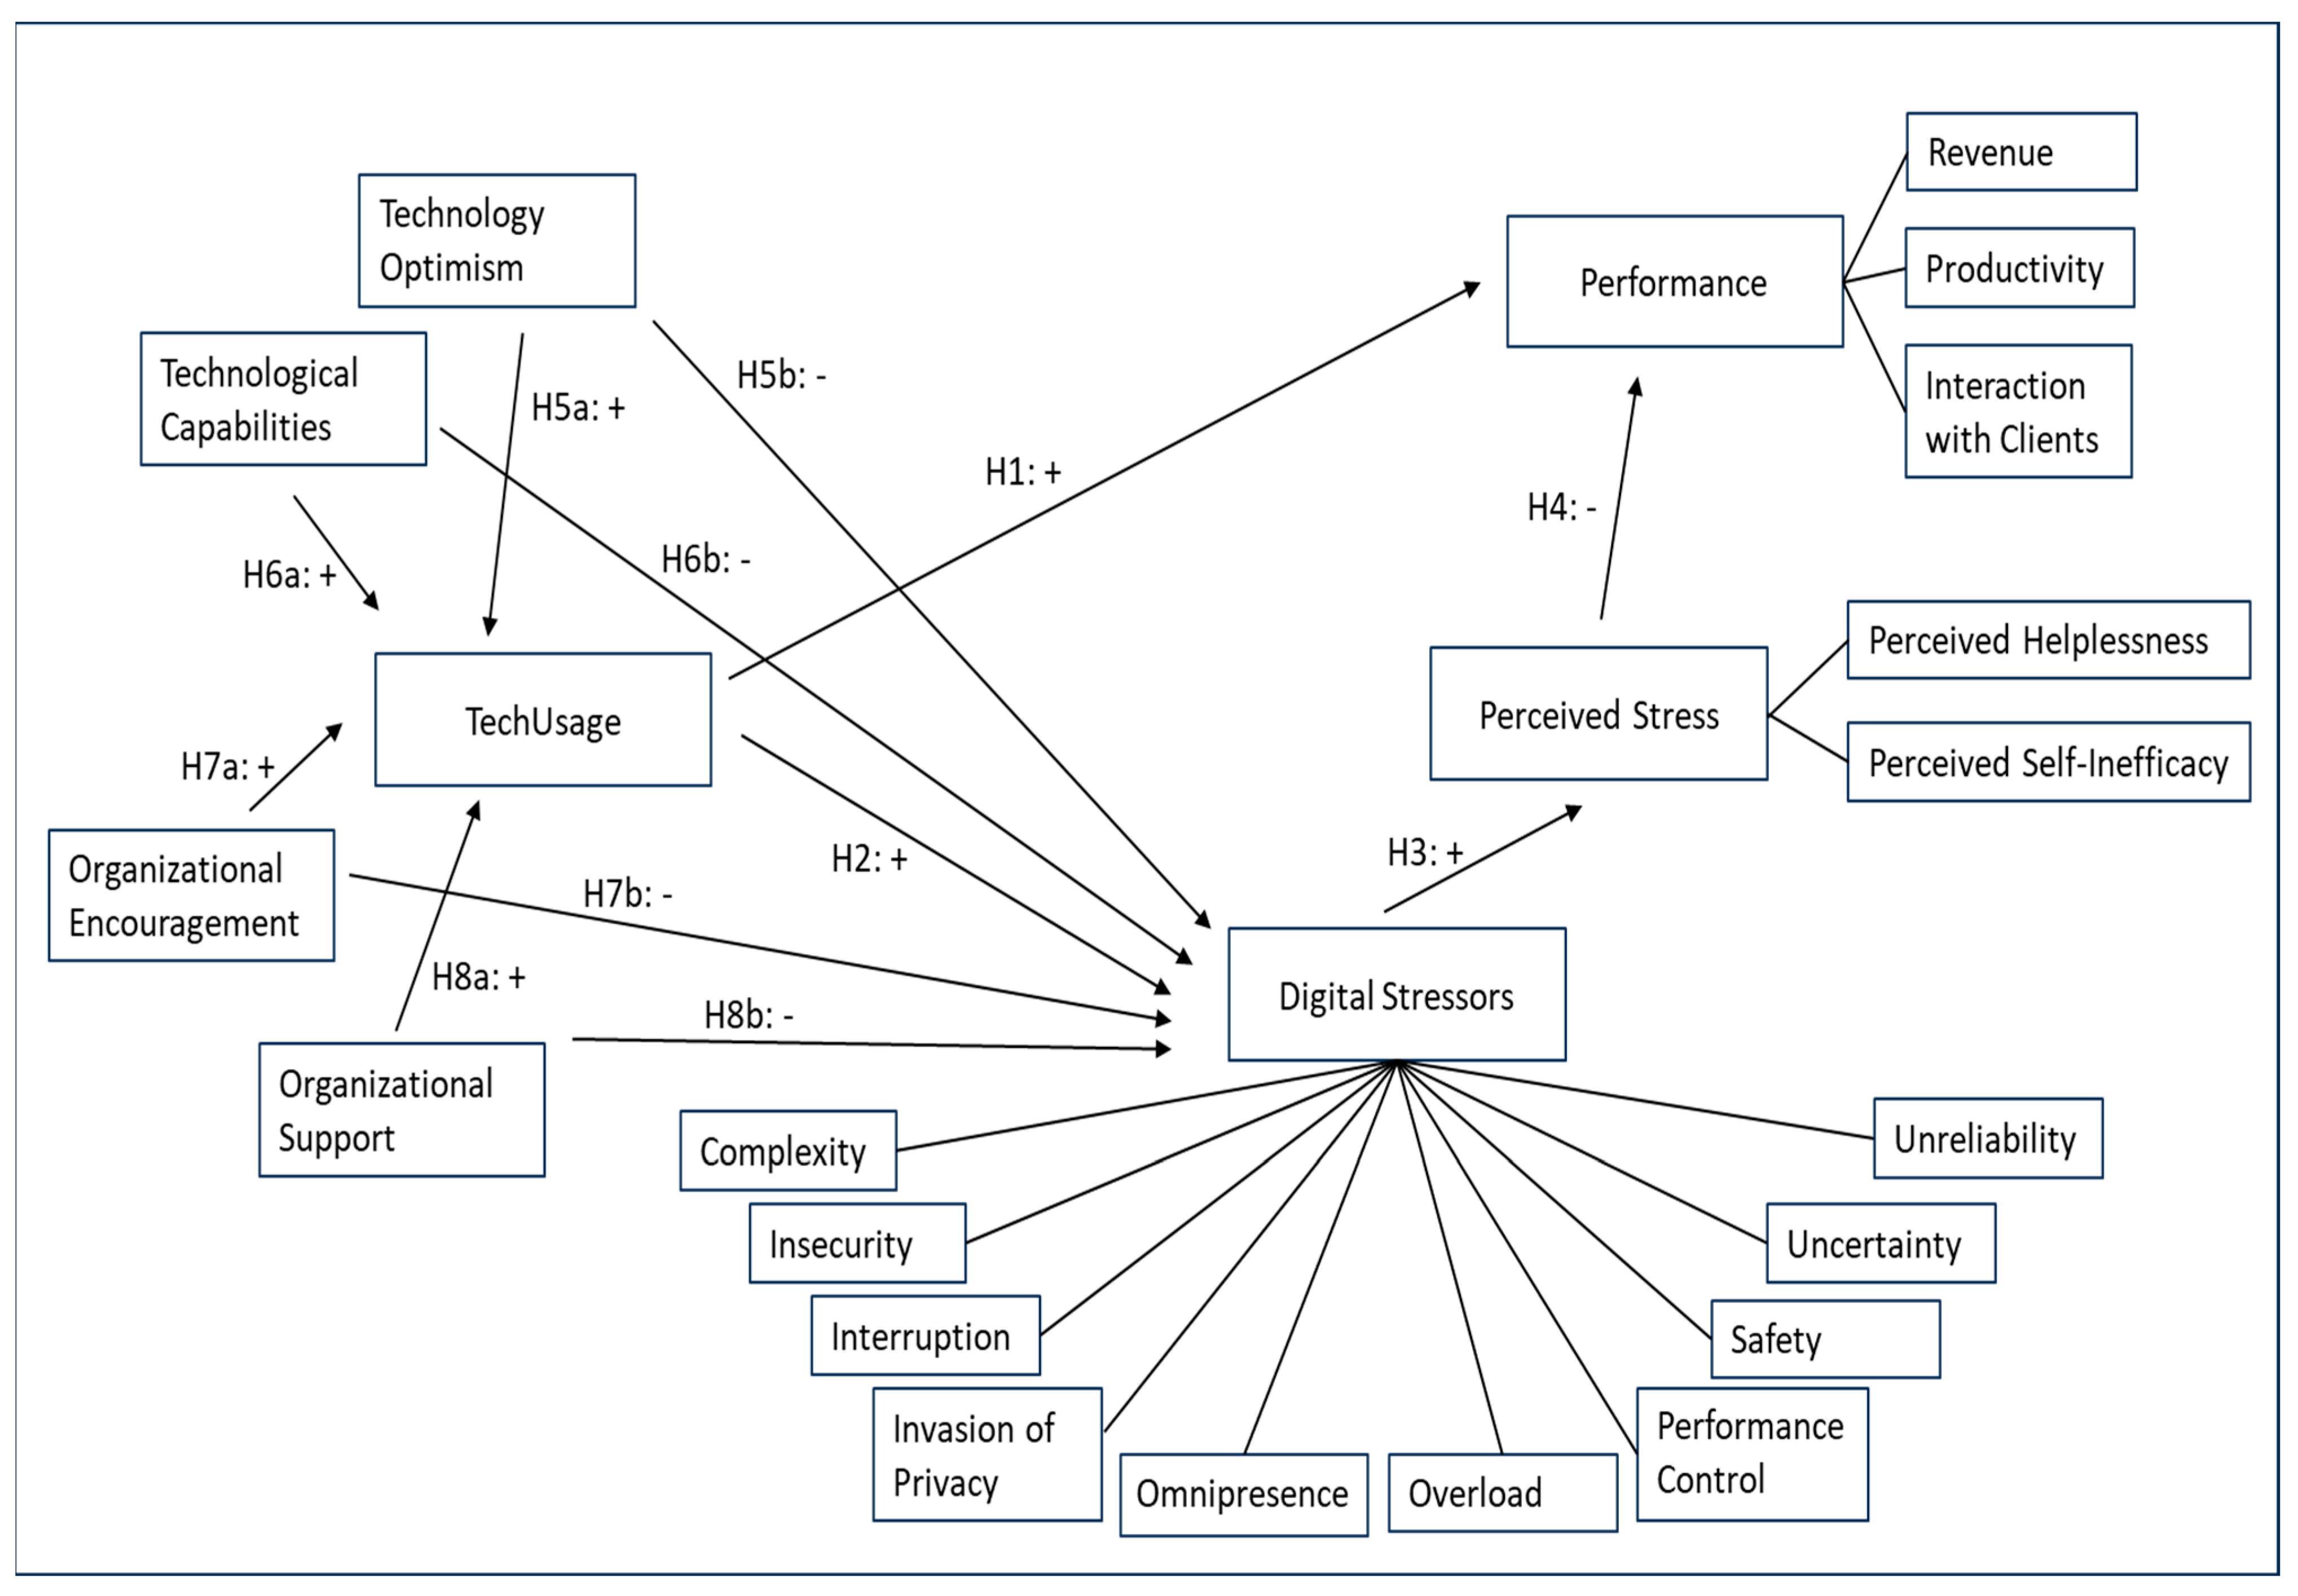
2. Hypotheses and Research Model

2.1. Use of Digital Technologies and Performance of a Salesperson

Digital applications/tools can support and complement personal selling. In this context, digitalization is observable in all steps of the insurance intermediation process in practice. Internet-based customer applications, e.g., insurer websites, comparison websites, e-commerce marketplaces, etc., and mainframe connections between the intermediary and the insurer have contributed to the digitalization of most steps of the intermediation process for many years (Forman and Gron 2009). More recent applications like e-mail, consulting software, and online insurance applications have also supported insurance intermediaries for several years (Müller et al. 2015; BIPAR 2023). In the last few years, other digital applications have been added, such as customer apps/customer portals, messenger services, video call/video conferencing systems, sharing of screen systems, and sophisticated customer-relationship-management systems (Eckert et al. 2021). Other technologies that could support or take over the sales function are big data, chatbots, artificial intelligence, social networks, and mobile devices (Eling and Lehmann 2018).
However, insurance intermediaries have more technologies at their disposal, e.g., advisory tools, policy management software, and those needed to complete their tasks. Regarding the technologies that insurance intermediaries can use, a comprehensive view seems to make sense, especially in the context of digital stress. To date, research in this area has rarely considered the broad range of digital tools that make up the workday and work experience over a period of time (Marsh et al. 2022). It is particularly important to study the latter, i.e., understanding the working environment of an insurance intermediary in its entirety of digital tools and not focusing on single digital tools and statements about them.
The high number of potentially usable technologies and their frequency of use can help insurance intermediaries increase their performance (Sundaram et al. 2007; Galluch et al. 2015). Since the performance of a salesperson should be viewed as multidimensional rather than focusing only on the total sales volume indicator, the impact of technology usage on other dimensions of performance should be explored (Sundaram et al. 2007). Due to the diverse activities of the insurance intermediaries over several process steps of contact (incl. scheduling, information, and creating an awareness of needs), advice (incl. the identification of needs and demands, execution, recommendation, and documentation), the intermediation itself (incl. the handling of quotations and applications, as well as writing the policies), ongoing support (incl. handling of correspondence, event-related information, advice, administration, termination and, if necessary, switching of contracts), claims management, and recovery management (Eckardt 2007; Höckmayr 2012; Köhne 2024; BIPAR 2023), it is important for them to have these processes under control and to design them productively as well as manage the interaction with the customer. Performance is therefore seen as an overarching construct comprising the sub-constructs of revenue, productivity, and interaction with clients, and the following hypothesis can be formulated:
H1. 
The intense use of digital technologies is positively related to the performance of an insurance intermediary.

2.2. Digital Stressors, Perceived Stress, and Performance

The high number of potentially usable technologies and their frequency of use can, however, also be a burden on insurance intermediaries in their work. The usage of digital technologies “causes exhaustion because techno-stressors contribute to techno-exhaustion, which in turn influences work-exhaustion significantly” (Maier et al. 2015, p. 349). The burden of digital technologies does not have to be immediate either but can develop over time due to their use (Salo et al. 2022). A potential overload of insurance intermediaries due to the use of digital technologies allows for the following hypothesis concerning digital stressors:
H2. 
The more intensively digital technologies are used by an insurance intermediary, the more he is exposed to digital stressors.
Insurance intermediaries are exposed to multiple stressors in their work environment. When it comes to stressors resulting from digital technologies, five digital stressors identified by Tarafdar et al. (2007) and specified by Ragu-Nathan et al. (2008), which have been repeatedly validated in numerous studies since then, should be considered: complexity, which gives users the feeling of having insufficient skills and forces them to improve them; insecurity, which gives users the feeling of losing their jobs because of new technologies or people who are more knowledgeable; overload, which is the feeling of having to work harder and faster; uncertainty, which gives users the feeling of constantly having to catch up due to constant changes in digital technology; and invasion. In order to avoid misunderstandings regarding the terminology of digital stressors in this paper, we use the term omnipresence instead of invasion, which gives users the feeling that they can and must be constantly reachable and that the boundaries between work-related and personal contexts are blurring.
As Tarafdar et al. (2017)—as well as others (e.g., Fischer et al. 2021)—indicate, there may be other digital stressors, so additional stress factors are considered in this work. The first stressor of this kind, which is typical in the everyday business of insurance agents, is interruption, e.g., by e-mails that have to be answered immediately. This affects insurance intermediaries, particularly when customers have inquiries about insurance coverage or have an urgent need for clarification, e.g., in the event of a claim, and expect a prompt reply. Galluch et al. (2015) note that the sheer volume of digital technology-enabled interruptions stresses individuals regardless of the message. Overall, past research has shown that work interruptions result in work exhaustion, tend to harm interrupted individuals’ performance and well-being, and lead to stressful situations (Puranik et al. 2020; Chen and Karahanna 2018).
Individuals using unreliable digital technologies are often described as frustrated and strained. As they perceive the threat of breakdowns, they are forced to perform more work, as precautions must be taken against it (Ayyagari et al. 2011). Furthermore, it can be highly stressful for individuals if digital technologies do not work in an expected way (Fischer et al. 2021; Califf et al. 2020; Riedl et al. 2012). Insurance intermediaries can be affected by this when working in the office, if servers fail when exchanging data with the insurance company, and during customer meetings, for example, if the network and thus internet access fail. Therefore, it makes sense to add the factor of unreliability to digital stressors in this study.
Advances in digital technologies have created an environment in which companies have increasing possibilities to observe, record, and analyze information that relates to job performance (Ravid et al. 2020). Even though some studies on performance monitoring have found some positive effects, surveillance performance monitoring tends to cause negative outcomes, such as decreased job satisfaction and commitment or increased feelings of stress (Ravid et al. 2020). If collected performance data are assessed, the feeling of performance control as a stressor can be evaluated (Gimpel et al. 2021).
Another digital stressor to be considered is invasion of privacy, which is about individuals’ fears and perceptions that monitoring also covers their private sphere and that digital technologies compromise individual privacy (Ayyagari et al. 2011). A loss of privacy in workplaces is a concern since “work increasingly shifts outside of the workplace, and involves personal equipment and property (e.g., home offices, personally owned phones), [and] questions arise about where the lines of acceptable monitoring are drawn” (Ravid et al. 2020, p. 120). For insurance intermediaries, as self-employed entrepreneurs who have worked more in the home office since the COVID-19 period (Insurance Europe 2022), there is a risk of using the same technical devices for professional and private purposes. They are, therefore, also exposed to an invasion of privacy.
Another stress factor that differs in substance from the others can be seen in safety concerns when dealing with digital technologies. Studies show that employees feel that many security requirements are painstakingly intimidating or unnecessary and that they have a hard time understanding and implementing them, all of which can cause stress (D’Arcy et al. 2014). In addition, employees can be confronted with threats such as malicious e-mails or potentially harmful programs (Fischer et al. 2021). It can be assumed that insurance agents feel less stress in this respect because the security of IT systems is largely the responsibility of insurance companies; brokers, on the other hand, are responsible for their own IT systems.
We therefore conceptualize “digital stressors” as an overarching higher-order construct comprising the ten specified lower-order sub-constructs: complexity, insecurity, interruption, invasion of privacy, omnipresence, overload, performance control, safety, uncertainty, and unreliability. This is consistent with other contributions to stress creator constructs (e.g., Fischer et al. 2021; Nastjuk et al. 2023). With this higher-order construct, we formulate the following hypothesis:
H3. 
Perceived digital stressors are positively related to the perceived stress of an insurance intermediary.
In this way, we formulate this hypothesis and make a clear distinction between digital stressors and perceived stress in order to overcome an existing weakness, as research on technostress has been criticized for trying to assess the stressor and the stress within a single measure at the same time (Hall et al. 2021).
We decided to evaluate the perceived stress of insurance intermediaries on a global level for two reasons. First, insurance intermediaries are not only exposed to digital stressors in their work but also to other stressors, such as marriage problems in the private sphere or time and performance pressure and demanding insurance customers (for this and numerous other stressors in the workplace, see Reiff et al. 2021), which can also lead to perceived stress. An insurance intermediary’s perception of stress will therefore be an overall state whose outcomes attributed to stress “… [are] affected by a person’s global stress level, not just by [their] response to a particular event or [technology]” (Cohen et al. 1983). Second, by assessing the digital stressors and the global level of perceived stress, it is possible to use analytical methods to examine how strong the influence of digital stressors is on the stress perception of insurance intermediaries. Regarding the impact of perceived stress of insurance intermediaries, which can be expressed in perceived helplessness and perceived self-efficacy (Taylor 2015), it is interesting to examine how this stress affects their performance. This is because it is mentioned repeatedly in articles that there is a negative relationship between perceived stress and job performance (Meunier et al. 2022). Therefore, the following hypothesis is examined:
H4. 
The perceived stress of an insurance intermediary is negatively related to his performance.

2.3. Facilitating or Impeding Factors

According to the stress model, in addition to the digital stressors, personal and situational facilitating or impeding factors must be considered. Since there are many manifestations of personal or situational facilitating or impeding factors, it is necessary to create a restriction in this study. This is achieved based on the assessment of the importance of the factors for the object of this study and the fact that the factors have already been investigated and sufficiently operationalized in other studies and are therefore highly applicable.
Positive and negative feelings about digital technologies influence an individual’s propensity to adopt and use digital technologies (Parasuraman and Colby 2015). Technology optimism, which determines a person’s predisposition to use digital technologies, is “a positive view of technology and a belief that it offers people increased control, flexibility, and efficiency in their lives” (Parasuraman and Colby 2015, p. 60). However, technology optimism not only affects the use of digital technologies but also “may affect the direct experience of the stressor, by leading individuals to appraise a lower potential intensity of the stressor” (Tarafdar et al. 2015, p. 113). This leads to the following hypotheses:
H5a. 
The technology optimism of an insurance intermediary is positively related to his use of digital technologies.
H5b. 
The technology optimism of an insurance intermediary is negatively related to his perception of digital stressors.
Salespeople who believe in their ability to use digital technologies to achieve work goals are confident in using these technologies (Rayburn et al. 2021; Shu et al. 2011). Furthermore, a higher belief in one’s technology capabilities to successfully perform a computer-related task, defined as computer self-efficacy by Shu et al. (2011), shows significant negative relationships with the two stressors of complexity and insecurity (Shu et al. 2011). Other findings suggest that competence, defined as computer experience by Tams et al. (2018), moderates the effects of the stressor of interruption on perceived mental workload, so a higher level of competence is related to a lower mental workload (Tams et al. 2018). Since this should also apply to insurance intermediaries, the following hypotheses can be formulated:
H6a. 
The technological capabilities of an insurance intermediary are positively related to his use of digital technologies.
H6b. 
The technological capabilities of an insurance intermediary are negatively related to his perception of digital stressors.
Organizational encouragement to use digital technologies is a situational facilitating factor. In this regard, Sundaram et al. (2007) found that when managers encourage salespeople more frequently to use technologies, they are more likely to do so and to integrate them into their daily work routine. Apart from verbal encouragement, rewards for the use of digital technologies (e.g., subsidies for the purchase of mobile devices) and the involvement of salespeople in the introduction of digital technologies should be considered, which should make it easier for salespeople to adapt to innovations, which in turn reduces the digital stressor of insecurity, among other things (Tarafdar et al. 2015; similar Califf et al. 2020). In the insurance industry, it is quite common to involve intermediaries in developing new (digital) tools. Thus, we propose the following hypotheses:
H7a. 
Organizational encouragement to use digital technologies is positively related to the insurance intermediary’s use of digital technologies.
H7b. 
Organizational encouragement to use digital technologies is negatively related to the insurance intermediary’s perception of digital stressors.
Another situational-facilitating factor is organizational support. Organizational support means facilitating knowledge sharing about digital technologies, providing technical training for the sales force, and providing clear documentation about digital technology use, which can make it easier for salespeople to use digital technologies and reduce perceptions of the stressors of complexity and uncertainty (Tarafdar et al. 2015). In the case of insurance agents, this is performed by the insurance companies; in the case of insurance brokers, this is performed by external IT service providers or the IT department of the broker (in the case of large broker firms). Training in digital technologies is particularly important for salespersons so that they can and want to use the technologies efficiently (Sundaram et al. 2007). We thus frame the following hypotheses:
H8a. 
Organizational support is positively related to the insurance intermediary’s use of digital technologies.
H8b. 
Organizational support is negatively related to the insurance intermediary’s perception of digital stressors.
In summary, this results in the following research model (see Figure 1).

3. Methodology

After the research model was built, the constructs were operationalized, and data were collected based on a survey. Surveys with self-report measures are the most common method of data collection when addressing digital stress (Fischer and Riedl 2017), and they help explore subjective perceptions and the cognitive and emotional feelings of stress (Kasten and Fuchs 2018). The data obtained through the questionnaires were analyzed using structural equation modeling, as this methodologically sound approach offers the possibility of estimating complex relationships among multiple dependent and independent latent variables, i.e., constructs simultaneously, as is the case in the research model.

3.1. Operationalization and Survey Design

As the research model shows, there are twenty constructs and three higher-order constructs, of which three lower-order constructs are related to performance, two lower-order constructs are related to perceived stress, and ten lower-order constructs are related to digital stress. Constructs are represented by indicators, often also called manifest variables or items, that are directly measurable and observable (Sarstedt et al. 2022). For the operationalization of the constructs in the research model, existing operationalizations from various studies were used (see Appendix A), as these have already been validated, and the corresponding indicators, i.e., items (see Appendix B), were consistently applied in the survey design.
For the construct “TechUsage”, we adapted or complemented the digital technologies identified in a study on digital stress (Gimpel et al. 2018) to insurance distribution, resulting in 21 digital technologies for insurance intermediaries. For each of these technologies, it was asked how often they are used by an insurance intermediary using the scale developed by Sundaram et al. (2007) that was extended with a seventh option, namely, “never”. Therefore, the frequency of use of the technologies was measured on a seven-point Likert scale from 0 (never) to 6 (several times a day). Since this study does not focus on the use of individual technologies and their effects but rather on the intensity of use of all the technologies available to the insurance intermediary, for each insurance intermediary, each technology was multiplied by the stated frequency. Then, all values were summed, resulting in a total score for the intensity of utilization of digital technologies (including all digital technologies) per insurance intermediary.
Regarding the operationalization of the facilitating factors and the lower-order constructs of digital stressors and performance (see Appendix A), the wording of the 70 items (see Appendix B) was slightly modified in some cases, e.g., we did not use abbreviations such as ICT, we used plural instead of singular, and we consistently used the term digital technologies. All these items were measured on a five-point Likert scale ranging from 1 (strongly disagree) to 5 (strongly agree).
For the operationalization of perceived stress, we used the Perceived Stress Scale (PSS-10) that was developed by Cohen (Cohen and Williamson 1988), which is one of the most widely used and extensively validated scales (Hampton et al. 2016; Kasten and Fuchs 2018). The PSS is also useful since it does not attempt to discriminate between primary and secondary appraisals of stressors and subsequent coping processes but rather provides a global measure of appraisals (Kasten and Fuchs 2018). Consistent with previous research, the two factors, perceived helplessness and perceived self-efficacy, underlie the PSS-10 (Taylor 2015; see Appendix A), and the corresponding 10 items (see Appendix B) were measured on a five-point Likert scale ranging from 0 (never) to 4 (very often). Items related to perceived self-efficacy had to be scored in the reverse direction—this is why we call this construct “Perceived Self-Inefficacy”—by summing up all item values, the correct total PSS score is calculated.

3.2. Data Collection

Data were collected by conducting an online survey. To enable as many insurance intermediaries as possible to access the online survey, the link to the survey was promoted by the Bundesverband Deutscher Versicherungskaufleute e.V. (a federal association of German insurance intermediaries). The online survey occurred from 23 March 2022, to 14 April 2022. We received 876 answered questionnaires, of which 462 had no missing values, and another 209 answered questionnaires, which contained very few missing values, so mean value substitution could be performed for these. A total of 205 questionnaires had to be eliminated due to weaknesses in the data. Therefore, our final sample consisted of 671 responses. The data sample is shown in Figure 2.
The demographic data of the sample show a strong weighting in favor of older and male intermediaries. However, according to experts from various intermediary associations, this distribution is quite typical for the intermediaries in Germany and has been confirmed repeatedly for many years in empirical surveys by the intermediaries association (most recently in BVK 2023). In contrast, the high proportion of exclusive tied agents does not represent the German market. Thus, the statements of the present study apply primarily to exclusively tied agents and, to a lesser extent, to multi-tied agents and brokers.

3.3. Data Analysis Using PLS-SEM

There are two common types of structural equation modeling (SEM) in practice, namely, covariance-based SEM (CB-SEM) and partial least squares SEM (PLS-SEM). They are designed to achieve different objectives, differ from a statistical point of view, and also differ in model parameter estimation—CB-SEM uses maximum likelihood estimation, and PLS-SEM uses least squares estimation (Hair et al. 2021). In this study, we chose PLS-SEM (using Smart PLS 4, version 4.0.9.0) because it fits better with the research objective, model setup, and data characteristics (for decision criteria, see Hair et al. 2019 and Hair et al. 2021). First, PLS-SEM is exploratory and prediction-oriented and therefore fits with the study’s objective of exploring how the use of digital technologies by insurance intermediaries affects their performance. Second, PLS-SEM permits the use of single-item constructs, reflective constructs, and formative constructs simultaneously and should be used when formative constructs are included in the structural model. This is the case in this study, as we define “TechUsage” as a single-item construct, “Performance” as a reflective-formative higher-order construct, and all other constructs as reflective or reflective-reflective higher-order constructs, consistent with the literature (Petter et al. 2007). Third, negative perceptions such as stressors often cause a skewed distribution (Turel in Maier et al. 2014), and PLS-SEM can handle skewed distributions in the data set.
The results of PLS-SEM were evaluated according to the standard methodological procedure (Sarstedt et al. 2022), i.e., the measurement model representing the relationships between each latent variable (construct) and its associated indicators was examined. Then, the structural model addressing the relationships between the constructs representing the proposed hypotheses was evaluated.
When assessing the measurement model, the indicator reliability (item loading), internal consistency reliability (Cronbach’s alpha and composite reliability), convergent validity (average variance extracted), and discriminant validity (HTMT) were used as evaluation criteria for reflectively measured constructs (see Sarstedt et al. 2022):
Cronbach’s alpha (α) is
K r ¯ [ 1 + ( K 1 ) r ¯ ]
  • K = construct´s number of indicators.
  • r ¯ = average non-redundant indicator correlation coefficient.
Composite reliability (CR) (for standardized data) is defined as
( k = 1 K l k ) 2 ( k = 1 K l k ) 2 + k = 1 K v a r ( e k )
  • K = the construct´s number of indicators.
  • k = the indicator variable.
  • l k = the standardized outer loading of indicator variable k.
  • e k = the measurement error of indicator variable k.
  • v a r   ( e k ) = the variance of the measurement error.
The average variance extracted (AVE) is defined as
( k = 1 K l k 2 ) K
  • K = the construct´s number of indicators.
  • k = the indicator variable.
  • l k = the standardized outer loading of indicator variable k.
The definition of the HTMT criterion is the mean value of the indicator correlations across constructs relative to the (geometric) mean of the average correlations of indicators measuring the same construct.
For formatively measured constructs, as in the case of the construct “Performance” as a reflective-formative higher-order construct, other criteria are of concern. Particularly, collinearity issues among the indicators of formatively measured constructs should not be given. Here, the variance inflation factor is an important evaluation criterion. The variance inflation factor (VIF) is defined as
V I F k = 1 1 R k 2
The variance inflation factor is—in addition to the statistical significance of the path coefficients and coefficient of determination (R2)—also an evaluation criterion used to assess the structural model (Hair et al. 2019, 2021). There are threshold values for each evaluation criterion, which we discuss in the Research Results section.

4. Research Results

Self-reported data gathered at a given point in time may be affected by common method bias (Podsakoff et al. 2003). To evaluate the potential presence of common method bias in the data set, two different tests were performed. First, one of the most widely used tests, Harman’s single-factor test, was performed to see whether a single factor accounts for the majority of the variance (Podsakoff et al. 2003). In our data, the results indicate that only 8.65% of the variance is explained by a single factor. Second, a full collinearity test was performed in PLS-SEM to verify if the resulting variance inflation factors (VIFs) were greater than 3.3, which would indicate that the data may be contaminated by common method bias (Kock 2015). In our data, all VIFs are smaller than 3.3. Based on these two tests, we can conclude that no substantial common method bias issues impact our data.

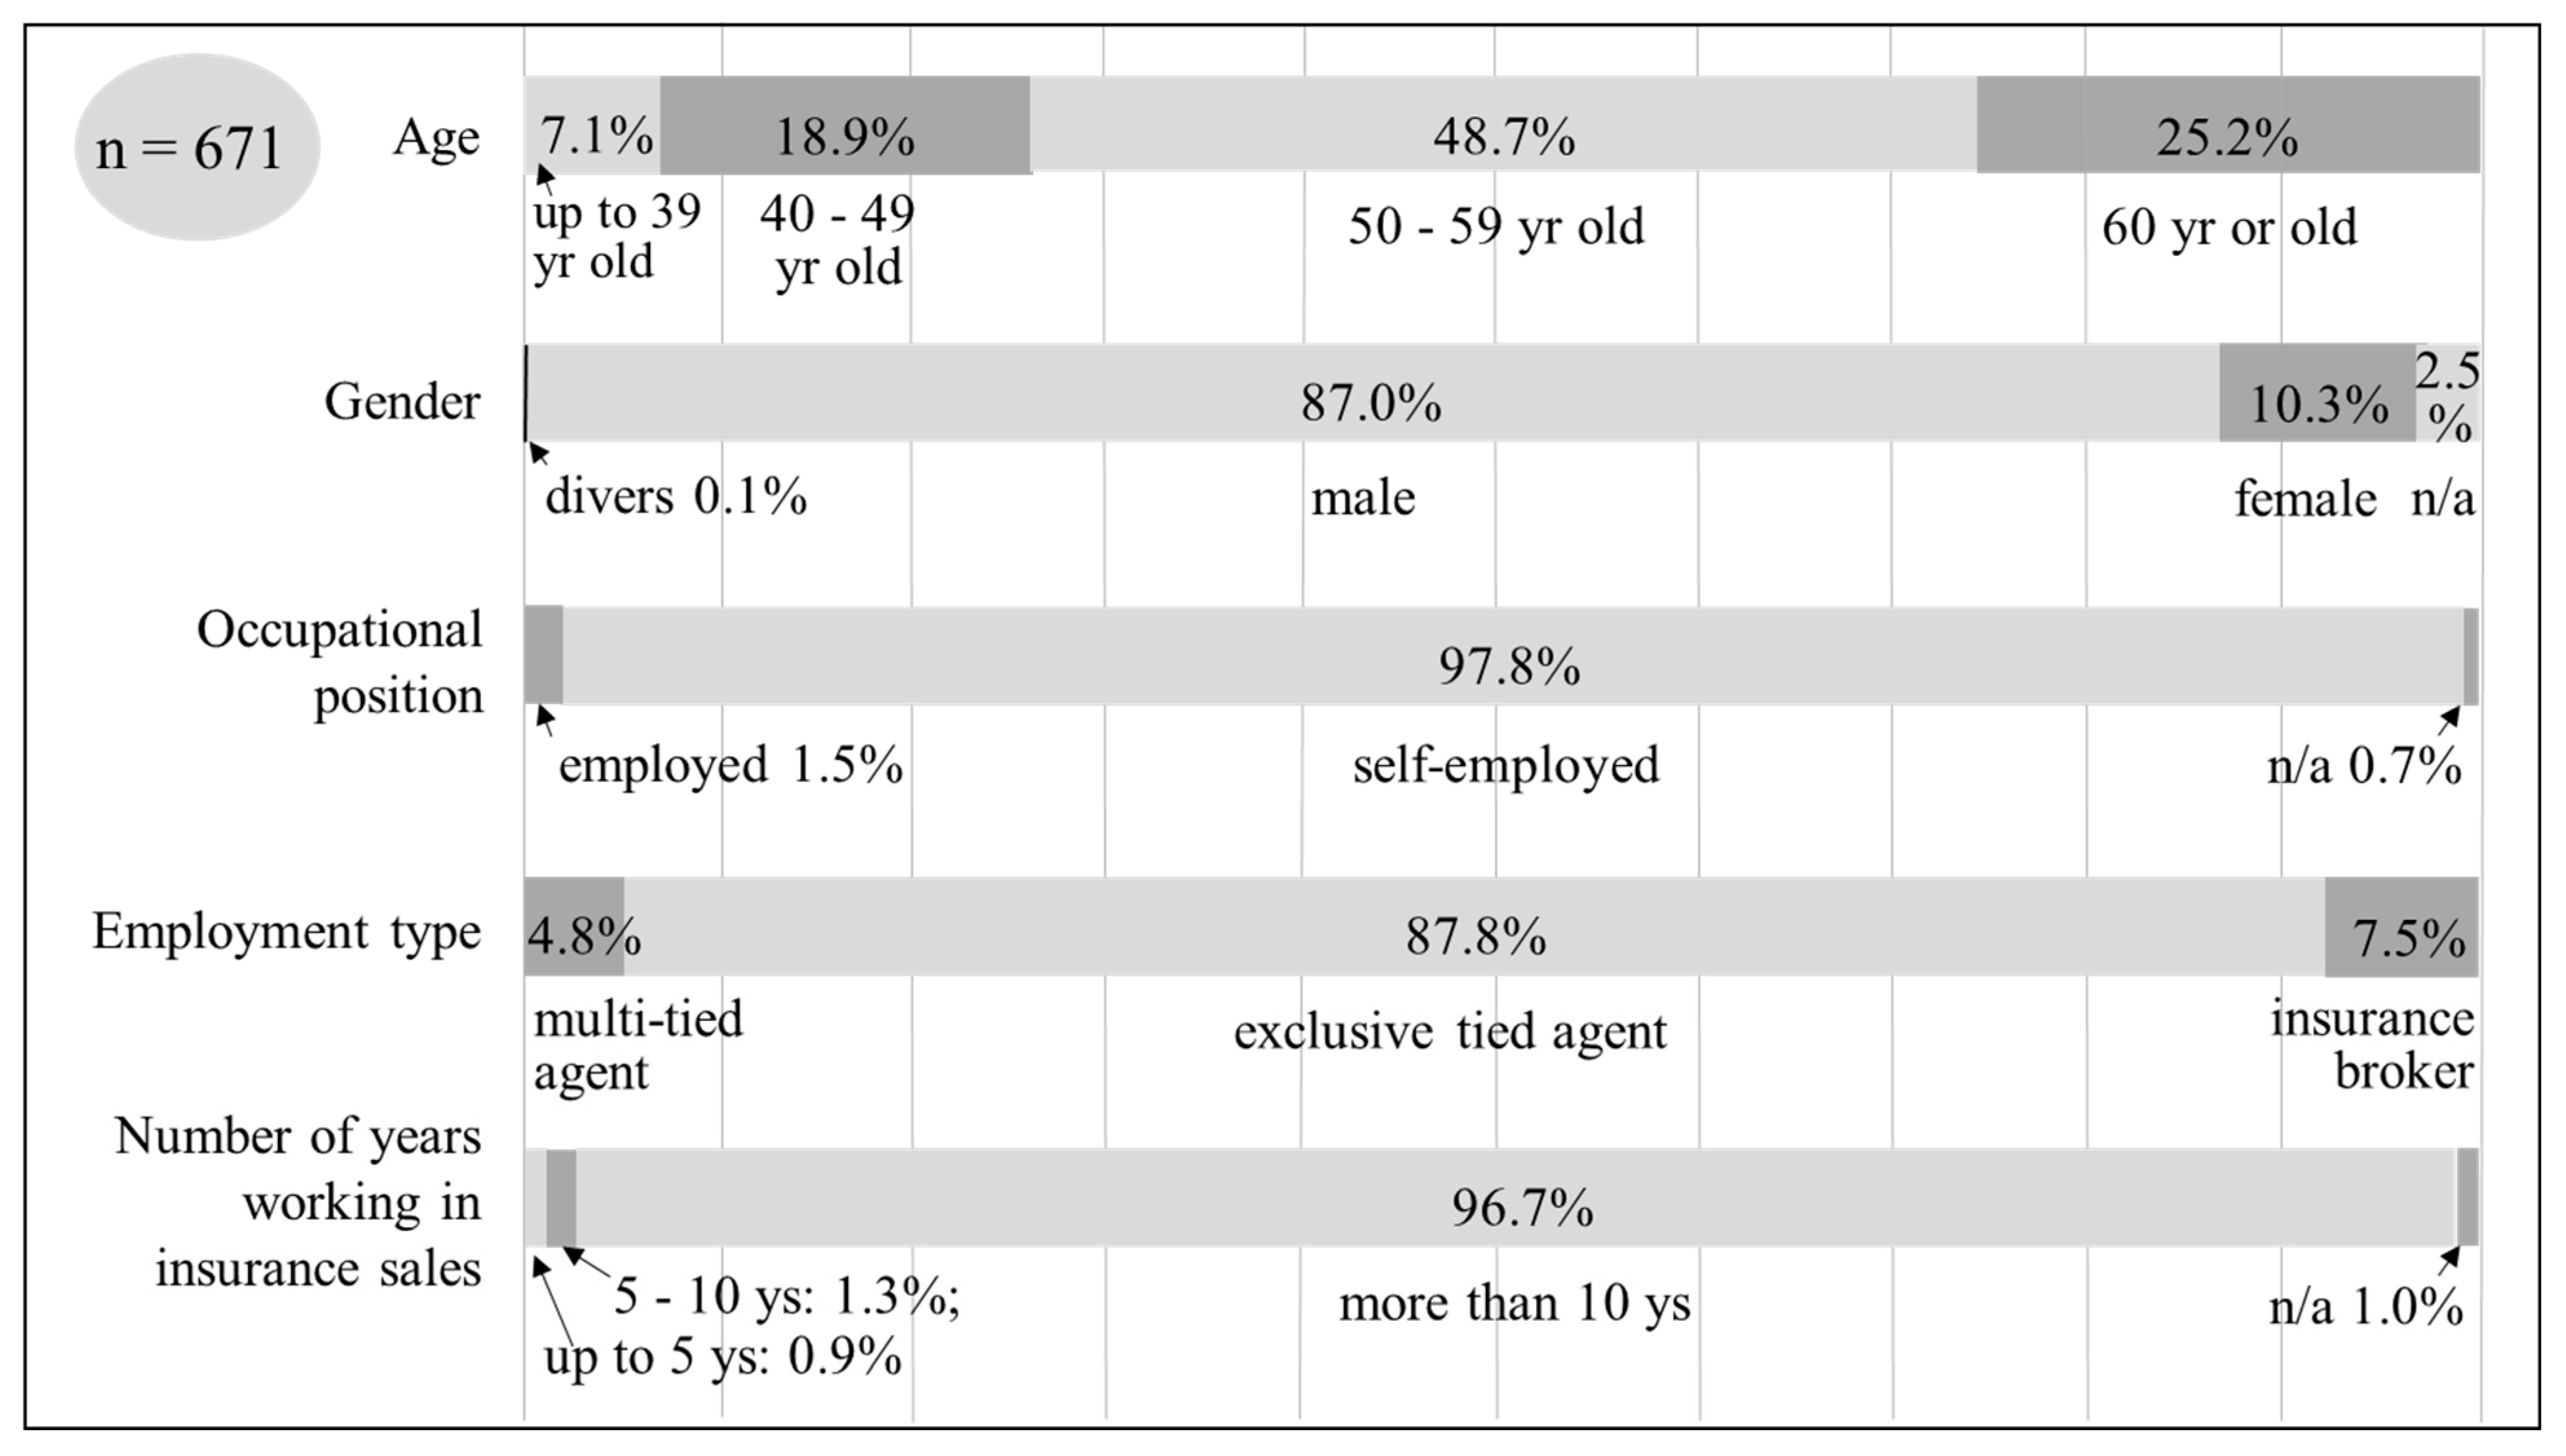
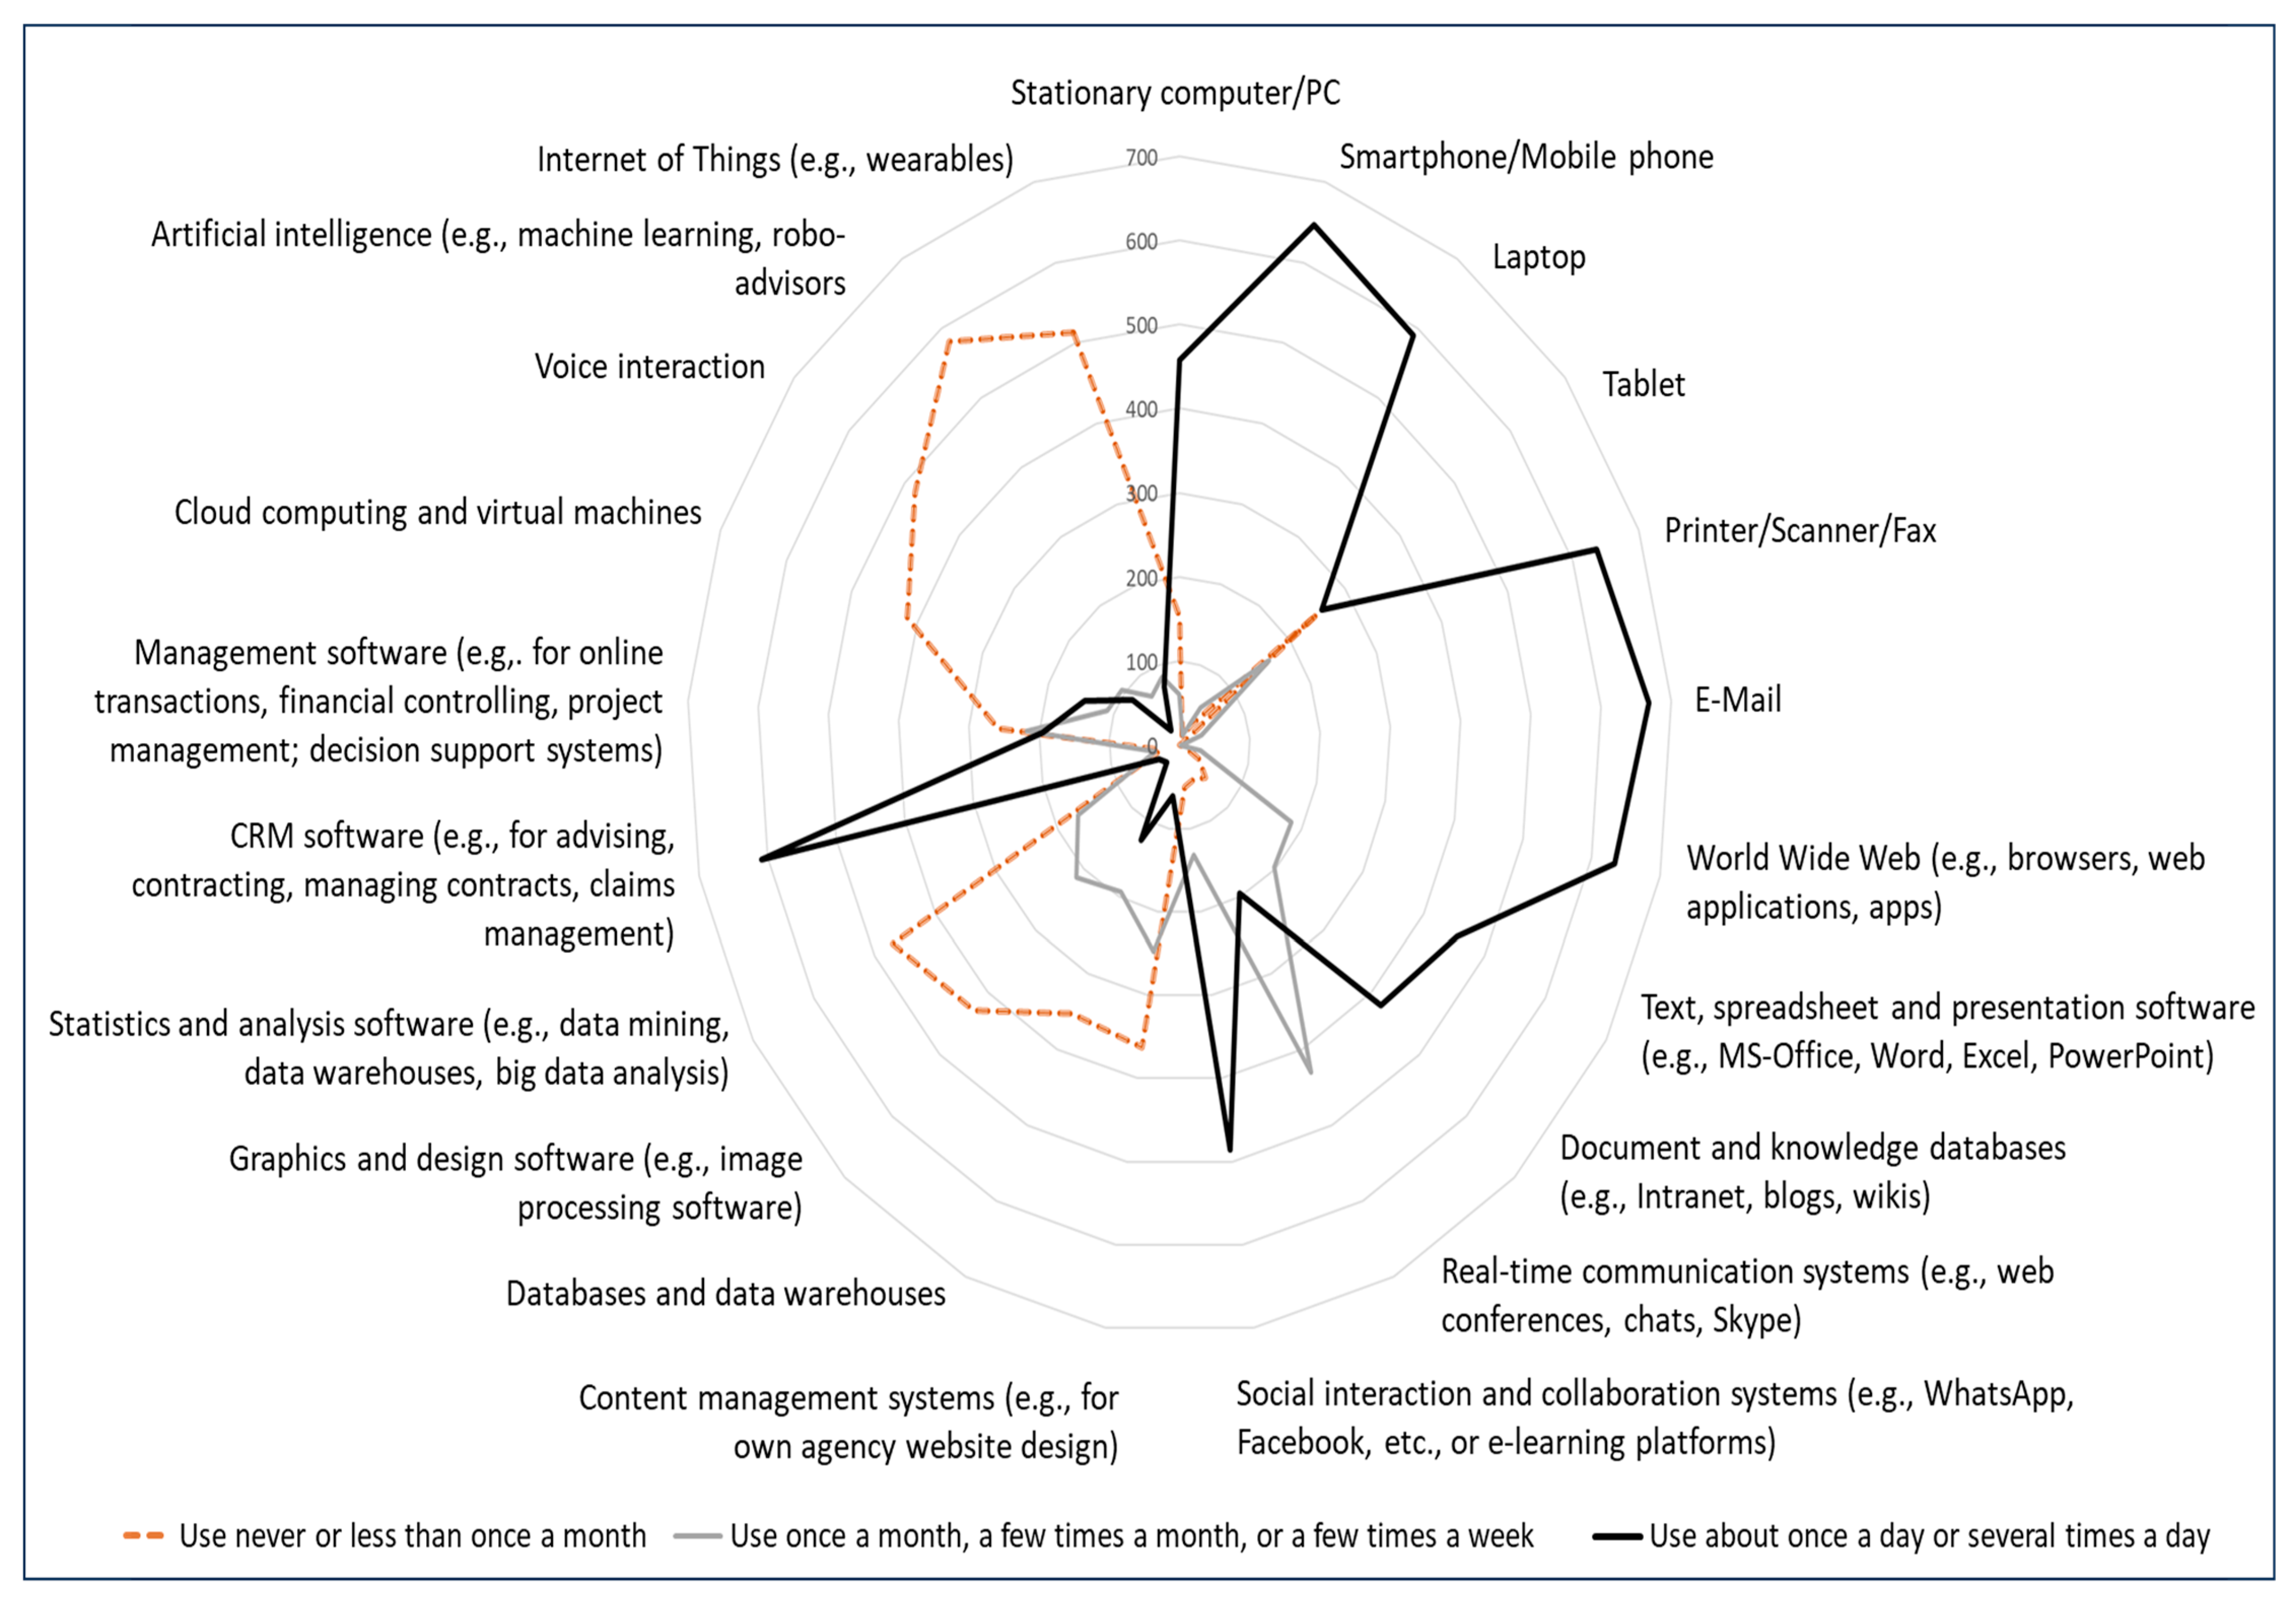
4.1. Descriptive Results

Evaluations of the survey data show that insurance intermediaries use digital technologies to varying degrees (see Figure 3). There are digital technologies that are used daily or several times a day, such as smartphones (in 96.4% of cases), e-mails (in 99.7% of cases), or customer service software (in 90.8% of cases). However, there are also digital technologies that are rarely used by insurance intermediaries, i.e., never or less than once a month, such as artificial intelligence (e.g., machine learning or a robo-advisor) (in 86.4% of cases) or cloud computing and virtual machines (61.9% of cases).
Regarding the individual perceived stress level of an insurance intermediary, this can be assessed by summing the individual item values of the PSS-10. Individual PSS scores can range from 0 to 40. Scores ranging from 0 to 13 are considered low stress, scores ranging from 14 to 26 are considered moderate stress, and scores ranging from 27 to 40 are considered high perceived stress (State of New Hampshire 2022). The analysis of the questionnaire shows that the mean value of the PSS-10 is 17.16, and using the score division mentioned above, 209 insurance intermediaries (31.1%) perceive low stress, 410 insurance intermediaries (61.1%) perceive moderate stress, and 52 insurance intermediaries (7.8%) perceive high stress. Figure 4 illustrates the PSS score and the number of insurance intermediaries that have the same PSS score.
More descriptive values (mean and standard deviation) can be found in Appendix B.

4.2. Measurement Model

Because our research model includes lower-order constructs and higher-order constructs, we have to consider the “measurement models of the lower-order components, and […] the measurement model of the higher-order construct as a whole, represented by the relationships between the higher-order component and its lower-order components” (Sarstedt et al. 2019, p. 200).
As all lower-order constructs were specified as reflective, indicator loadings, internal consistency, convergent validity, and discriminant validity have to be assessed according to the corresponding criterion values (see Hair et al. 2019). Regarding indicator loadings, almost all items’ loadings are above the threshold value of 0.708 (see Appendix B). Only five items have loading values ranging from 0.468 to 0.694. Still, they do not have to be deleted since the deletion will not result in an increase in internal consistency reliability or convergent validity above the suggested threshold value (Hair et al. 2021). Composite reliability (CR) and Cronbach’s alpha (α) or at least composite reliability (rho_a), which lies between Cronbach’s alpha (as the lower bound) and composite reliability (rho_c) (as the upper bound), should be higher than 0.7. The values for all constructs are above the threshold, which indicates sufficient internal consistent reliability. Regarding convergent validity, each construct’s average variance extracted (AVE) exceeded the threshold value of 0.50, ranging from 0.526 to 0.856, and therefore adequate convergent validity is given. To assess discriminant validity and to see if a construct is distinct from other constructs in the model, the Fornell-Larcker criterion and the heterotrait-monotrait (HTMT) ratio can be used. As we can see in Appendix D, the Fornell-Larcker criterion is fulfilled, as the square root of the AVE of each construct is greater than the inter-construct correlation of that same construct. In addition, since all HTMT values (see Appendix C) are lower than 0.90, which is the requirement for conceptually similar constructs, and since the confidence intervals obtained by bootstrapping did not include critical values (we executed a bias-corrected and accelerated bootstrapping with 5000 subsamples), discriminant validity is confirmed.
Higher-order constructs were considered reflective and formative, and the embedded two-stage approach was applied. For reflective higher-order constructs, the same evaluation criteria generally apply (Sarstedt et al. 2019). Regarding the indicator loading, loadings range from 0.611 to 0.924 (see Table 1). As before, even if not all items are above the threshold value of 0.708, they are not deleted since AVE, CR, and α are at good levels. For composite reliability and Cronbach’s alpha reps., the composite reliability (rho_a) values are above the threshold, and AVE is above 0.50, confirming internal consistent reliability and convergent validity. Furthermore, discriminant validity is given since the Fornell-Larcker criterion is fulfilled, and all HTMT values are lower than 0.90 (see Appendix E). Moreover, the confidence intervals obtained by bias-corrected and accelerated bootstrapping with 5000 subsamples did not include critical values. Regarding the higher-order construct that was specified as formative, the variance inflation factor (VIF) values (see Hair et al. 2019) do not exceed the value of 5, and two of them are even below 3, which is considered ideal (see Table 2). In addition, weight and its statistical significance have to be assessed, the latter based on bootstrapping. After executing a bias-corrected and accelerated bootstrapping with 5000 subsamples, the results show that there is no critical value included in the confidence interval of an indicator weight that indicates that weights are statistically significant. Hence, all higher-order constructs were validated.

4.3. Structural Model

To assess the structural model, a collinearity test was performed, the relevance of the path coefficients and their statistical significance were evaluated, and the coefficient of determination (R2) value of the endogenous constructs was examined (Hair et al. 2019, 2021). Since VIF values should be close to 3 and the highest VIF value of the inner model is 2.108 (see Appendix F), collinearity did not pose any threat. Path coefficients and p-values obtained by a bias-corrected and accelerated bootstrapping with 5000 subsamples can be found in Figure 5, which shows the overall results of the structural model, and in Table 3, which further validates the hypothesis. As can be seen, most of the hypotheses are supported. However, hypothesis H7b, which states that organizational encouragement to use digital technologies is negatively related to insurance intermediaries’ perceptions of digital stressors, is not confirmed because, first, it is positively associated and, second, it does not have a significant effect. Hypothesis H8a is also not supported: although organizational support is positively associated with the insurance intermediary’s use of digital technologies, as hypothesized, the effect is very small and insignificant.
In addition to direct effects, the model includes indirect and non-hypothesized effects as a sequence of two or more direct effects. These total indirect effects and their tested significance level (tested with bootstrapping as indicated above) are listed in Appendix G.
Regarding the explanatory power of the structural model, R2 values as a measure for the variance in the endogenous variable explained by the exogenous variables are shown in Figure 5. Perceived stress has the highest R2 value (0.417), meaning that 41.7% of the variance of perceived stress is explained in the research model. There are different opinions on when R2 is acceptable or good, which often depends on the research discipline (Cohen 1988). Following Cohen (1988), R2 values for digital stressors and performance are considered moderate, being above 0.13, and R2 values for TechUsage and perceived stress are considered substantial, being above 0.26. Thus, we can conclude that the explanatory power of the structural model is relevant.

5. Discussion

5.1. Main Findings

This study examined the extent and type of digital technologies used by intermediaries, their impact on performance, and the role of digital stress in this context. The most important findings are now briefly discussed.
Concerning technology use, it is apparent that insurance intermediaries use digital technologies very intensively in some cases, particularly work-relevant digital technologies such as smartphones, e-mails, CRM software (for advising, contracting, and claims management), and systems for social interaction and collaboration (e.g., social networks or e-learning platforms), or they use them rarely or not at all, such as artificial intelligence or the Internet of Things. It can be assumed that insurance intermediaries primarily use technologies that are associated with a high performance expectancy because this expectancy is a significant direct determinant of usage (Venkatesh et al. 2003). This is confirmed by the high level of agreement with the statements that technologies increase productivity and provide flexibility in time and place for completing work. In addition, insurance intermediaries are rarely asked for technological advice by third parties but are nevertheless up to date regarding technological developments (see Appendix B). This pragmatic attitude might be related to the fact that they are self-employed entrepreneurs. Furthermore, the COVID-19 pandemic also contributed to more digital communication from the home office because customers could not be reached otherwise (Insurance Europe 2022). Insurance intermediaries therefore use digital technologies and are open to them; however, they use them primarily in a purpose-oriented way, which is why they primarily use technologies that are already mature today rather than technologies of the future. This contradicts Eckert et al. (2021), who concluded that insurance intermediaries do not use digital technologies very much and that this is possibly because they are not open-minded enough. In our opinion, the different interpretation is probably because they surveyed significantly fewer digital technologies than us.
Furthermore, it is remarkable that there is a significant, medium-large effect of the intensity of the use of digital technologies on performance; this applies mainly to strengthening customer relationships, increasing productivity, and, to a lesser extent, increasing revenue. The goals of digitalization therefore seem to be achieved.
In this regard, the fact that three personal and organizational factors examined have a significant positive influence on the use of digital technologies is beneficial; this is strong in the case of technology capabilities and somewhat more moderate in the case of technology optimism and organizational encouragement.
For the first time, the stress level of insurance intermediaries was measured. The mean value of 17.16, measured with PSS-10, indicates perceived moderate stress. This value appears to be high when compared with the mean PSS score for men of 15.52 in 2009 recorded in a comparative study in the USA (Cohen and Janicki-Deverts 2012) and the mean PSS score for 40-59-year-old men of 12.61 recorded in a representative study in Germany (Klein et al. 2016). However, many years of new developments between the surveys and COVID-19 could explain this higher value. Age-related differences were not found in our study, except for people older than 66 years, who perceived lower stress. As far as the role of age is concerned, literature on (techno)stress has produced different and contradictory study results (Tams et al. 2018).
One of the most important and remarkable findings of our research is that the effect of digital stressors on the perceived stress of insurance intermediaries is large and statistically significant. Since perceived stress has a negative effect on performance—a medium-large effect—it makes sense to look more closely at digital stressors and to take steps to reduce high levels of them in order to improve performance.
Our survey shows that some stressors are particularly pronounced among insurance intermediaries. These include, for example, the perceived requirement to always be up to date with digital skills, having to work in one’s free time due to digital accessibility, having to adapt work processes to technical developments, and the feeling that the workload is increasing due to increasing digital complexity (Appendix B). In short, insurance intermediaries have a positive attitude toward digital technologies and use them pragmatically to improve their performance. At the same time, however, this entails efforts, changes, and an even higher workload.
Another finding is surprising because it is counterintuitive: the frequency of the use of technologies per se, whether used less or more, has only a small amplifying influence on digital stressors and perceived stress. Hampton et al. (2016) came to a similar conclusion. Whether perceived stress is caused by technology use and the presence of digital stressors is therefore also determined by other aspects, such as the assessment of performance expectancy and effort expectancy concerning technologies (Venkatesh et al. 2003), as well as the appraisal and handling of digital stressors.
Since technology optimism, technology capabilities, and organizational support are negatively associated with digital stressors, as hypothesized and supported by literature, insurance companies should promote them. Here, technology optimism has the greatest influence on digital stressors. However, there is no significant effect of organizational encouragement on digital stressors, which contrasts with previous findings indicating that user involvement reduces digital stress-creating factors (Tarafdar et al. 2010). This could be caused by the composition of the sample, which mainly includes exclusive tied agents for which the use of digital technologies is mostly prescribed by the insurer and of which only a few selected intermediaries are consulted or involved in the introduction of new technologies in the working environment; accordingly, organizational encouragement hardly plays any role here.
For insurers, this study provides concrete starting points regarding technological capabilities and organizational support: the former can be increased, for example, especially through training and knowledge transfer, but also through intuitively designed expert systems. There seems to be a need for improvement in organizational support; although the support itself is perceived as rather pronounced, the stressor of unreliability shows (too) high values (Appendix B), which indicates dissatisfaction with the error susceptibility of the technologies. Here, measures such as a hotline or external access by the support team could make things easier (and reduce stress) if necessary. In contrast, technology optimism among insurance intermediaries is already quite pronounced and offers less potential for improvement; this may be related to the general optimism of salespersons.
Overall, insurance companies and intermediaries can use accompanying measures to increase the efficiency, productivity, and customer-loyalty effects intended by investments in digitalization.

5.2. Limitations

Some of the limitations of this study arise from the inherent conflict of never being able to fully examine such a broad topic as digitalization, the performance of insurance intermediaries, and stress. This is partly because of the complexity of the individual topics and partly because of the limitations imposed by the survey design and the number of questions that can be asked. Therefore, several aspects were not investigated in this study, e.g., aspects from models of technology acceptance, the question of whether and how private and professional use of digital technologies influence each other, or other factors influencing performance, such as sales personality, sales skills, and routines.
Regarding methodological aspects, a selection bias can occur due to the use of web survey design because web surveys rely on the self-selection of respondents (Bethlehem 2010). This might be because insurance intermediaries with higher levels of digital affinity are overrepresented because they use the internet daily and, therefore, are more likely to participate. This is probably the case in the present study, and thus it can be assumed that we overestimated technology optimism and technological capabilities and underestimated digital stressors.
Another limitation results from the data set since 88 percent of the respondents are exclusive-tied agents and only 7 percent are brokers. Thus, the study findings cannot be easily generalized to brokers.

5.3. Conclusions

Our study complements existing literature on insurance distribution and research on technostress/digital stress. There are four main contributions:
First, this study is the first to provide a comprehensive look at the extent of digital technology use by insurance intermediaries, the impact on their performance, and the role of digital stress in this context. It also presents initial findings in this field. This is relevant since insurance intermediaries continue to play a key role in insurance distribution, especially for complex insurance products or particular (technology-averse) target groups, and should therefore be considered in (future) research (Eckert et al. 2022).
Second, the survey provides empirical evidence for the perceived benefits of digital technologies by insurance intermediaries. From their point of view, digital technologies have contributed to strengthening customer relationships and increasing productivity and revenues and were therefore rated positively.
Third, we extend the findings in technostress/digital stress research because we are not trying to assess the stressor and the stress within a single measure simultaneously. By examining digital stressors, perceived stress, and their effects on the performance of insurance intermediaries as constructs in their own right, this study further addresses the importance “… of considering different types of psychological outcomes and their mediating effects on other relevant outcomes, such as turnover behavior and task productivity [and performance]” (Nastjuk et al. 2023, p. 15).
Fourth, this study provides empirical evidence for the importance and potential impact of digital stressors on perceived stress, as well as the impact of perceived stress on performance. This could serve as a basis for practical implications at both the individual and organizational levels, such as finding ways to create a supportive environment, reduce the severity of stressors, or manage stressors.
Some issues might be of interest for further research. First, the survey could be conducted with brokers only or with a significantly higher number of brokers in order to be able to make more precise statements about this distribution channel. Second, concerning technology use, it would be useful to consider aspects from models of technology acceptance, i.e., perceived usefulness, as well as attitudes toward technology and intentions to use it (Venkatesh et al. 2003). Third, other personnel- or situation-related facilitating or inhibiting factors could be investigated, such as a sense of community at work as a social support dimension (Lanzl 2023). The same applies to other factors influencing performance, such as sales personality, sales skills, and routines; existing customer bases and relationships; and how these relate to digital stressors and perceived stress. Fourth, performance could be measured objectively instead of using a (subjective) self-assessment, e.g., based on the premium income produced (see Ahearne et al. 2008; Vieira 2022), cancellation rates, or net promoter score (Köhne 2024; for an overview of performance measures currently used in studies, see Wu et al. 2024). Fifth, the use of digital tools and their effect on performance could also be analyzed with regard to typical customer touch points (contract conclusion, contract modifications, the event of the damage, further contacts) (Eckert et al. 2022), which can provide further starting points for insurers. Finally, even if the perceived stress scale used here does not discriminate between appraisals of digital stressors and subsequent coping processes, it would be interesting to explore which coping mechanisms insurance intermediaries use to deal with digital stressors and which of these are particularly useful (see Heinzel 2021). This would help derive generalizable recommendations for the practical work of insurance intermediaries.

Author Contributions

Idea, T.K.; M.K. Methodology: T.K.; M.K. Writing and Visualization T.K.; M.K. All authors have read and agreed to the published version of the manuscript.

Funding

This research received no external funding. The APC was funded by Institut für Versicherungswirtschaft Berlin.

Data Availability Statement

The data presented in this study are available upon request from the corresponding author.

Acknowledgments

We would like to thank two anonymous reviewers for their helpful comments.

Conflicts of Interest

Author Marija Köhne is employed by the company Assekurum GmbH. Both authors declare that the research was conducted in the absence of any commercial or financial relationships that could be construed as a potential conflict of interest. The company Assekurum GmbH had no role in the design of the study; in the collection, analyses, or interpretation of data; in the writing of the manuscript, or in the decision to publish the results.

Appendix A. Operationalization of Constructs

ConstructsOperationalization According to
Technology Optimism, Technological Capabilities aParasuraman and Colby (2015)
Organizational Support b, Organizational Encouragement cTarafdar et al. (2015)
Complexity, Insecurity, Omnipresence d, Overload, UncertaintyTarafdar et al. (2007)
InterruptionGalluch et al. (2015)
Invasion of PrivacyAyyagari et al. (2011)
Performance ControlGimpel et al. (2021)
Safety, UnreliabilityFischer et al. (2021)
Interaction with Clients eTarafdar et al. (2015)
ProductivityTarafdar et al. (2007)
RevenueSundaram et al. (2007)
Perceived helplessness, Perceived Self-Inefficacy fCohen and Williamson (1988)
Note: The single-item-construct TechUsage is not displayed here. For some constructs, we use a different term than in the original source. They originally had the name: a: innovativeness, b: technical support provision, c: involvement facilitation, d: invasion, e: technology enabled performance, f: Perceived self-efficacy (had to be scored in the reverse direction). This was made either in order to avoid misunderstandings regarding the terminology in this paper or because this appeared appropriate due to the terminology used in the operationalizations of the constructs in the original sources.

Appendix B. Item Loadings, Internal Consistency Reliability, and Convergent Validity in the Measurement Model of the Lower-Order Constructs

Construct/ItemsCronbach’s AlphaComposite ReliabilityAVELoadingsM (SD)
Technology Optimism (TechOpt)0.8160.8800.648
Techopt-1: New technologies contribute to a better quality of life. 0.8673.501 (0.952)
Techopt-2: Technology gives people more control over their lives. 0.8123.145 (1.005)
Techopt-3: Technology makes me more productive in my personal life. 0.8423.634 (0.957)
Techopt-4: Technology gives people more freedom to live and work where they please. 0.6874.061 (0.889)
Technological Capabilities (TechCap)0.8680.9100.716
Techcap-1: Other people come to me for advice on new technologies. 0.8202.882 (1.161)
Techcap-2: In general, I am among the first in my circle of friends to acquire new technology when it appears. 0.8442.512 (1.185)
Techcap-3: I can usually figure out new high-tech products and services without help from others. 0.8663.289 (1.104)
Techcap-4: I keep up with the latest technological developments in my areas of interest. 0.8543.456 (1.016)
Organizational Support (OrgSup)0.8720.9070.661
OrgSup-1: Our organization encourages knowledge sharing to help deal with new technology. 0.8333.432 (1.017)
OrgSup-2: Our organization emphasizes teamwork in dealing with new-technology-related problems. 0.8193.197 (1.109)
OrgSup-3: Our organization provides sales force training before the introduction of new technology. 0.7873.625 (1.090)
OrgSup-4: Our organization fosters a good relationship between IT department and sales force. 0.7813.130 (1.155)
OrgSup-5: Our organization provides clear documentation to the sales force on using new technologies. 0.8443.177 (1.099)
Organizational Encouragement (OrgEncour)0.8150.8790.646
OrgEncour-1: Our salespeople are encouraged to try out new technologies. 0.7533.639 (1.031)
OrgEncour-2: Our salespeople are rewarded for using new technologies. 0.7232.216 (1.129)
OrgEncour-3: Our salespeople are consulted before introduction of new technology. 0.8592.749 (1.165)
OrgEncour-4: Our salespeople are involved in technology change and/or implementation. 0.8712.758 (1.121)
Complexity (Comp)0.8660.9030.652
Comp-1: I do not know enough about digital technologies to handle my job satisfactorily. 0.8322.351 (1.061)
Comp-2: I need a long time to understand and use new digital technologies. 0.8382.382 (1.041)
Comp-3: I do not find enough time to study and upgrade my technology skills. 0.7872.710 (1.166)
Comp-4: I find new recruits to this organization know more about digital technologies than I do. 0.7172.732 (1.151)
Comp-5: I often find it too complex for me to understand and use new digital technologies. 0.8582.622 (1.113)
Insecurity (Insec)0.7300.8320.556
Insec-1: I feel constant threat to my job security due to digital technologies. 0.7962.394 (1.188)
Insec-2: I have to constantly update my digital skills to avoid being replaced. 0.6203.428 (1.078)
Insec-3: I am threatened by coworkers with newer digital technology skills. 0.8081.932 (1.008)
Insec-4: I feel there is less sharing of knowledge among coworkers for fear of being replaced. 0.7431.864 (1.012)
Interruption (Interr)0.9160.9470.856
Interr-1: I receive too many interruptions during the tasks due to digital technologies. 0.9113.165 (1.048)
Interr-2: I experience many distractions during the tasks due to digital technologies. 0.9363.151 (1.077)
Interr-3: The interruptions caused by digital technologies come frequently. 0.9283.164 (1.106)
Invasion of Privacy (InvPriv)0.9010.9310.772
InvPriv-1: I feel uncomfortable that my use of digital technologies can be easily monitored. 0.8953.091 (1.304)
InvPriv-2: I feel my privacy can be compromised because my activities using digital technologies can be traced. 0.9182.961 (1.286)
InvPriv-3: I feel my employer could violate my privacy by tracking my activities using digital technologies. 0.8562.564 (1.350)
InvPriv-4: I feel that my use of digital technologies makes it easier to invade my privacy. 0.8453.342 (1.233)
Omnipresence (Omni)0.7560.8520.660
Omni-1: I have to be in touch with my work even during my vacation due to digital technologies. 0.6943.414 (1.265)
Omni-2: I have to sacrifice my vacation and weekend time to keep current on new digital technologies. 0.8502.413 (1.137)
Omni-3: I feel my personal life is being invaded by digital technologies. 0.8822.877 (1.121)
Overload (Overl)0.8600.9050.705
Overl-1: I am forced by digital technologies to do more work than I can handle. 0.8662.776 (1.148)
Overl-2: I am forced by digital technologies to work with very tight time schedules. 0.8722.794 (1.167)
Overl-3: I am forced to change my work habits to adapt to new digital technologies. 0.7543.499 (1.079)
Overl-4: I have a higher workload because of increased digital technology complexity. 0.8623.352 (1.153)
Performance Control (PerfCont)0.8460.9080.767
PerfCont-1: I feel that my professional performance is monitored using digital technologies. 0.9152.843 (1.310)
PerfCont-2: I feel that my professional achievements can be compared with the achievements of my colleagues/competitors due to digital technologies. 0.9133.138 (1.353)
PerfCont-3: I have the feeling that more of the mistakes I make during work can be discovered through digital technologies. 0.7952.618 (1.245)
Safety (Safet)0.9190.9400.757
Safet-1: I have to worry too often, whether I might download malicious programs. 0.8632.381 (1.162)
Safet-2: I have to worry too often, whether I might receive malicious e-mails. 0.8982.566 (1.220)
Safet-3: I fear that hackers might get access to company secrets through a mistake of mine. 0.8912.433 (1.205)
Safet-4: I feel anxious when I get an e-mail from somebody that I do not know as it could be a malevolent attack. 0.8922.587 (1.273)
Safet-5: E-Mails whose sender I do not know make me nervous. 0.8042.176 (1.175)
Unreliability (Unrel)0.9330.9500.791
Unrel-1: I think that I am too often confronted with unexpected behavior of digital technologies I use at work (e.g., breakdowns or long response times). 0.8333.281 (1.168)
Unrel-2: I think that I lose too much time due to technical malfunctions. 0.9173.205 (1.217)
Unrel-3: I think that I spend too much time trying to fix technical malfunctions. 0.9003.070 (1.250)
Unrel-4: There is just too much of my time at work wasted coping with the unreliability of digital technologies. 0.9223.049 (1.267)
Unrel-5: The daily hassles with digital technologies (e.g., slow programs or unexpected behavior) are really bothering me. 0.8712.999 (1.249)
Perceived helplessness (PerHeLess)0.8710.9030.609
PerHeLess-1: In the last month, how often have you been upset because of something that happened unexpectedly? 0.8062.210 (1.040)
PerHeLess-2: In the last month, how often have you felt that you were unable to control the important things in your life? 0.8132.025 (1.110)
PerHeLess-3: In the last month, how often have you felt nervous and “stressed”? 0.8112.219 (1.086)
PerHeLess-4: In the last month, how often have you found that you could not cope with all the things that you had to do? 0.6931.615 (0.970)
PerHeLess-5: In the last month, how often have you been angered because of things that were outside of your control? 0.7702.085 (1.060)
PerHeLess-6: In the last month, how often have you felt difficulties were piling up so high that you could not overcome them? 0.7811.241 (1.110)
Perceived Self-Inefficacy (PerSeIfIneff) *0.6950.8090.526
PerSeIfIneff-1: In the last month, how often have you felt confident about your ability to handle your personal problems? 0.7101.271 (0.866)
PerSeIfIneff-2: In the last month, how often have you felt that things were going your way? 0.8241.564 (0.866)
PerSeIfIneff-3: In the last month, how often have you been able to control irritations in your life? 0.4681.644 (1.012)
PerSeIfIneff-4: In the last month, how often have you felt that you were on top of things? 0.8371.286 (0.875)
Revenue (Rev)0.8750.9140.727
To what extent have digital technologies affected the quality of your performance with regard to:
Rev-1: Selling high profit-margin products 0.8223.171 (0.737)
Rev-2: Generating a high level of sales. 0.8823.298 (0.728)
Rev-3: Quickly generating sales of new company products or of new products from partner companies. 0.8393.215 (0.753)
Rev-4: Exceeding sales targets. 0.8663.105 (0.734)
Productivity (Prod)0.8830.9280.810
Prod-2: Digital technologies help me to improve my productivity. 0.9073.433 (1.024)
Prod-3: Digital technologies help me to accomplish more work than would otherwise be possible. 0.9043.377 (1.060)
Prod-4: Digital technologies help me to perform my job better. 0.8903.436 (1.014)
Interaction with Clients (InteracCl)0.8820.9140.680
InteracCl-1: Using digital technologies results in improved customer satisfaction. 0.8023.467 (0.892)
InteracCl-2: Using digital technologies results in more time to meet with customers. 0.8362.936 (1.064)
InteracCl-3: Using digital technologies helps me make my time with customers more productive. 0.8673.330 (1.021)
InteracCl-4: Using digital technologies helps me communicate better with customers. 0.7933.772 (0.908)
InteracCl-5: Using digital technologies helps improve my overall professionalism with customers. 0.8233.721 (0.958)
Note: * Composite reliability (rho_a) is 0.771, which indicates a sufficient internal consistent reliability; Prod-1 was removed due to discriminant validity reasons in the lower-order construct; the digital stressor uncertainty was removed due to convergent validity reason in the higher-order construct; after removing item resp. construct all calculations in PLS were performed again.

Appendix C. Discriminant Validity of Lower-Order Constructs: Heterotrait-Monotrait (HTMT) Ratio

12345678910111213141516171819
1Complexity
2Insecurity 0.717
3Interaction with Clients 0.4640.384
4Interruption 0.4400.5710.365
5Invasion of Privacy 0.4130.5570.2970.463
6Omnipresence 0.3100.5070.2020.5880.405
7Organizational Encouragement 0.2730.1620.4230.1810.2140.112
8Organizational Support 0.3030.2220.4740.2190.2430.1530.850
9Overload 0.5880.6710.4740.7230.5000.6690.2120.269
10Perceived Helplessness 0.4980.6250.3470.6280.4970.5760.1830.2240.698
11Perceived Self-Inefficacy 0.3460.4480.3200.3010.2640.2650.1500.1840.3260.581
12Performance Control 0.3470.5530.1960.3810.7640.2850.1120.1430.4290.4410.231
13Productivity 0.4280.3300.8990.3430.2820.2120.3610.4080.4290.3300.3240.187
14Revenue 0.4210.4330.7020.2970.2960.1800.3710.3760.3590.3020.3730.2390.659
15Safety 0.4870.5710.2160.3860.4620.4500.0850.1240.4280.4800.2380.4120.1900.224
16Technological Capabilities 0.7210.3120.4310.0940.1430.1480.3470.3170.2060.1570.1840.1220.4050.3700.210
17Technology Optimism 0.4800.3330.7920.3080.2750.2300.4080.4270.4060.3160.2860.2210.7670.5380.1850.581
18TechUsage0.3380.0990.3060.0520.1420.1450.3320.2840.0530.0570.1130.0890.2880.2460.0950.5690.416
19Unreliability 0.5150.5740.4230.5450.5340.3750.3520.4280.6020.5710.2810.4400.3980.3570.4570.2160.3410.085

Appendix D. Discriminant Validity of Lower-Order Constructs: Fornell-Larcker Criterion

12345678910111213141516171819
1Complexity 0.808
2Insecurity0.5760.746
3Interaction with Clients −0.412−0.3150.825
4Interruption 0.4000.467−0.3310.925
5Invasion of Privacy 0.3700.460−0.2660.4200.879
6Omnipresence 0.3000.419−0.1620.5180.3690.813
7Organizational Encouragement −0.235−0.1230.364−0.159−0.188−0.0710.804
8Organizational Support −0.272−0.1810.418−0.196−0.215−0.1160.7130.813
9Overload 0.5170.531−0.4180.6430.4420.587−0.184−0.2340.840
10Perceived Helplessness 0.4370.500−0.3040.5610.4400.501−0.158−0.1950.6090.780
11Perceived Self-Inefficacy0.3000.341−0.2730.2670.2240.227−0.120−0.1620.2840.4980.725
12Performance Control 0.2970.444−0.1760.3370.6720.259−0.095−0.1280.3710.3830.1920.876
13Productivity−0.382−0.2720.796−0.308−0.253−0.1550.3110.359−0.377−0.289−0.272−0.1690.900
14Revenue−0.371−0.3550.619−0.265−0.264−0.1620.3150.330−0.315−0.264−0.306−0.2130.5820.853
15Safety0.4370.471−0.1940.3540.4210.396−0.071−0.1140.3830.4290.2050.360−0.172−0.2000.870
16Technological Capabilities−0.619−0.2510.376−0.084−0.128−0.0180.2910.279−0.179−0.136−0.156−0.1080.3550.324−0.1860.846
17Technology Optimism −0.410−0.2640.674−0.270−0.238−0.1140.3370.365−0.347−0.267−0.234−0.1820.6550.458−0.1610.4910.805
18TechUsage−0.315−0.0910.287−0.050−0.1360.0870.2980.269−0.050−0.045−0.094−0.0850.2710.231−0.0900.5310.3741.000
19Unreliability 0.4710.472−0.3850.5040.4890.352−0.310−0.3860.5400.5150.2480.393−0.361−0.3240.424−0.194−0.300−0.0820.889
Note: Square root of AVE is on the diagonal (bold highlighted).

Appendix E. Discriminant Validity of Higher-Order Constructs: Heterotrait-Monotrait (HTMT) Ratio

Construct1234567
1Digital Stressors (DigStressors)
2Organizational Encouragement (OrgEncour)0.260
3Organizational Support (OrgSup)0.3290.850
4Perceived Stress (PercStress)0.7900.2160.270
5Technological Capabilities (TechCap)0.3200.3470.3170.222
6Technology Optimism (TechOpt)0.4200.4080.4270.3930.581
7TechUsage (single item)0.1650.3320.2840.0990.5690.416

Appendix F. Inner Model: VIF Values

DigStressorsPercStressPerformTechUsage
Digital Stressors (DigStressors) 1.000
Organizational Encouragement (OrgEncour)2.097 2.078
Organizational Support (OrgSup)2.108 2.107
Perceived Stress (PercStress) 1.005
Technological Capabilities (TechCap)1.626 1.350
Technology Optimism (TechOpt)1.488 1.429
TechUsage1.458 1.005

Appendix G. Total Indirect Effects

Total Indirect Effect
from
on
Digital Stressors
(DigStressors)
Perceived Stress
(PercStress)
Performance
(Perform)
TechUsage 0.067 *
Digital Stressors (DigStressors) −0.226 ***
Technology Optimism (TechOpt) −0.161 ***0.087 ***
Technological Capabilities (TechCap)0.045 *−0.083 **0.148 ***
Organizational Support (OrgSup) −0.120 **0.049 **
Note: Path coefficients are standardized; only the significant total indirect effects are shown in this table; * p < 0.05, ** p < 0.01, *** p < 0.001.

References

  1. Ahearne, Michael, Eli Jones, Adam Rapp, and John Mathieu. 2008. High Touch Through High Tech: The Impact of Salesperson Technology Usage on Sales Performance via Mediating Mechanisms. Management Science 54: 671–85. [Google Scholar] [CrossRef]
  2. Amerirad, Behnaz, Matteo Cattaneo, Ron S. Kenett, and Elisa Luciano. 2023. Adversarial Artificial Intelligence in Insurance: From an Example to Some Potential Remedies. Risks 11: 20. [Google Scholar] [CrossRef]
  3. Ayyagari, Ramakrishna, Varun Grover, and Russell Purvis. 2011. Technostress. Technological Antecedents and Implications. MIS Quarterly 35: 831–58. [Google Scholar] [CrossRef]
  4. Beloucif, Ahmed, Bill Donaldson, and Ugar Kazanci. 2004. Insurance broker-client relationships: An assessment of quality and duration. Journal of Financial Services Marketing 8: 327–42. [Google Scholar] [CrossRef]
  5. Bethlehem, Jelke. 2010. Selection bias in web surveys. International Statistical Review 78: 161–88. [Google Scholar] [CrossRef]
  6. BIPAR (The European Federation of Insurance Intermediaries). 2023. Insurance Intermediation. Available online: https://www.bipar.eu/images/uploads/general/BIPAR_Brochure_on_insurance_intermediation-January2023.pdf (accessed on 18 August 2023).
  7. Bohnert, Alexander, Albrecht Fritzsche, and Shirley Gregor. 2019. Digital agendas in the insurance industry: The importance of comprehensive approaches. The Geneva Papers on Risk and Insurance: Issues and Practice 44: 1–19. [Google Scholar] [CrossRef]
  8. Braun, Alexander, and Florian Schreiber. 2017. The Current Insurtech Landscape: Business Models and Disruptive Potential. St. Gallen: Institute of Insurance Economics, University of St. Gallen. [Google Scholar]
  9. BVK (Bundesverband Deutscher Versicherungskaufleute). 2023. Betriebswirtschaftliche Strukturen des Versicherungsvertriebs: BVK-Strukturanalyse 2022/2023. Ahrensburg: VersicherungsJournal Verlag. [Google Scholar]
  10. Califf, Christopher B., Saonee Sarker, and Suprateek Sarker. 2020. The Bright and Dark Sides of Technostress: A Mixed-Methods Study Involving Healthcare IT. MIS Quarterly 44: 809–56. [Google Scholar] [CrossRef]
  11. Cappiello, Antonella. 2020. The Digital (R)evolution of Insurance Business Models. American Journal of Economics and Business Administration 1: 1–13. [Google Scholar] [CrossRef]
  12. Chen, Adela, and Elena Karahanna. 2018. Life Interrupted: The Effects of Technology-Mediated Work Interruptions on Work and Nonwork Outcomes. MIS Quarterly 42: 1023–42. [Google Scholar]
  13. Cohen, Jacob. 1988. Statistical Power Analysis for the Behavioural Sciences, 2nd ed. New York, NY: Routledge. [Google Scholar]
  14. Cohen, Sheldon, and Denise Janicki-Deverts. 2012. Who’s Stressed? Distributions of Psychological Stress in the United States in Probability Samples from 1983, 2006, and 2009. Journal of Applied Social Psychology 42: 1320–34. [Google Scholar] [CrossRef]
  15. Cohen, Sheldon, and Gail M. Williamson. 1988. Perceived Stress in a Probability Sample of the United States. In The Social Psychology of Health. Edited by Shirlynn Spacapan and Stuart Oskamp. Newbury Park: Sage, pp. 31–67. [Google Scholar]
  16. Cohen, Sheldon, Tom Kamarck, and Robin Mermelstein. 1983. A Global Measure of Perceived Stress. Journal of Health and Social Behavior 24: 385–96. [Google Scholar] [CrossRef]
  17. Cummins, J.David, and Neil A. Doherty. 2006. The Economics of Insurance Intermediaries. Journal of Risk and Insurance 73: 359–96. [Google Scholar] [CrossRef]
  18. Dalla Pozza, Ilaria, Sandrine Heitz-Spahn, and Lionel Texier. 2017. Generation Y multichannel behaviour for complex services: The need for human contact embodied through a distance relationship. Journal of Strategic Marketing 25: 226–39. [Google Scholar] [CrossRef]
  19. D’Arcy, John, Tejaswini Herath, and Mindy K. Shoss. 2014. Understanding Employee Responses to Stressful Information Security Requirements: A Coping Perspective. Journal of Management Information Systems 31: 285–318. [Google Scholar] [CrossRef]
  20. Dominique-Ferreira, Sergio. 2018. The key role played by intermediaries in the retail insurance distribution. International Journal of Retail and Distribution Management 46: 1170–92. [Google Scholar] [CrossRef]
  21. Doney, Patricia M., and Joseph P. Cannon. 1997. An examination of the nature of trust in buyer-seller relationships. Journal of Marketing 61: 327–40. [Google Scholar]
  22. Dragano, Nico, and Thorsten Lunau. 2020. Technostress at work and mental health: Concepts and research results. Current Opinion in Psychiatry 33: 407–13. [Google Scholar] [CrossRef]
  23. Dumm, Randy E., and Robert E. Hoyt. 2003. Insurance distribution channels: Markets in transition. Journal of Insurance Regulation 22: 27–47. [Google Scholar]
  24. Eastman, Jaqueline K., Alan D. Eastman, and Kevin L. Eastman. 2002. Insurance Sales Agents and the Internet: The Relationship Between Opinion Leadership, Subjective Knowledge, and Internet Attitudes. Journal of Marketing Management 18: 259–85. [Google Scholar] [CrossRef]
  25. Eckert, Christian, Christoph Neunsinger, and Katrin Osterrieder. 2022. Managing customer satisfaction: Digital applications for insurance companies. The Geneva Papers on Risk and Insurance: Issues and Practice 47: 569–602. [Google Scholar] [CrossRef]
  26. Eckert, Christian, Johanna Eckert, and Armin Zitzmann. 2021. The status quo of digital transformation in insurance sales: An empirical analysis of the german insurance industry. Zeitschrift für die gesamte Versicherungswissenschaft 110: 133–55. [Google Scholar] [CrossRef]
  27. Eckardt, Martina. 2007. Insurance Intermediation: An Economic Analysis of the Information Services Market. Heidelberg: Physica-Verlag. [Google Scholar]
  28. Eckardt, Martina, and Solvia Räthke-Döppner. 2010. The Quality of Insurance Intermediary Services—Empirical Evidence for Germany. Journal of Risk and Insurance 77: 667–701. [Google Scholar] [CrossRef]
  29. Eling, Martin, and Martin Lehmann. 2018. The Impact of Digitalization on the Insurance Value Chain and the Insurability of Risks. The Geneva Papers on Risk and Insurance: Issues and Practice 43: 359–96. [Google Scholar] [CrossRef]
  30. Fischer, Thomas, and René Riedl. 2017. Technostress Research: A Nurturing Ground for Measurement Pluralism? Communications of the Association for Information Systems 40: 75–401. [Google Scholar] [CrossRef]
  31. Fischer, Thomas, Martin Reuter, and René Riedl. 2021. The Digital Stressors Scale: Development and Validation of a New Survey Instrument to Measure Digital Stress Perceptions in the Workplace Context. Frontiers in Psychology 12: 607598. [Google Scholar] [CrossRef]
  32. Flückiger, Isabelle, and Meryem Duygun. 2022. New technologies and data in insurance. The Geneva Papers on Risk and Insurance: Issues and Practice 47: 495–98. [Google Scholar] [CrossRef]
  33. Forman, Chris, and Anne Gron. 2009. Vertical Integration and Information Technology Investment in the Insurance Industry. Journal of Law, Economics, & Organization 27: 180–218. [Google Scholar]
  34. Fritzsch, Simon, Philipp Scharber, and Gregor Weiß. 2021. Estimating the relation between digitalization and the market value of insurers. Journal of Risk and Insurance 88: 529–67. [Google Scholar] [CrossRef]
  35. Fritzsche, Albert, and Alexander Bohnert. 2022. Implications of bundled offerings for business development and competitive strategy in digital insurance. The Geneva Papers on Risk and Insurance: Issues and Practice 47: 817–34. [Google Scholar] [CrossRef]
  36. Galluch, Pamela S., Varun Grover, and Jason B. Thatcher. 2015. Interrupting the Workplace: Examining Stressors in an Information Technology Context. Journal of the Association for Information Systems 16: 1–47. [Google Scholar] [CrossRef]
  37. Garven, James R. 2002. On the implication of the internet for insurance markets and institutions. Risk Management and Insurance Review 5: 105–16. [Google Scholar] [CrossRef]
  38. GDV (Gesamtverband der Deutschen Versicherungswirtschaft). 2022. Branche in Zahlen, Statistiken zur deutschen Versicherungswirtschaft. Available online: https://www.gdv.de/gdv/statistiken-zur-deutschen-versicherungswirtschaft-2022-statistisches-taschenbuch--97258 (accessed on 12 October 2022).
  39. Gefen, David, Edward E. Rigdon, and Detmar Straub. 2011. An update and extension to SEM guidelines for administrative and social science research. MIS Quarterly 35: iii-A7. [Google Scholar] [CrossRef]
  40. Gimpel, Henner, Julia Lanzl, Christian Regal, Nils Urbach, Julia Becker, Torsten M. Kühlmann, Mathias Certa, and Patricia Tegtmeier. 2021. Extending the Concept of Technostress: The Hierarchical Structure of Digital Stress. In The Digital Workplace: Antecedents and Consequences of Technostress. Edited by Julia Becker. Bayreuth: University of Bayreuth, pp. 157–243. [Google Scholar]
  41. Gimpel, Henner, Julia Lanzl, Tobias Manner-Romberg, and Niclas Nüske. 2018. Digital Stress in Germany. A Survey of Employed People on Stress and Strain Caused by Working with Digital Technologies. Working Paper 101. Düsseldorf: Hans-Böckler-Stiftung. [Google Scholar]
  42. Greineder, Michael, Tobias Riasanow, Markus Bohm, and Helmut Krcmar. 2020. Generic Insurtech Ecosystem and Its Strategic Implications for the Digital Transformation of the Insurance Industry. Munich: Technical University of Munich. [Google Scholar]
  43. Hair, Joseph F., G.Thomas.M. Hult, Christian M. Ringle, Marko Sarstedt, Nichola P. Danks, and Soumya Ray. 2021. Partial Least Squares Structural Equation Modeling (PLS-SEM) Using R. A Workbook. Cham: Springer Nature Switzerland AG. [Google Scholar]
  44. Hair, Joseph F., Jeffrey J. Risher, Marko Sarstedt, and Christian M. Ringle. 2019. When to use and how to report the results of PLS-SEM. European Business Review 31: 2–24. [Google Scholar] [CrossRef]
  45. Hall, Jeffrey A., Ric G. Steele, Jennifer L. Christofferson, and Teodora Mihailova. 2021. Development and initial evaluation of a multidimensional digital stress scale. Psychological Assessment 33: 230–42. [Google Scholar] [CrossRef]
  46. Hampton, Keith N., Weixu Lu, and Inyoung Shin. 2016. Digital Media and Stress: The Cost of Caring 2.0. In Information, Communication & Society. Document Version: Accepted Manuscript (AM). New Brunswick: Rutgers University. [Google Scholar] [CrossRef]
  47. Heinzel, Vanessa. 2021. Coping with Sales Pressure—Eine literaturbasierte Analyse von Strategien zur Stressbewältigung im Vertrieb. Junior Management Science 6: 279–98. [Google Scholar]
  48. Hilliard, James I., Laureen Regan, and Sharon Tennyson. 2013. Insurance distribution. In The Handbook of Insurance, 2nd ed. Edited by Georges Dionne. New York: Springer, pp. 689–727. [Google Scholar]
  49. Höckmayr, Gergana K. 2012. Wandel der Beratungsqualität auf dem Versicherungsvermittlermarkt: Eine ökonomische Analyse der Veränderungen aufgrund der Anforderungen der EU-Vermittlerrichtlinie. Zeitschrift für die gesamte Versicherungswissenschaft 101: 75–102. [Google Scholar] [CrossRef]
  50. Insurance Europe. 2022. European Insurance in Figures, 2020 Data. Available online: https://insuranceeurope.eu/publications/2569/european-insurance-in-figures-2020-data (accessed on 18 August 2023).
  51. Jap, Sandy D. 2000. The strategic role of the salesforce in developing customer satisfaction across the relationship cycle. Journal of Personal Selling & Sales Management 11: 95–108. [Google Scholar]
  52. Kasten, Nadine, and Reinhard Fuchs. 2018. Methodische Aspekte der Stressforschung. In Handbuch Stressregulation und Sport. Edited by Rainhard Fuchs and Markus Gerber. Berlin: Springer, pp. 179–201. [Google Scholar]
  53. Klein, Eva M., Elmar Brähler, Michael Dreier, Leonard Reinecke, Kai W. Müller, Gabriele Schmutzer, Klaus Wölfling, and Manfred E. Beutel. 2016. The German version of the Perceived Stress Scale—Psychometric characteristics in a representative German community sample. BMC Psychiatry 16: 1–10. [Google Scholar] [CrossRef]
  54. Kock, Ned. 2015. Common method bias in PLS-SEM: A full collinearity assessment approach. International Journal of e-Collaboration 11: 1–10. [Google Scholar] [CrossRef]
  55. Köhne, Thomas. 2024. Versicherungsmarketing, Marketing und Vertrieb im Versicherungsunternehmen in Theorie und Praxis, 2nd ed. Wiesbaden: Springer Fachmedien Wiesbaden GmbH. [Google Scholar]
  56. Köhne, Thomas, and Christoph Brömmelmeyer. 2018. The New Insurance Distribution Regulation in the EU—A Critical Assessment from a Legal and Economic Perspective. The Geneva Papers on Risk and Insurance: Issues and Practice 43: 704–39. [Google Scholar] [CrossRef]
  57. Lanfranchi, Davide, and Laura Grassi. 2022. Examining insurance companies’ use of technology for innovation. The Geneva Papers on Risk and Insurance: Issues and Practice 47: 520–37. [Google Scholar] [CrossRef] [PubMed]
  58. Lanzl, Julia. 2023. Social Support as Technostress Inhibitor. Even More Important During the COVID-19 Pandemic? Business & Information Systems Engineering 65: 329–43. [Google Scholar]
  59. Maier, Christian, Sven Laumer, and Andreas Eckhardt. 2015. Information technology as daily stressor: Pinning down the causes of burnout. Journal of Business Economics 85: 349–87. [Google Scholar] [CrossRef]
  60. Maier, Christian, Sven Laumer, Andreas Eckhardt, and Tim Weitzel. 2014. Explaining technical and social stressors in techno-social systems: Theoretical foundation and empirical evidence. In Technostress: Theoretical Foundation and Empirical Evidence. Edited by Christian Maier. Bamberg: University of Bamberg, pp. 95–131. [Google Scholar]
  61. Marano, Pierpaolo. 2021. Management of Distribution Risks and Digital Transformation of Insurance Distribution—A Regulatory Gap in the IDD. Risks 9: 143. [Google Scholar] [CrossRef]
  62. Marano, Pierpaolo, and Shu Li. 2023. Regulating Robo-Advisors in Insurance Distribution: Lessons from the Insurance Distribution Directive and the AI Act. Risks 11: 12. [Google Scholar] [CrossRef]
  63. Marsh, Elizabeth, Elvira P. Vallejos, and Alexa Spence. 2022. The digital workplace and its dark side: An integrative review. Computers in Human Behavior 128: 1–21. [Google Scholar] [CrossRef]
  64. Meunier, Sophie, Laurance Bouchard, Simon Coulombe, Marina M. Doucerain, Tyler Pacheco, and E. Auger. 2022. The Association between Perceived Stress, Psychological Distress, and Job Performance During the COVID-19 Pandemic: The Buffering Role of Health-Promoting Management Practices. Trends in Psychology 30: 549–69. [Google Scholar] [CrossRef]
  65. Müller, Florian, Henrik Naujoks, Harshveer Singh, Gunther Schwarz, Andrew Schwedel, and Kirsty Thomson. 2015. Global Digital Insurance Benchmarking Report 2015. Pathways to Success in a Digital World. Available online: www.bain.com/images/GLOBAL-DIGITAlINSURANCE-2015.pdf (accessed on 19 September 2016).
  66. Nastjuk, Ilja, Simon Trang, Julius-Viktor Grummeck-Braamt, Marc T. P. Adam, and Monideepa Tarafdar. 2023. Integrating and Synthesising Technostress Research: A Meta-Analysis on Technostress Creators, Outcomes, and IS Usage Contexts. European Journal of Information Systems 33: 361–82. [Google Scholar] [CrossRef]
  67. Nicoletti, Bernardo. 2021. Insurance 4.0: Benefits and Challenges of Digital Transformation. Cham: Springer Nature Switzerland AG. [Google Scholar]
  68. Owens, Emer, Barry Sheehan, Martin Mullins, Martin Cunneen, Juliane Ressel, and German Castignani. 2022. Explainable Artificial Intelligence (XAI) in Insurance. Risks 10: 230. [Google Scholar] [CrossRef]
  69. Parasuraman, A. Parsu, and Charles L. Colby. 2015. An Updated and Streamlined Technology Readiness Index: TRI 2.0. Journal of Service Research 18: 59–74. [Google Scholar] [CrossRef]
  70. Petter, Stacey, Detmar Straub, and Arun Rai. 2007. Specifying Formative Constructs in Information Systems Research. MIS Quarterly 31: 623–56. [Google Scholar] [CrossRef]
  71. Podsakoff, Philip M., Scott B. MacKenzie, Jeong-Yeon Lee, and Nathan P. Podsakoff. 2003. Common Method Biases in Behavioral Research: A Critical Review of the Literature and Recommended Remedies. Journal of Applied Psychology 88: 879–903. [Google Scholar] [CrossRef] [PubMed]
  72. Puranik, Harshad, Joel Koopman, and Heather C. Vough. 2020. Pardon the Interruption: An Integrative Review and Future Research Agenda for Research on Work Interruptions. Journal of Management 46: 806–42. [Google Scholar] [CrossRef]
  73. Ragu-Nathan, T.S., Monideepa Tarafdar, Bhanu S. Ragu-Nathan, and Qiang Tu. 2008. The Consequences of Technostress for End Users in Organizations: Conceptual Development and Empirical Validation. Information Systems Research 19: 417–33. [Google Scholar] [CrossRef]
  74. Ravid, Daniel M., David L. Tomczak, Jerod C. White, and Tara S. Behrend. 2020. EPM 20/20: A Review, Framework, and Research Agenda for Electronic Performance Monitoring. Journal of Management 46: 100–26. [Google Scholar] [CrossRef]
  75. Rayburn, Steven W., Vishag Badrinarayanan, Sidney T. Anderson, and Aditya Gupta. 2021. Continuous techno-training and business-to-business salesperson success: How boosting techno-efficacy enhances sales effort and performance. Journal of Business Research 133: 66–78. [Google Scholar] [CrossRef]
  76. Reiff, Julia A.M., Erika Spieß, and Katharina F. Pfaffinger. 2021. Dealing With Stress in a Modern Work Environment. Resources Matter. Cham: Springer. [Google Scholar]
  77. Riedl, René, Harald Kindermann, Andreas Auinger, and Andrija Javor. 2012. Technostress from a Neurobiological Perspective, System Breakdown Increases the Stress Hormone Cortisol in Computer Users. Business & Information Systems Engineering 4: 61–69. [Google Scholar]
  78. Salo, Markus, Henri Pirkkalainen, Cecil Eng Huang Chua, and Tina Koskelainen. 2022. Formation and Mitigation of Technostress in the Personal Use of IT. MIS Quarterly 46: 1073–107. [Google Scholar] [CrossRef]
  79. Sarstedt, Marko, Christian M. Ringle, and Joseph F. Hair. 2022. Partial Least Squares Structural Equation Modeling. In Handbook of Market Research. Edited by Christian Homburg, Martin Klarmann and Arnd Vomberg. Cham: Springer, pp. 587–632. [Google Scholar]
  80. Sarstedt, Marko, Jun-Hwa Cheah, Joseph F. Hair, Jan-Michael Becker, and Christian M. Ringle. 2019. How to specify, estimate, and validate higher-order constructs in PLS-SEM. Australasian Marketing Journal 27: 197–211. [Google Scholar] [CrossRef]
  81. Semmer, Norbert K., and Dieter Zapf. 2018. Theorien der Stressentstehung und -bewältigung. In Handbuch Stressregulation und Sport. Edited by Rainhard Fuchs and Markus Gerber. Berlin: Springer, pp. 23–50. [Google Scholar]
  82. Schwarzbach, Christoph, Theresa Eden, Oliver Werth, Ute Lohse, Michael H. Breitner, and Johan-Matthias von der Schulenburg. 2023. Digital Transformation in Back-Offices of German Insurance Companies. International Journal of Innovation & Technology Management 20: 1–27. [Google Scholar]
  83. Shu, Qin, Qiang Tu, and Kanliang Wang. 2011. The Impact of Computer Self-Efficacy and Technology Dependence on Computer-Related Technostress: A Social Cognitive Theory Perspective. International Journal of Human-Computer Interaction 27: 923–39. [Google Scholar] [CrossRef]
  84. Sosa Gómez, Iván, and Oscar Montes Pineda. 2023. What is an InsurTech? A scientific approach for defining the term. Risk Management and Insurance Review 26: 125–73. [Google Scholar] [CrossRef]
  85. Sosa, Iván, and Oscar Montes. 2022. Understanding the InsurTech dynamics in the transformation of the insurance sector. Risk Management and Insurance Review 25: 35–68. [Google Scholar] [CrossRef]
  86. State of New Hampshire (Employee Assistance Program). 2022. Perceived Stress Scale Score. Available online: https://www.das.nh.gov/wellness/docs/percieved%20stress%20scale.pdf (accessed on 24 February 2022).
  87. Stöckli, Emanuel, Christian Dremel, and Falk Übernickel. 2018. Exploring characteristics and transformational capabilities of InsurTech innovations to understand insurance value creation in a digital world. Electronic Markets 28: 287–305. [Google Scholar] [CrossRef]
  88. Sundaram, Suresh, Andrew Schwarz, Eli Jones, and Wynme W. Chin. 2007. Technology use on the front line: How information technology enhances individual performance. Journal of the Academy of Marketing Science 35: 101–12. [Google Scholar] [CrossRef]
  89. Tams, Stefan, Jason B. Thatcher, and Varun Grover. 2018. Concentration, Competence, Confidence, and Capture: An Experimental Study of Age, Interruption-based Technostress, and Task Performance. Journal of the Association for Information Systems 19: 857–908. [Google Scholar] [CrossRef]
  90. Tarafdar, Monideepa, Cary L. Cooper, and Jean-François Stich. 2017. The technostress trifecta—techno eustress, techno distress and design: Theoretical directions and an agenda for research. Information Systems Journal 29: 6–42. [Google Scholar] [CrossRef]
  91. Tarafdar, Monideepa, Ellen Bolman Pullins, and T.S. Ragu-Nathan. 2014. Examining impacts of technostress on the professional salesperson’s behavioural performance. Journal of Personal Selling & Sales Management 34: 51–69. [Google Scholar]
  92. Tarafdar, Monideepa, Ellen Bolman Pullins, and T. S. Ragu-Nathan. 2015. Technostress: Ngative effect on performance and possible mitigations. Information Systems Journal 25: 103–32. [Google Scholar] [CrossRef]
  93. Tarafdar, Monideepa, Qiang Tu, and T.S. Ragu-Nathan. 2010. Impact of Technostress on End-User Satisfaction and Performance. Journal of Management Information Systems 27: 303–34. [Google Scholar] [CrossRef]
  94. Tarafdar, Monideepa, Qiang Tu, Bhanu S. Ragu-Nathan, and T.S. Ragu-Nathan. 2007. The Impact of Technostress on Role Stress and Productivity. Journal of Management Information Systems 24: 301–28. [Google Scholar] [CrossRef]
  95. Taylor, John M. 2015. Psychometric Analysis of the Ten-Item Perceived Stress Scale. Psychological Assessment 27: 90–101. [Google Scholar] [CrossRef] [PubMed]
  96. Venkatesh, Viswanath, Michael G. Morris, Gordon B. Davis, and Fred D. Davis. 2003. User Acceptance of Information Technology: Toward a Unified View. MIS Quarterly 27: 425–78. [Google Scholar] [CrossRef]
  97. Vieira, Valter A. 2022. The mediating role of happiness on the effect of locomotion and effort on salesperson’s performance and cross-selling: The case of financial insurance. Journal of Financial Services Marketing 27: 346–59. [Google Scholar] [CrossRef]
  98. Wu, Migao, Pavel Andreev, and Morad Benyoucef. 2024. The state of lead scoring models and their impact on sales performance. Information Technology and Management 25: 69–98. [Google Scholar] [CrossRef] [PubMed]
  99. Yu, Tsu-Wey, and Lu-Ming Tseng. 2016. The role of salespeople in developing life insurance customer loyalty. International Journal of Retail & Distribution Management 44: 22–37. [Google Scholar]
  100. Zeier Röschmann, Angela. 2018. Digital insurance brokers—Old wine in new bottles? How digital brokers create value. Zeitschrift für die gesamte Versicherungswissenschaft 107: 273–91. [Google Scholar] [CrossRef]
Figure 1. The research model.
Risks 12 00129 g001
Figure 2. The data sample.
Risks 12 00129 g002
Figure 3. The use of digital technologies by insurance intermediaries; N = 671.
Risks 12 00129 g003
Figure 4. The PSS scores of insurance intermediaries, N = 671.
Risks 12 00129 g004
Figure 5. The structural model results.
Risks 12 00129 g005
Table 1. The item loadings, internal consistency reliability, convergent validity, and discriminant validity in the measurement model of the reflective specified higher-order constructs.
Construct and Item Loadings
Digital Stressors (DigStressors)Perceived Stress (PercStress)
Complexity (Comp): 0.712
Insecurity (Insec): 0.766
Interruption (Interr): 0.738
Invasion of Privacy (InvPriv): 0.701
Omnipresence (Omni): 0.646
Overload (Overl): 0.806
Performance Control (PerfCont): 0.611
Safety (Safet): 0.643
Unreliability (Unrel): 0.741
Perceived Helplessness (PerHeLess): 0.924
Perceived Self-Inefficacy (PerSeIfIneff): 0.792
Realibility and validity
ConstructαCRAVE1234567
1Digital Stressors (DigStressors)0.8760.9010.5040.710
2Organizational Encouragement (OrgEncour)0.8150.8790.646−0.2360.804
3Organizational Support (OrgSup)0.8720.9070.661−0.3000.7120.813
4Perceived Stress
(PercStress) *
0.6650.8500.7400.646−0.164−0.2090.860
5Technological Capabilities (TechCap)0.8680.9100.716−0.2970.2910.279−0.1650.846
6Technology Optimism (TechOpt)0.8160.8800.648−0.3740.3370.365−0.2910.4910.805
7TechUsage (single item) −0.1350.2980.269−0.0740.5310.3741.000
Note: * Composite reliability (rho_a) is: 0.764; square root of AVE is on the diagonal (bold highlighted).
Table 2. The VIF, weights, and significance of the weights of the formative higher-order construct.
Construct/ItemsVIFWeightp-ValueBias-Corrected and Accelerated Confidence Interval
2.5%97.5%
Performance (Perform)
Revenue (Rev)1.6810.3710.0000.1820.568
Productivity (Prod)2.8330.3200.0110.0510.551
Interaction with Clients (InteracCl)3.0380.4410.0010.1930.690
Table 3. The path analysis results.
HypothesesPath CoefficientsResult
H1TechUsage → Perform0.273 ***Supported
H2TechUsage → DigStressors0.103 *Supported
H3DigStressors → PercStress0.646 ***Supported
H4PercStress → Perform−0.350 ***Supported
H5aTechOpt → TechUsage0.113 **Supported
H5bTechOpt → DigStressors−0.261 ***Supported
H6aTechCap → TechUsage0.435 ***Supported
H6bTechCap → DigStressors−0.173 ***Supported
H7aOrgEncour → TechUsage0.117 *Supported
H7bOrgEncour → DigStressors0.006Not supported
H8aOrgSup → TechUsage0.023Not supported
H8bOrgSup → DigStressors−0.189 ***Supported
Note: Path coefficients are standardized; * p < 0.05, ** p < 0.01, *** p < 0.001.
Disclaimer/Publisher’s Note: The statements, opinions and data contained in all publications are solely those of the individual author(s) and contributor(s) and not of MDPI and/or the editor(s). MDPI and/or the editor(s) disclaim responsibility for any injury to people or property resulting from any ideas, methods, instructions or products referred to in the content.

