Abstract
Distributed ledger technology (DLT) and cryptocurrency have revolutionized the financial landscape and relevant applications, particularly in investment opportunities. Despite its growth, the market’s volatility and technical complexities hinder widespread adoption. This study proposes a cryptocurrency trading system powered by advanced machine learning (ML) models to address these challenges. By leveraging random forest (RF), long short-term memory (LSTM), and bi-directional LSTM (Bi-LSTM) models, the cryptocurrency trading system is equipped with strong predictive capacity and is able to optimize trading strategies for Bitcoin. The up-to-date price prediction information obtained by the machine learning model is incorporated by custom oracle contracts and is transmitted to portfolio smart contracts. The integration of smart contracts and on-chain oracles ensures transparency and security, allowing real-time verification of portfolio management. The deployed cryptocurrency trading system performs these actions automatically without human intervention, which greatly reduces barriers to entry for ordinary users and investors. The results demonstrate the feasibility of creating a cryptocurrency trading system, with the LSTM model achieving a return on investment (ROI) of 488.74% for portfolio management during the duration of 9 December 2022 to 23 May 2024. The ROI obtained by the LSTM model is higher than the performance of Bitcoin at 234.68% and that of other benchmarking models with RF and Bi-LSTM over the same timeframe. This approach offers significant cost savings, transparent portfolio management, and a trust-free platform for investors, paving the way for broader cryptocurrency adoption. Future work will focus on enhancing prediction accuracy and achieving greater decentralization.
1. Introduction
Currency or money plays three important roles in society, including as a store of value, medium of exchange, and unit of account (De Mariz 2022). Innovation in money and payment efficiency are active research topics, which involve central bank digital currencies (CBDC), cryptocurrencies, and stablecoins. Cryptocurrency has emerged as a transformative force in the financial world, offering an alternative investment opportunity to both retail and institutional investors globally. Since the inception of Bitcoin in 2008 (Nakamoto 2008), the cryptocurrency market has experienced exponential growth, evolving from a niche concept to a significant financial asset class. The revolutionary idea of Bitcoin as a decentralized digital currency, free from government control and central bank policies, has sparked the development of thousands of alternative cryptocurrencies.
As of December 2024, there are about 10,000 cryptocurrencies in existence (Statista.com 2024a), including notable ones like Bitcoin, Ethereum (ETH), Binance Coin, USD Coin (USDC), Solana, and Tether, with a total market capitalization of about USD 3.68 trillion (Statista.com 2024b). In contrast, as of October 2024, the total market capitalizations of NYSE, Nasdaq, and HKSE are USD 29.71 trillion, USD 28.19 trillion, and USD 4.53 trillion, respectively (The WFE Statistics Team 2024). These cryptocurrencies have attracted substantial interest due to their high returns and potential for significant price appreciation. Bitcoin, for instance, has seen its value skyrocket from a few cents to tens of thousands of dollars within a decade, making early adopters extraordinarily wealthy.
The cryptocurrency market is characterized by extreme volatility. Price swings of 10% or more within a single day are not uncommon. As such, there are ongoing arguments over cryptocurrency‘s ability to fulfil the three roles of money. Cryptocurrency may fail to be suited to the roles that refer to a store of value and unit of account, besides the limited public acceptance of it as a medium of exchange or payment (De Mariz 2022). Cryptocurrencies are not considered as a complete replacement for CBDC, although in certain countries with high inflation, CBDC also exhibits extreme volatility. Despite the high volatility of cryptocurrency, the promise of high returns has lured an increasing number of investors, who now consider cryptocurrencies as an investable asset class alongside traditional assets like stocks, bonds, and real estate (Zhao and Zhang 2021). The growth of decentralized finance (DeFi) and non-fungible tokens (NFTs) further underscores the expanding use cases and applications of blockchain technology.
1.1. Problem Formulation
Despite its rapid growth and increasing acceptance, the cryptocurrency landscape presents significant obstacles to widespread adoption and education. One of the primary barriers is the lack of accessible and reliable information (Smutny et al. 2021). Many potential investors are deterred by the technical complexities associated with cryptocurrencies, such as understanding blockchain technology, navigating various exchanges, and securing digital wallets. Some cryptocurrencies are criticized for consuming large amounts of energy. The interests of cryptocurrency investors have gradually become more concerned with environmental sustainability, exhibiting a preference for green or clean cryptocurrencies (Wątorek et al. 2023). It is not easy for ordinary investors to understand the intrinsic differences among cryptocurrencies and their technical complexity. For example, various consensus mechanisms are used by different cryptocurrencies including proof of work (PoW), proof of stake (PoS), and hybrid consensus strategies (Chen et al. 2023), which may result in different degrees of energy efficiency while maintaining reliability. Additionally, resources and educational materials are often scattered and inconsistent, making it difficult for newcomers to gain a comprehensive understanding of the market.
Price volatility further exacerbates these challenges, creating an environment of uncertainty and risk. The correlations between the cryptocurrency market and traditional financial markets show that cryptocurrencies have become a connected part of global financial markets (Wątorek et al. 2023). The level of financial market volatility could be impacted by various factors, including companies’ fundamental performances, political uncertainty (Vancea et al. 2017), financial crises, global pandemic (Tabash et al. 2024; Dumiter et al. 2023), energy and sustainability (Haq et al. 2023), etc. Stock market volatility and the impact on investment returns in certain developed and emerging markets were studied using univariate GARCH models during two financial crises in 2008 and 2019 (Tabash et al. 2024). The connections among financial market volatility, energy, and sustainable cryptocurrencies have been discussed; institutional investors can choose energy-efficient and sustainable cryptocurrency to diversify their portfolio management with traditional financial assets (Haq et al. 2023). Human factors play a part in the risks of trading and portfolio management. Although investment is inherently coupled with the balance of returns and risk levels, high volatility levels may significantly impact the volatility persistence of investors (Tabash et al. 2024). Some types of risk-seeking investors are willing to accept high risks and volatility if there is a higher possibility of returns, while for others, the fear of sudden and significant losses outweighs the allure of high returns. This volatility, coupled with the technical barriers, poses a significant hurdle for the broader adoption of and investment in cryptocurrencies.
Moreover, centralized entities that facilitate cryptocurrency trading and storage often lack transparency in managing user funds (Rehman et al. 2020). High-profile cases of mismanagement, such as the collapse of FTX (Conlon et al. 2022), where user funds were mishandled for profit-making purposes, highlight the risks associated with centralized exchanges. Current solutions to ensure transparency, such as proof of reserves (Pines and Zell 2023), are inadequate as they only provide a snapshot of reserves at a specific point in time without clarifying the sources or stability of those reserves.
The urgent need for a decentralized and transparent approach to managing user funds is clear. Investors need assurance that their assets are secure and managed transparently, free from the risks posed by centralized entities. Some prior works have been reported in the literature. The investment slopes of Bitcoin from January 2014 to April 2023 have been studied, using the principal component analysis (PCA) method for analyzing BTC investment, including key factor identification, investment performance, risk assessment, etc. (Aivaz et al. 2023). The volatility spillover dynamics of four cryptocurrencies including Bitcoin, ETH, Ripple, and Litecoin, have been investigated using a multivariate GARCH model and a wavelet method (Kumar and Anandarao 2019). The analysis conducted in (Kayani and Hasan 2024) discusses how the finance industry has been impacted and revolutionized by cryptocurrencies, particularly Bitcoin and Ethereum, which affect volatility, diversified investing options, and the clarity of regulations. A simulated cryptocurrency trading system with a deep LSTM has been utilized to forecast the Bitcoin price (Parvini et al. 2022). A Bitcoin trading method incorporating reinforcement learning algorithm has been presented based on Bitcoin historical prices and Twitter sentiment analysis (Otabek and Choi 2024).
1.2. Objectives
To address these challenges, we propose the development of a decentralized cryptocurrency trading system powered by advanced machine learning (ML) models. The objectives of this study are multifaceted, aiming to enhance transparency, reduce risks, and leverage data-driven insights to optimize trading strategies. The application will utilize ML techniques to analyze vast amounts of data, including historical asset prices, on-chain metrics, and user sentiment from various sources such as Google Trend. This comprehensive analysis will help predict future price movements, identify emerging trends, and make informed buying and selling decisions.
To ensure transparency and security, the predicted prices and trading decisions generated by the ML models will be brought on chain through the development of on-chain oracles. These oracles will enable the integration of off-chain data into smart contracts, ensuring that all trading activities and portfolio management are transparent and verifiable on a public blockchain. User funds will be managed through smart contracts deployed on a public blockchain. This approach eliminates the need for intermediaries and ensures that all transactions and portfolio management activities are conducted transparently and autonomously, leaving no room for mismanagement or fraud. Users will have the ability to verify portfolio management in real time, fostering trust and confidence in the system.
1.3. Organization
The rest of the paper is organized into several sections. Section 2 examines existing approaches and identifies gaps in current research. Section 3 describes the methods and models used to develop the decentralized cryptocurrency trading system. Section 4 presents the outcomes and analysis of the developed models and components. Finally, Section 5 summarizes the findings and suggests future research directions.
2. Related Work
2.1. Cryptocurrency Price Prediction
Some machine learning models have been reported in past studies to predict cryptocurrency prices. Random forest (RF), an ensemble model, was able to provide correct next-day binary trading signals more than 50% of the time and generated around 10% annual returns by trading Bitcoin in falling market conditions, based on the historical daily price data from 7 August 2015 to 3 March 2019 (Sebastião and Godinho 2021). In this work, there is still room for improvement in the forecasting performance, as the models were not optimized to minimize the forecasting error but to maximize the average of the one-step-ahead returns. Chen (2023) employed machine learning algorithms trained using historical Bitcoin daily price data from 31 March 2015 to 1 April 2022 and 47 variables for next-day Bitcoin price prediction. In this work, RF showed comparable results when compared to other advanced models such as long short-term memory (LSTM) on evaluation metrics like root mean square error (RMSE) and mean absolute percentage error (MAPE). The RF model achieved RMSE and MAPE scores of 2094.24 and 3.29%, respectively. A cryptocurrency trading system has been introduced with a multi-layer perceptron (MLP) as a classifier and a pipeline to forecast short-term prices (Parente et al. 2024). The price data of several cryptocurrencies including Bitcoin, ETH, and minor coins was collected in the timeframe from 17 August 2017 to 4 December 2022. The model achieved 66% accuracy and generated significantly higher profits compared to linear models over both long- and short-term trading periods. But the price predication accuracy may have been impacted significantly by the low liquidity of some minor coins (Parente et al. 2024).
Another study using LTSM, trained with 1829 Bitcoin historical price data points from 27 June 2014 to 27 June 2019, was used to predict Bitcoin prices and achieved an RMSE score of 288 at 500 epochs through an epoch search (Ferdiansyah et al. 2019). However, the disadvantage of this work was the poor accuracy at a lower number of epochs. Bi-directional LSTM (Bi-LSTM) overcomes the limitations of LSTM that allow input sequence processes in the reverse direction (Seabe et al. 2023). Three machine learning algorithms, including Bi-LSTM, LSTM, and Gated recurrent unit (GRU), were employed to perform price predictions for Bitcoin, ETH, and Litecoin. The training and testing datasets were from 1 January 2018 to 31 December 2021 and from 1 January 2022 to 1 January 2023, respectively. Two performance evaluation metrics were used: RMSE and MAPE. The Bi-LSTM model showed better performance, with a lower error score of around 19%, in comparison to LSTM and GRU. But a certain risk of low prediction accuracy and maintenance costs are associated in this work (Seabe et al. 2023).
Hybrid models are being researched for cryptocurrency price prediction. One study investigated a hybrid deep neural network, CNN-BiLSTM, to predict Bitcoin prices (Tripathi and Sharma 2022). The model, trained using 3142 historical daily price data points from 1 April 2013 to 6 November 2021, achieved an MAPE of 0.28% for a next-day Bitcoin price forecast and 2.25% for seven-day price forecasts. In another study, a one-dimensional CNN and stacked GRU (1DCNN-GRU) model was trained for predicting Bitcoin prices using 10,797 historical Bitcoin price data points over a duration of one week with one-minute intervals, which gave an RMSE score of 43.933 on the Bitcoin dataset (Kang et al. 2022). But one potential limitation of the work was that only one week of price data samples was used. Another hybrid model was trained with historical daily Bitcoin prices from February 2014 to September 2021 and used for predicting Bitcoin prices, with a MAE score of 1707.42, while deep cross networks (DCN), a non-hybrid model, had a MAE score of 2902.90 (Nagula and Alexakis 2022). The hybrid model achieved a return on investment (ROI) of 11% over 36 months of Bitcoin futures trading, which was 260% and 82% higher than the buy-and-hold and DCN models, respectively.
2.2. Blockchain, Smart Contract, and Oracles
This sub-section will explore blockchain platforms that provide smart contract capabilities and the advantages they offer. The focus will be on permissionless (public) blockchains, which allow anyone to interact with the application (Mohan 2019). Concepts of blockchain oracles that enable smart contracts to access off-chain data will be reviewed as well.
A blockchain is a distributed ledger that involves the replication and storage of transactions across multiple nodes. Transactions are organized into blocks, which serve as immutable records (Di Pierro 2017). These transactions store various types of information such as monetary value, parameters, and function calls. The implementation of blockchain technology eliminates the need for intermediaries and ensures transparent handling of user funds, minimizing the risk of mishandling (Ammous 2016).
In recent years, many permissionless blockchains have emerged, aiming to challenge ETH, which has been the dominant programmable blockchain (Irresberger et al. 2020). As of 28 May 2024, according to DefiLlama, the total value locked on ETH, excluding its side chains and layer 2 solutions, stands at approximately USD 66.06 billion, which accounted for roughly 61% of the overall value locked on public blockchains. ETH suffers from low transaction throughput and high transaction costs (Hafid et al. 2020). To address these issues, an alternative approach involves utilizing Ethereum Virtual Machine (EVM)-compatible blockchains, particularly layer 2 solutions (Sguanci et al. 2021). These solutions provide the benefit of utilizing the security and decentralization of the Ethereum main chain, while achieving greater transaction throughput and reduced transaction costs. Additionally, there are alternative programmable blockchains such as Solana, Cardano, and Cosmos that offer higher throughput and lower transaction fees as well (Irresberger et al. 2020).
Smart contracts on a blockchain can be executed automatically if the required conditions are fulfilled, which helps enforce certain agreements among multiple parties (Taherdoost 2023). As one of the use cases of smart contracts, token smart contracts enable payments and token transfer on a blockchain, where a state variable storing the token holdings under each user will be modified accordingly (John et al. 2023). The ability of transaction inspections ensures that truth conditions are met for smart contract executions. Decentralized finance (DeFi) is another application using smart contracts to provide financial services without the need of intermediaries, with the benefits of transparency and immutability (Benetti and Piazza 2023). But potential concerns have been raised over the risks of meeting regulatory requirements and protecting investors. As a part of DeFi, the decentralized exchange (DEX) enabled by smart contracts allows users to trade with each other without traditional custodial intermediaries (Shah et al. 2023), although there are potential security threats and risks regarding attacks, such as stolen tokens, market manipulation, etc. (Li et al. 2024).
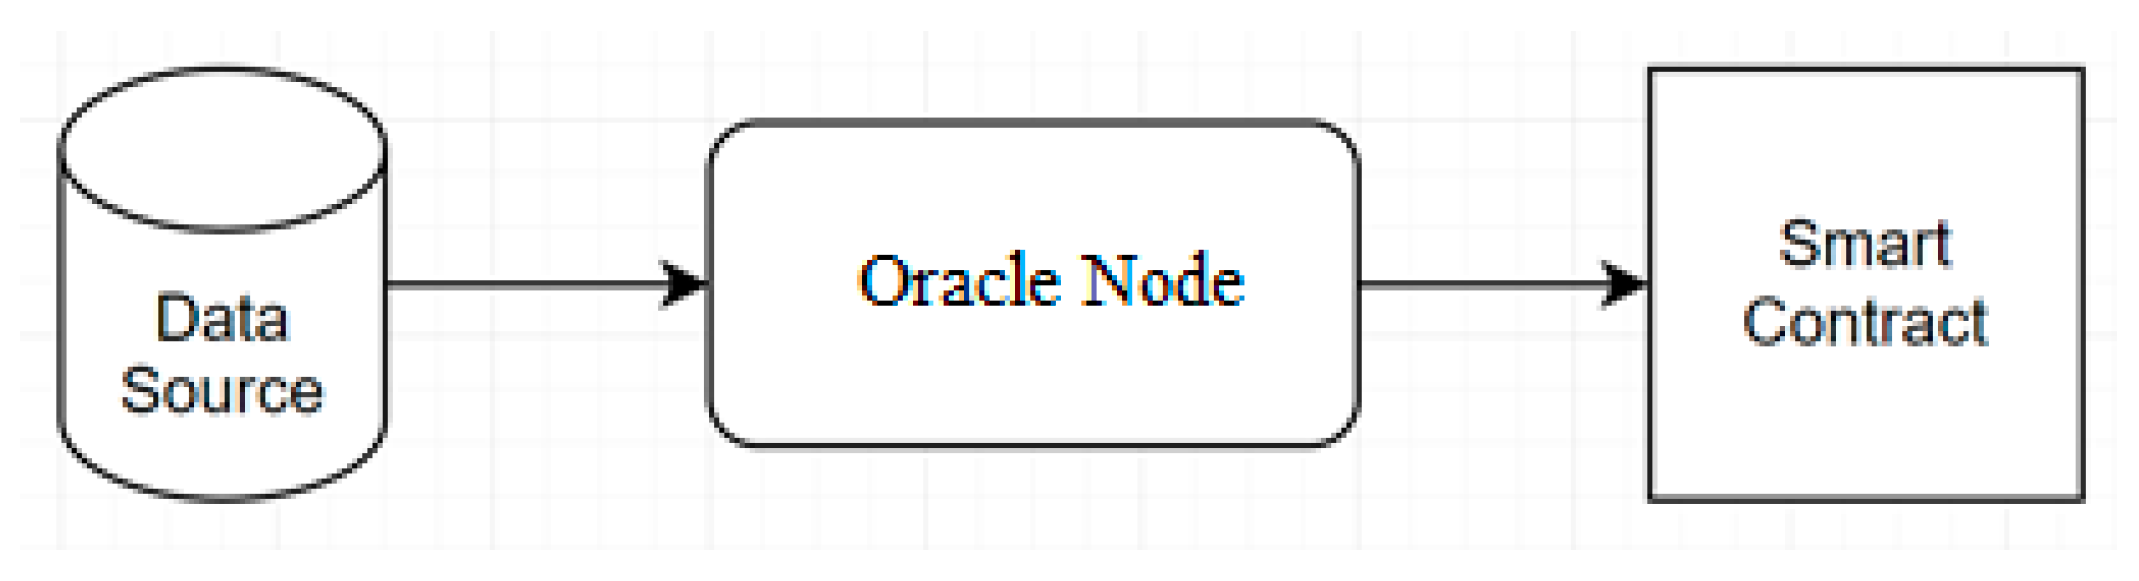
Smart contracts are limited to on-chain data and cannot directly interact with external systems that contain real-world data and events (Pasdar et al. 2023). A blockchain oracle serves as a bridge between the real world and the blockchain, enabling smart contracts to access and utilize real-world data. As displayed in Figure 1, the oracle ecosystem usually comprises the following three parts: data source, oracle node, and smart contract. Blockchain oracles play an important role in enabling interactions between blockchain networks and real-world data. But the concept of centralization and a potential single point of failure have been used as arguments against the advantages of decentralization (Hassan et al. 2023). Data could be brought into smart contracts by a decentralized network of oracles. As an example of oracle use cases, randomness in blockchain is obtained through oracles using verifiable random functions to build smart contracts for minting non-fungible tokens (Andrei 2024). Another example of a blockchain price oracle is reported to fetch the latest price of Bitcoin for DeFi smart contracts (Lys and Potop-Butucaru 2022). Decentralized oracles collect agricultural risk factor data from Internet of things (IoT) sensing devices to build smart contracts for agricultural insurance purposes (Manoj et al. 2024). Generally, there are two types of blockchain oracles: permissioned and permissionless. In a permissionless oracle, any user can join or leave the network at any time. Decentralized oracles provide significantly higher guarantees of correctness and eliminate the existence of a single point of failure. Several popular decentralized blockchain oracles exist, including Chainlink (Breidenbach et al. 2021) and time-weighted average price (TWAP) (Adams et al. 2023), etc. Among them, Chainlink is one of the most popular blockchain oracles. It provides a comprehensive suite of products, including data feeds, proof of reserves, and automated smart contracts. TWAP is a fully on-chain oracle provided by decentralized exchanges (DEXs) like Uniswap, enabling access to the average price of an asset over a specific period.
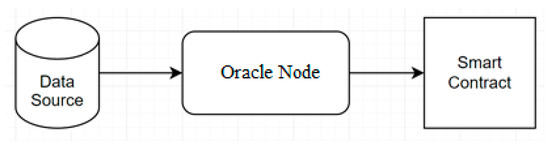
Figure 1.
Oracle ecosystem.
Research has explored different systems for data-onchaining that aim to provide trustworthy data (Heiss et al. 2019). One such approach is Transport Layer Security (TLS), with implementations like TLS-Notary (TLSNotary n.d.). Another approach is voting-based onchaining by Chainlink (Breidenbach et al. 2021). These systems offer diverse methods for ensuring the reliability and integrity of data in different contexts.
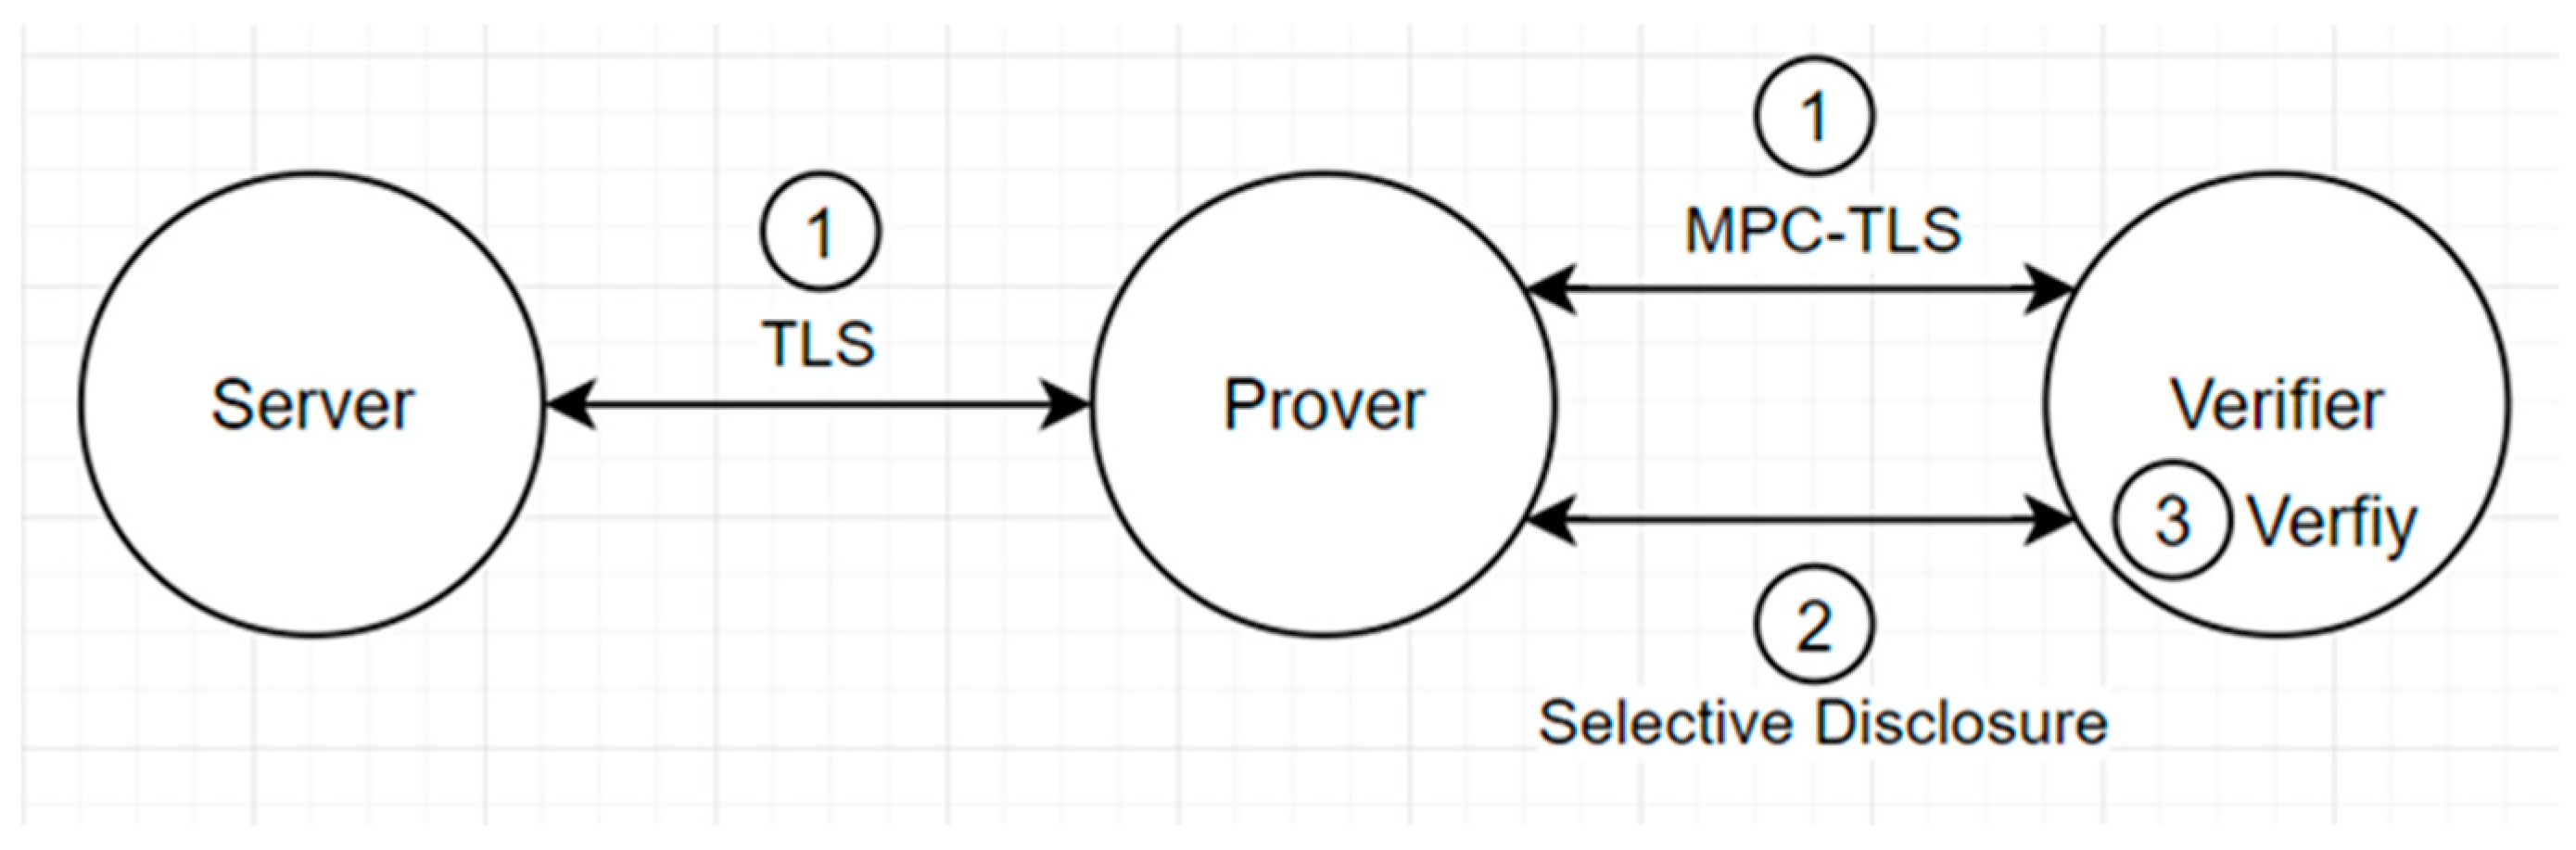
TLS-Notary is a protocol to prove the authenticity of data on the web, without revealing it to anyone (TLSNotary n.d.). Figure 2 illustrates how the TLS-Notary protocol works. The prover requests data from a server over TLS while cooperating with the verifier in secure and privacy-preserving multi-party computation (MPC). Next, the prover selectively discloses the data to the verifier. Then, the verifier verifies the data. Selective disclosure can be paired with zero-knowledge proof (ZKP) to prove properties of the redacted data without revealing the data themselves.
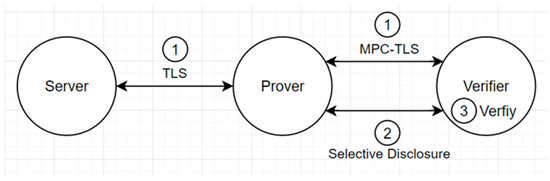
Figure 2.
TLS-Notary protocol.
2.3. Decentralized Applications (dApps)
This sub-section will discuss the different types of dApps, how they are built, and the system architecture they have adopted. dApps are applications that run on a blockchain or peer-to-peer network of computers instead of a single computer (Zheng et al. 2023). They are designed to be open source, decentralized, and incentivized through the use of tokens. dApps have gained significant attention due to their potential to disrupt traditional centralized systems by providing transparency, security, and autonomy. dApps can be broadly categorized into three types:
- DeFi (Decentralized Finance): These applications aim to recreate traditional financial systems such as lending, borrowing, and trading on the blockchain. Examples include Uniswap, Aave, and Compound.
- NFT (Non-Fungible Tokens): These are unique digital assets verified using blockchain technology. They are used in various fields such as art, gaming, and collectibles. Examples include CryptoKitties, NBA Top Shot, and OpenSea.
- GameFi (Gaming and DeFi): These applications combine gaming with financial incentives, allowing players to earn tokens through gameplay. Examples include Axie Infinity and Decentraland.
The architecture of dApps typically involves smart contracts, blockchain, and a user interface. Smart contracts are self-executing contracts with the terms of the agreement directly written into code. They run on the blockchain and are responsible for the logic of the dApps. The user interface allows users to interact with the dApps, often through a web browser and a Web3 wallet, e.g., MetaMask.
dApps offer several advantages over traditional applications, including transparency, security, and autonomy (Alamsyah et al. 2024). However, dApps also face challenges such as scalability, user experience, and regulatory compliance. The scalability issue arises from the limited transaction throughput of many blockchains, which can lead to high fees and slow transaction times (Khan et al. 2021). Improving the user experience is crucial for mainstream adoption, as managing private keys and interacting with blockchain technology can be complex for non-technical users. Regulatory compliance is another challenge, as the decentralized nature of dApps can conflict with existing legal frameworks.
3. Our Methodology
The decentralized cryptocurrency trading system being developed for this research falls under the DeFi category. Bitcoin was chosen for price prediction in this research due to its status as the most important and largest cryptocurrency; Bitcoin occupies about 54.47% of total cryptocurrency market capitalization as of 1 January 2025 (CoinGecho.com 2025). Bitcoin is the most frequently and extensively studied cryptocurrency, accounting for about 79% of research papers, followed by Ethereum at about 32% (John et al. 2024). Bitcoin prices possibly impact the volatility of the cryptocurrency market (Kumar and Anandarao 2019). The capability to predict Bitcoin prices at a high accuracy level could be very helpful to investors making investment decisions or to governments making regulatory policies (Goodell et al. 2023). The transparency of Bitcoin prices has become more efficient and well known (Omole and Enke 2024). Bitcoin is used in hedging for the movement of gold prices, stock market indices, etc. (Chatterjee et al. 2024), although higher volatility is observed in Bitcoin prices compared to those traditional financial assets (Omole and Enke 2024). There is abundant trading and blockchain data, and extensive research has been conducted on Bitcoin pricing patterns. This makes Bitcoin an ideal choice for engaging non-cryptocurrency users/investors.
3.1. Blockchain, Smart Contracts, and Oracle
Blockchain was the key technology used to build the decentralized crypto trading system. It enables the use of smart contracts to build applications and oracles on top of the blockchain.
3.1.1. Blockchain
Arbitrum, an Ethereum layer 2 solution, was chosen for this research due to the high liquidity of Wrapped Bitcoin (wBTC) and its inheritance of Ethereum’s security and decentralization. Arbitrum has the 4th highest total value locked (TVL) after Tron, Binance Chain, and Ethereum as of August 2023 (Wagner et al. 2024). Ethereum is slow and expensive to use (Hafid et al. 2020). Tron and Binance Chain are managed by centralised entities. This makes Arbitrum the best choice for this study. Arbitrum is a layer 2 solution that borrows security from Ethereum, which is layer 1. Transactions that happen on Arbitrum will be batched and committed to Ethereum using mathematical fraud proofs. This drastically reduces the cost required to do trading without sacrificing the decentralized nature of a blockchain. Arbitrum uses optimistic rollups, a data compression technique that bundles multiple transactions into a single “rolled-up” transaction. This reduces blockchain processing time and costs by confirming only the rolled-up transaction instead of each individual transaction within it. Optimistic rollups assume the validity of transactions within the rollup. However, validators can dispute transactions suspected of fraud. They must stake ETH before confirming transactions, incentivizing honest behavior. Alchemy, a blockchain node service provider platform, was used to access Arbitrum in developing our decentralized crypto trading system.
3.1.2. Smart Contract
Smart contracts are software applications that run on blockchain networks. They can be created using Solidity, a programming language specifically designed for developing smart contracts on Ethereum Virtual Machine (EVM) chains. Audited open-source smart contracts from OpenZeppelin and Uniswap were utilized to build the decentralized crypto trading system. OpenZeppelin is an open-source framework that provides tools and libraries for building secure smart contracts. Uniswap is a decentralized cryptocurrency exchange (DEX) that employs a set of smart contracts to facilitate trading. Uniswap was used as the DEX, with trades being executed based on price predictions generated by the models.
Hardhat is utilized for the development, testing, and deployment of smart contracts. Hardhat is an EVM development environment platform that offers various features and tools to streamline the development process.
The decentralized crypto trading system involved the creation of a portfolio contract that enables trading between wBTC and USDC on Uniswap. The trades are executed based on the price predictions provided by the models. Each user is required to deploy their own portfolio contract and deposit USDC to trade with wBTC. This approach empowers users with full control over their funds, eliminating the need for an external party and achieving decentralization.
3.1.3. Oracle
To integrate the price predictions from the model into the decentralized crypto trading system, a custom oracle was developed using Solidity. This oracle is designed to receive the predicted price exclusively from the application owner, while allowing anyone to request the predicted price at any given time.
To maintain regular and timely price updates, a cron job was implemented to schedule periodic requests for the price. This ensures that the smart contracts receive up-to-date and accurate price information.
The time-based automation feature of Chainlink can be utilized to automate this process. However, it currently does not support the automatic deployment of time-based automation upkeep contracts. A custom oracle contract was created to accept the predicted price from the model and transmit it to the portfolio contract that invokes the oracle. This approach guarantees that the portfolio contract has access to the latest price information required for executing trades.
3.2. System Architecture and Trading Flowchart
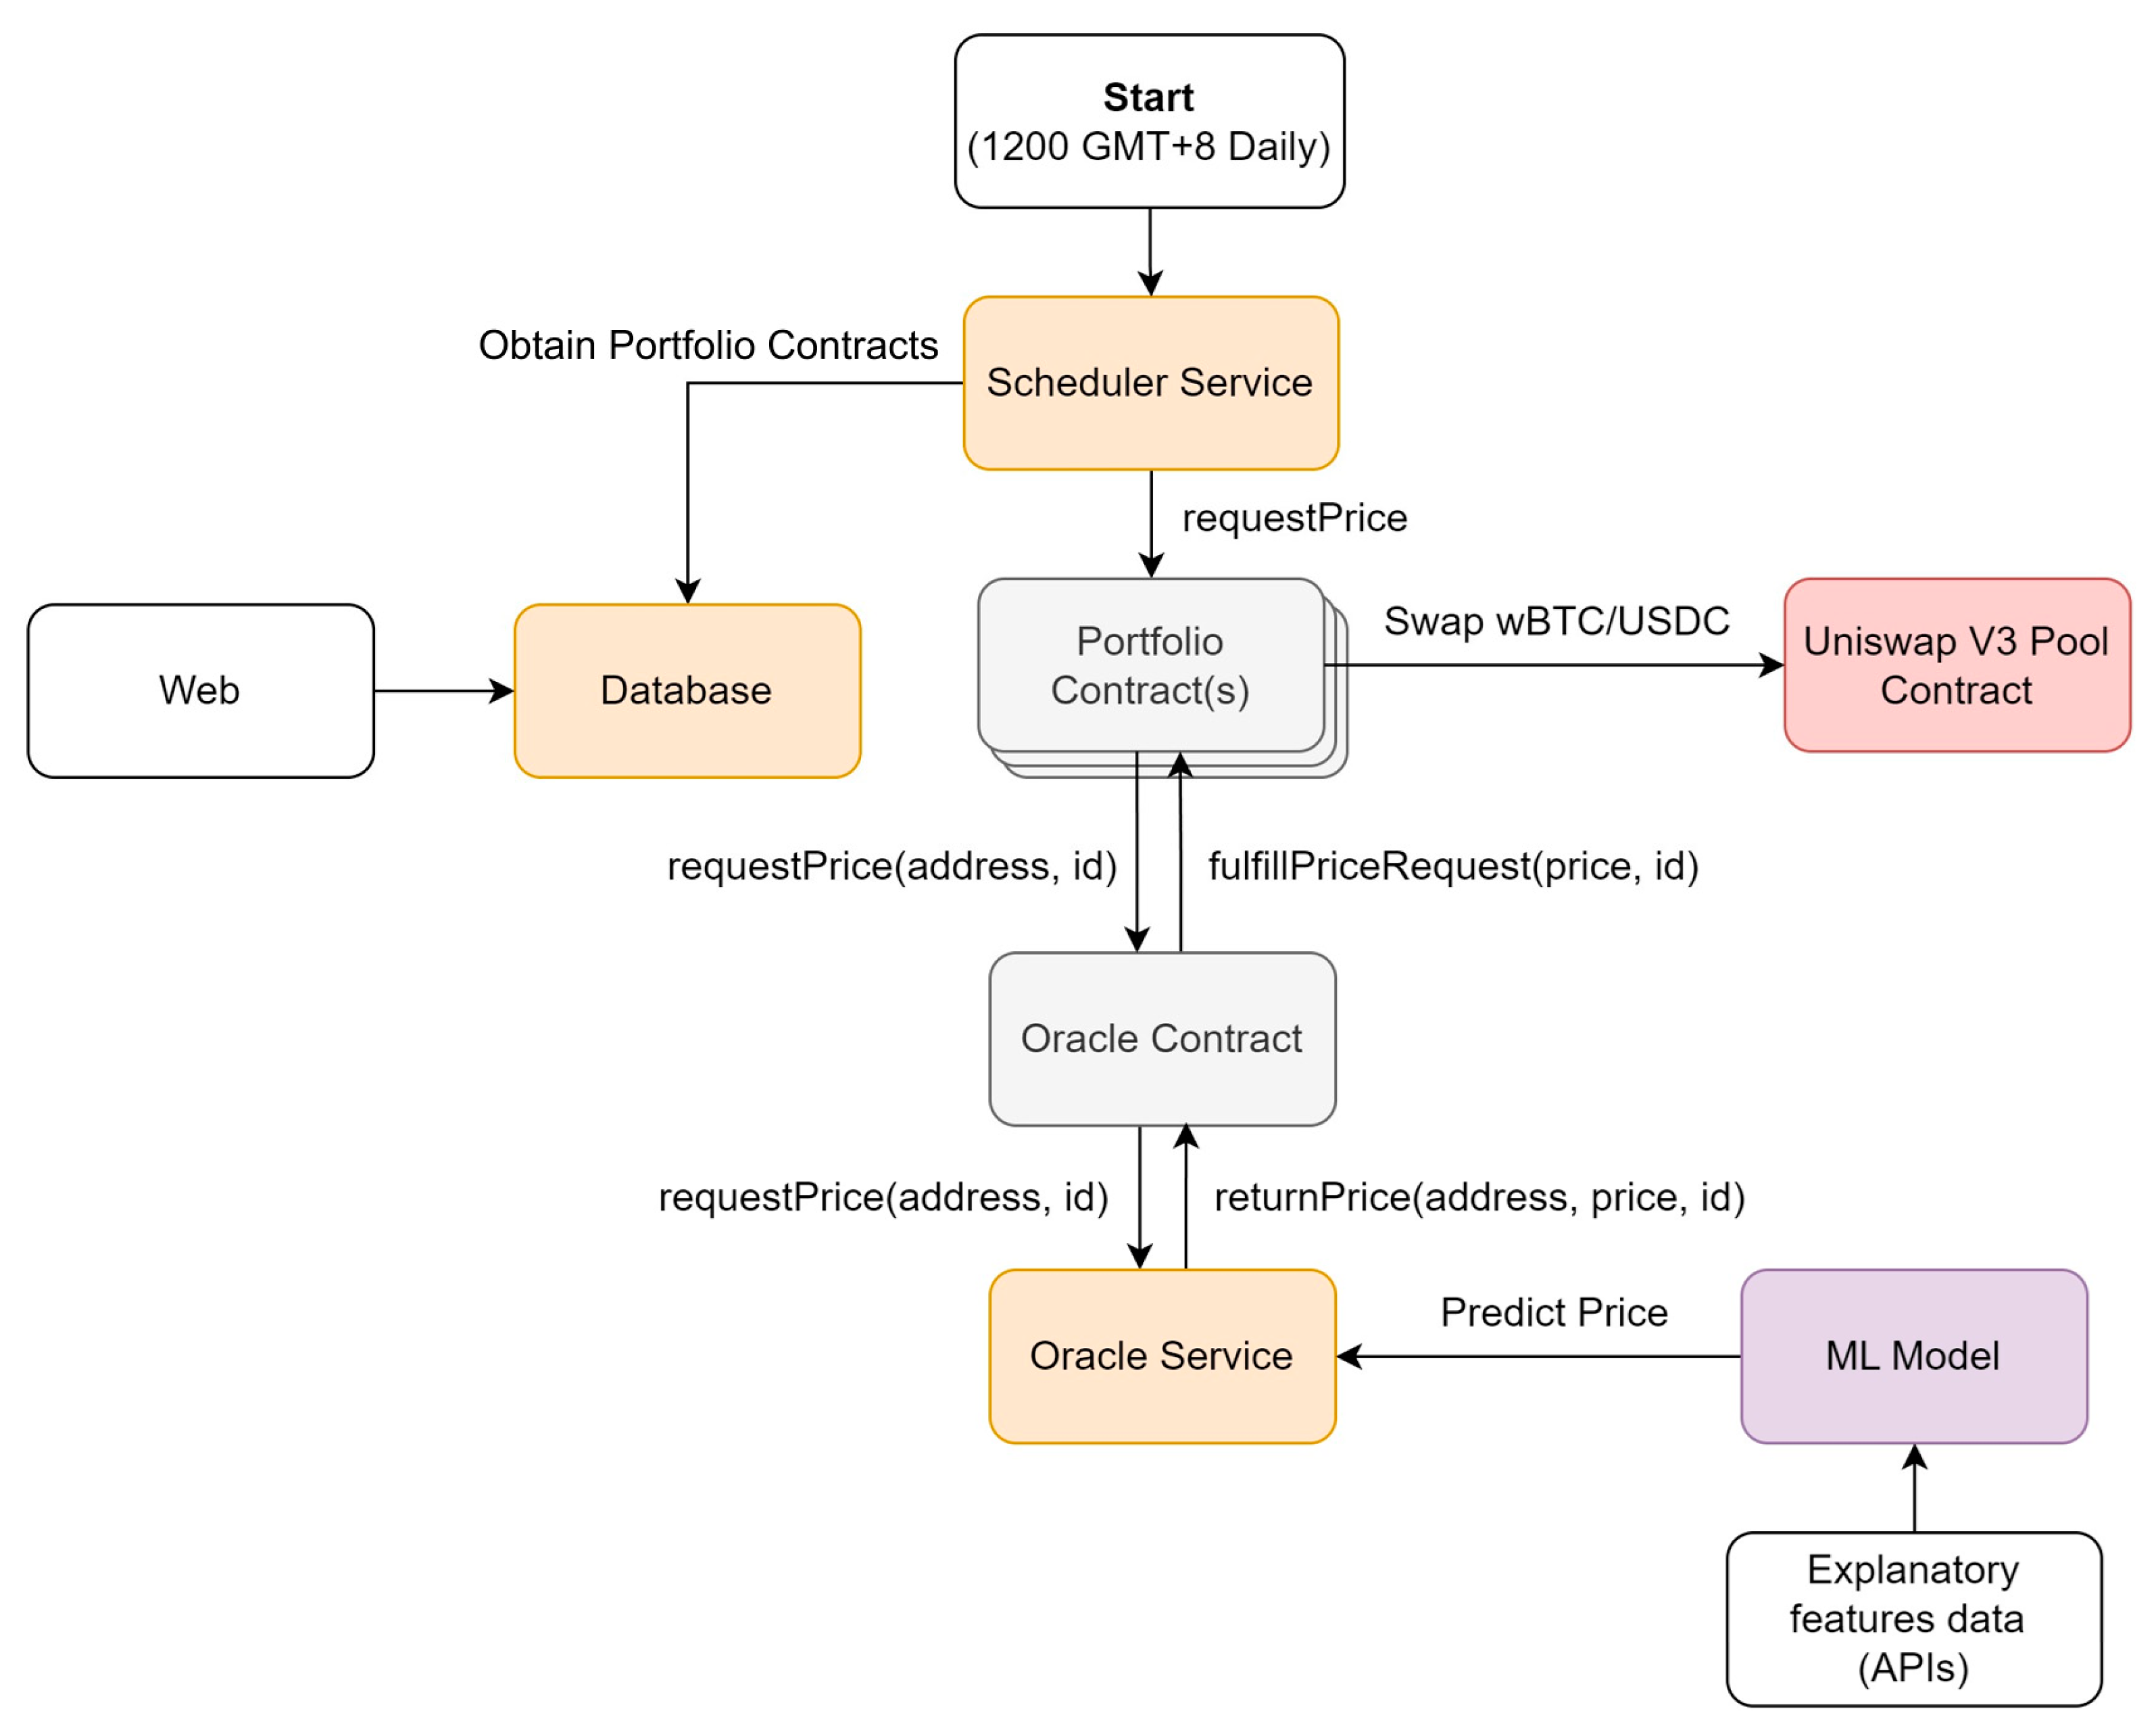
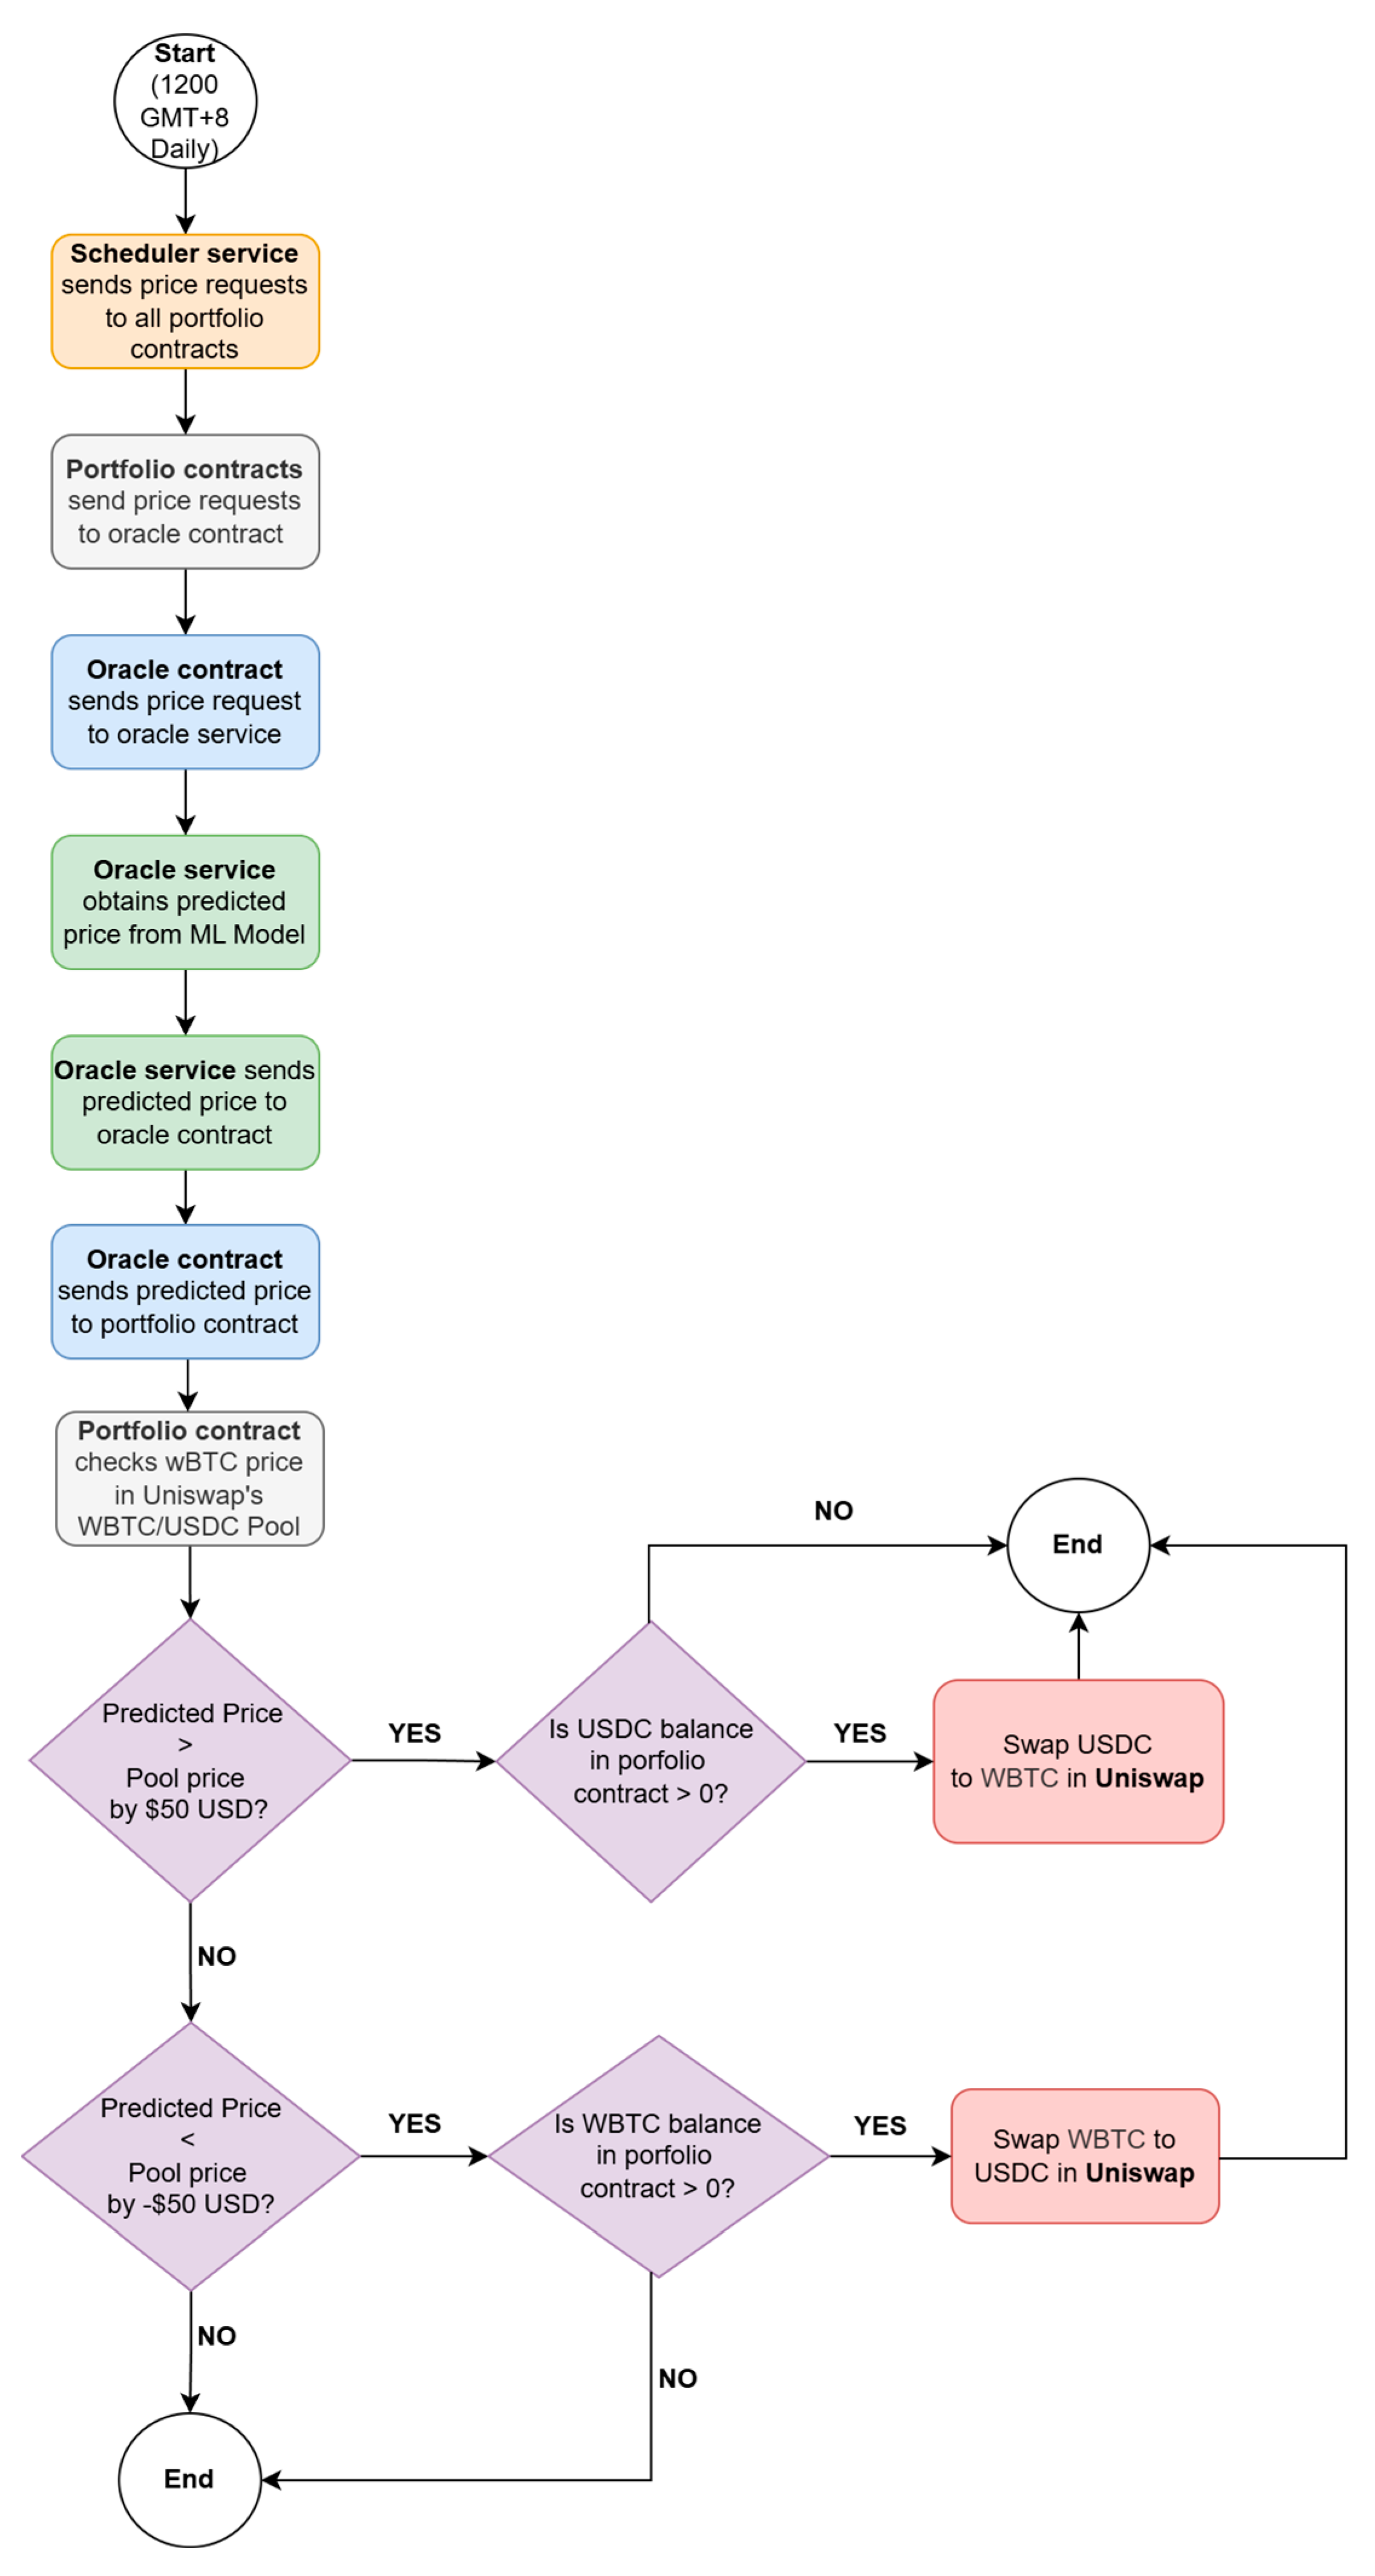
The architecture of the decentralized cryptocurrency trading system, as depicted in Figure 3, involves several components. The system is not completely decentralized due to the use of custom oracle and centralized services like a database. However, the use of these centralized services does not impact on the custody of users’ funds. Users still maintain complete control over their funds. The web application accesses the database to retrieve user portfolio contracts and display them on the web interface. The scheduler service also utilizes the database to interact with smart contracts and to request the predicted Bitcoin price at 12:00 GMT+8 daily. The oracle service receives these requests and uses the ML model to predict the price using the explanatory features. The oracle service pushes the predicted price to the oracle contract. The portfolio contracts utilize the price data from the oracle contract to execute wBTC/USDC trades on the Uniswap pool contract. Figure 4 depicts a detailed flowchart illustrating how the decentralized cryptocurrency trading system works. The system performs the actions automatically, starting from price requests with the scheduler service, to receiving the predicted price from the ML model, to going through several trading strategies and conducting the buy/sell trading between wBTC and USDC.
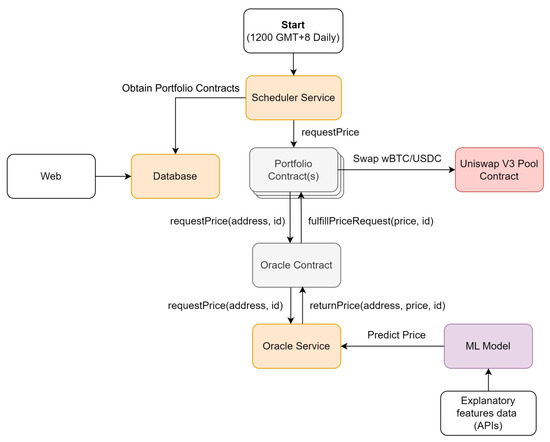
Figure 3.
System architecture for the decentralized crypto trading system.
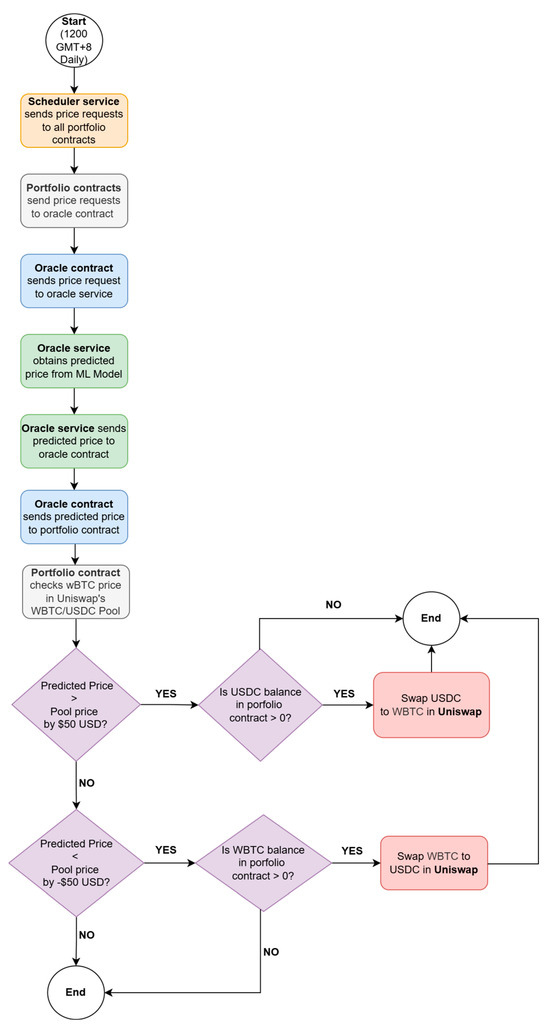
Figure 4.
Trading flowchart of the decentralized cryptocurrency trading system.
In this research, three trading strategies were used and compared for trading Bitcoin based on the predicted Bitcoin closing prices, which are shown in Table 1. For all three trading strategies, a commission fee of 0.5% per transaction was adopted. For the first trading strategy, if the price change between the predicted BTC price and the pool price was more than +USD 50 and there was an available USDC balance in the portfolio contract, then the system performed the buy BTC action to swap the available USDC into BTC through the Uniswap. On the other hand, if the price change between the predicted BTC price and the pool price was more than −USD 50 and there was an available wBTC balance in the portfolio contract, then the system performed the sell BTC action to swap the available BTC into USDC through Uniswap.

Table 1.
Trading strategies used in this study.
The moving average convergence or divergence (MACD) is one of the most used technical indicators, calculated by subtracting the 26-day exponential moving average (EMA) from the 12-day EMA, as shown in Equation (1). A nine-day EMA was calculated as the MACD signal line.
MACD = (12-day EMA) − (26-day EMA)
For the second trading strategy, the buy or sell BTC transaction was performed when the MACD moves cross over or under the MACD signal line, together with the fulfillment of the ±USD 50 price change strategy criteria.
For the third trading strategy, the MACD ratio was calculated as shown in Equation (2). The buy or sell BTC transaction was performed when the MACD ratio was above 1.25 or below 0.75, together with the fulfillment of the ±USD 50 price change strategy criteria.
MACD Ratio = MACD Line/Signal Line
3.3. Machine Learning Models Used
In the system architecture shown in Figure 3, the ML model takes in the relevant BTC data and predicts the BTC price for the oracle service. In this research, three types of ML models were adopted and evaluated: random forest (RF), LSTM, and Bi-LSTM. The results of these three ML models will be compared and analyzed.
3.3.1. Random Forest
RF is an ensemble learning algorithm that combines multiple decision trees to enhance prediction accuracy and robustness. It constructs a multitude of decision trees during training and outputs the mode of the classes for classification tasks or the mean prediction for regression tasks. It leverages the power of ensemble learning, which involves training several models and combining their predictions to improve overall performance and reduce the risk of overfitting.
In the context of predicting daily Bitcoin future closing prices, RF can be effective due to its ability to handle large datasets and its robustness against noise and overfitting. Bitcoin price prediction is inherently challenging due to the asset’s extreme volatility and sensitivity to various market factors, such as trading volume, investor sentiment, and macroeconomic indicators. By training multiple decision trees on different subsets of the data, RF can capture diverse patterns and relationships within the data, leading to more accurate and reliable predictions. It is reported that higher prediction accuracy is obtained by RF in predicting Bitcoin price direction than that of logit models, but it is subject to potential sensitivity to the number of trees (Basher and Sadorsky 2022).
The inherent feature selection mechanism of RF helps in identifying the most relevant predictors for Bitcoin price, such as historical prices, trading volume, and social media sentiment. This capability is crucial in financial markets where numerous variables can influence asset prices, and distinguishing the significant ones can lead to good predictive performance.
In this research, scikit-learn, a Python library, was used to create and train the RF model. The criterion was set to the parameter of absolute_error, and the parameter of n_estimators was set to be 500. The training of the RF model is illustrated in Figure 5, where predicted BTC prices based on input dataset are derived with 500 decision trees and the average RF predicted price is taken.
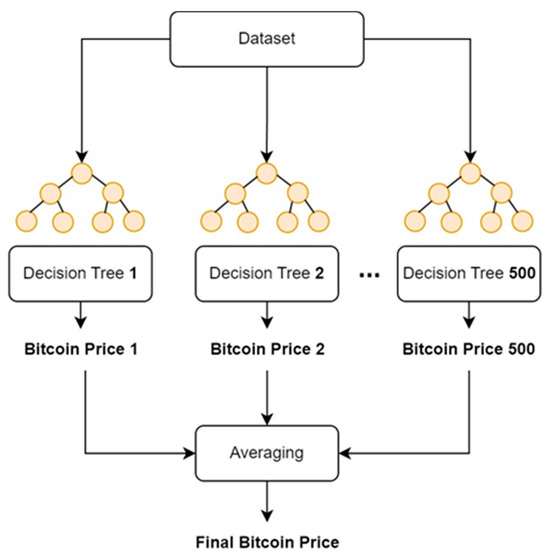
Figure 5.
Illustration of the training of the RF model.
3.3.2. LSTM
LSTM is a specialized type of recurrent neural network (RNN) that excels at capturing and modeling long-term dependencies in sequential data. Traditional RNNs suffer from the problem of vanishing and exploding gradients, which hampers their ability to learn from long-term dependencies in the data. LSTM addresses this issue through a unique architecture that includes memory cells and gating mechanisms, allowing them to retain and utilize information over extended sequences effectively. LSTMs can maintain and update the cell state effectively, preserving long-term dependencies while mitigating the problems associated with standard RNNs.
In the context of predicting daily Bitcoin closing prices, LSTM is well-suited due to its ability to model temporal dependencies in financial time series data. LSTM can better address long-term memory issues in cryptocurrency markets (Wu et al. 2024). LSTM can obtain favorable results for cryptocurrency prices prediction by learning complex relationships in historical data (Akila et al. 2023). Bitcoin price movements are influenced by various factors that unfold over time, including historical prices, trading volumes, market trends, and external economic indicators. LSTM can learn from these sequential patterns and dependencies, providing more accurate and reliable predictions (Parente et al. 2024). But the prediction performance of LSTM could be sensitive to the scale of the input data (Syed et al. 2023).
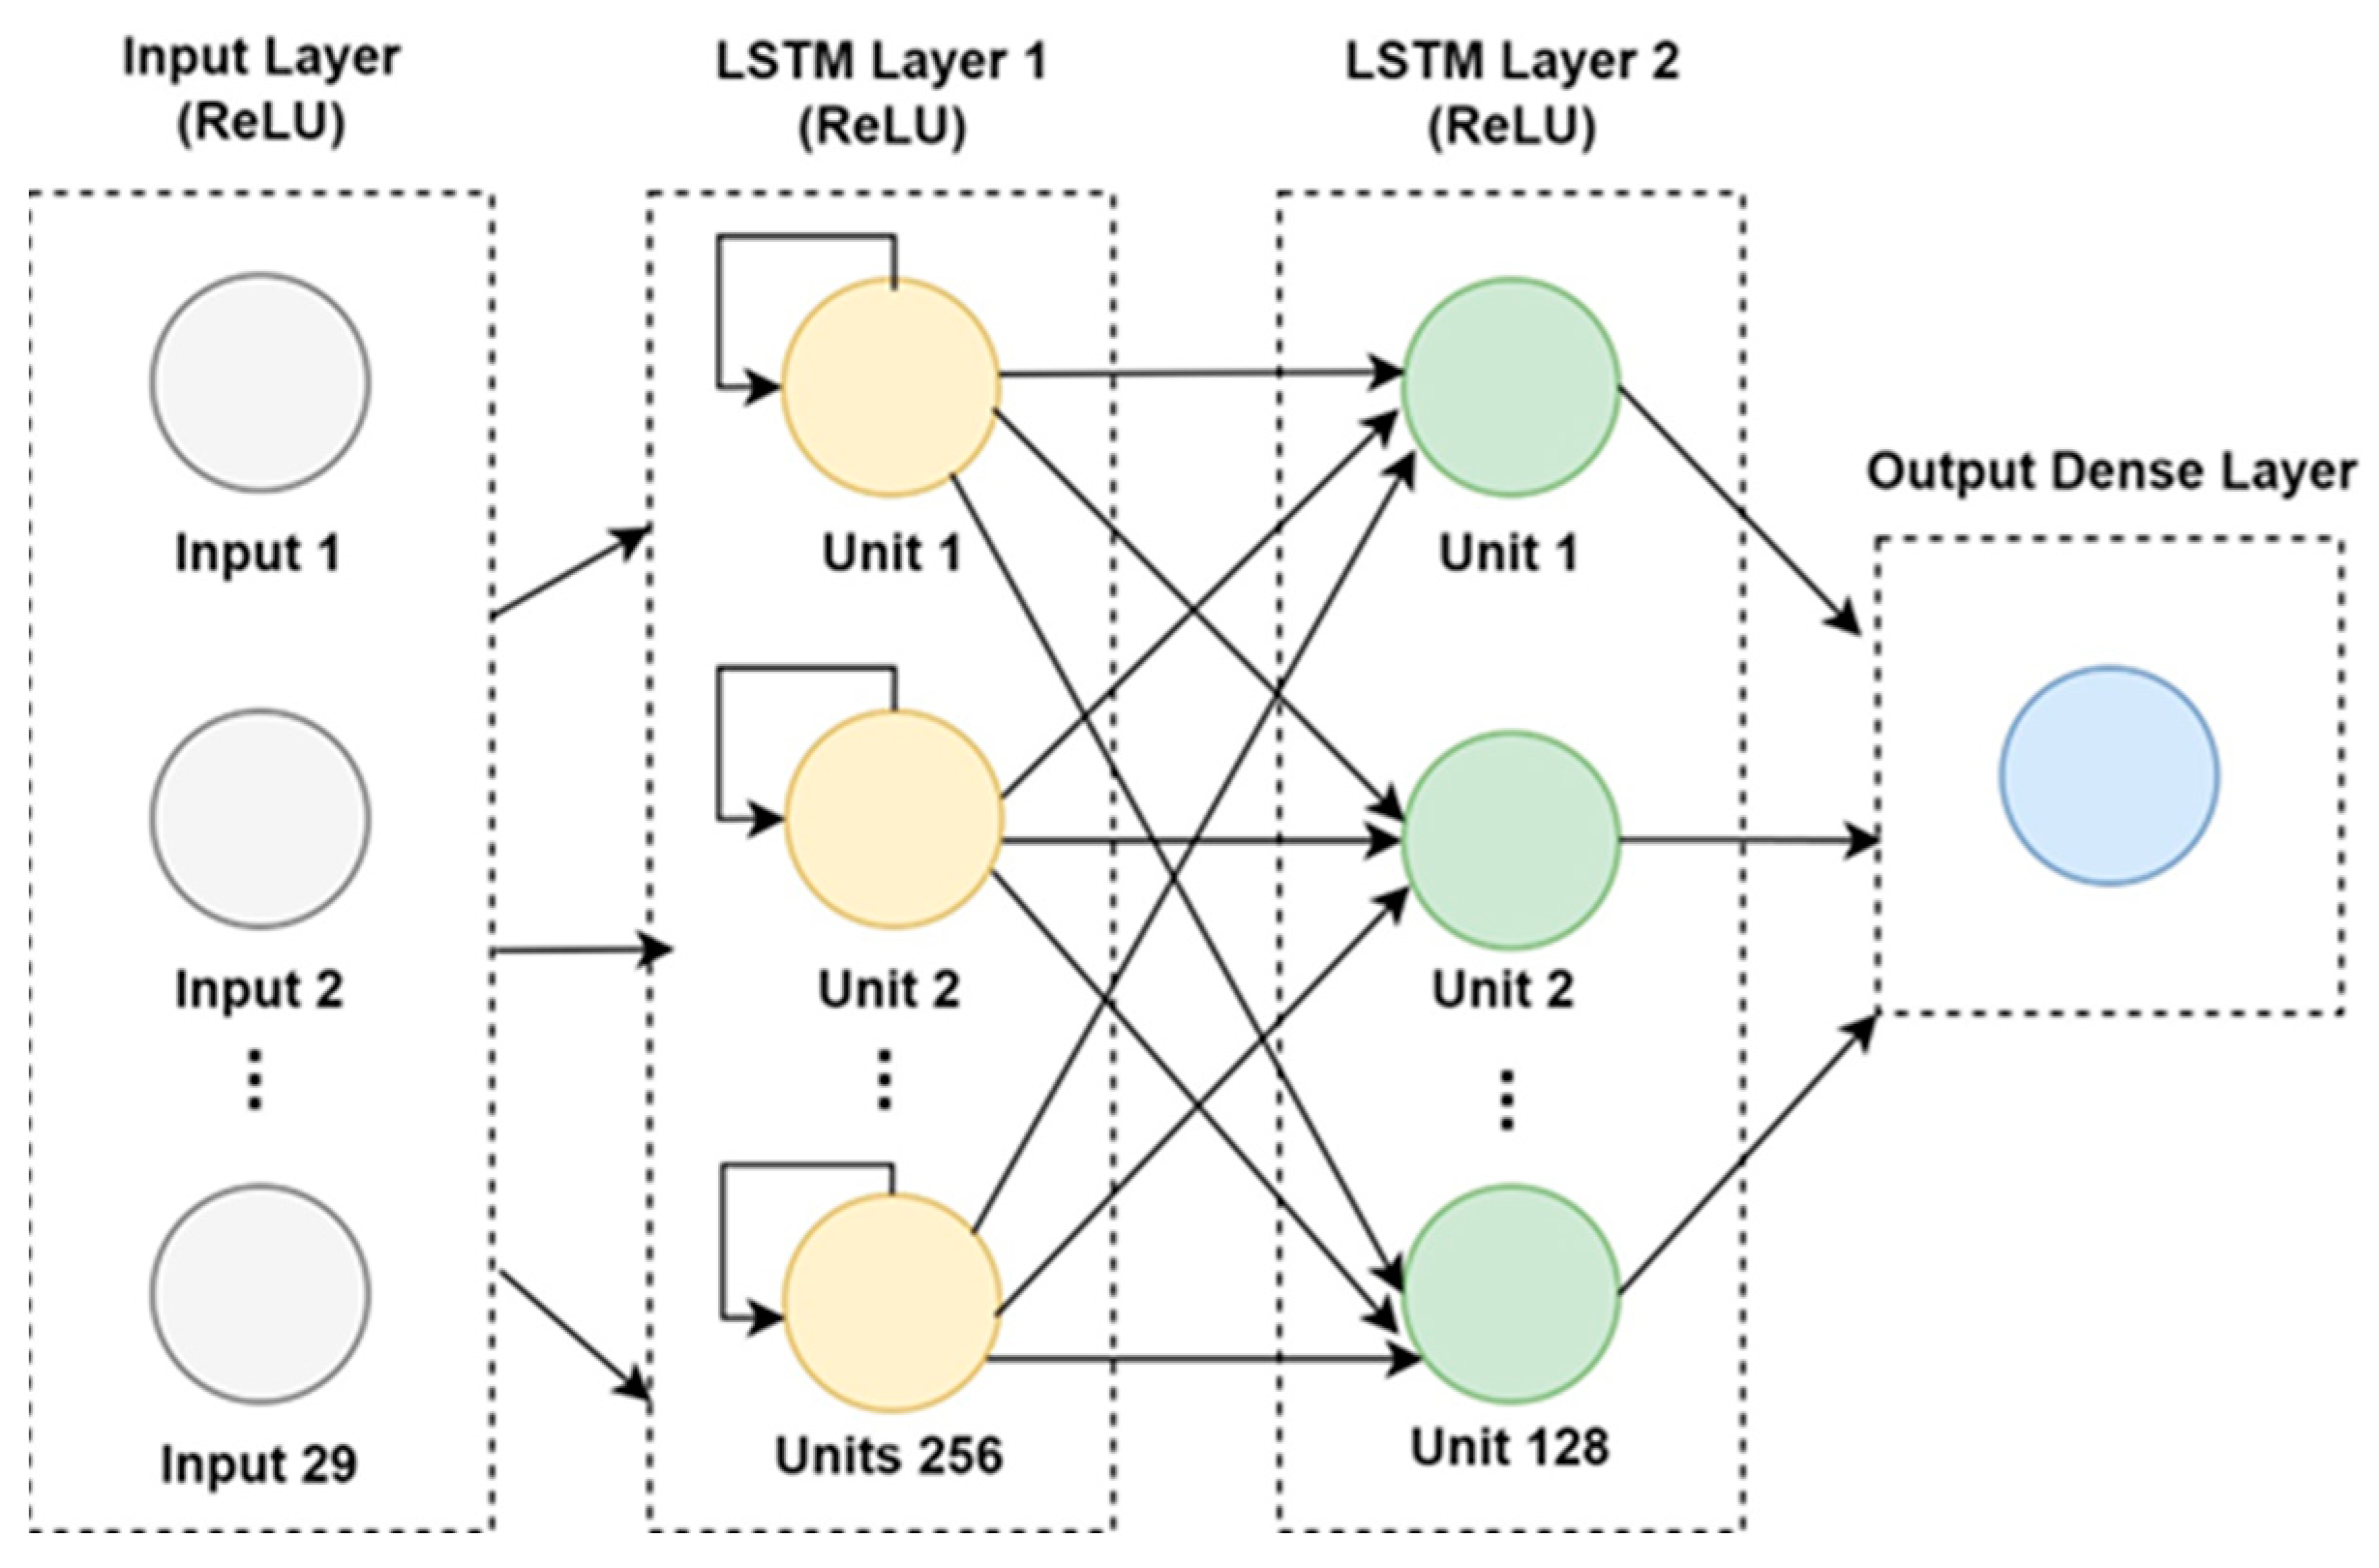
In this research, TensorFlow.keras, a Python library, was used to create and train the LSTM model. The training of the LSTM model is illustrated in Figure 6, which consists of three layers. The first LSTM layer consists of 256 units and uses the rectified linear unit (ReLU) activation function. The second LSTM layer has 128 units and uses the ReLU activation function. The final layer is a dense layer with a single unit. Callbacks such as EarlyStopping and ModelCheckPoint were configured to monitor and save the best model to be used later. EarlyStopping monitors validation loss with a patience of 10 epochs and restores the best weights. ModelCheckPoint saves the best model by monitoring the validation loss occurred in the epochs. The model trained for a maximum of 100 epochs.
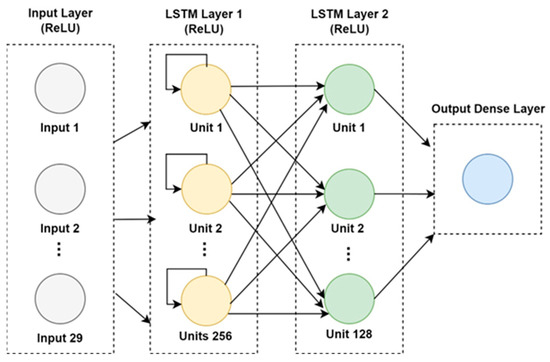
Figure 6.
Illustration of the training of the LSTM model.
3.3.3. Bi-LSTM
Bi-LSTM is an advanced extension of the traditional LSTM network that enhances the model’s ability to capture information from both past and future contexts in sequential data. While standard LSTM processes data in a single forward direction, Bi-LSTM networks consist of two LSTM layers: one that processes the input sequence from past to future (forward direction) and another that processes it from future to past (backward direction). This bidirectional processing enables the model to have a more comprehensive understanding of the sequence by accessing information from both temporal directions.
In the context of predicting daily future Bitcoin closing prices, Bi-LSTM networks have certain advantages. Bitcoin price movements are influenced by a multitude of factors that unfold over time. By leveraging information from both past and future contexts, Bi-LSTM networks can better understand and predict these complex temporal dependencies. For instance, the forward LSTM can capture how historical prices and volumes impact future prices, while the backward LSTM can provide insights into how upcoming market events might have been influenced by past data. This dual perspective allows for more accurate and robust predictions (Seabe et al. 2023). But Bi-LSTM has a more complex structure than LSTM (Wang et al. 2021). Sometimes a lack of awareness of market behavior changes may appear using Bi-LSTM (Lu 2022).
In this research, TensorFlow.keras, a Python library, was used to create and train the Bi-LSTM model, which consists of three layers. The first Bi-LSTM layer has 256 units and uses the ReLU activation function. The second Bi-LSTM layer has 128 units and uses the ReLU activation function. The final layer is a dense layer with a single unit. Callbacks such as EarlyStopping and ModelCheckPoint were configured to monitor and save the best model to be used later. EarlyStopping monitors validation loss with a patience of 10 epochs and restores the best weights. ModelCheckPoint saves the best model by monitoring the validation loss occurred in the epochs. The model trained for a maximum of 100 epochs.
3.4. Architecture Implementation of the System
A user interface is required to provide convenient access to the service. A web application was chosen as the interface for the decentralized crypto trading system. Users can easily access the service through a web browser. Furthermore, the browser is compatible with Web3 wallets like MetaMask and Trust Wallet. These Web3 wallets enable users to securely access dApps. With a Web3 wallet, users have complete control over their funds and data.
Users must bear significant responsibility when using decentralized Web3 wallets, such as remembering and backing up their seed phrases and private keys. This information cannot be reset or recovered by anyone once lost or forgotten. However, many users who are not familiar with the Web3 space may not be accustomed to such responsibility, as mainstream services often offer alternative recovery methods via email, phone, security questions, or in-person verification.
To address this gap in user experience and cater to those who are not comfortable managing their wallet responsibilities, Web3Auth, a Web3 wallet service provider, was used. Web3Auth offers social media OAuth 2.0 authentication methods, which allow users to manage their wallets using familiar social media accounts. While this approach is not as decentralized and secure as traditional Web3 wallets, it enhances user experiences for individuals who prefer or are unfamiliar with the responsibility of managing their wallet independently.
The web application incorporated libraries such as Web3Auth, Uniswap, and ethers.js. These databases are used to store user data related to the deployed contracts of users and to provide convenient access from the web application. This combination of technologies will create a streamlined experience for users. Table 2 summarizes the framework, libraries, and host provider used to implement the architecture of the decentralized crypto trading system.
Table 2.
Frameworks, libraries and host providers used for architecture implementation.
3.5. Three-Stage Approach of the Crypto Trading System
The flowchart of the three-stage approach for the Bitcoin price prediction models is shown in Figure 7. These three stages include data preparation for 30 features, data pre-processing, and modelling. The models were trained using 30 features that have an influence on pricing based on previous studies in the field. These can be grouped according to their types as follows:
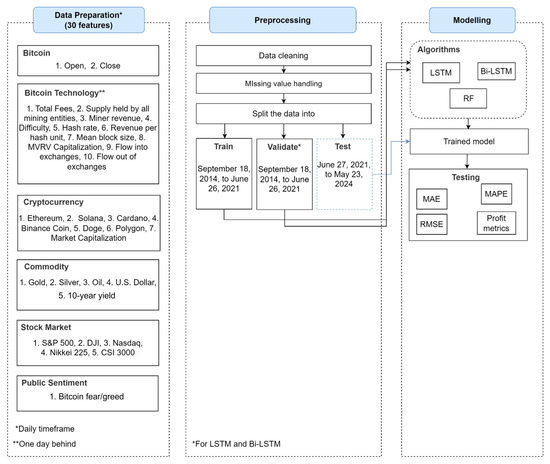
Figure 7.
Three-stage approach for data preparation, data pre-processing, and modelling.
- Bitcoin: Part of Bitcoin market data.
- Bitcoin Technologies: Related to variables derived from the Bitcoin codebase and node operations.
- Cryptocurrencies: Other currencies that are assumed to have price correlations.
- Commodities: Commodities that are assumed to influence cryptocurrency prices.
- Stock Markets: Key indexes that may affect cryptocurrency prices.
- Public Sentiment: Market behaviors can often be driven by emotions, leading to irrational decisions, especially in speculative assets like cryptocurrencies.
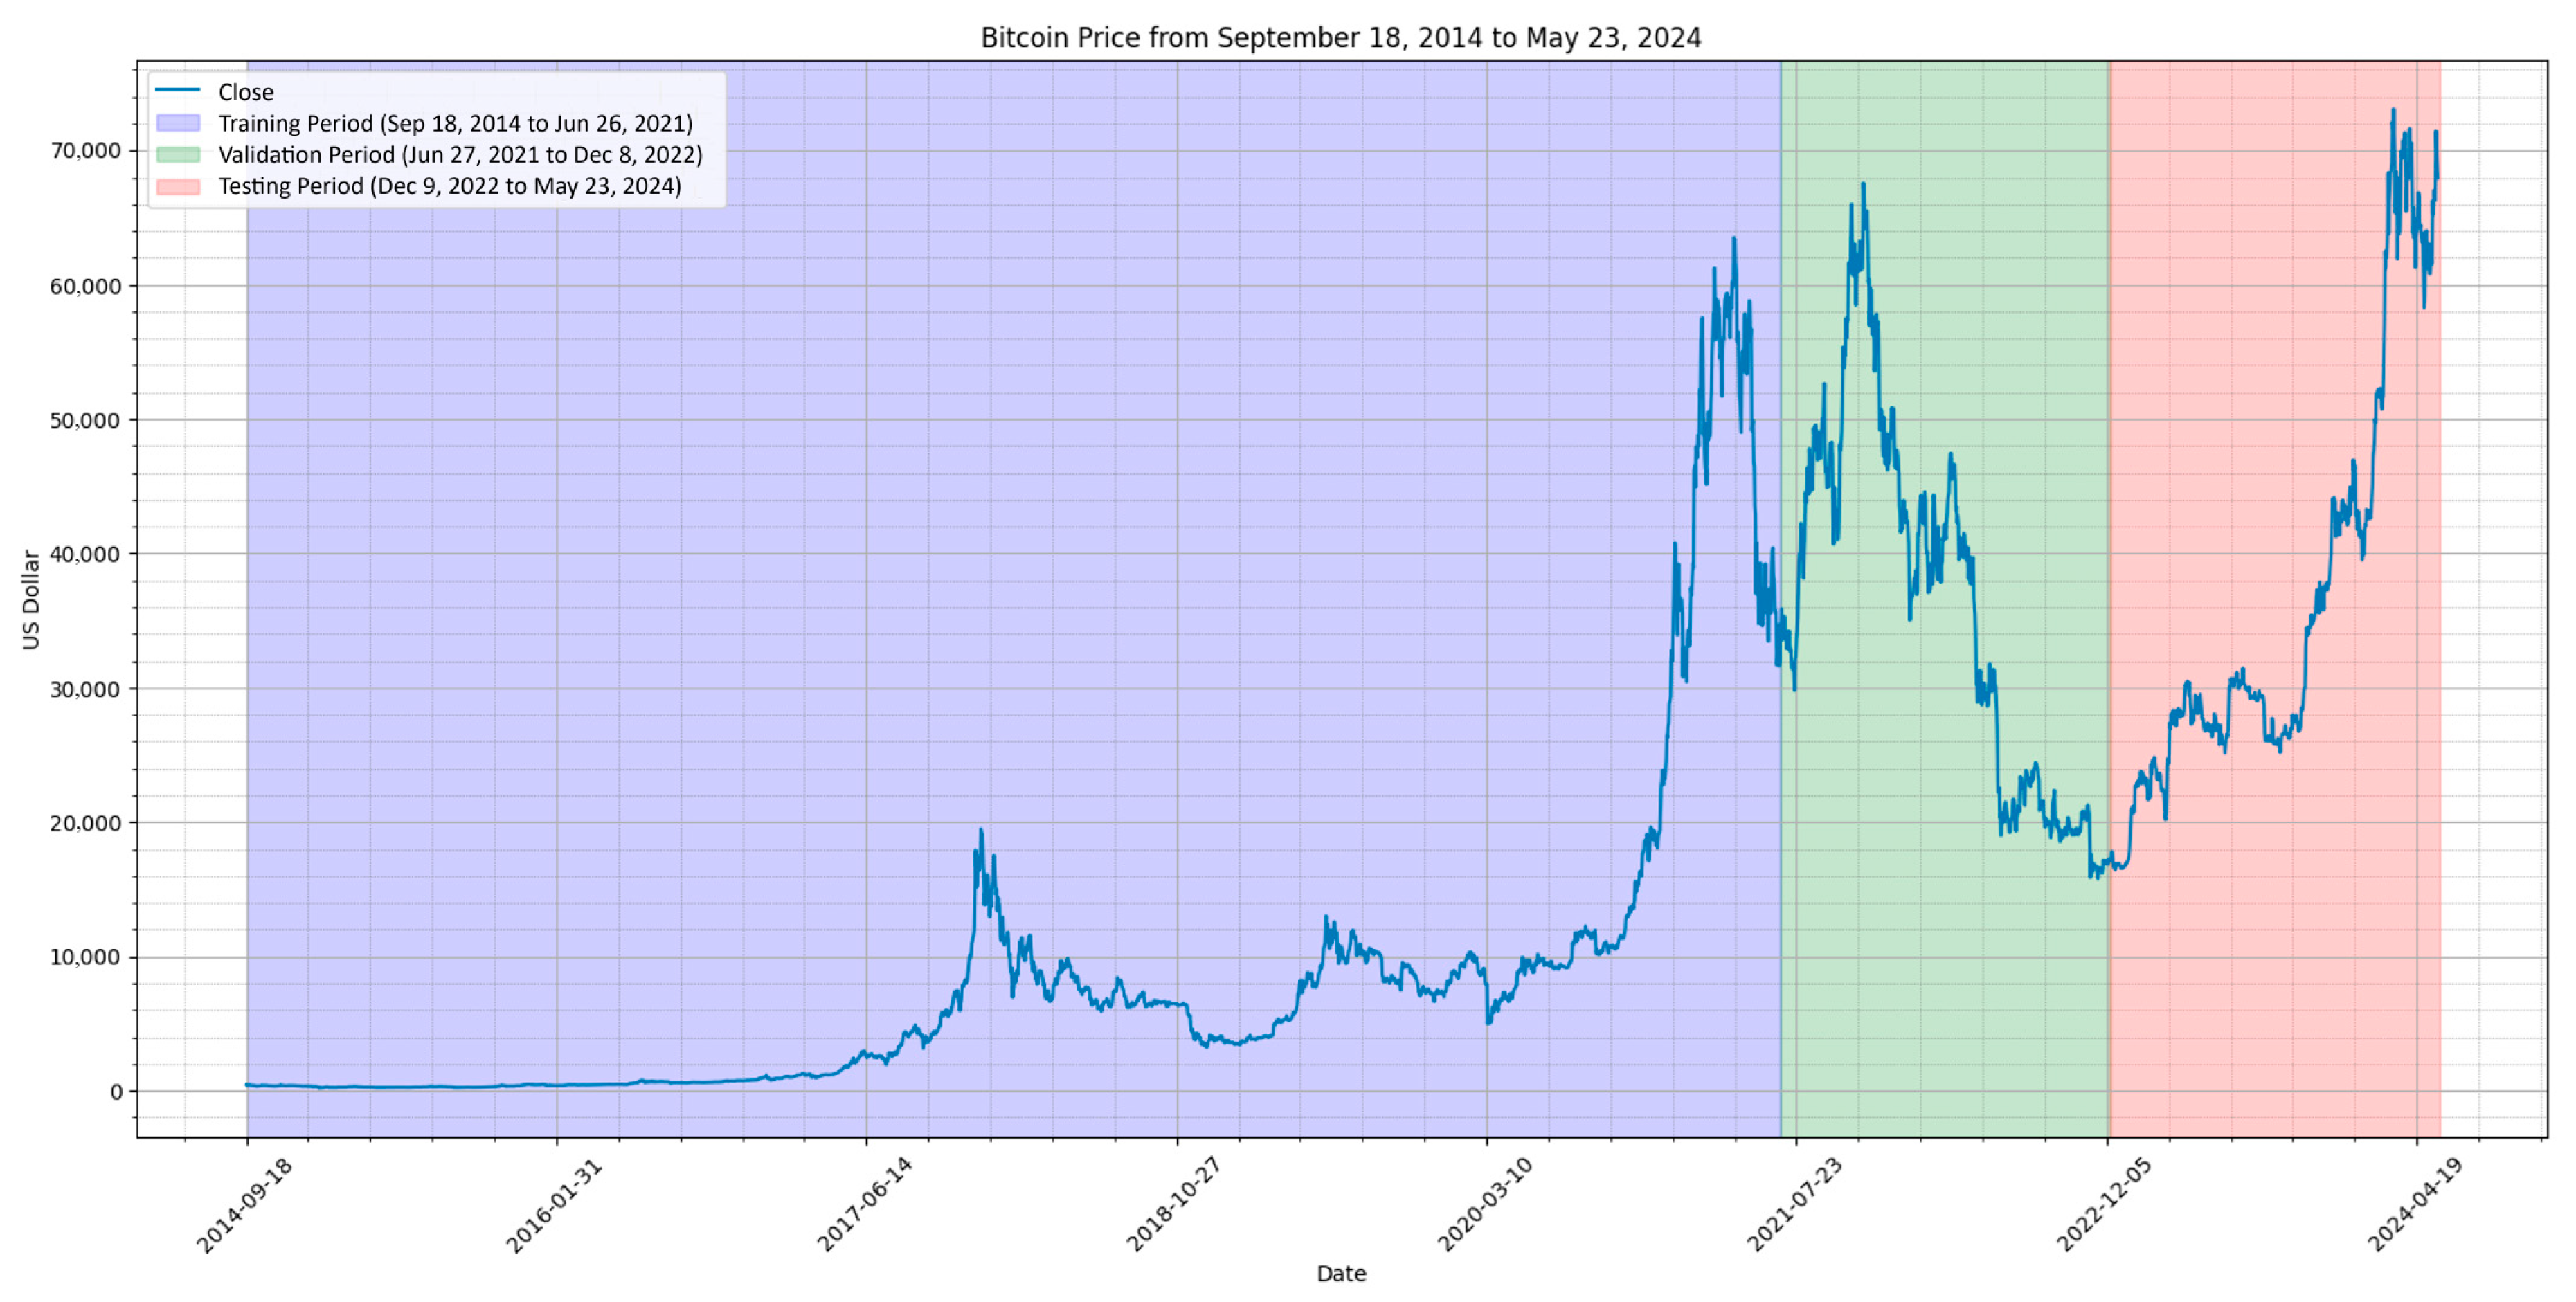
Table 3 shows the explanatory 30 features and their data sources. They were collected from various sources such as Yahoo Finance, Coin Metrics, Alternative.me, and CoinMarketCap. The collected data spanned from 18 September 2014 to 23 May 2024. The data samples are with daily timeframes unless stated otherwise. The data encompasses three distinct bubble cycles, during which Bitcoin experienced significant price fluctuations.
Table 3.
30 explanatory variables and features affecting future Bitcoin closing price.
A total of 3535 days or rows of data were collected. Of those data, 70% was used for training, the next 15% was used for validation, and the last 15% was used for testing. The validation dataset was later used for training for the RF model.
In the second phase shown in Figure 7, Python libraries such as Pandas, CSV, and JSON were used for data pre-processing. The previous day’s data point was used to handle missing data in the dataset due to the cryptocurrencies not being invented yet, or it being a non-trading day. Deleting data was not an ideal approach due to the time series nature of the model being trained.
For training, validation, and testing purposes, the data were divided into three parts. The first part, from 18 September 2014 to 26 June 2021, was the training period. The second part, from 27 June 2021 to 8 December 2022, was the validation period for the LSTM and Bi-LSTM models. The final part, from 9 December 2022 to 23 May 2024, was the testing period. The RF model did not require the validation set, so the validation data were used for training the model instead, as shown in Figure 7.
In the third phase shown in Figure 7, the models integrated three types of machine learning algorithms for price predictions: RF, LSTM, and Bi-LSTM, which, after pre-processing, were fed and trained using the data. The trained models were evaluated using three trading strategies with the key criteria being profitability exceeding a buy-and-hold strategy, with an initial capital of USD 1000 and a commission rate of 0.5% per transaction. This research used MAE (mean absolute error), RMSE, and MAPE to assess the prediction performance of the models (Chicco et al. 2021). Table 4 outlines the descriptions of these three evaluation metrics.
Table 4.
Error evaluation metrics used in this study.
4. Experiments and Result Analysis
In this section, we will examine the outcomes achieved through the experiments and testing of the decentralized crypto trading system.
4.1. Experimental Results on Price Prediction
Three ML models, RF, LSTM, and Bi-LSTM, were tested on their ability to predict Bitcoin close price. The error evaluation results of these three ML models are presented in Table 5. It is observed that the Bi-LSTM model outperforms both the RF and Bi-LSTM models.
Table 5.
Error evaluation of RF, LSTM, and Bi-LSTM.
Figure 8 illustrates the price differences of the predicted BTC prices produced by the three models to the actual BTC price during the same testing period from 9 December 2022 to 23 May 2024. It is observed that the price predicted by the Bi-LSTM model has the smallest differences compared to the actual BTC price. Figure 8 also demonstrates a wide variability of predictions.
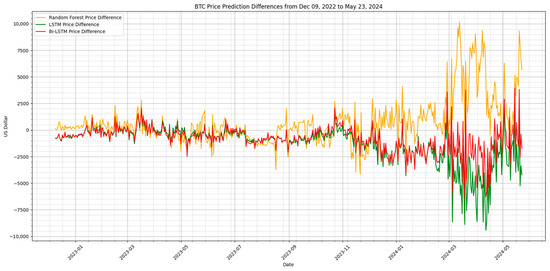
Figure 8.
Price differences between the predicted Bitcoin prices and actual Bitcoin prices.
4.2. Experimental Results on Profitability of Portfolio Management
The profitability of portfolio management using the proposed decentralized crypto trading system was evaluated with backtesting using the test data. Figure 9 shows the duration of the training, validation, and testing periods of the models. The testing period was from 9 December 2022 to 23 May 2024.
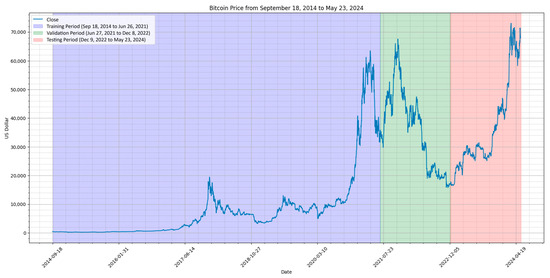
Figure 9.
Testing period for Bitcoin price prediction.
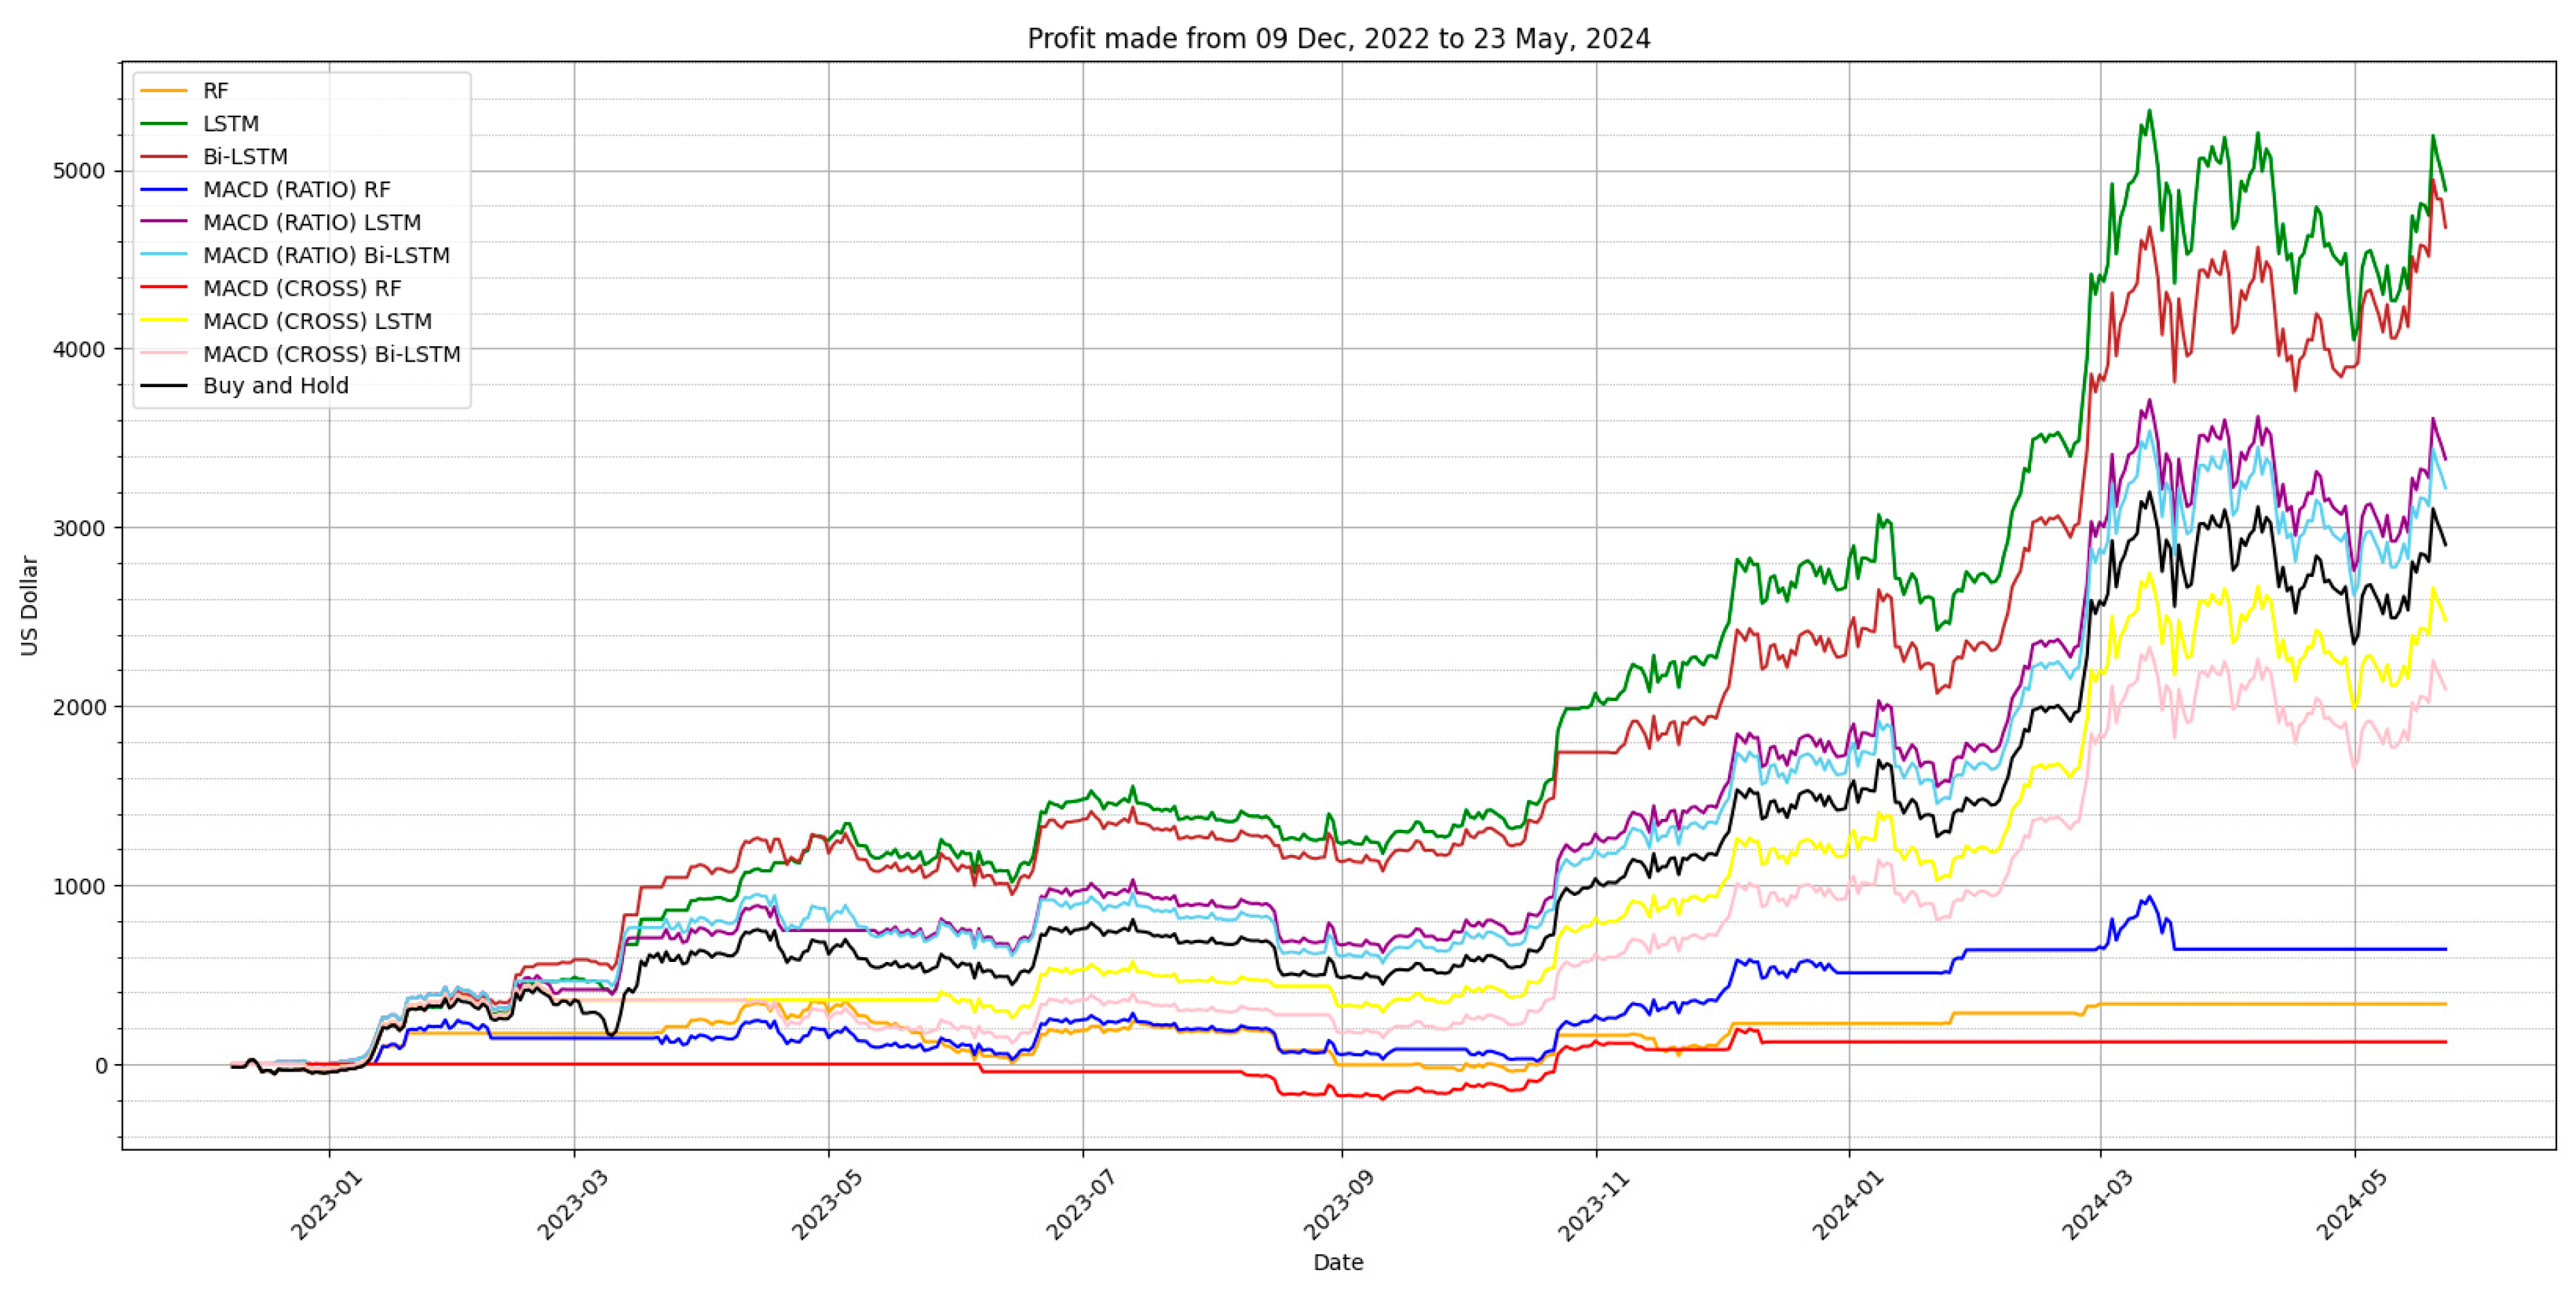
Figure 10 illustrates the profitability of portfolio management using the three trading strategies shown in Table 1 by the three ML models, in comparison to a buy-and-hold strategy during the testing period. In Figure 10, RF, LSTM, and Bi-LSTM denote these three ML models with the first trading strategy. RF, LSTM, and Bi-LSTM with MACD (CROSS) denote these three ML models with the second trading strategy. Meanwhile, RF, LSTM and Bi-LSTM with MACD (RATIO) denote these three ML models with the third trading strategy. It is observed that Bi-LSTM and LSTM significantly outperform the RF model in all three trading strategies. The Bi-LSTM and LSTM models, when using the first two trading strategies, also outperform the buy-and-hold strategy.
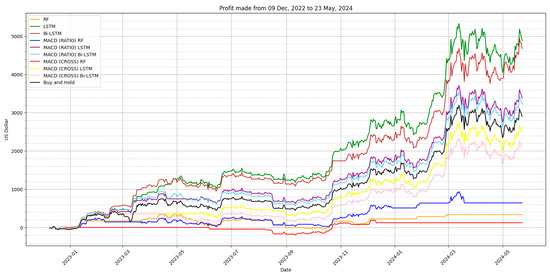
Figure 10.
Profitability of portfolio management using three trading strategies.
Table 6 showcases the monthly profits generated by each ML model and its corresponding trading strategy. The resultant profits that are in bold in the table outperform those of the buy-and-hold strategy. Both the LSTM and Bi-LSTM models, employing their three respective trading strategies, outperform the buy-and-hold strategy overall. In contrast, the RF (with the first strategy), MACD (RATIO) RF, and MACD (CROSS) strategies underperform when compared to the buy-and-hold strategy.
Table 6.
Monthly profit of three ML models vs. buy-and-hold strategy (Note: $ represents USD).
Table 7 shows the profitability metrics of portfolio management for the three ML models using the three strategies, compared to a buy-and-hold strategy. The best results of the profitability metrics are in bold in the table. The LSTM model performs best in terms of profit made and correct trading decisions. The Bi-LSTM and LSTM models show similar profitability, suggesting that substantial improvement in the error evaluation metrics is required to enhance profitability.
Table 7.
Profitability metrics of portfolio management from 9 December 2022 to 23 May 2024. (Note: $ represents USD).
The MACD (RATIO) and MACD (CROSS) strategies, i.e., the third and second trading strategies, result in lower maximum drawdown percentages. This is due to the fact that the trough value is closer to the initial capital, with the MACD (RATIO) RF strategy not falling below the initial investment. The MACD indicator also significantly reduces the total number of trades made.
As can be observed in Table 7, all the trading strategies except MACD (CROSS) RF achieve Sharpe ratios above 1 on daily returns, with the RF model having the highest Sharpe ratio at 1.58. The MACD (RATIO) RF strategy achieves the highest Sharpe ratio, which is likely due to the low maximum drawdown ratio. This means most of the trading strategies generated better returns compared to the 0.223% daily risk-free rate based on the S&P 500 index, as used in the Sharpe ratio formula.
4.3. Result Comparisons with Prior Work
The result comparisons with prior work should be taken as an indicator rather than a direct comparison, due to differences in the datasets such as the features used, data timeframe, and size of the data. However, benchmarking the results against prior works can still provide valuable context for assessing the performance made by the proposed decentralized crypto trading system.
Table 8 and Table 9 summarize the comparative error and performance metrics across all three ML models and three trading strategies evaluated in this research. The best results of performance metrics achieved are in bold in both tables. It is observed that the LSTM model in the proposed system obtained the highest ROI and the win trade ratio. There is still room for improvement regarding accuracy for the models in this research. Most of the models from prior works have lower RMSE, MAE, and MAPE scores. The Bi-LSTM model in the proposed system has a lower MAPE score compared to prior work. The high profitability generated by the LSTM model in the proposed system meets the goal of finding a viable model for the decentralized crypto trading system, despite potential for further accuracy enhancements.
Table 8.
Comparison of Bitcoin price prediction performance metrics with prior works.
Table 9.
Comparison of Bitcoin trading performance metrics with past studies.
4.4. Discussions
In the current centralized financial industry, investors have to engage centralized intermediaries such as brokers or bankers to invest in traditional financial instruments, e.g., stocks, equity, bonds, etc. Investors could also engage in centralized cryptocurrency exchanges for trading cryptocurrency assets. Commission fees are one of the revenue sources of the centralized intermediaries. From a longer-term perspective, the acceptance and popularity of decentralized trading systems may attract investors and users. It may potentially impact on the revenues of the centralized financial industry.
As there are no central custodial intermediaries to protect the funds and purchased tokens of investors using the proposed decentralized crypto trading system, it is important to equip necessary security measures. A frontend web application is needed for users’ authentication and management of their own funds, in parallel with the backend software modules, such as portfolio contracts on the blockchain architecture, oracles, and machine learning models. The web application is hosted to allow investors to access the investment services with their web browsers. Users have the option to use their self-custodian wallets, such as MetaMask, or login via social media accounts using Web3Auth. Through the frontend web application, users can deploy their own portfolio contracts onto the blockchain. Users are allowed to customize the nonce of transactions to override previous pending transactions. Users can efficiently manage the portfolio contracts that they have deployed with the web application. Users have the flexibility to withdraw funds that they have deposited or add additional funds to the portfolio. All the activities can be performed by users without having to go through any intermediary parties. But one of the challenges is that there a certain learning curve is necessary for ordinary investors to understand blockchain smart contracts, operations, and configurations. Another challenge is the sustainability issues related to operating a decentralized trading system. For decentralized trading transactions, consensus mechanisms in blockchain systems need a certain number of miners and computational mining processes. This results in high energy consumption and carbon footprint, which negatively impacts the environment.
Despite various obvious advantages, decentralized cryptocurrency trading systems encounter challenges related to compliance with financial regulations, similarly to DeFi. Smart contracts and blockchain technology operate differently from traditional legal contracts, where it is difficult for the existing legal systems in most countries to regulate integrity, mitigate risks, protect the benefits of investors, etc. (Harvey and Rabetti 2024). Other potential regulation challenges include the prevention of money laundering (Benson et al. 2024) or financial crimes (Wronka 2023), etc.
The level of financial inclusion in some countries or groups has room for improvement. For example, some people do not even own bank accounts in the traditional financial industry (Demirgüç-Kunt et al. 2018). The usage of cryptocurrencies could impact the level of financial inclusion, as some people who were less included in the traditional financial industry could be connected without traditional financial intermediaries (El Hajj and Farran 2024). Some minority groups may experience some barriers to entry or inequity in traditional financial markets, while a higher level of financial inclusion would become possible in a decentralized cryptocurrency market (Pantin 2023). Cryptocurrencies and DeFi have positive influences on perceived economic empowerment, which subsequently leads to greater financial inclusion (Gupta 2022). The impact on financial inclusion caused by the adoption of cryptocurrency has been studied in developing economies, where it is observed that there is potential transformative change in financial inclusion brought by cryptocurrencies and DeFi (El Hajj and Farran 2024). Decentralized cryptocurrency trading systems enable investors to perform buy/sell tokens conveniently with each other directly, which provides a higher level of financial inclusion to larger user groups.
5. Conclusions
This research demonstrates the feasibility of creating a decentralized trading system using a public blockchain. The proposed decentralized crypto trading system allows users to maintain complete control over their funds without intermediaries, offering significant cost savings, transparent portfolio management, and a trust-free platform for investors and traders. Notably, the LSTM model achieved over 488% returns in the portfolio management from 9 December 2022 to 23 May 2024, after deducting trading commission fees, despite having room for improvement in prediction accuracy.
The research successfully developed a decentralized crypto trading system that leverages machine learning models to predict Bitcoin prices and execute trades on a public blockchain using three trading strategies. Three ML models, including RF, LSTM, and Bi-LSTM, were adopted and evaluated. Among these, the LSTM model showed the highest profitability in the portfolio management, achieving a return on investment (ROI) of 488.74%. Smart contracts were deployed on the Arbitrum L2 mainnet, and a custom oracle was developed to integrate price predictions into the trading system. Additionally, a web application was created to provide users with easy access to the service, supporting both self-custodian wallets and social media logins via Web3Auth.
In terms of the accuracy performance, the Bi-LSTM model outperformed the other models created in this research, with an RMSE of 1500.82, MAE of 1074.49, and MAPE of 0.0280. With an initial capital of USD 1000 and a commission rate of 0.5% per transaction, the LSTM model generated a total profit of USD 4887.47, significantly higher than the buy-and-hold strategy’s profit of USD 2346.82. All strategies except for MACD (CROSS) RF achieved Sharpe ratios above 1, with the RF model having the highest ratio at 1.587.
Current Limitations and Future Works
Despite these successes, there are areas for improvement. The LSTM model, while profitable, has room for enhancement in prediction accuracy. Future work could explore other advanced models or hybrid approaches to boost accuracy.
The decentralized crypto trading system is not fully decentralized due to the use of a custom oracle and centralized services like a database. Future efforts could focus on integrating decentralized oracle services like Chainlink to achieve greater decentralization (Zheng et al. 2023). Additionally, while the use of Web3Auth for social media logins improves user experience, it compromises decentralization. Exploring more decentralized authentication methods that still offer ease of use could be beneficial. Scalability is another area to address. Testing and improving the system’s ability to handle a larger number of users and transactions efficiently will be crucial.
Author Contributions
Conceptualization, Z.Z.L., Y.C. and Q.C.; methodology, Z.Z.L. and Q.C.; software, Z.Z.L.; validation, Z.Z.L.; formal analysis, Z.Z.L.; investigation, Z.Z.L. and R.C.B.C.; resources, Z.Z.L. and Q.C.; data curation, Z.Z.L.; writing—original draft preparation, Z.Z.L.; writing—review and editing, C.K.S. and Q.C.; visualization, Z.Z.L.; supervision, Q.C.; project administration, Z.Z.L. All authors have read and agreed to the published version of the manuscript.
Funding
This research received no external funding.
Data Availability Statement
Dataset available upon request from the authors.
Conflicts of Interest
The authors declare no conflicts of interest.
References
- Adams, Austin, Xin Wan, and Noah Zinsmeister. 2023. UNISWAP v3 TWAP Oracles in Proof of Stake. Uniswap Protocol. Available online: https://blog.uniswap.org/uniswap-v3-oracles (accessed on 23 November 2023).
- Aivaz, Kamer-Ainur, Ionela Florea Munteanu, and Flavius Valentin Jakubowicz. 2023. Bitcoin in Conventional Markets: A Study on Blockchain-Induced Reliability, Investment Slopes, Financial and Accounting Aspects. Mathematics 11: 4508. [Google Scholar] [CrossRef]
- Akila, V., M. V. S. Nitin, I. Prasanth, Sandeep Reddy, and Akash Kumar. 2023. A Cryptocurrency Price Prediction Model using Deep Learning. Paper presented at the 4th International Conference on Design and Manufacturing Aspects for Sustainable Energy, Hyderabad, India, May 19–20. [Google Scholar]
- Alamsyah, Andry, Gede Natha Wijaya Kusuma, and Dian Puteri Ramadhani. 2024. A Review on Decentralized Finance Ecosystems. Future Internet 16: 76. [Google Scholar] [CrossRef]
- Ammous, Saifedean. 2016. Blockchain Technology: What Is It Good for? Preprint Available at SSRN. Available online: https://www.ssrn.com/abstract=2832751 (accessed on 10 November 2023).
- Andrei, Alexandru Gabriel. 2024. Hybrid Smart Contracts with Decentralized Oracles. Romanian Cyber Security Journal 1: 6. [Google Scholar] [CrossRef]
- Basher, Syed Abul, and Perry Sadorsky. 2022. Forecasting Bitcoin price direction with random forests: How important are interest rates, inflation, and market volatility? Machine Learning with Applications 9: 100355. [Google Scholar] [CrossRef]
- Benetti, Zeno, and Federico Piazza. 2023. Decentralised Finance: A categorisation of smart contracts. ESMA TRV Risk Analysis. Available online: https://www.esma.europa.eu/sites/default/files/2023-10/ESMA50-2085271018-3351_TRV_Article_Decentralised_Finance_A_Categorisation_of_Smart_Contracts.pdf (accessed on 7 January 2025).
- Benson, Vladlena, Umut Turksen, and Bogdan Adamyk. 2024. Dark side of decentralised finance: A call for enhanced AML regulation based on use cases of illicit activities. Journal of Financial Regulation and Compliance 32: 80–97. [Google Scholar] [CrossRef]
- Breidenbach, Lorenz, Christian Cachin, Benedict Chan, Alex Coventry, Steve Ellis, Ari Juels, Brendan Magauran, Sergey Nazarov, Alexandru Topliceanu, and Fan Zhang. 2021. Chainlink 2.0: Next Steps in the Evolution of Decentralised Oracle Networks. White Paper, vol. 1. Available online: https://research.chain.link/whitepaper-v2.pdf (accessed on 20 March 2024).
- Chatterjee, Indranath, Swapnajit Chakraborti, and Tanya Tono. 2024. Comparative study of bitcoin price prediction during pre-Covid19 and whilst-Covid19 period using time series and machine learning models. Discover Analytics 2: 19. [Google Scholar] [CrossRef]
- Chen, Junwei. 2023. Analysis of bitcoin price prediction using machine learning. Journal of Risk and Financial Management 16: 51. [Google Scholar] [CrossRef]
- Chen, Sheng, Qi Cao, and Yiyu Cai. 2023. Blockchain for Healthcare Games Management. Electronics 12: 3195. [Google Scholar] [CrossRef]
- Chicco, Davide, Matthijs J. Warrens, and Giuseppe Jurman. 2021. The coefficient of determination R-squared is more informative than smape, Mae, MAPE, MSE and RMSE in regression analysis evaluation. PeerJ Computer Science 7: e623. [Google Scholar] [CrossRef]
- CoinGecho.com. 2025. Global Cryptocurrency Market Cap Charts. Available online: https://www.coingecko.com/en/global-charts (accessed on 8 January 2025).
- Conlon, Thomas, Shaen Corbet, and Yang Hu. 2022. The Collapse of FTX: The End of Cryptocurrency’s Age of Innocence. The British Accounting Review, 101277. [Google Scholar] [CrossRef]
- De Mariz, Frederic. 2022. Cryptocurrencies: A Natural Evolution for Payments? In Finance with a Purpose: FinTech, Development and Financial Inclusion in the Global Economy. Singapore: World Scientific Publishing, pp. 111–26. [Google Scholar]
- Demirgüç-Kunt, Asli, Leora Klapper, Dorothe Singer, Saniya Ansar, and Jake Hess. 2018. The Global Findex Database 2017: Measuring Financial Inclusion and the Fintech Revolution. Washington, DC: World Bank Group. Available online: http://hdl.handle.net/10986/29510 (accessed on 7 January 2025).
- Di Pierro, Massimo. 2017. What Is the Blockchain? Computing in Science & Engineering 19: 92–95. [Google Scholar] [CrossRef]
- Dumiter, Florin Cornel, Florin Turcaș, Ștefania Amalia Nicoară, Cristian Bențe, and Marius Boiță. 2023. The Impact of Sentiment Indices on the Stock Exchange—The Connections between Quantitative Sentiment Indicators, Technical Analysis, and Stock Market. Mathematics 11: 3128. [Google Scholar] [CrossRef]
- El Hajj, Mohammad, and Imad Farran. 2024. The Cryptocurrencies in Emerging Markets: Enhancing Financial Inclusion and Economic Empowerment. Journal of Risk and Financial Management 17: 467. [Google Scholar] [CrossRef]
- Ferdiansyah, Ferdiansyah, Siti Hajar Othman, Raja Zahilah Raja Md Radzi, Deris Stiawan, Yoppy Sazaki, and Usman Ependi. 2019. A LSTM-Method for Bitcoin Price Prediction: A Case Study Yahoo Finance Stock Market. Paper presented at the 2019 International Conference on Electrical Engineering and Computer Science (ICECOS), Batam, Indonesia, October 2–3; pp. 206–10. [Google Scholar] [CrossRef]
- Goodell, John W., Sami Ben Jabeur, Foued Saâdaoui, and Muhammad Ali Nasir. 2023. Explainable artificial intelligence modeling to forecast bitcoin prices. International Review of Financial Analysis 88: 102702. [Google Scholar] [CrossRef]
- Gupta, Anuradha. 2022. Decentralized Finance: A Potential Paradigm Shift for Financial Inclusion and Economic Empowerment. International Journal of Finance and Management Research 4: 15509. [Google Scholar] [CrossRef]
- Hafid, Abdelatif, Abdelhakim Senhaji Hafid, and Mustapha Samih. 2020. Scaling Blockchains: A Comprehensive Survey. IEEE Access 8: 125244–62. [Google Scholar] [CrossRef]
- Haq, Inzamam Ul, Paulo Ferreira, Derick David Quintino, Nhan Huynh, and Saowanee Samantreeporn. 2023. Samantreeporn. Economic Policy Uncertainty, Energy and Sustainable Cryptocurrencies: Investigating Dynamic Connectedness during the COVID-19 Pandemic. Economies 11: 76. [Google Scholar] [CrossRef]
- Harvey, Campbell R., and Daniel Rabetti. 2024. International business and decentralized finance. International Business and Decentralized Finance 55: 840–63. [Google Scholar] [CrossRef]
- Hassan, Ammar, Imran Makhdoom, Waseem Iqbal, Awais Ahmad, and Asad Raza. 2023. From trust to truth: Advancements in mitigating the Blockchain Oracle problem. Journal of Network and Computer Applications 217: 103672. [Google Scholar] [CrossRef]
- Heiss, Jonathan, Jacob Eberhardt, and Stefan Tai. 2019. From oracles to trustworthy data on-chaining systems. Paper presented at the 2019 IEEE International Conference on Blockchain (Blockchain), Atlanta, GA, USA, July 14–17. [Google Scholar]
- Irresberger, Felix, Kose John, Peter Mueller, and Fahad Saleh. 2020. The public blockchain ecosystem: An empirical analysis. Preprint Available at SSRN. Available online: https://www.ssrn.com/abstract=3592849 (accessed on 10 November 2023).
- John, David L., Sebastian Binnewies, and Bela Stantic. 2024. Cryptocurrency Price Prediction Algorithms: A Survey and Future Directions. Forecasting 6: 637–71. [Google Scholar] [CrossRef]
- John, Kose, Leonid Kogan, and Fahad Saleh. 2023. Smart Contracts and Decentralized Finance. Annual Review of Financial Economics 15: 523–42. [Google Scholar] [CrossRef]
- Kang, Chuen Yik, Chin Poo Lee, and Kian Ming Lim. 2022. Cryptocurrency price prediction with convolutional neural network and stacked gated recurrent unit. Data 7: 149. [Google Scholar] [CrossRef]
- Kayani, Umar, and Fakhrul Hasan. 2024. Unveiling Cryptocurrency Impact on Financial Markets and Traditional Banking Systems: Lessons for Sustainable Blockchain and Interdisciplinary Collaborations. Journal of Risk and Financial Management 17: 58. [Google Scholar] [CrossRef]
- Khan, Shafaq Naheed, Faiza Loukil, Chirine Ghedira-Guegan, Elhadj Benkhelifa, and Anoud Bani-Hani. 2021. Blockchain Smart Contracts: Applications, challenges, and future trends. Peer-to-Peer Networking and Applications 14: 2901–25. [Google Scholar] [CrossRef]
- Kumar, Anoop S., and Suvvari Anandarao. 2019. Volatility spillover in crypto-currency markets: Some evidences from GARCH and wavelet analysis. Physica A: Statistical Mechanics and Its Applications 524: 448–58. [Google Scholar] [CrossRef]
- Li, Zongwei, Wenkai Li, Xiaoqi Li, and Yuqing Zhang. 2024. Guardians of the Ledger: Protecting Decentralized Exchanges from State Derailment Defects. IEEE Transactions on Reliability, 1–13. [Google Scholar] [CrossRef]
- Lu, Houhan. 2022. Bitcoin Trading using LSTM. Paper presented at the 2nd International Conference on Business Administration and Data Science, Shanghai, China, December 22–23; pp. 1457–71. [Google Scholar] [CrossRef]
- Lys, Léonard, and Maria Potop-Butucaru. 2022. Distributed Blockchain Price Oracle. Paper presented at the 10th International Conference on Networked Systems, Virtual Event, May 17–19; pp. 37–51. [Google Scholar] [CrossRef]
- Manoj, T., Krishnamoorthi Makkithaya, V. G. Narendra, and T. V. Murari. 2024. Blockchain Oracles for Decentralized Agricultural Insurance Using Trusted IoT Data. Frontier Blockchain 7: 1481339. [Google Scholar] [CrossRef]
- Mohan, C. 2019. State of public and private blockchains. Paper presented at the 2019 International Conference on Management of Data, Amsterdam, The Netherlands, June 30–July 5. [Google Scholar]
- Nagula, Pavan Kumar, and Christos Alexakis. 2022. A new hybrid machine learning model for predicting the bitcoin (BTC-USD) price. Journal of Behavioral and Experimental Finance 36: 100741. [Google Scholar] [CrossRef]
- Nakamoto, Satoshi. 2008. Bitcoin: A Peer-to-Peer Electronic Cash System. Available online: https://bitcoin.org/bitcoin.pdf (accessed on 10 November 2023).
- Omole, Oluwadamilare, and David Enke. 2024. Deep learning for Bitcoin price direction prediction: Models and trading strategies empirically compared. Financial Innovation 10: 117. [Google Scholar] [CrossRef]
- Otabek, Sattarov, and Jaeyoung Choi. 2024. Multi-level deep Q-networks for Bitcoin trading strategies. Scientific Reports 14: 771. [Google Scholar] [CrossRef] [PubMed]
- Pantin, Lynnise E. 2023. Financial Inclusion, Cryptocurrency, and Afrofuturism. 118 NW. U. L. REV. 621. Available online: https://scholarship.law.columbia.edu/faculty_scholarship/4183 (accessed on 7 January 2025).
- Parente, Mimmo, Luca Rizzuti, and Mario Trerotola. 2024. A profitable trading algorithm for cryptocurrencies using a neural network model. Expert Systems with Applications 238: 121806. [Google Scholar] [CrossRef]
- Parvini, Navid, Mahsa Abdollahi, Sattar Seifollahi, and Davood Ahmadian. 2022. Forecasting Bitcoin returns with long short-term memory networks and wavelet decomposition: A comparison of several market determinants. Applied Soft Computing, 121, 108707. [Google Scholar] [CrossRef]
- Pasdar, Amirmohammad, Young Choon Lee, and Zhongli Dong. 2023. Connect API with Blockchain: A survey on Blockchain Oracle Implementation. ACM Computing Surveys 55: 1–39. [Google Scholar] [CrossRef]
- Pines, Matthew, and David Zell. 2023. Proof of Reserves: A Report on Mitigating Crypto Custody Risk. Available online: https://www.btcpolicy.org/articles/proof-of-reserves-a-report-on-mitigating-crypto-custody-risk (accessed on 10 November 2023).
- Rehman, Muhammad Habibu, Khaled Salah, Ernesto Damiani, and Davor Svetinovic. 2020. Trust in Blockchain Cryptocurrency Ecosystem. IEEE Transactions on Engineering Management 67: 1196–212. [Google Scholar] [CrossRef]
- Seabe, Phumudzo Lloyd, Claude Rodrigue Bambe Moutsinga, and Edson Pindza. 2023. Forecasting cryptocurrency prices using LSTM, GRU, and bi-directional LSTM: A deep learning approach. Fractal and Fractional 7: 203. [Google Scholar] [CrossRef]
- Sebastião, Helder, and Pedro Godinho. 2021. Forecasting and trading cryptocurrencies with machine learning under changing market conditions. Financial Innovation 7: 1. [Google Scholar] [CrossRef] [PubMed]
- Sguanci, Cosimo, Roberto Spatafora, and Andrea Mario Vergani. 2021. Layer 2 Blockchain Scaling: A Survey. arXiv arXiv:2107.10881. [Google Scholar]
- Shah, Kaushal, Dhruvil Lathiya, Naimish Lukhi, Keyur Parmar, and Harshal Sanghvi. 2023. A systematic review of decentralized finance protocols. International Journal of Intelligent Networks 4: 171–81. [Google Scholar] [CrossRef]
- Smutny, Zdenek, Zdenek Sulc, and Jan Lansky. 2021. Motivations, Barriers and Risk-Taking When Investing in Cryptocurrencies. Mathematics 9: 1655. [Google Scholar] [CrossRef]
- Statista.com. 2024a. Number of Cryptocurrencies Worldwide from 2013 to December 2024. Available online: https://www.statista.com/statistics/863917/number-crypto-coins-tokens/ (accessed on 11 December 2024).
- Statista.com. 2024b. Overall Cryptocurrency Market Capitalization Per Week from July 2010 to December 2024. Available online: https://www.statista.com/statistics/730876/cryptocurrency-maket-value/ (accessed on 11 December 2024).
- Syed, Sibtain, Arshad Iqbal, Waqar Mehmood, Zain Syed, Maqbool Khan, and Giovanni Pau. 2023. Split-Second Cryptocurrency Forecast Using Prognostic Deep Learning Algorithms: Data Curation by Deephaven. IEEE Access 11: 128644–54. [Google Scholar] [CrossRef]
- Tabash, Mosab I., Neenu Chalissery, T. Mohamed Nishad, and Mujeeb Saif Mohsen Al-Absy. 2024. Market Shocks and Stock Volatility: Evidence from Emerging and Developed Markets. International Journal of Financial Studies 12: 2. [Google Scholar] [CrossRef]
- Taherdoost, Hamed. 2023. Smart Contracts in Blockchain Technology: A Critical Review. Information 14: 117. [Google Scholar] [CrossRef]
- The WFE Statistics Team. 2024. Market Statistics—December 2024. Available online: https://focus.world-exchanges.org/issue/december-2024/market-statistics (accessed on 7 January 2025).
- TLSNotary. n.d. TLSNotary: A Mechanism for Independently Audited HTTPS Sessions. TLSNotary. 1. Available online: https://tlsnotary.org/TLSNotary.pdf (accessed on 22 November 2023).
- Tripathi, Bhaskar, and Rakesh Kumar Sharma. 2022. Modeling bitcoin prices using signal processing methods, bayesian optimization, and Deep Neural Networks. Computational Economics 62: 1919–45. [Google Scholar] [CrossRef]
- Vancea, Diane Paula Corina, Kamer Ainur Aivaz, and Cristina Duhnea. 2017. Political Uncertainty and Volatility on the Financial Markets—the Case of Romania. Transformations in Business and Economics 16: 2A. [Google Scholar]
- Wagner, Michel, Nicolai Krüger, Markus Kleffmann, and Frank Teuteberg. 2024. Decentralized Finance: Development of A Taxonomy to Support Regulatory Measures. IU Discussion Papers—IT & Engineering. Available online: https://www.econstor.eu/bitstream/10419/300862/1/1898217947.pdf (accessed on 13 January 2025).
- Wang, Haiyao, Jianxuan Wang, Lihui Cao, Yifan Li, Qiuhong Sun, and Jingyang Wang. 2021. A Stock Closing Price Prediction Model Based on CNN-BiSLSTM. Complexity 2021: 5360828. [Google Scholar] [CrossRef]
- Wątorek, Marcin, Jarosław Kwapień, and Stanisław Drożdż. 2023. Cryptocurrencies Are Becoming Part of the World Global Financial Market. Entropy 25: 377. [Google Scholar] [CrossRef]
- Wronka, Christoph. 2023. Financial crime in the decentralized finance ecosystem: New challenges for compliance. Journal of Financial Crime 30: 97–113. [Google Scholar] [CrossRef]
- Wu, Jingyang, Xinyi Zhang, Fangyixuan Huang, Haochen Zhou, and Rohtiash Chandra. 2024. Review of deep learning models for crypto price prediction: Implementation and evaluation. arXiv arXiv:2405.08089v1. [Google Scholar]
- Zhao, Haidong, and Lini Zhang. 2021. Financial Literacy or investment experience: Which is more influential in cryptocurrency investment? International Journal of Bank Marketing 39: 1208–26. [Google Scholar] [CrossRef]
- Zheng, Peilin, Zigui Jiang, Jiajing Wu, and Zibin Zheng. 2023. Blockchain-Based Decentralised Application: A Survey. IEEE Open Journal of the Computer Society 4: 121–33. [Google Scholar] [CrossRef]


Disclaimer/Publisher’s Note: The statements, opinions and data contained in all publications are solely those of the individual author(s) and contributor(s) and not of MDPI and/or the editor(s). MDPI and/or the editor(s) disclaim responsibility for any injury to people or property resulting from any ideas, methods, instructions or products referred to in the content. |
© 2025 by the authors. Licensee MDPI, Basel, Switzerland. This article is an open access article distributed under the terms and conditions of the Creative Commons Attribution (CC BY) license (https://creativecommons.org/licenses/by/4.0/).