3.2. Results
By applying the right-tailed unit root test described in
Section 2.1, we found evidence of bubbles in all the five cryptocurrencies.
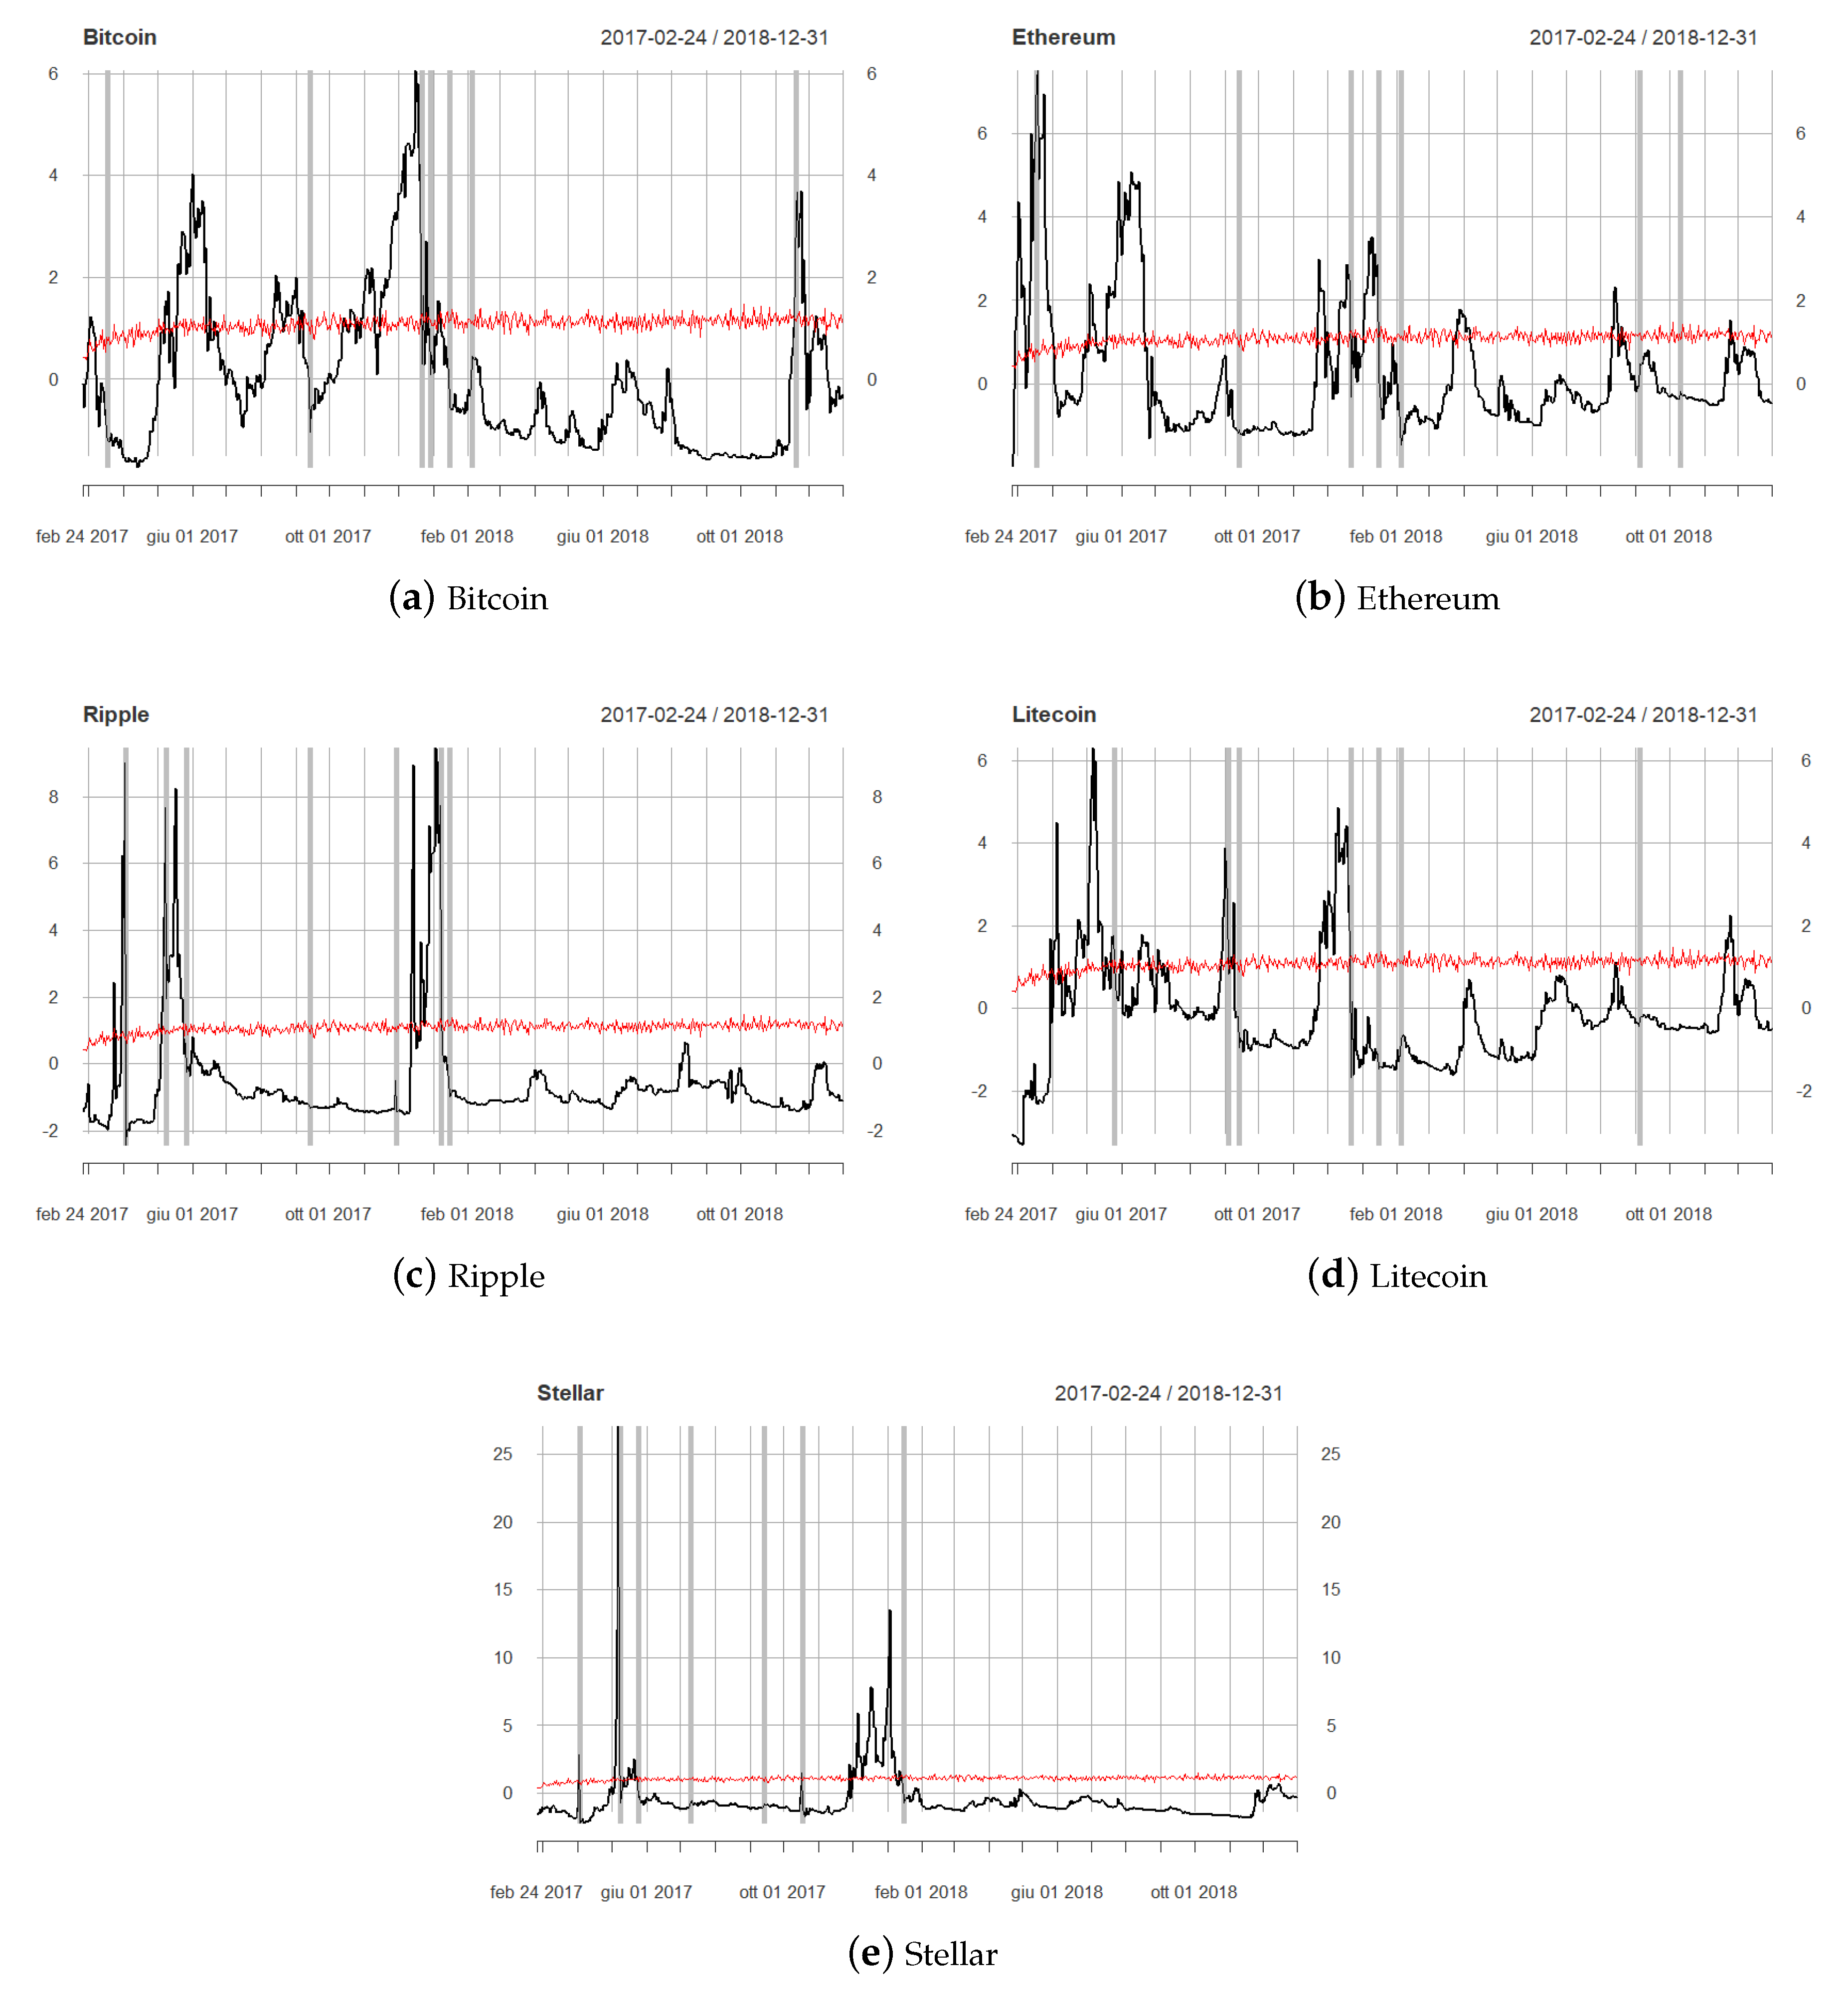
Figure 2 plots the time series of the BSADF statistic and the corresponding critical values
3.
It can be seen that in several cases the null hypothesis of unit root was rejected in favor of the alternative of explosive behavior. In particular, the middle and the end of 2017 and early 2018 were the three sub-periods characterized by the strongest evidence of bubbles.
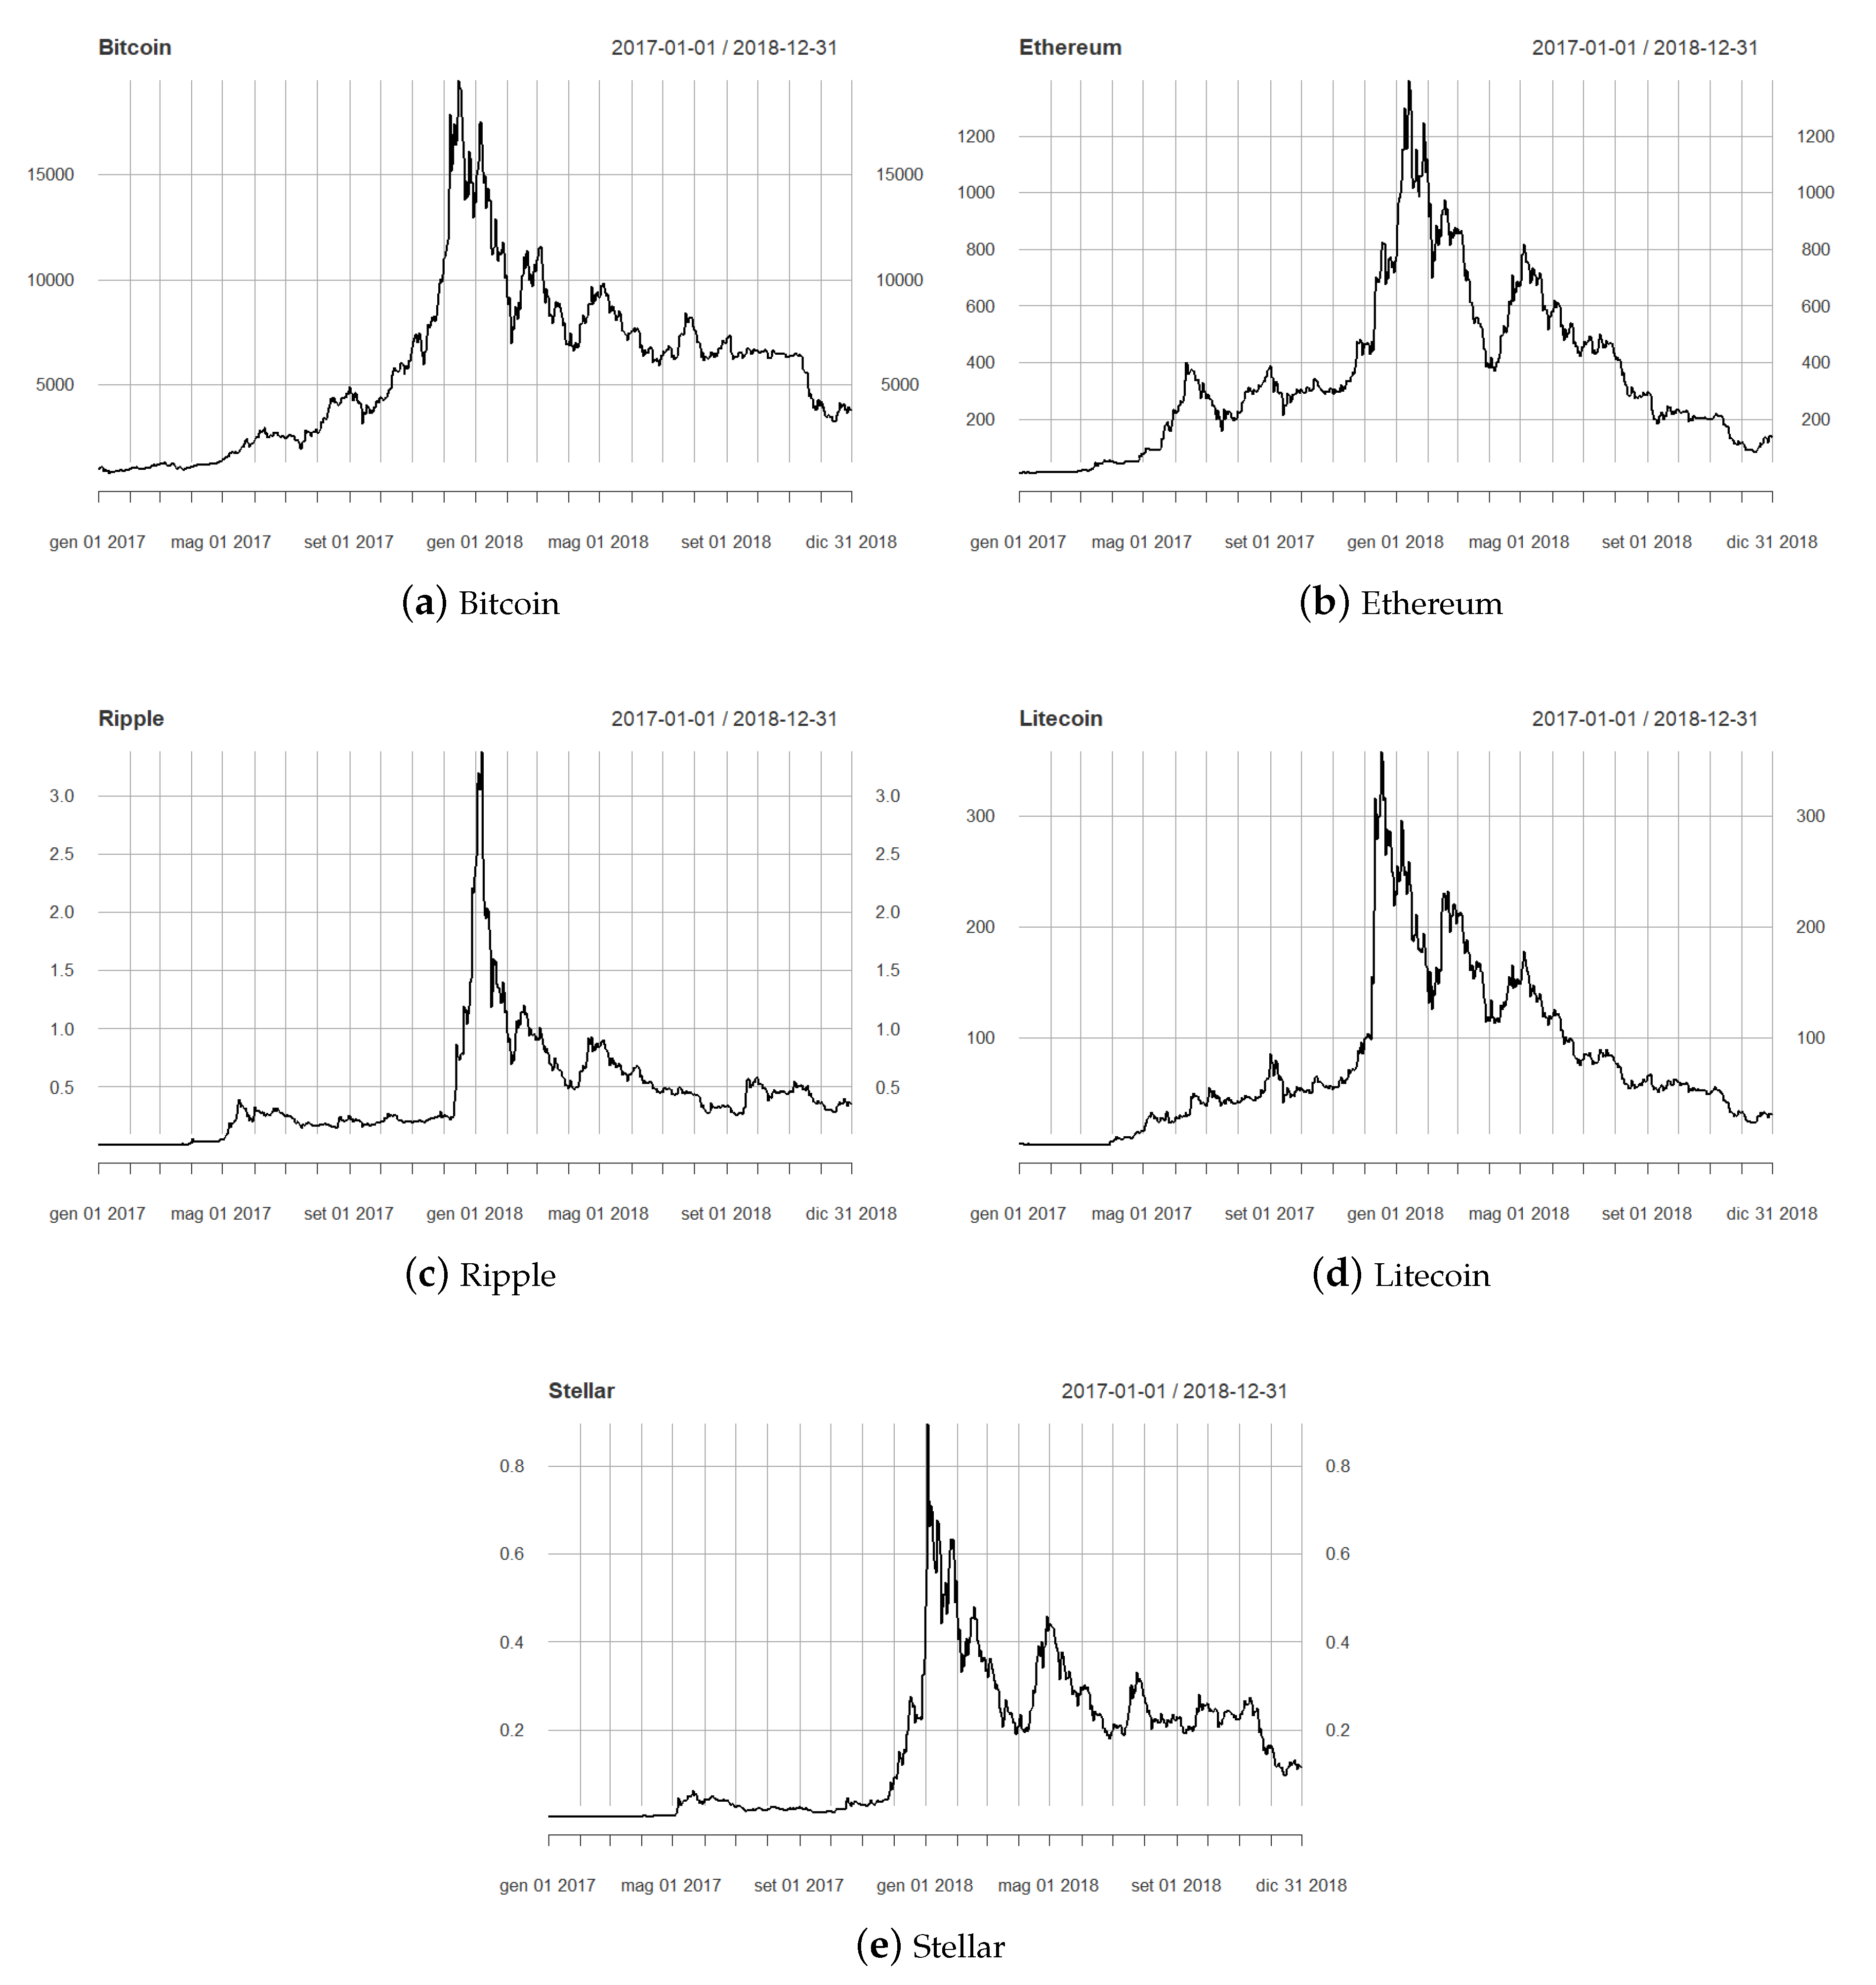
Specifically, during the considered time period, Ethereum and Ripple were the first to show explosivity in March 2017, while later in the year, from April to June, all the five cryptoassets showed explosive dynamics. The creation of the Enterprise Ethereum Alliance (EEA) in March 2017, announced by blockchain startups, research labs and global companies, is one of the factors that can explain this trend. Furthermore, since the beginning of 2017, the total amount raised by ICOs passed $300 million, which means an increase of nearly 200% in less than six months. Many ICOs initiatives are based on the Ethereum Blockchain due to its smart contracts capabilities, and this contributed to the large growth of Ethereum price. Bitcoin explosivity emerged again in August and September 2017, when bubble episodes also appeared in Litecoin. This period coincides with the hard fork of Bitcoin, which forked into two derivative digital currencies, the Bitcoin chain (BTC) and the Bitcoin Cash (BCH). Another bubble phase emerged in Bitcoin in late October toward the end of December 2017. In particular, the Bitcoin price reached the level of $10,000 on 28 November 2017, and $20,000 on 17 December 2017. In the last quarter of 2017, also the other cryptoassets showed explosivity. A lower number of bubble episodes was observed in the following year, 2018, which started with a sharp drop of prices in the cryptocurrency market. An explosive behavior of Ethereum, apparently not followed by the other cryptoassets, can be noticed between August and September. A sharp peak in the price of Ethereum was indeed observed on 13 September 2018, with a daily return close to 14%. Bitcoin came back to an explosive phase in December 2018, with a rapid growth which followed the negative performance of the first half of the month. Litecoin also showed a short bubble period at the end of 2018, rapidly recovering from the drop in price observed in the first part of December.
It can also be noticed that, for all the five cryptocurrencies, the most extreme negative returns (gray lines in
Figure 2) took place right after the end of the detected bubble periods, encouraging the study of the explosive price dynamics in order to mitigate market risk. In particular, all the cryptocurrencies showed multiple extreme losses at the beginning of 2018, after the end of the bubble period occurred in late 2017, except for Stellar, for which only one tail return was observed in January 2018. Highly negative returns of Stellar, as well as Ripple and Litecoin, can instead be seen in May and June 2017, following the bubble periods that occurred in March and April 2017. Other severe losses in all the cryptocurrencies followed the bubble period of August–September 2017, probably triggered by the fork of Bitcoin.
Table 1 reports the count of days per quarter in which the BSADF statistic overcomes the critical value, supporting evidence of an explosive price behavior, for each cryptocurrency. In general, the second and the fourth quarter of 2017 were the periods characterized by the largest number of bubble episodes in the cryptocurrency market. It can be noticed that, among the considered cryptoassets, Bitcoin is the one showing the highest number of explosivity days (136), closely followed by Ethereum (131). However, the distribution of bubble episodes of the two assets over the period was not so similar: for Bitcoin, the last quarter of 2017 was the sub-period showing the highest number of explosivity days, which was instead the second quarter of the same year for Ethereum. The latter shows a quite large number of explosivity days (31) in the first quarter of 2017, when only six bubble episodes were identified in the Bitcoin dynamics. During the 2017–2018 period, 96 bubble times were reported for Litecoin, with a high concentration in the second quarter of 2017. Over the 49 explosivity days of Ripple, 22 were observed in the second quarter of 2017, while the last quarter of 2017 was the period showing the highest number of explosivity episodes in the price dynamics of Stellar.
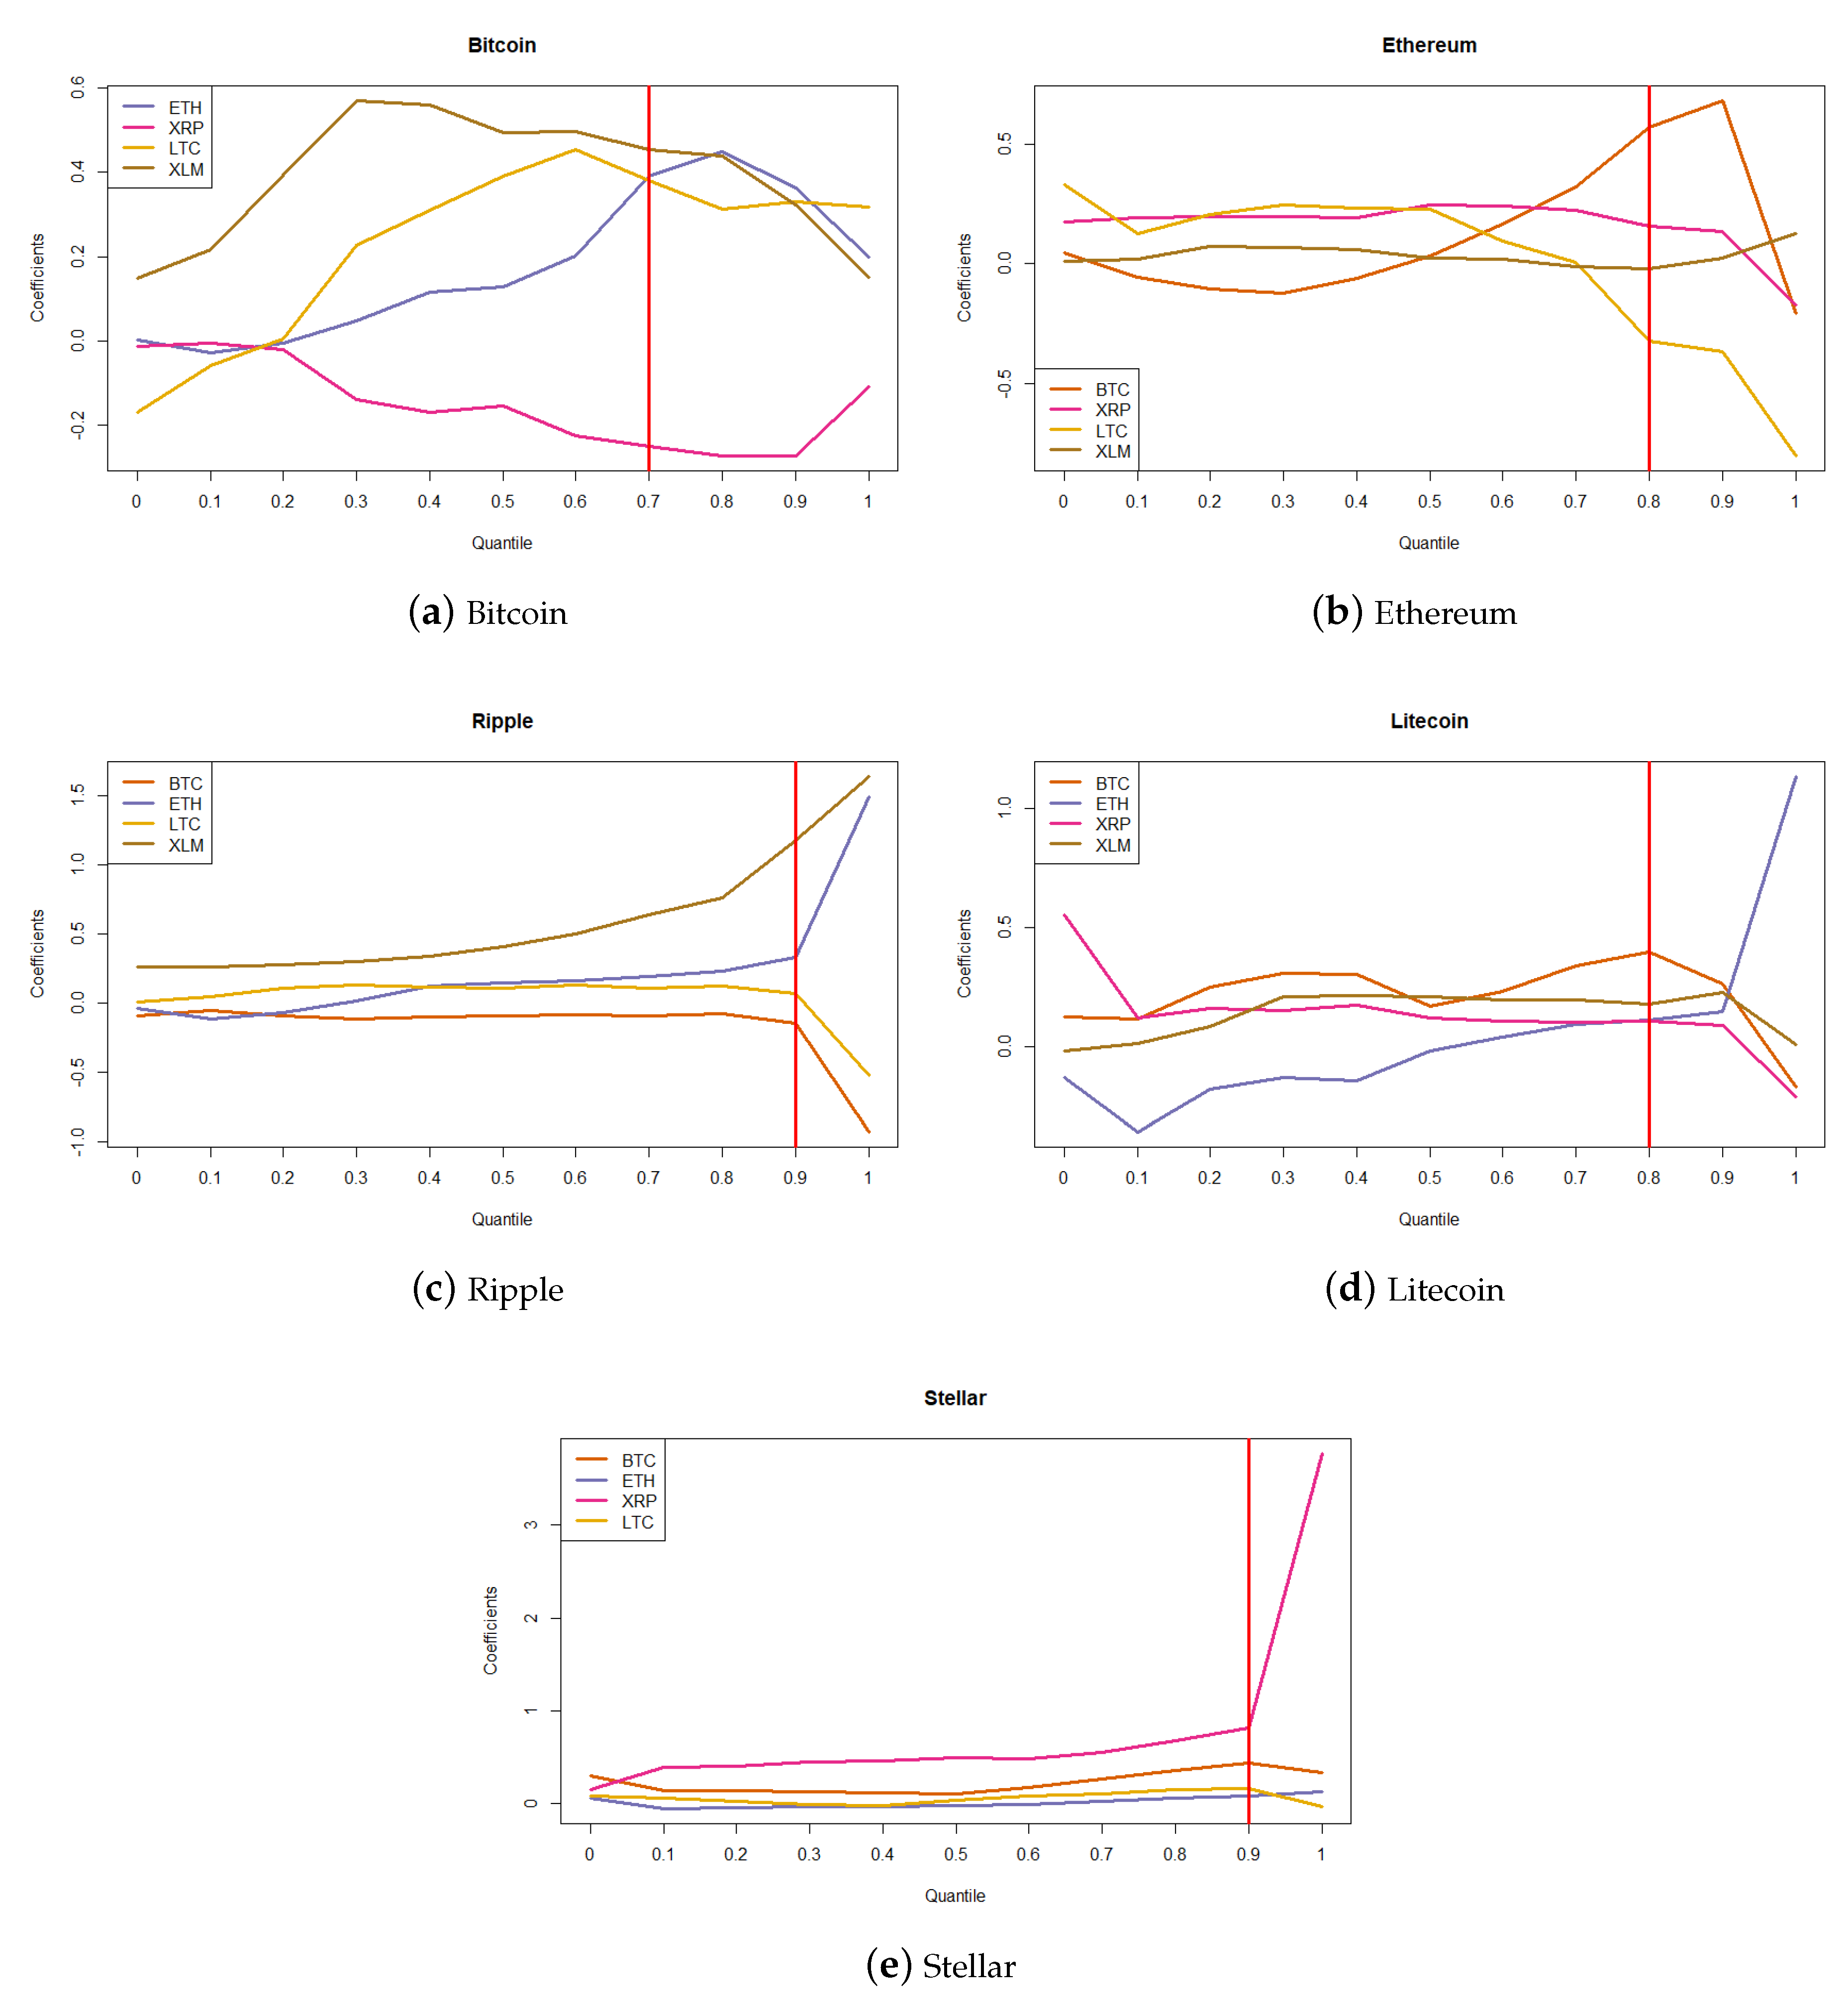
Figure 3 plots the estimated
coefficients of the quantile model (seen in Equation (
7)) for each cryptocurrency.
In each regression, the dependent variable is the ratio between the BSADF statistic and its critical value for a given asset, and the predictors are the same ratio for the other four. Thus, each plot depicts how the relationships between cryptoassets change depending on the phases of price behavior (from stationary or unit root to explosive). It can be noticed that during bubble periods (in all the plots, the red line marks the quantile from which the BSADF statistic indicates an explosive phase), Ethereum has an increasing positive impact on Ripple and Litecoin, whereas its effect on Bitcoin decreases after the 0.8 quantile. Another positive relationship is found between Ripple and Stellar, whose mutual effects increase during explosive phases. Some negative dependencies can also be noticed. In particular, Ripple has a negative impact on Bitcoin over all the price distribution and its effect on Ethereum and Litecoin becomes negative during explosive periods. Furthermore, not all the estimated effects increase in magnitude during bubbles. Indeed, the coefficients expressing dependence on Bitcoin and Litecoin decrease during explosive phases.
Table 2,
Table 3,
Table 4,
Table 5 and
Table 6, reporting the parameter estimates for each regression, confirm these findings and show that most effects between cryptoassets are statistically significant. In particular, the coefficients associated to the effect of Ethereum on all other cryptos, except for Stellar, decisively increase, moving from 50th to 90th percentile. Both the positive impact of Ripple on Stellar and the negative (and mutual) one of Ripple on Bitcoin show a sensitive increase in magnitude when considering the tail of the price explosivity distribution.
The performed quantile regression analysis does not give any indication about how co-explosivity on the cryptocurrency market changed during the analyzed period.
To take this aspect into account, we performed a rolling regression exercise. Specifically, for each rolling window (with a size of 30 days) starting from 24 February 2017 (the first date in which the BSADF statistic is available) we estimated the following regression model:
for
, where
is the ratio between the BSADF statistic and the corresponding critical value for the
i-th cryptocurrency, each
is the analogous ratio for the asset
j,
is a constant term and
is a normally distributed error component.
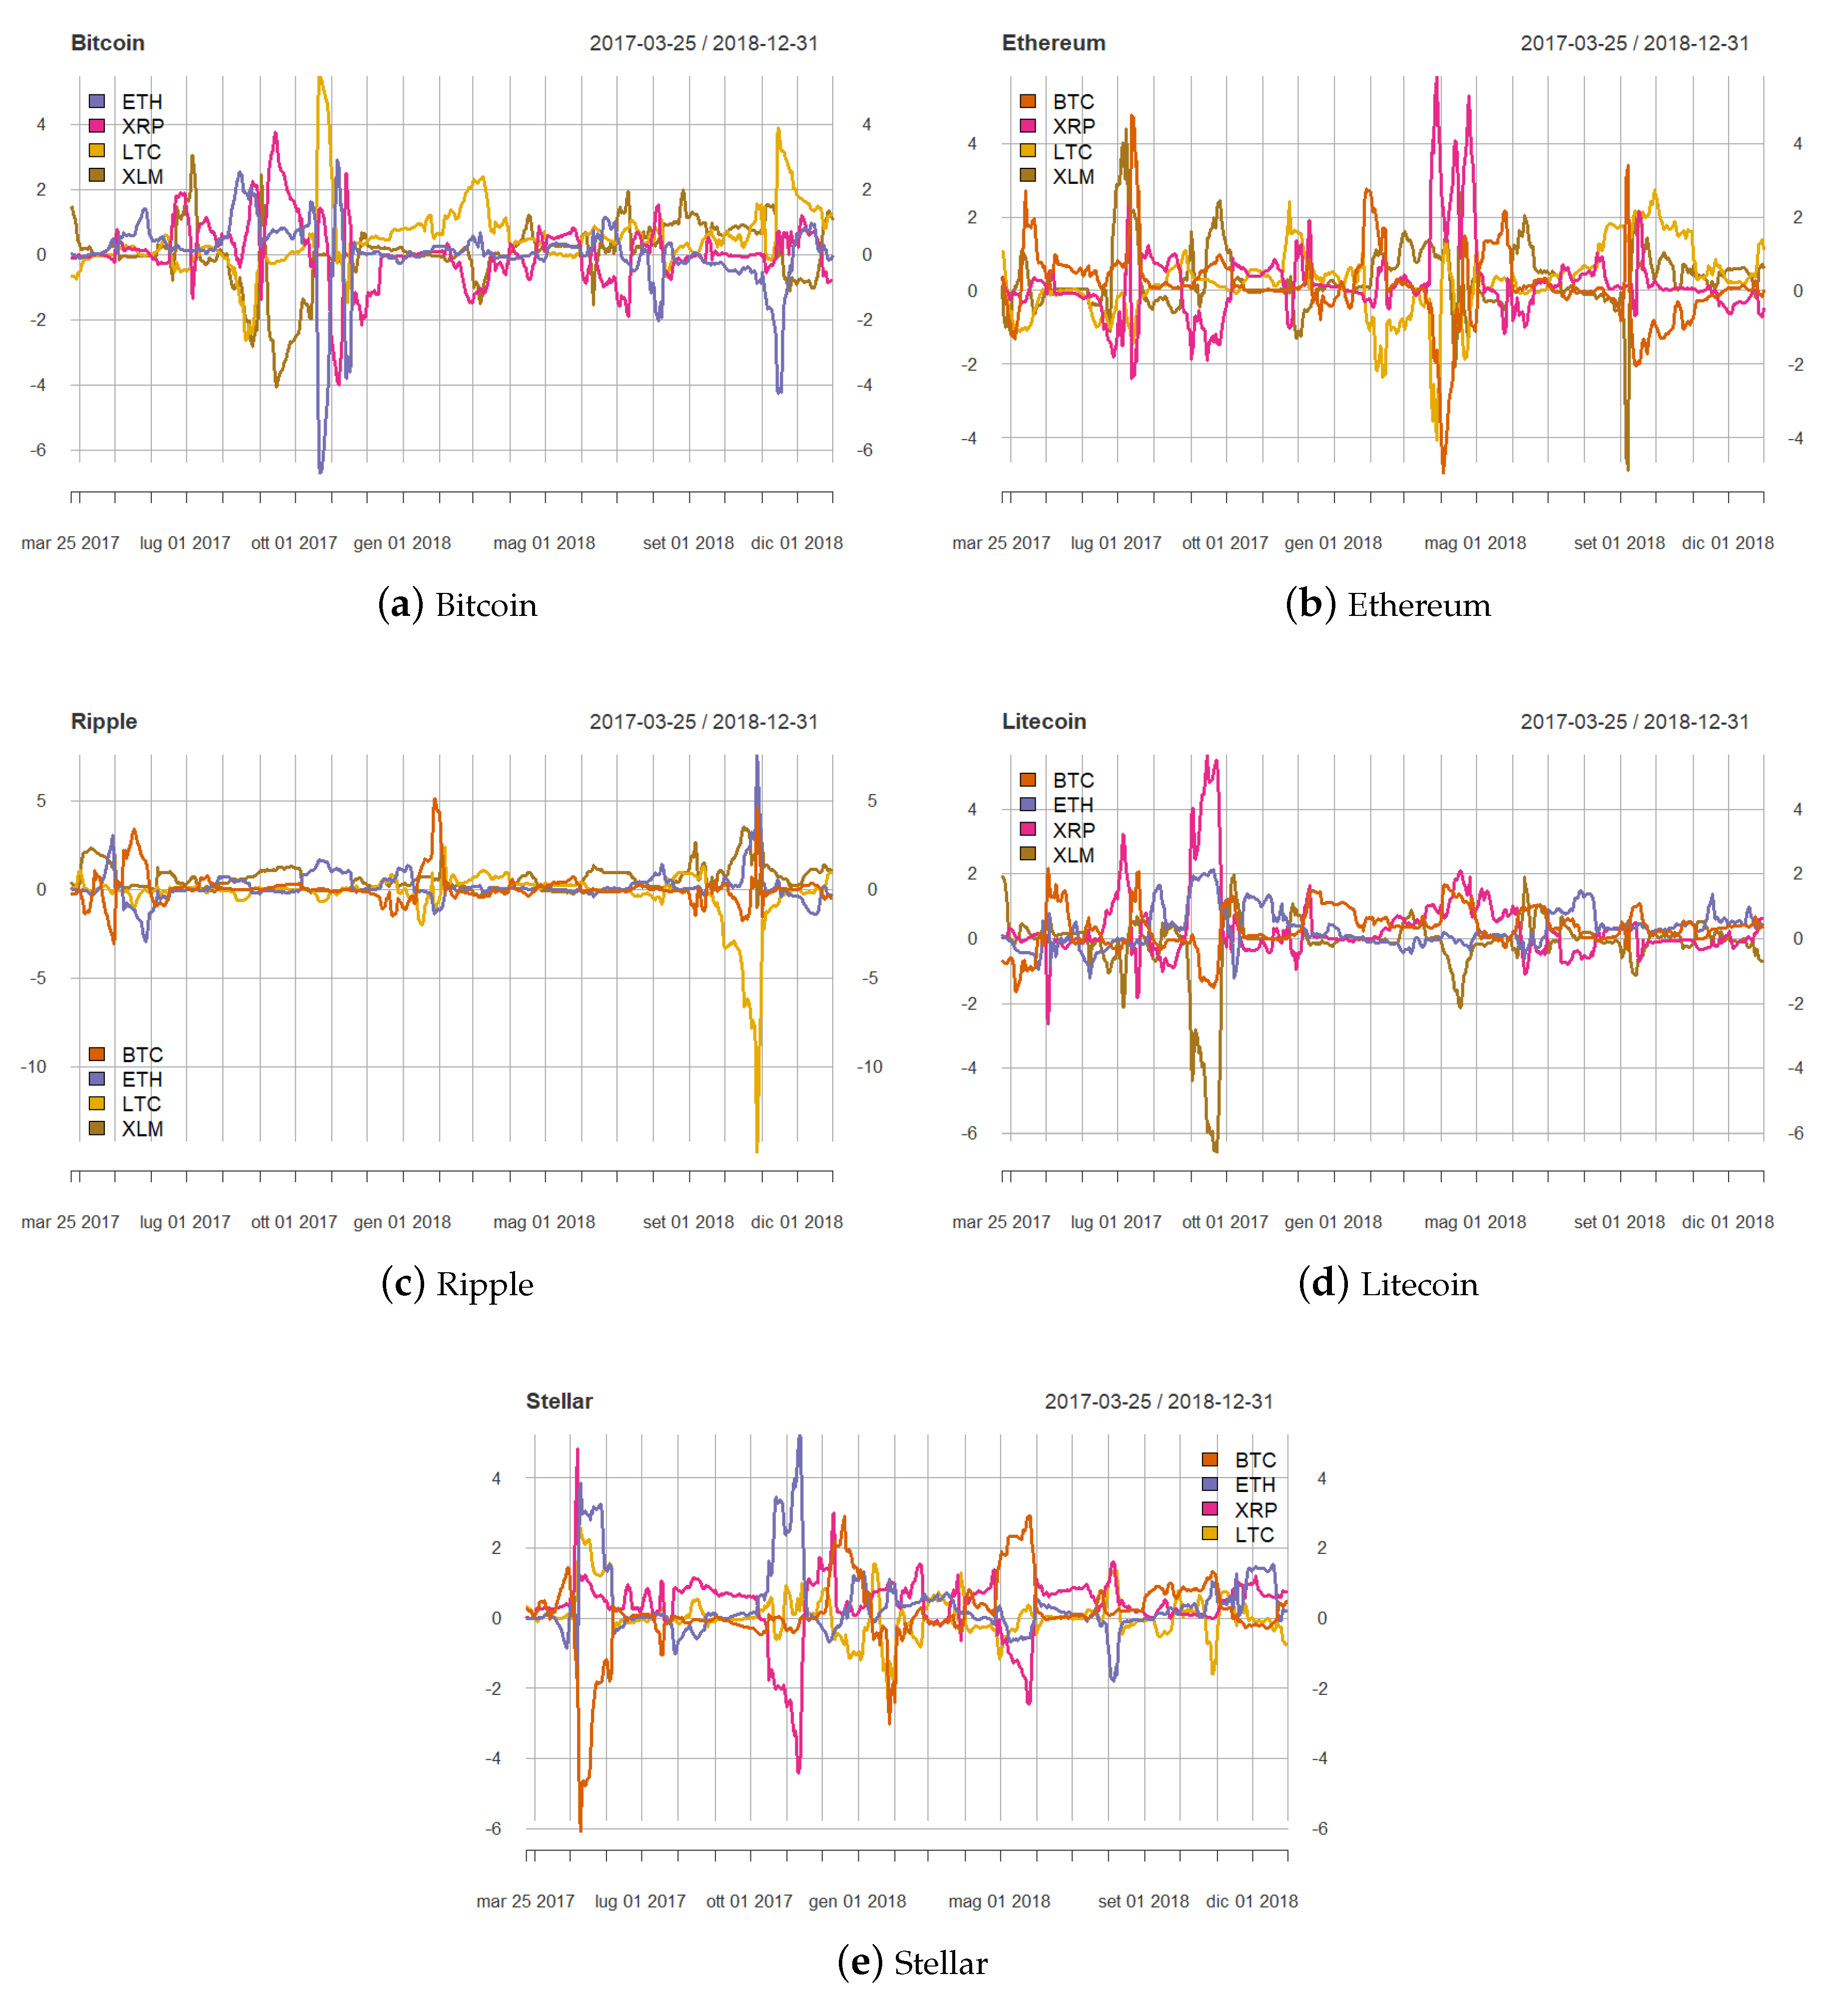
Figure 4 shows the estimated rolling coefficients.
Looking at
Figure 4, the first consideration is that the estimated co-explosivity effects show high increases in magnitude during the detected bubble phases, but they are not all positive. The third and the last quarter of 2017 are the periods characterized by highest interdependence. Bitcoin is largely influenced by the other cryptocurrencies’ explosivity, especially by Litecoin and Ripple, in the last months of 2017, while the effect of Ethereum on Bitcoin is unstable, with negative peaks in November 2017 and November 2018. The negative dependence of Bitcoin on Ripple seems isolated to the end of 2017. In converse, dependence of the other cryptoassets on Bitcoin does not show a drastic increase during the explosive phase of late 2017. An increasing impact of Bitcoin on Ethereum and Litecoin is instead observed in the period August–September 2017, when a bubble phase in Bitcoin occurred following the cited hard fork. The high influence of Ethereum on the other assets’ explosivity, found in the previous analysis, is confirmed, and increases during the explosive phase of late 2017. The coefficients expressing dependence on Ripple are unstable and show sharp peaks in September 2017 (Bitcoin and Litecoin) and May–July 2018 (Ethereum). Some negative rolling coefficients can also be seen. Indeed, the estimated impact of Bitcoin and Litecoin on Ethereum becomes negative when the latter shows a short bubble period in spring 2018. Other negative coefficients during bubble periods are associated to the impact of Bitcoin on Stellar, and of Stellar on Litecoin.
To get a further insight of the extent to which co-explosivity in cryptocurrencies affects the risk of financial losses, we show the results obtained by estimating the model defined in Equation (
8), where the dependent variable is a dummy taking value 1 when a bubble bursts in a given cryptocurrency and the predictors are analogous dummy variables based on the occurrence of bubble bursts in the other cryptoassets. The coefficients of the estimated logistic regressions are reported in
Table 7.
It can be seen from
Table 7 that in several cases the impact, always positive signed, of a bubble burst on the other cryptocurrencies’ probability of bubble burst is significant. In particular, the probability of bubble burst in Bitcoin increases with the occurrence of a bubble burst in Ethereum, and this relationship is found to be mutual, as the one with Litecoin. The positive dependence between Ripple and Stellar is significant, confirming the previous findings. The probability of bubble burst of Stellar also increases with the presence of a bubble burst in Ethereum, which is in converse affected by the collapse of bubbles in Stellar.
Overall, these results show that in several cases a bubble burst in an asset increases the probability of bubble burst in other assets in the cryptocurrency market, while no negative effects of a bubble burst on the probability of bubble burst of other cryptocurrencies are found.


