Article

Supply Chain Management and Risk Management in an Environment of Stochastic Uncertainty (Retail)

by
Sergey A. Lochan
1,*,
Tatiana P. Rozanova
2,
Valery V. Bezpalov
3 and
Dmitry V. Fedyunin
4
1
Department of Tourism and Hotel Business, Financial University under the Government of the Russian Federation, 125993 Moscow, Russia
2
Department of Logistics and Marketing, Financial University under the Government of the Russian Federation, 125993 Moscow, Russia
3
Department of National and Regional Economy, Plekhanov Russian University of Economics, 117997 Moscow, Russia
4
Department of Advertising, Public Relations and Design, Plekhanov Russian University of Economics, 117997 Moscow, Russia
*
Author to whom correspondence should be addressed.
Risks 2021, 9(11), 197; https://doi.org/10.3390/risks9110197
Submission received: 7 July 2021 / Revised: 2 October 2021 / Accepted: 8 October 2021 / Published: 4 November 2021

Abstract

:
In the context of stochastic uncertainty and the increasing complexity of logistics processes in the retail sector, managers face a problem in obtaining accurate forecasts for the dynamics of changes in key business performance indicators. The purpose of the present work is to assess the impact of risk events and unstable conditions on the level of quality of supply chain services and economic indicators of the retail trade network. Using the anyLogistix software tool, a simulation model was constructed that allows assessing operational risks and their impact on key indicators of the supply chain using the bullwhip effect. Besides, a statistical model of the impact of the ripple effect in the event of failures caused by the occurrence of a man-made risk event and the shutdown of production of one of the suppliers on the financial, customer, and operational performance indicators of the supply chain of grocery retail. The results obtained show that the main factors of changes in the supply chain are operational risks associated with fluctuations in demand and order execution time by the distribution center. With a sufficiently high level of occurrence, their impact on productivity and quality of service is low because they can be eliminated in a short time. The simulation results show that the most tangible risks for the food retail supply chain are supply chain failures, whose consequences require significant coordinating efforts and longer recovery times, as well as additional investments. For example, events, such as a fire in one distribution center and the shutdown of production for 1 week of one of the suppliers of dairy products will lead to the loss of USD 181.75 million by the grocery retailer, which is 3% of the expected revenue. We believe that risk management in supply chains is becoming increasingly complex, and to make effective managerial decisions, it is necessary to constantly improve the tools that combine analytical and optimization methods, as well as simulation modeling.

1. Introduction

Supply chain risk management (SCRM) becomes increasingly more important as large and small companies seek to expand their global reach (Zavalko et al. 2020). Enterprises entering new markets both in terms of segments (environmentally friendly products) and the way logistics processes are organized (environmentally friendly logistics mechanisms) often need to form new relationships with suppliers, interact with government agencies, and adapt to local laws and culture (Danko et al. 2020; Lyshchikova et al. 2019). The resulting complexity of the supply chain can mask a wide range of financial, environmental, regulatory, and legal risks.
Threats to the supply chain include price volatility, shortages of materials, supplier financial problems and disruptions, and natural and man-made disasters (Finogenov and Popov 2019). Severe disruptions can quickly spread through global supply chains and result in significant losses in revenue, sales, service levels, and overall profit.
The risk arises because it is impossible to accurately predict the outcome of future events. Even if a company uses the best analytical approaches and software to predict what will happen, there is always uncertainty in the future, and this entails risks (Gayduk et al. 2020).
The complexity of the modern environment has made the use of supply chain data analysis crucial for risk modeling (Chernysheva et al. 2019; Orazbayev et al. 2019). Risk analysis is becoming more difficult, because the visibility of risk decreases, while its complexity increases. It is fairly easy to see risk factors in simple supply chains, but risks become unclear as additional units and components are added.
SCRM is a complex topic and involves many variables. In this case, the influence of these variables and random factors on the possibility of a risk event is stochastic (probabilistic) (Karmanov et al. 2020; Kiseleva et al. 2020).
Although many companies use ready-made network design software, they often do not provide a holistic view of the supply chain and do not have efficient risk management capabilities, especially in large organizations (Pavlova et al. 2017).
The hypothesis of the present study is based on the assumption that because risk management in supply chains is becoming increasingly complex, it is necessary to constantly improve the tools that combine analytical and optimization methods, as well as simulation modeling to make effective managerial decisions.
The work aims to develop an optimization model that would combine the integrated use of simulation modeling and optimization methods in risk management in supply chains to assess the impact of risk events and unstable conditions on the economic performance of a retail chain.

2. Literature Review

The urgency of implementing SCRM practices for retail and other business areas has received widespread attention from large companies, especially in connection with the improvement and implementation of environmentally friendly logistics mechanisms and sustainable chain management (Fahimnia et al. 2015; Heckmann et al. 2015; Ho et al. 2015; Fahimnia et al. 2015; Vishnu et al. 2019).
In our opinion, the main focus of the supply chain management literature is on the study of key risk factors (Badea et al. 2014; Mohanty et al. 2012; Nimsai and Ho 2019; Song et al. 2017), strategic approaches to risk management (Giannakis and Papadopoulos 2016; Ponomarov and Holcomb 2009; Zineb et al. 2017), modeling and design of sustainable supply chains (Elluru et al. 2019; Gong et al. 2014; Huang et al. 2017), and assessing the consequences associated with disruptions in the supply chain (DuHadway et al. 2019; Qi et al. 2010). The risks associated with suppliers are the most explored area of the SCRM (Hallikas et al. 2020; Ramesh et al. 2019). Empirical studies of Mekhum (2019), Martino et al. (2017), Fera et al. (2017), Kot et al. (2019, 2020) have contributed to the modeling of sustainable supply chains.
We will take a closer look at several works on the development of the supply chain to comprehend the research trends and improve the sustainability of supply chain management. For example, Fera et al. (2017) developed a system dynamics model based on placing an order at different points in the supply chain and created a solution map to determine possible strategic solutions in various scenarios with alternatives for placing orders.
Having applied the approaches of the analytical network process (ANP), Martino et al. (2017) identified the priority of risk factors for the supply chain. The authors argue that the most important prospects for supply chains have cost reduction and market orientation. At the same time, environmental sustainability, although it is attracting more and more attention from researchers, is still considered less important for sustainable supply chains. A new theoretical contribution to the expansion of the existing scope of knowledge was made by the work of Kot et al. (2019, 2020), where the mediating influence of strategic supply chain management on sustainable operations due to the environmental and social sustainability of enterprises is investigated. This study was supplemented by a study of the practice of small and medium-sized enterprises in supply chain management from the perspective of a cross-cultural approach. The results obtained showed that the determinants, factors, barriers, functioning, and sustainability of SCM management differ statistically significantly in different countries, while the determinants of SCM do not differ significantly depending on the size of enterprises.
As part of empirical research, Mekhum (2019) concluded that the practice of SSCM has a significant impact on the dynamic capabilities of the supply chain (SCDC) and indicators of organizational sustainable efficiency (OSP).
The study by Amin et al. (2019) expands knowledge in the field of the supply chain, explaining the mechanism for improving the sustainability of supply chain management through a transformational leadership style. The results obtained show the positive impact of transformational leadership on the development of the potential of organizational sustainability, whose capabilities increase the efficiency of managing sustainable supply chains in the organization.
These works make a significant contribution to the development of the understanding of supply chain management at the present stage. However, in our opinion, researchers do not pay enough attention to the use of economic and mathematical modeling. The analysis of the literature allowed singling out two groups of methods that dominate in SCRM: modeling methods and optimization methods.
Conducted analysis of the literature allowed us to single out two groups of methods that dominate in SCRM: modeling methods and optimization methods. However, as Ivanov (2018) notes, optimization and modeling studies of the dynamics and failures of supply chains differ from each other in the setting of tasks, the complexity, and the goals of the analysis.
Both optimization and modeling have specific areas of application, advantages, and disadvantages.
Optimization is a method of analysis that determines the best possible solution to a specific supply chain management problem. The main disadvantage of this method is the complexity of developing a model with details to reflect uncertainty. Besides, it should be noted that most optimization models are deterministic and static, and supply chains are dynamic. Their interdependent parameters and variables are difficult to limit by an optimization model.
While the use of optimization is common practice in many companies, it is only in recent years that modeling has received increasing attention, along with the emergence of modern easy-to-use software tools.
Modeling simulates the dynamic behavior of one system with another. Modeling works based on the principle of “what happens if...?” At the same time, the academic community notes that when using this method, the questions of completeness and consistency of results remain open (Giannakis and Papadopoulos 2016; Ponomarov and Holcomb 2009; Zineb et al. 2017). However, in general, this method can be an ideal tool for analyzing a retail supply chain, a model of which can be built from an optimization model (Alborzi et al. 2011; Bier et al. 2020; Seuring 2013). Thus, based on the above literature review, we believe that optimization-based modeling is a promising area for research in the development of effective risk analysis tools in the supply chain. In the article, we will present the developed optimization model combining analytical and optimization methods, as well as simulation modeling, since, in our opinion, this is the most promising direction for developing models, optimizing risk management of retail chains.

3. Methods

The supply chain of a retail network for the sale of food and non-food consumer goods is considered. The retail network includes 20,860 stores of various formats in 65 Russian regions, 38 distribution centers, 11 food, and four agroindustrial plants located in the Krasnodar Territory, Moscow, Saratov, Tver, Samara, and Lipetsk regions, as well as the Republic of Bashkortostan. In Russia, the assortment of the largest retail chains is as close as possible to consumer demand and may include a combination of food and non-food products placed on a common trading floor.
As part of a simulation experiment, we analyzed the operational risks of the supply chain from the distribution center (DC) to retail stores using the bullwhip effect (BWE), which is directly related to uncertainties and random events in the food retail supply chain. The higher the indicator reflecting the BWE, the more vulnerable the supply chain is, and the more exposed to operational risks associated with delivery deadlines.
The experiment examines the activity of a single DC that supplies food to 270 stores within the “short shoulder”, i.e., the distance from the DC to the store does not exceed 100 km.
The following parameters are adopted to analyze the supply chain risks:
The analyzed period is from 1 January 2019 to 31 December 2019;
The target failure service rate is 88%; and
The target recovery service level is 98%.
The work used methods of descriptive and predictive analytics.
Stage 1. The descriptive-analytical methods are used to identify key issues and opportunities during the information-gathering phase. The descriptive analytics are based on standard aggregate functions in the enterprise Supply Chain Management databases.
At this stage, the collection of baseline data on the DC and retail facilities included in the investigated supply chain was carried out.
The information base is the internal accounting and analytical documents of the retail company, reporting statistical data on operational activities (Table 1).
The information base was the internal accounting and analytical documents of the retail company, reporting statistics on operational activities (sales, fluctuations in demand, etc.), and it could only be used in a generalized way.
  • Monthly data on the placed demand (input flow of orders from stores) and monthly data on the volumes of outgoing deliveries (output flow of orders);
  • Transportation costs for the delivery of orders from the DC to retail stores. Transportation costs are calculated as $1 x volume x distance. The transportation time from the DC to the store is 1 day;
  • The number of incoming and outgoing deliveries. Since the delivered food products have different units of measurement, in our experiment, the volume of cargo in a package, measured in cubic meters, is taken as a single convenient unit;
  • Inventory management policy. The DC applies a minimum and maximum inventory control practice. The minimum stock level is set for 5 days, the maximum is 10 days.
  • The following panel of key performance indicators was used to analyze the BWE:
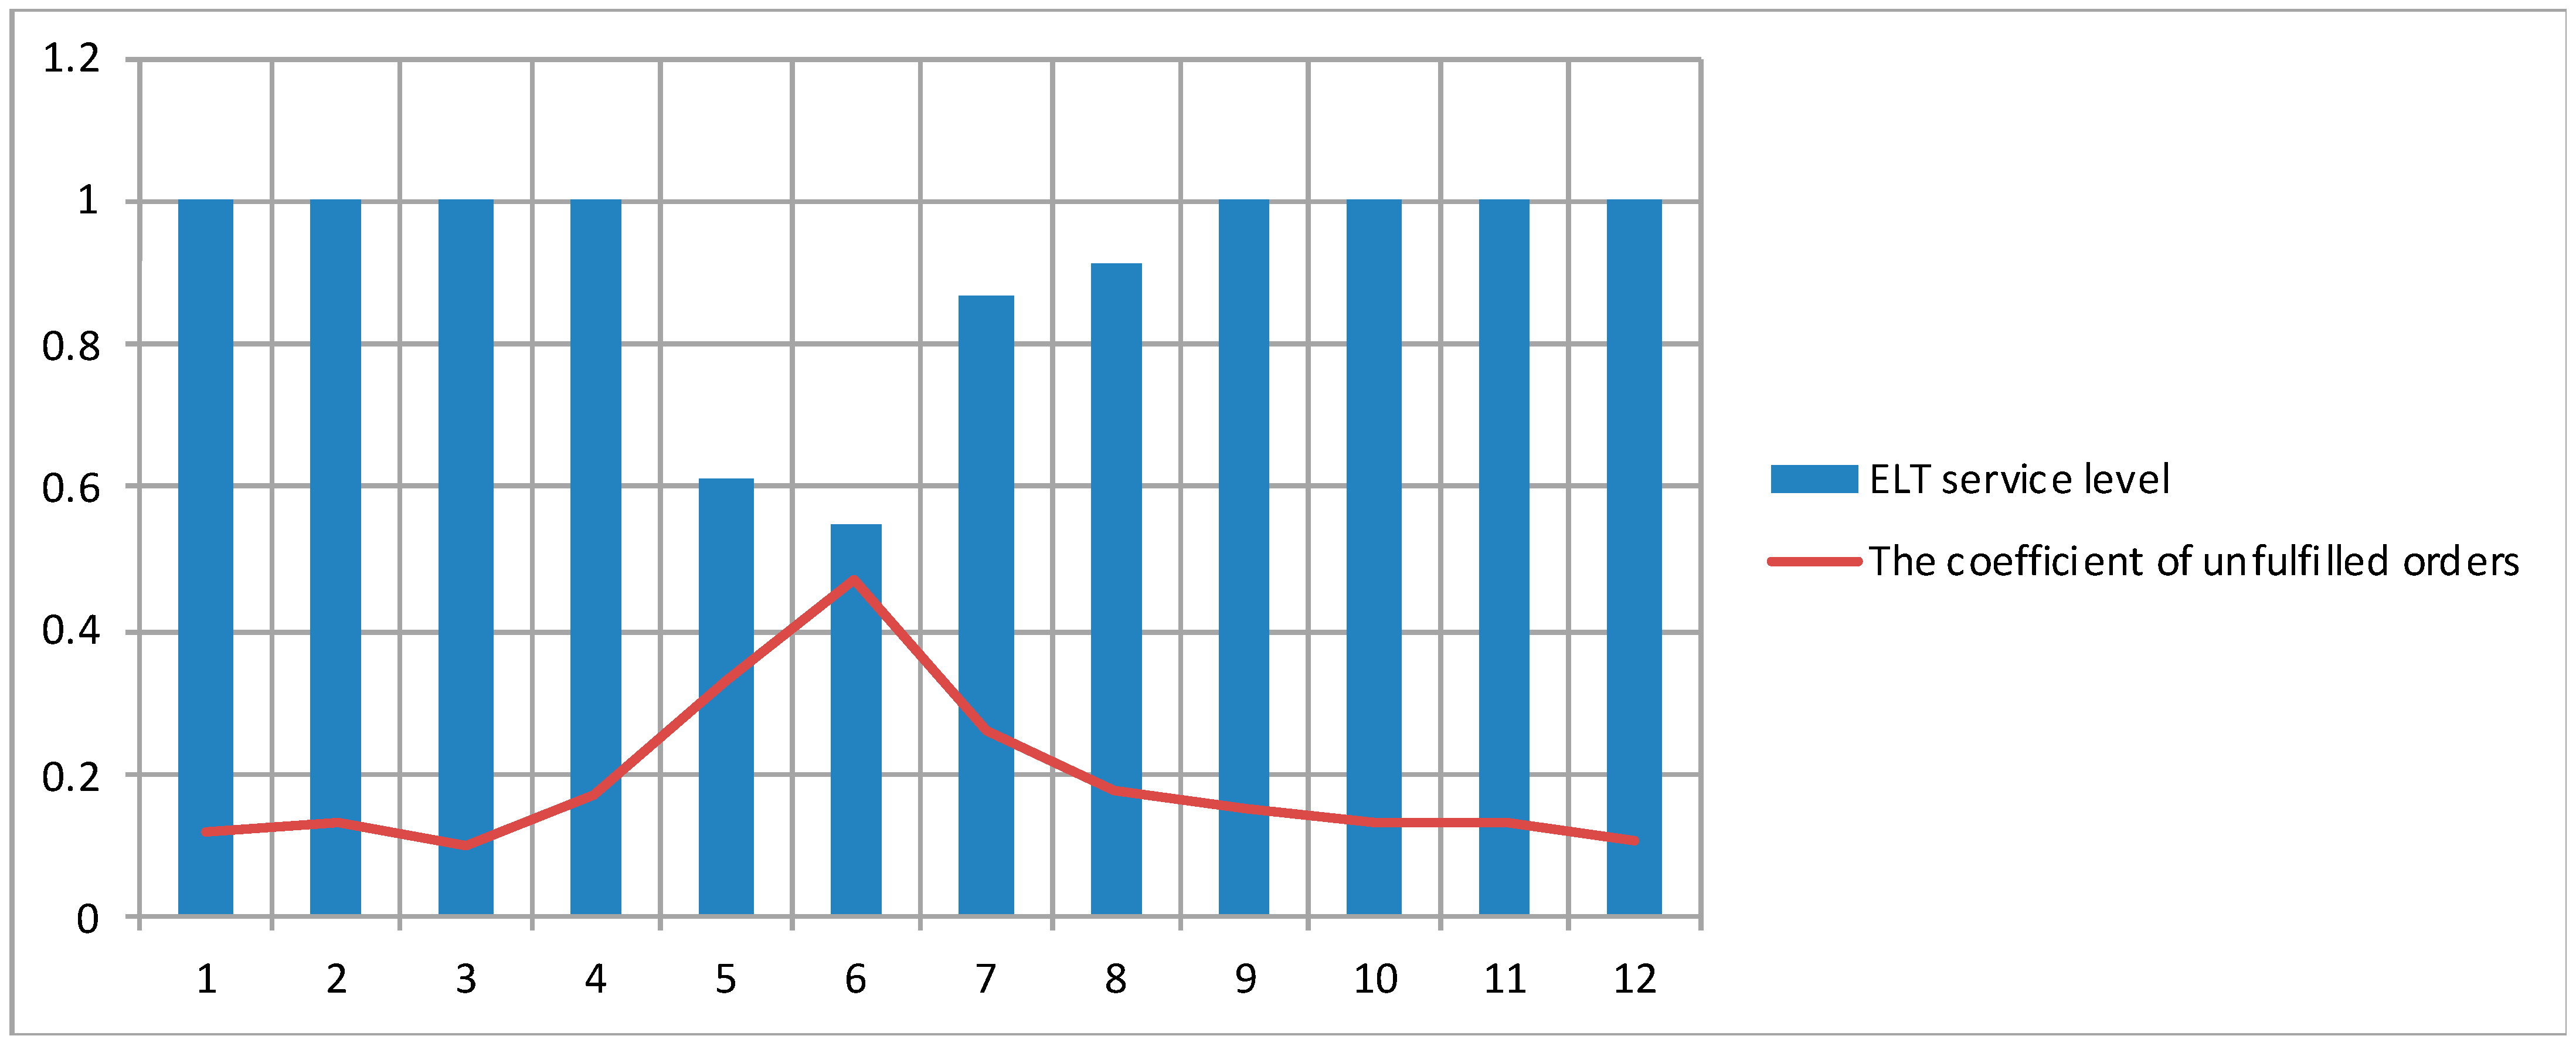
  • ELT service level by the product;
  • Sales dynamics for each of the serviced stores in thousands of $;
  • Available inventory, including outstanding orders;
  • Order completion time.
Stage 2. Building a simulation model. For this study, anyLogistix (ALX) software version 2.12.0 was used as an analytical tool. With this toolkit, we built three scenarios: optimistic (the risk of occurrence of events is 0), pessimistic (the risk of a risk event is 1), and a realistic scenario (the probabilities of occurrence of risk events are determined based on the previous experience of their occurrence, as well as using expert assessments). The model is based on a realistic scenario since it allows one to give the most objective assessment of the development of events.
The algorithm for analyzing supply chain risks under the conditions of stochastic uncertainty can be implemented in several stages:
Stage 3. Defining the baseline of supply chain efficiency
The statistical data, divided into groups according to the type of data collected and presented in Table 2, are used as the input data for building a supply chain model.
In addition to the above information, the coefficients are used that describe the quality of the delivery services provided and the use of various elements of the supply chain:
  • The BWE indicator by products.
  • It reflects the statistics of the increase in the variability of demand for products during the modeling of the supply chain: from manufacturers to retail stores:
  • BWE > 1 means that the outgoing variability prevails over incoming variability;
  • 0 =< BWE < 1 means that incoming variability prevails over outgoing variability;
  • BWE = 1 means that there is no BWE; and
  • BWE = −1 means that the input variability is 0.
  • The BWE is found using the following equation:
BWE = σ out 2 / μ out σ in 2 / μ in
where
σ 2 is the variance of demand;
µ is the expected value;
out is the outgoing orders; and
in is the incoming orders.
Expected lead time (ELT) service level for supply chain by products.
It reflects the service level based on the ratio of express orders to the total outgoing orders. The service level (ELT) for a product shows the ratio of the products delivered on time to the total number of products shipped. The product data are taken from the processed orders.
The value is found using the following Equation (2):
ELT slo = NOT NOO
NOT is the number of orders delivered within the expected lead time; and
NOO is the number of outgoing orders. This does not include the orders placed that have not yet been shipped, are delayed, or discarded (such orders may still be delivered within the expected lead time).
Stage 4. Identification of events that will influence the results of the supply chain development scenario.
Stage 5. Simulation of stochastic processes. The following stochastic processes are simulated at this stage using probability distributions: changes in demand for products, the processing time for products, or the speed of a particular vehicle.
A uniform probability distribution is applied in this study, which is used to represent a random variable with the constant probability of remaining within the interval [min, max]:
f ( x ) = 1 Xmax Xmin
where Xmax and Xmin are the maximum and minimum values of X, respectively.

4. Results

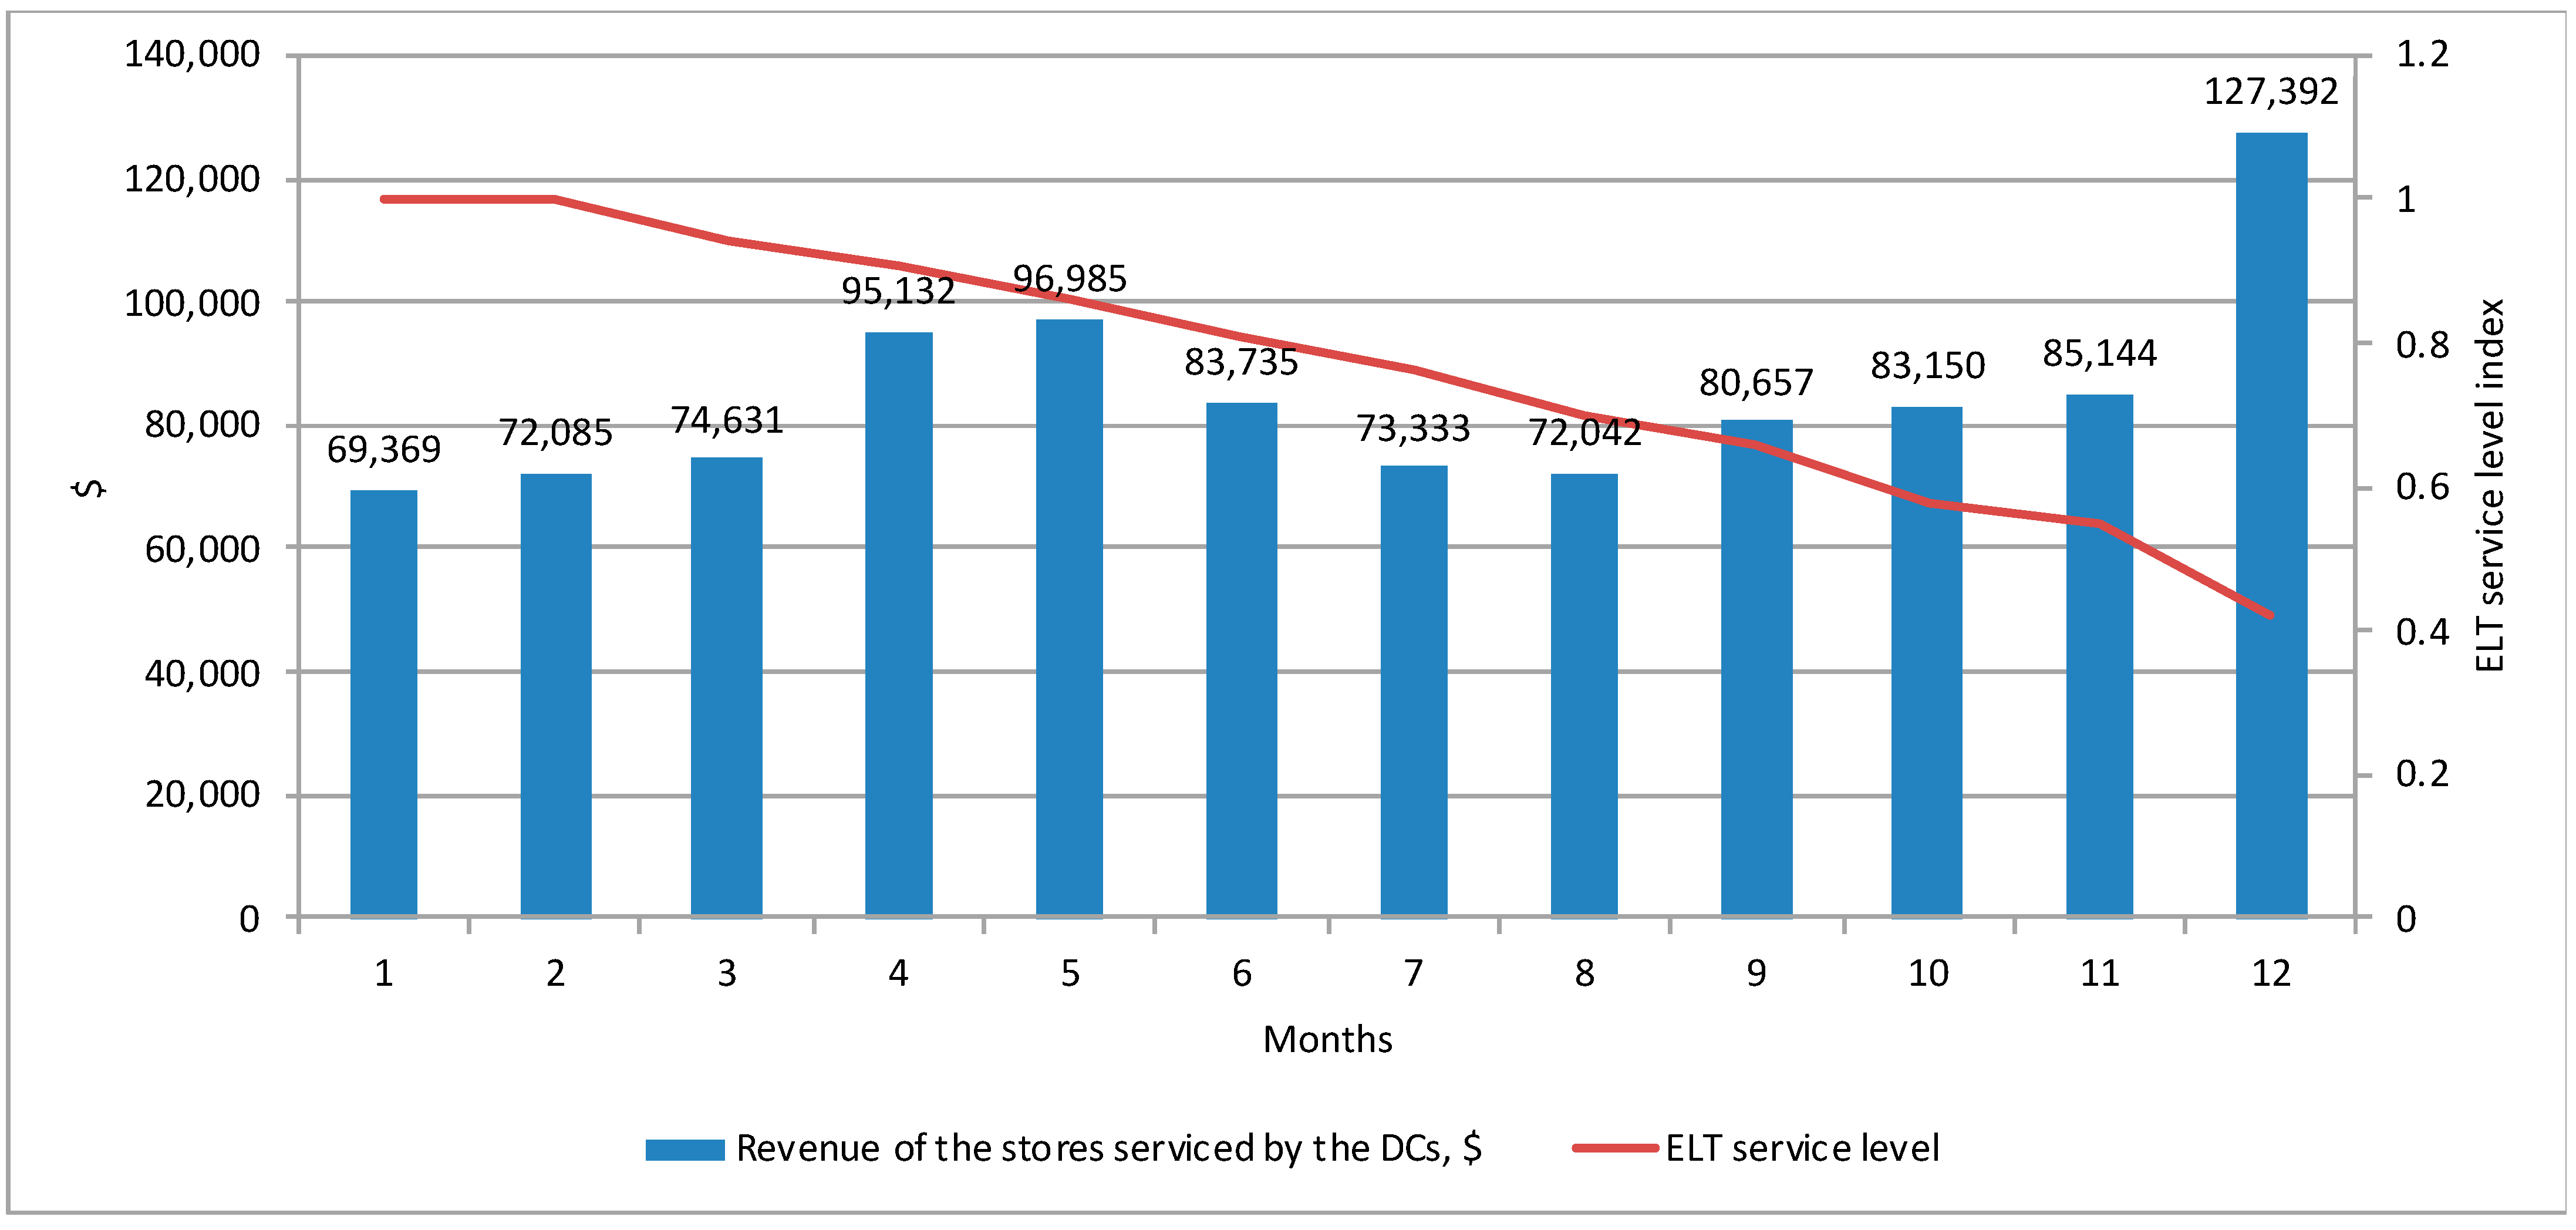
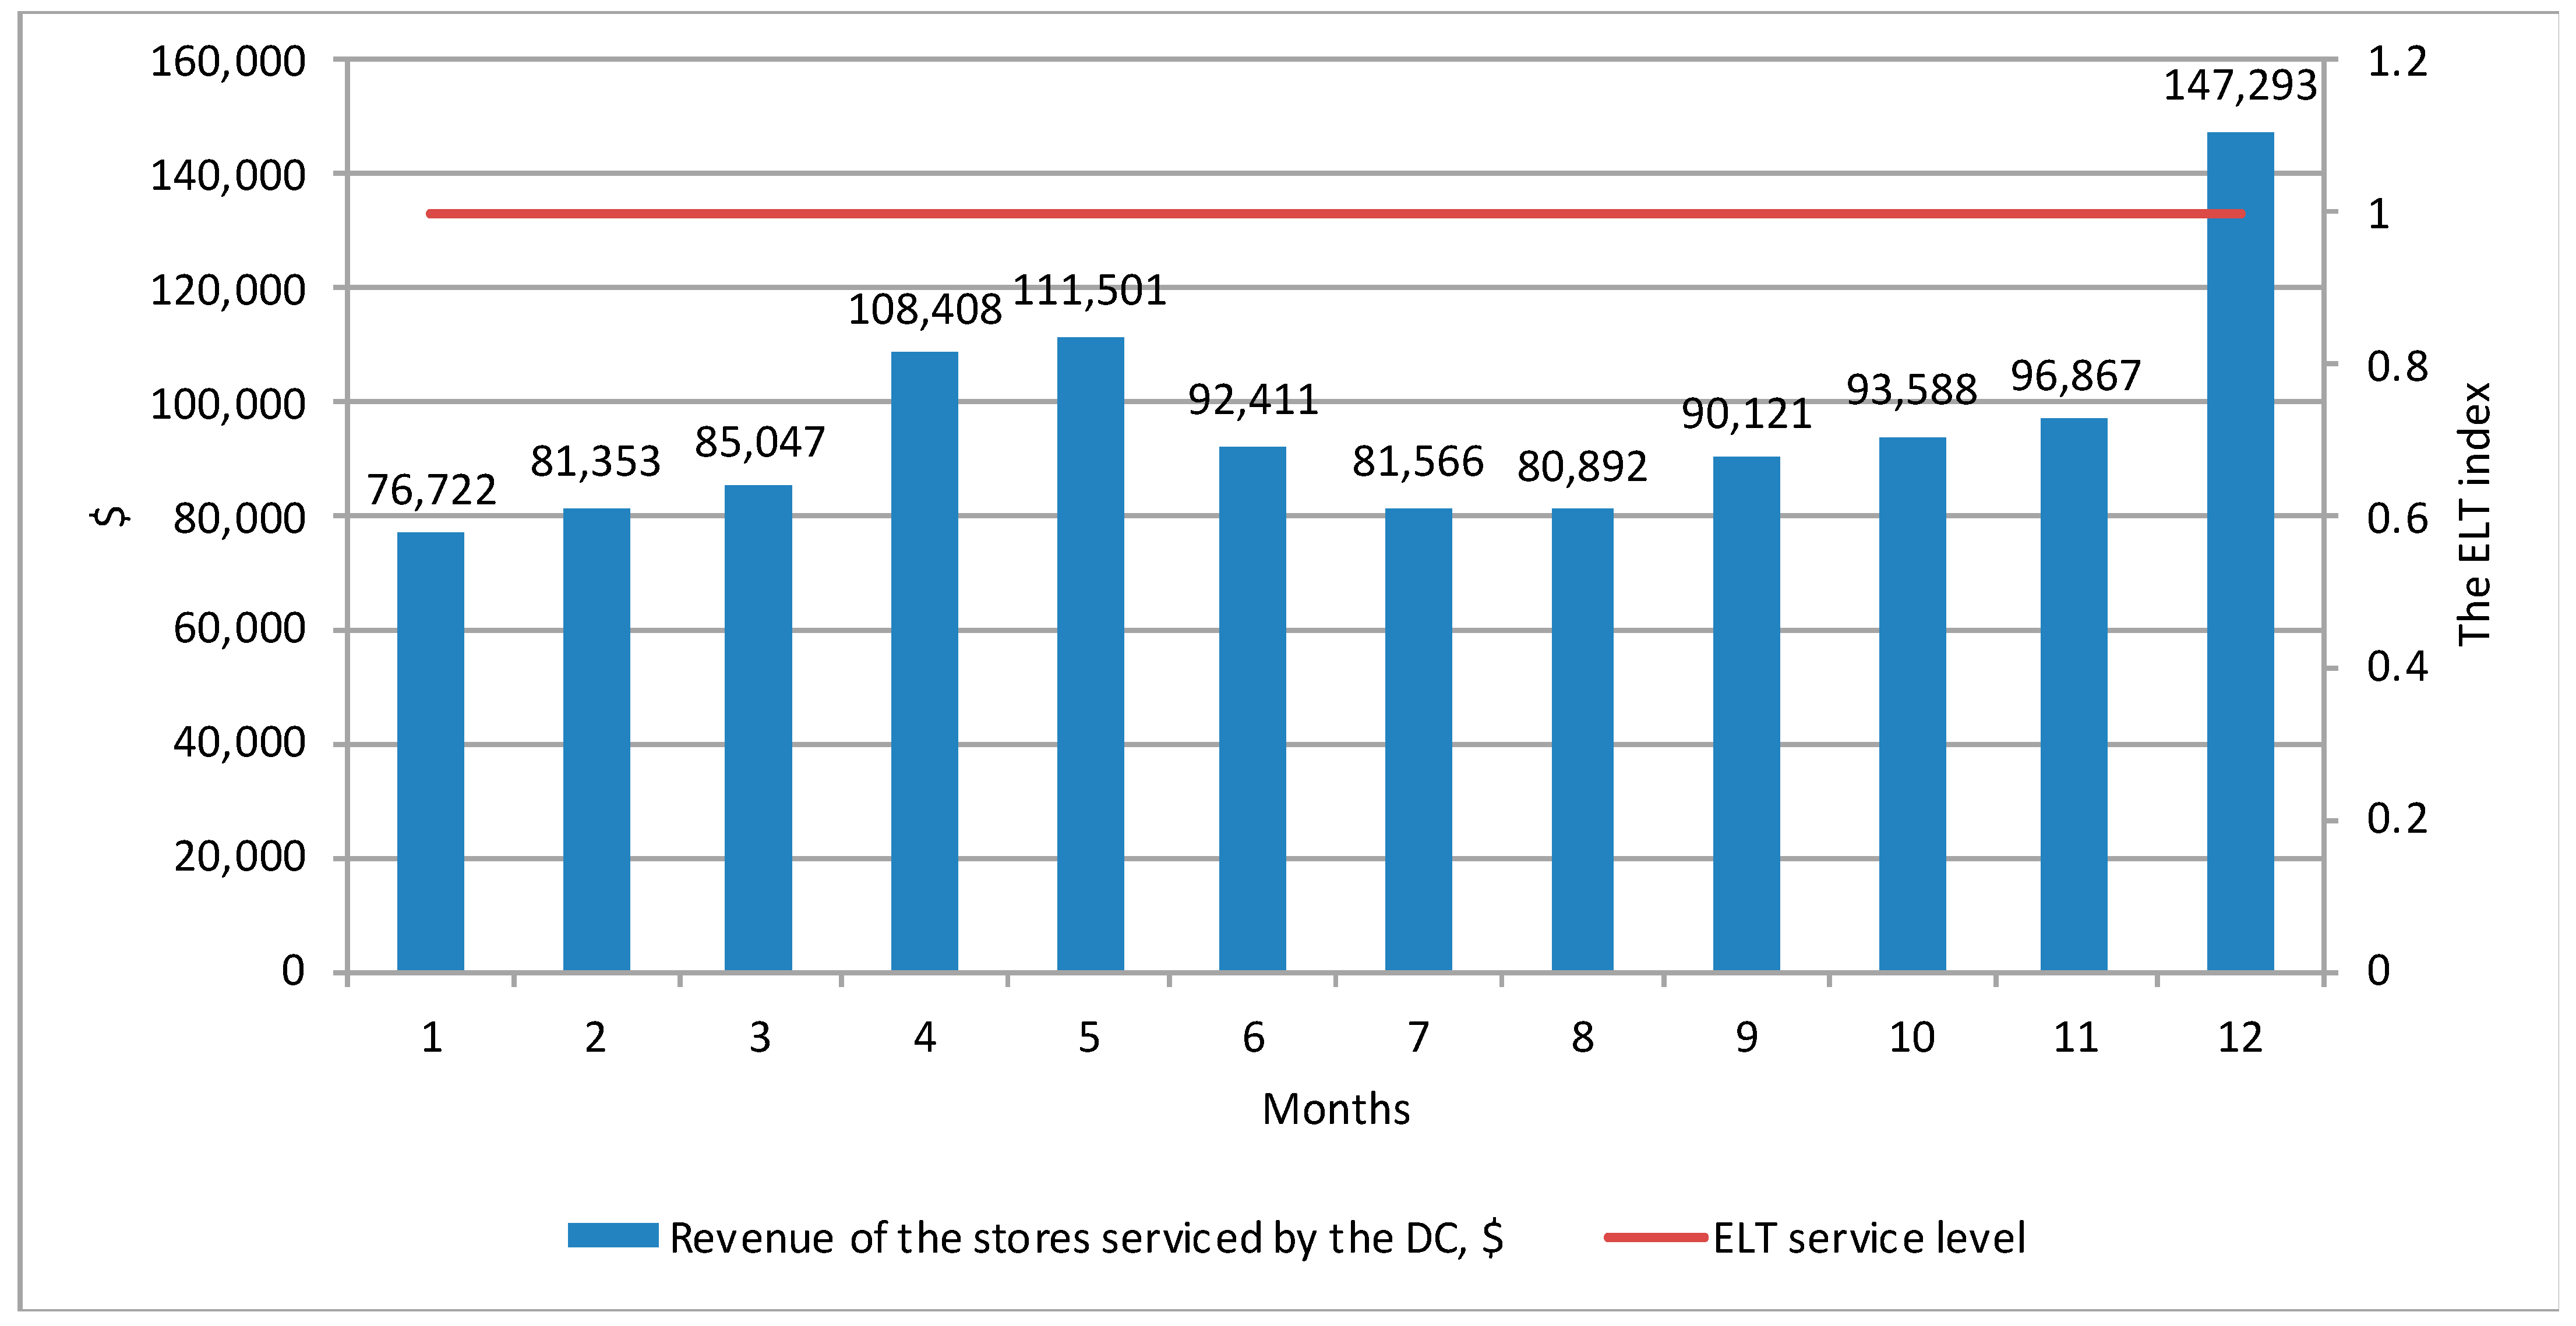
4.1. Operational Risks Analysis Results Employing the BWE

The analysis results show that while maintaining the current supply chain management policy from one DC to retail stores, the BWE index is 1.5 (Table 3). This means that the variance increases, i.e., the work of the supply chain from the DC to the stores of the network is unstable and is subject to operational risks associated with fluctuations in demand.
The results of the conducted study show significant fluctuations in demand in the supply chain.
The increase in demand in December is due to an increase in the purchasing activity of the population associated with the upcoming New Year holidays. According to the sales report of the analyzed retail chain, on the eve of the New Year, sales of some goods increase significantly (for example, chocolate, alcohol, New Year gift sets, and other non-food products, since this holiday is associated with the custom of presenting gifts). The increase in purchasing activity in late April and early May in Russia is associated with the upcoming May holidays when many consumers go out of the city for picnics (sales of meat, barbecues, fruits, alcohol are increasing). The decline in demand in the first summer months is due to the mass outflow of the population to other regions and countries for recreation.
Currently, the existing level of service quality of the DC is at a low level and tends to decrease (Figure 1).
The processing time of some orders by the DC varies from 1 to 7 days and increases the number of delayed deliveries of products. The speed of order collection is very low compared to orders received from stores.
The simulation results show that there are two weak points in the current supply chain: insufficient inventory of goods and too low speed of preparing an order in stores.
Next, an experimental scenario is constructed with a change in the following parameters:
  • The time for preparing orders has been reduced from 3 to 1 day;
  • Minimum and maximum inventory levels have been increased to 10–15 days.
The annual revenue of the serviced stores amounted to USD 1,145,769, i.e., increased by 13% compared to the baseline scenario, and the ELT service level amounted to 100%. The key indicators of supply chain efficiency in the implementation of the second version of the model are presented in Figure 2.
The average order formation time for stores decreased to 1.2 days, which led to 100% timely delivery of products and no lag: the speed of processing and forming orders correspond to incoming orders from retail outlets.
Moreover, in this version of the model, the BWE is practically not manifested.
The BWE index is less than unity, which may indicate that the developed supply chain model is characterized by sufficient stability and acceptable indicators of the probability of implementation and the level of impact of operational risks associated with fluctuations in demand.

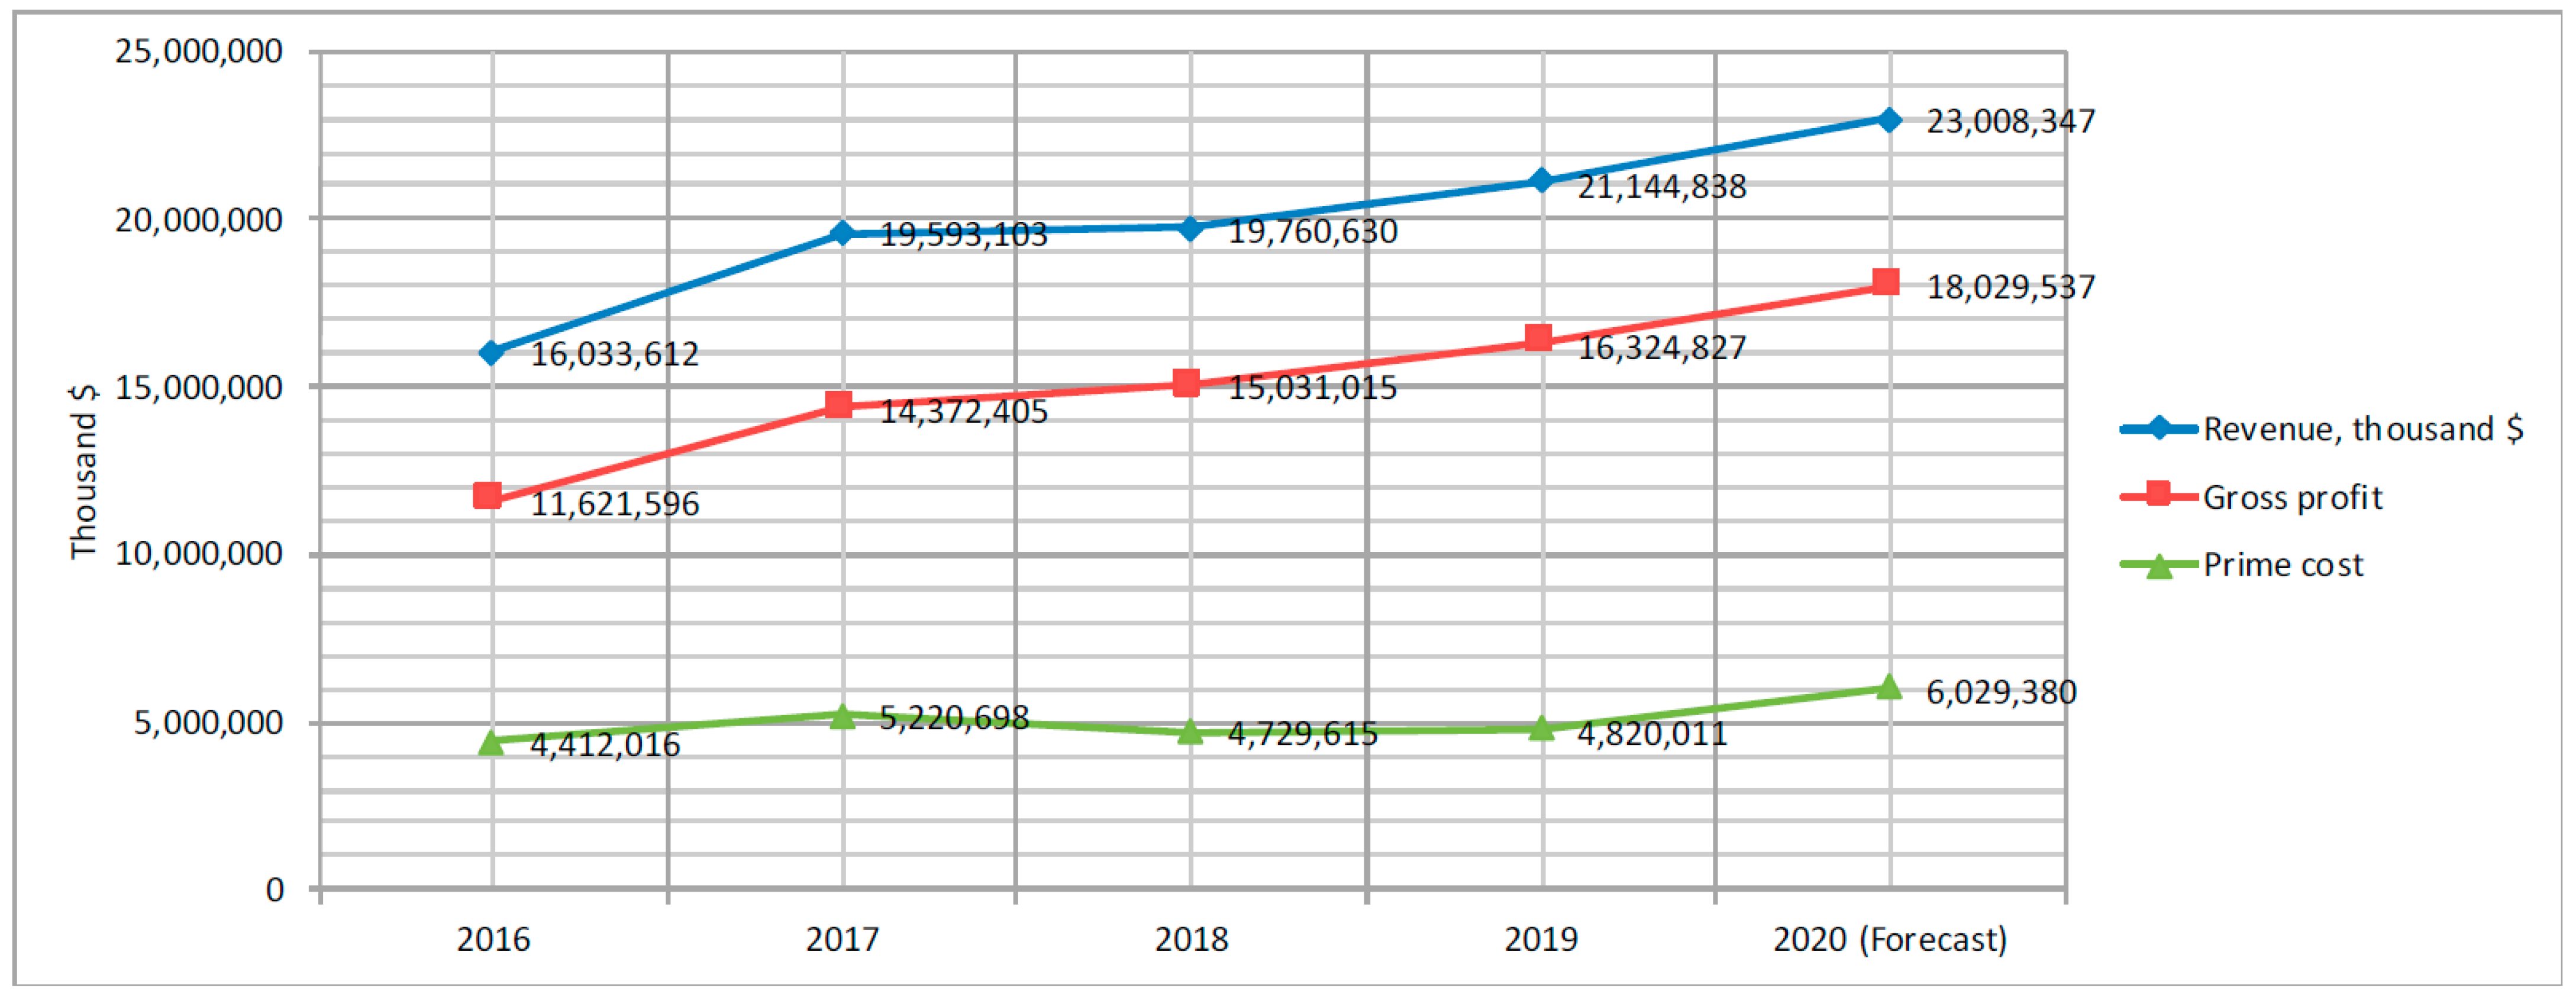
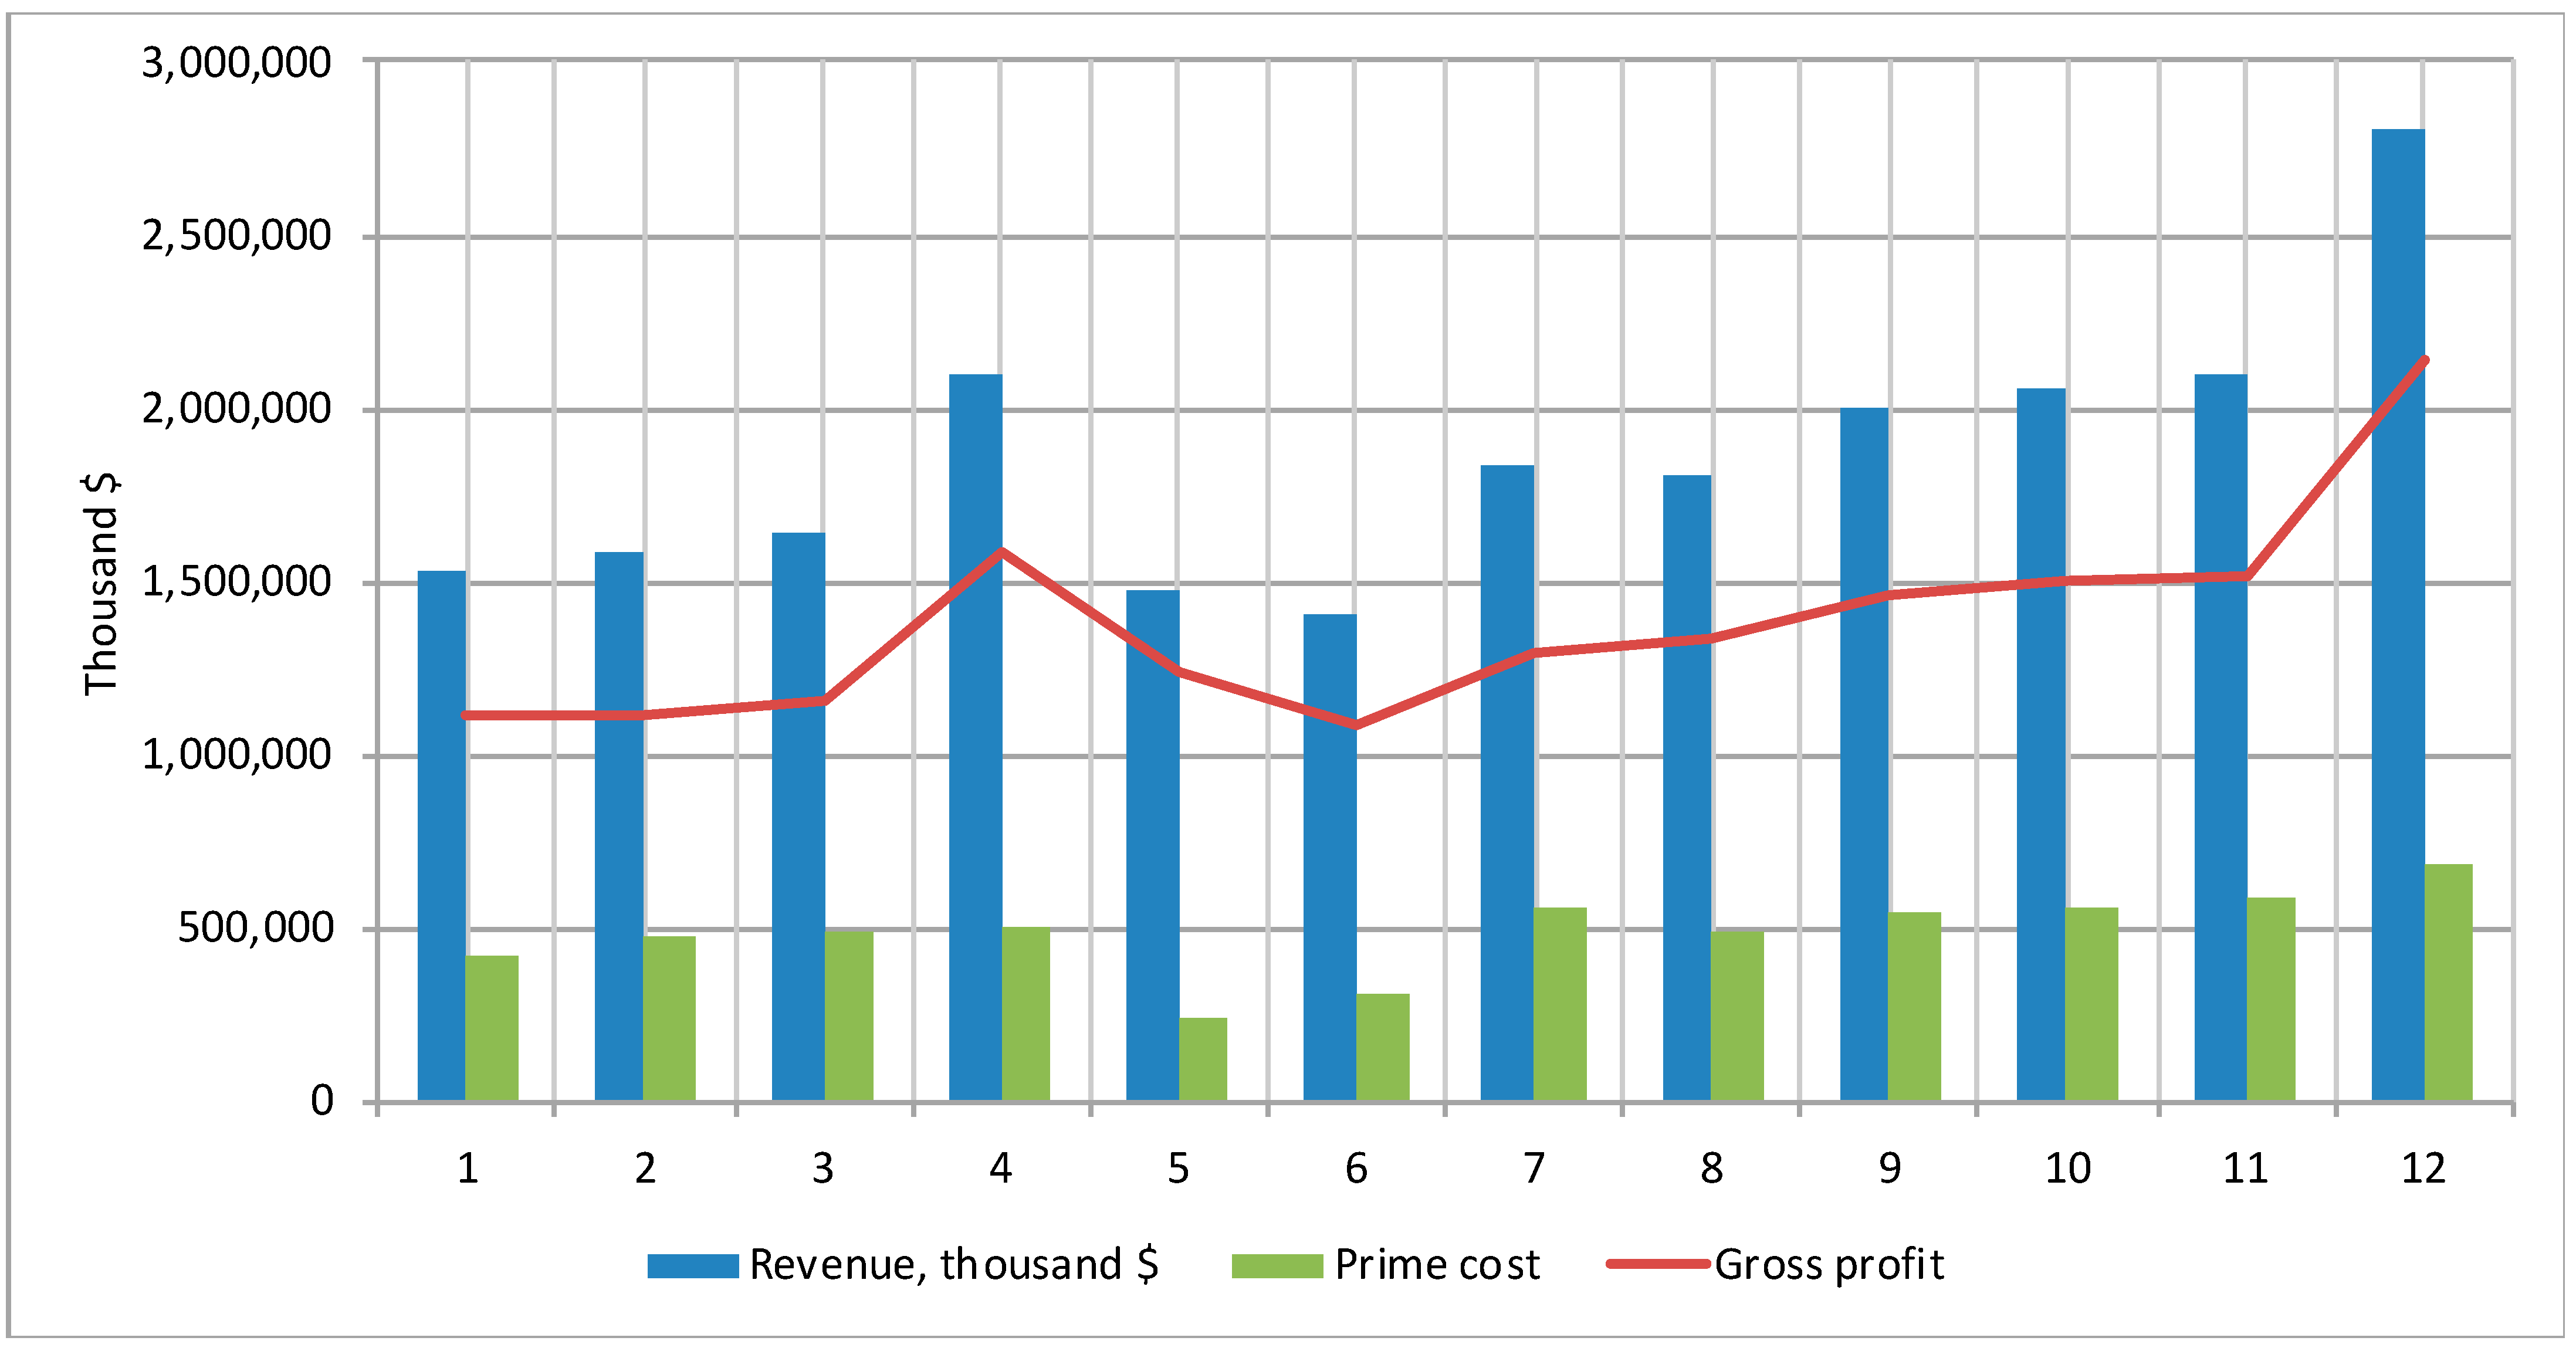
4.2. Results of the Analysis of the Risks of Supply Chain Failures

During the analyzed period, two events occurred in the considered food retail supply chain that had an impact on the reliability of the supply chain (Table 4).
Further, the impact of risk events on the key performance indicators of the supply chain in general for the entire company was analyzed:
  • Products received (incoming orders);
  • Delivered goods (outgoing orders);
  • Lost sales;
  • The level of customer service.
The initial state of the supply chain is the condition when the chain is optimized properly and the service level is ideal, i.e., ELT = 1, and the probability of a risk event is zero (P = 0).
The forecast results show that the company can get total revenue of $ 23,008.3 million and a gross profit of USD 6029.4 million (Figure 3).
At that, the basic level of service is 100%, and there are no interruptions in replenishing and timely customer orders.
The second simulation experiment was carried out for the case of a 100% probability of occurrence of both risk events: a fire in the DC and a failure in dairy production (P = 1). The results of modeling financial indicators for this scenario are shown in Figure 4.
The annual revenue will amount to USD 22,349.4 million (instead of USD 23,008.3 million) and the gross profit of USD 5847.6 million (instead of USD 6029.4 million) due to the interruption of the DC operation. Thus, the damage from the occurrence of a risky event will amount to USD 181.75 million.
Next are the results of modeling the impact of supply chain failures on the level of service, profit, and reliability of the supply chain. Figure 5 shows that as a result of the occurrence of a risk event, the service level will decrease to 0.55, and the coefficient of unfulfilled orders will increase to 0.47.
Thus, the operational risks of grocery retail, associated with fluctuations in demand and order fulfillment time are considered from the standpoint of the BWE and are the main factors of changes in the supply chain. Such risks occur quite often, but can be eliminated in the short term, while the degree of their impact on productivity and service quality is low.
Disruptions in the supply chain due to natural disasters are quite rare but they cause significant damage. When delivering perishable goods, such failures can become critical for grocery retail.

5. Discussion

The results obtained confirm the opinion of modern researchers about the need to implement multi-structured supply chain management and the transition from one-way partial to feedback-based, stable, and resistant to uncertain supply chain events optimization.
In particular, this thesis is confirmed by the results of the Elluru study which states that when designing and planning the supply chain, it is necessary to take into account uncertainty, as well as recurring operational and destructive risks. The results obtained confirm the conclusions made earlier in the studies of DuHadway et al. (2019), Qi et al. (2010), and others that serious failures can quickly affect global supply chains and lead to significant losses in revenue, service level, and profit. These risks are significant for vulnerable, unstable supply chains facing a “ripple effect”.
The results of the conducted analysis repeat those of several previous studies (Levina 2014; Modpak and Marton 2012; Monostori 2021) which show that models in the class of problems of statistical and dynamic analysis of the BWE and the ripple effect allow calculating the impact of failures on performance, and recommending a stable supply chain scheme based on aggregate data on location and flows, provided that costs are minimized or profits are maximized.
We agree with the conclusions of Dolgui et al. (2018) that it is necessary to use modeling to study the spread of failures and the ripple effect in the supply chain, taking into account the time and duration of failures and recovery policies.
The variational scenarios constructed within the framework of the present study using the simulation modeling methodology allowed quantifying operational risks using the BWE and their impact on key indicators of the supply chain. Moreover, the statistical and dynamic analysis of the ripple effect made it possible to analyze the behavior of the food retail supply chain over time and calculate the impact of the failure on the financial, customer, and operational performance indicators of the supply chain.
The analysis of the results of empirical research on the use of economic and mathematical methods for assessing uncertainty and risk and planning work in supply chains allows for identifying several trends and promising research areas on the concerned problem.
(1) Expansion of the class of problems of ripple effect analysis taking into account the recovery measures after a failure
As a research opportunity, we propose to expand the class of statistical and dynamic analysis problems of the ripple effect taking into account the recovery policy. As noted by Ivanov (2018), regardless of the dominance of active or reactive policy, optimization and modeling methods can mutually reinforce each other. Ivanov recommends combining network optimization and modeling (for example, modeling can be performed based on optimization results). Thus, two problems can be integrated within such a structure. The first is the problem of optimizing the network to minimize the total cost of the supply chain. The second is the problem of dynamic analysis of the policy of managing orders, production, inventory, and supplies using modeling.
(2) Improving proactive methods of supply chain risk planning in the context of uncertainty
We agree with Siegel (2018) that by integrating a proactive approach to risk management, supply chains can become more flexible, adaptable, and responsive to changes in their operating environment. However, a proactive approach to risk management in supply chains was used quite rarely until recently, and only in recent years has attracted the due attention of researchers and practitioners. At the same time, research data obtained by Knemeyer et al. (2009) show that more than half of the working time of risk managers is spent on eliminating violations in supply chains. We support the conclusion of Parks and Kim (2016) on the feasibility of conducting more in-depth research and developing methods for proactive planning of catastrophic events in supply chains.
(3) Improving the analytical tools for risk management towards creating libraries of production systems, as well as automated tools that implement digital twins and big data technologies at the supply chain level
We agree with the conclusions of Ivanov et al. (2019), Kaewunruen et al. (2021) that the future development of risk analysis systems in the supply chain is associated with such a technological trend as the use of digital twins. This technology has already been introduced into the business processes of companies around the world and allows building an accurate model of real objects or a business system that operates based on operational data and generally functions in the same way as its prototype.
All this is possible due to the online risk databases, the Internet of Things (IoT) sensors, tracking and tracing systems (T&T), and RFID. These monitoring technologies allow identifying critical hotspots and timely alerting about incidents that can disrupt the supply chain.
All of these real-time disruption data can be embedded in the simulation model, along with real-time data about the natural, financial, or political risks of third parties. The integration of simulation and optimization with live data allows using the models for operational planning. This real-time supply chain risk modeling system represents a digital twin.
We believe that in addition to introducing the digital twins into risk management, the use of Big Data at the supply chain level is a promising area for further research.
Currently, there is significant potential for using big data systems in planning, sourcing, warehousing, and transportation, as well as using new internal and external data sources to make the formation of supply and demand in real-time.
Thus, the introduction of modern technologies, including the use of a combination of methods of analysis, modeling, and forecasting, will make it possible to quickly and efficiently make decisions in conditions of stochastic uncertainty, taking into account the economic and environmental aspects of managing the sustainable development of the retail trade supply chain.

6. Conclusions

In connection with the increasing need to build a flexible, sustainable, and reliable supply chain model, this work explored the possibility of the integrated use of simulation and optimization methods in risk management in supply chains.
To stress-test the supply chain of one of the largest Russian retail chains, a simulation model was built and an experiment on risk analysis was carried out using the AnyLogistix software tool.
The main results of our study are as follows. Modern analytical methods and dynamic modeling are effective methods of preventing failures, reducing negative consequences from the occurrence of risk events in supply chains. Analytical methods allow solving large-scale problems, while dynamic modeling allows for more detailed and dynamic analysis of supply chains.
Operational risks of the food retail supply chain, expressed in fluctuations in demand and violation of the timing of order formation by DCs, were assessed using the BWE index. The results of a quantitative analysis of operational risks showed that the current supply chain of grocery retail is characterized by a high level of the BWE index, i.e., it is highly exposed to risks, associated with fluctuations in demand. At the same time, the existing level of service quality of the DC is at a low level and tends to decrease. The results revealed two weak points in the current supply chain, namely, insufficient stocks of goods and too low speed of preparing an order in stores.
To increase the stability and improve the quality of service in the supply chain, it is recommended to reduce the time for preparing orders by the DC from 3 to 1 day, and increase the minimum and maximum inventory levels to 10–15 days. The simulation results showed that if these parameters change, the annual revenue of stores serviced by the DC will increase by 13% compared to the baseline scenario, and the level of ELT service will reach 100%.
The results of the conducted study showed that failures, whose restoration require medium- and long-term works, even though they occur with a low probability, have a fairly strong impact on the level of service, financial performance, and reliability of the food retail supply chain. Thus, the results of the scenario analysis showed that with a 100% probability of two risky events (a fire in a DC, and a stopping production at a dairy products supplier), the company will lose 13% of operating profit.
The results obtained allowed identifying promising research areas and proposing a constructive way towards improving the tools for assessing risks in supply chains:
  • Expanding the class of problems concerned ripple effect analysis, taking into account measures for recovery after a failure;
  • Improving and applying more actively proactive methods of supply chain risk planning;
  • Using digital twins and big data in the analysis of risks in supply chains.
In conclusion, it should be noted that the present study has significant implications for managers related to the risk assessment and management in the field of grocery retail, providing a mechanism for increasing the stability of supply chains using optimization and simulation methods. The results obtained allow answering questions about the need for measures to stabilize or restore the supply chain and can be used as an additional tool when choosing the most optimal approach to hedging the supply chain from the negative consequences of failures, either proactive or reactive. For example, predicting the situation by taking into account uncertainties and random events, including the influence of environmental factors, allowed for identifying bottlenecks and making more reliable and informed decisions for managers to minimize negative consequences and increase the stability of the entire supply chain.

Author Contributions

All authors contributed equally. All authors have read and agreed to the published version of the manuscript.

Funding

This research received no external funding.

Institutional Review Board Statement

Not applicable.

Informed Consent Statement

Not applicable.

Data Availability Statement

Not applicable.

Acknowledgments

The publication was carried out as part of the implementation of applied research works on the topics “Development of a modern statistical accounting system in the tourism sector for the purpose of analyzing and supporting effective management decisions” and “Development of a concept for modeling the Russian tourism services market using economic and mathematical modeling methods and modern digital technologies”.

Conflicts of Interest

The authors declare no conflict of interest.

References

  1. Alborzi, F., H. Vafaei, M. H. Gholami, and M. M. S. Esfahani. 2011. A multi-objective model for supply chain network design under stochastic demand. International Journal of Industrial and Manufacturing Engineering 5: 2594–98. [Google Scholar]
  2. Amin, B., Y. Hakimah, S. Madjir, and D. Noviantoro. 2019. The role of transformation leadership in enhancing corporate sustainability capabilities and sustainable supply chain management. Polish Journal of Management Studies 20: 83–91. [Google Scholar] [CrossRef]
  3. Badea, A., G. Prostean, G. Goncalves, and H. Allaoui. 2014. Assessing risk factors in the collaborative supply chain with the analytic hierarchy process (AHP). Procedia—Social and Behavioral Sciences 124: 114–23. [Google Scholar] [CrossRef] [Green Version]
  4. Bier, T., A. Lange, and C. H. Glock. 2020. Methods for mitigating disruptions in complex supply chain structures: A systematic literature review. International Journal of Production Research 58: 1835–56. [Google Scholar] [CrossRef]
  5. Chernysheva, A. M., N. P. Gusakov, A. A. Trofimova, and M. A. Bulatenko. 2019. Diversification of transit risks of oil supplies bypassing Ukraine as the basis of energy security in Europe. International Journal of Energy Economics and Policy 9: 461–68. [Google Scholar] [CrossRef]
  6. Danko, T. P., V. M. Kiselev, L. A. Chaykovskaya, P. A. Smelov, and A. E. Gorokhova. 2020. Marketing positioning of countries in the field of innovations: Questions and answers. Entrepreneurship and Sustainability Issues 7: 2851–62. [Google Scholar] [CrossRef]
  7. Dolgui, A., D. Ivanov, and B. Sokolov. 2018. Ripple Effect in the Supply Chain: An Analysis and Recent Literature. International Journal of Production Research 56: 414–30. [Google Scholar] [CrossRef] [Green Version]
  8. DuHadway, S., S. Carnovale, and B. Hazen. 2019. Understanding risk management for intentional supply chain disruptions: Risk detection, risk mitigation, and risk recovery. Annals of Operations Research 283: 179–98. [Google Scholar] [CrossRef]
  9. Elluru, S., H. Gupta, H. Kaur, and S. P. Singh. 2019. Proactive and reactive models for disaster resilient supply chain. Annals of Operations Research 283: 199–224. [Google Scholar] [CrossRef]
  10. Fahimnia, B., C. S. Tang, H. Davarzani, and J. Sarkis. 2015. Quantitative models for managing supply chain risks: A review. European Journal of Operational Research 247: 1–15. [Google Scholar] [CrossRef]
  11. Fera, M., F. Fruggiero, A. Lambiase, R. Macchiaroli, and S. Miranda. 2017. The role of uncertainty in supply chains under dynamic modeling. International Journal of Industrial Engineering Computations 8: 119–40. [Google Scholar] [CrossRef]
  12. Finogenov, A. I., and A. V. Popov. 2019. Concept of planning development of coastal resort settlements under conditions of complex relief. Journal of Environmental Management and Tourism 10: 135–39. [Google Scholar] [CrossRef]
  13. Gayduk, V. I., M. D. Kovalchuk, A. A. Ermakov, and S. Y. Kamysheva. 2020. Risks of interaction between government bodies and business structures in the Russian agricultural sector. Revista Inclusiones 7: 188–205. [Google Scholar]
  14. Giannakis, M., and T. Papadopoulos. 2016. Supply chain sustainability: A risk management approach. International Journal of Production Economics 171: 455–70. [Google Scholar] [CrossRef]
  15. Gong, J., J. E. Mitchell, A. Krishnamurthy, and W. A. Wallace. 2014. An interdependent layered network model for a resilient supply chain. Omega 46: 104–16. [Google Scholar] [CrossRef]
  16. Hallikas, J., K. Lintukangas, and A. K. Kähkönen. 2020. The effects of sustainability practices on the performance of risk management and purchasing. Journal of Cleaner Production 263: 121579. [Google Scholar] [CrossRef]
  17. Heckmann, I., T. Comes, and S. Nickel. 2015. A critical review on supply chain risk—Definition, measure, and modeling. Omega 52: 119–32. [Google Scholar] [CrossRef] [Green Version]
  18. Ho, W., T. Zheng, H. Yildiz, and S. Talluri. 2015. Supply chain risk management: A literature review. International Journal of Production Research 53: 5031–69. [Google Scholar] [CrossRef]
  19. Huang, Z., Q. P. Zheng, E. L. Pasiliao, and D. Simmons. 2017. Exact algorithms on reliable routing problems under uncertain topology using aggregation techniques for exponentially many scenarios. Annals of Operations Research 249: 141–62. [Google Scholar] [CrossRef]
  20. Ivanov, D. 2018. Structural dynamics and resilience in supply chain risk management. In International Series in Operations Research & Management Science. Edited by C. C. Price. Berlin/Heidelberg: Springer International Publishing, vol. 265. [Google Scholar] [CrossRef]
  21. Ivanov, D., A. Dolgui, A. Das, and B. Sokolov. 2019. Digital Supply Chain Twins: Managing the Ripple Effect, Resilience, and Disruption Risks by Data-Driven Optimization, Simulation, and Visibility. International Series in Operations Research and Management Science 276: 309–32. [Google Scholar]
  22. Kaewunruen, S., J. Sresakoolchai, W. Ma, and O. Phil-Ebosie. 2021. Digital Twin Aided Vulnerability Assessment and Risk-Based Maintenance Planning of Bridge Infrastructures Exposed to Extreme Conditions. Sustainability 13: 2051. [Google Scholar] [CrossRef]
  23. Karmanov, M. V., I. A. Kiseleva, V. I. Kuznetsov, A. V. Zavrazhin, and I. V. Shubina. 2020. The process of innovation diffusion and adoption of innovations in the business modeling for travel companies. Journal of Environmental Management and Tourism 11: 346–54. [Google Scholar] [CrossRef]
  24. Kiseleva, I. A., V. I. Kuznetsov, N. A. Sadovnikova, A. V. Pikalov, and A. A. Dolgaya. 2020. Models for assessing the probability bankruptcy of enterprises. Journal of Critical Reviews 7: 1037–42. [Google Scholar] [CrossRef]
  25. Knemeyer, A. M., W. Zinn, and C. Eroglu. 2009. Proactive planning in case of catastrophic events in the supply chains. Journal of Operational Management 27: 141–53. [Google Scholar] [CrossRef]
  26. Kot, S., A. U. Haque, and E. Kozlovski. 2019. Strategic SCM’s Mediating Effect on the Sustainable Operations: Multinational Perspective. Organizacija 52: 219–35. [Google Scholar] [CrossRef] [Green Version]
  27. Kot, S., A. U. l Haque, and A. Baloch. 2020. Supply chain management in SMEs: Global perspective. Montenegrin Journal of Economics 16: 87–104. [Google Scholar] [CrossRef]
  28. Levina, T. V. 2014. Current issues of logistics risk management. Logistics and Supply Chain Management 4: 22–37. [Google Scholar]
  29. Lyshchikova, J. V., E. A. Stryabkova, A. S. Glotova, and T. N. Dobrodomova. 2019. The ‘smart region’ concept: The implementation of digital technology. Journal of Advanced Research in Law and Economics 10: 1338–45. [Google Scholar] [CrossRef]
  30. Martino, G., M. Fera, R. Iannone, and M. Salvatore. 2017. Supply Chain Risk Assessment in the Fashion Retail Industry: An Analytic Network Process Approach. International Journal of Applied Engineering Research 12: 140–54. [Google Scholar]
  31. Mekhum, W. 2019. The impact of sustainability concept on supply chain dynamic capabilities. Polish Journal of Management Studies 20: 267–76. [Google Scholar] [CrossRef]
  32. Modpak, V., and D. Marton. 2012. Modeling and evaluation of the complexity of assembly supply systems. Procedural Engineering 48: 428–35. [Google Scholar]
  33. Mohanty, R. P., G. Sahoo, and J. Dasgupta. 2012. Identification of risk factors in globally outsourced software projects using logistic regression and ANN. International Journal of Supply Chain Management 1: 2–11. [Google Scholar]
  34. Monostori, J. 2021. Mitigating the ripple effect in supply chains: Balancing the aspects of reliability, complexity and efficiency. CIRP Journal of Industrial Sciences and Technologies 32: 370–81. [Google Scholar]
  35. Nimsai, S., and P. Ho. 2019. Risk factor analysis of the value chain for sawn rubberwood timber exports to China. International Journal of Supply Chain Management 8: 14–22. [Google Scholar]
  36. Orazbayev, B. B., G. B. Imangazieva, and K. N. Orazbayeva. 2019. Formulation and solution to control problems of operation modes in delayed coking unit in the fuzzy environment based on the heuristic method. Journal of Theoretical and Applied Information Technology 97: 4768–79. [Google Scholar]
  37. Parks, Y., and H. Kim. 2016. A simulation-based evolutionary algorithmic approach to operational planning of global supply chains based on systematic risk management. Computing Ind. 83: 68–77. [Google Scholar] [CrossRef]
  38. Pavlova, E. V., I. A. Duborkina, A. P. Sokolova, I. G. Doronkina, and E. E. Konovalova. 2017. Dependence of the Russian economy on oil prices in the context of the volatility of the global oil market: Articulation of issue. International Journal of Energy Economics and Policy 7: 225–30. [Google Scholar]
  39. Ponomarov, S. Y., and M. C. Holcomb. 2009. Understanding the concept of supply chain resilience. The International Journal of Logistics Management 20: 124–43. [Google Scholar] [CrossRef]
  40. Qi, L., Z. J. M. Shen, and L. V. Snyder. 2010. The effect of supply disruptions on supply chain design decisions. Transportation Science 44: 274–89. [Google Scholar] [CrossRef] [Green Version]
  41. Ramesh, K. T., S. P. Sarmah, and P. K. Tarei. 2019. An integrated framework for the assessment of inbound supply risk and prioritization of the risk drivers. Benchmarking: An International Journal 27: 1261–86. [Google Scholar] [CrossRef]
  42. Seuring, S. 2013. A review of modeling approaches for sustainable supply chain management. Decision Support Systems 54: 1513–20. [Google Scholar] [CrossRef]
  43. Siegel, M. 2018. Building sustainable organizations: Proactive risk management in organizations and their supply chains. Journal of Business Continuity and Emergency Planning 11: 373–84. [Google Scholar] [PubMed]
  44. Song, W., X. Ming, and H. C. Liu. 2017. Identifying critical risk factors of sustainable supply chain management: A rough strength-relation analysis method. Journal of Cleaner Production 143: 100–15. [Google Scholar] [CrossRef]
  45. Vishnu, C. R., R. Sridharan, and P. N. R. Kumar. 2019. Supply chain risk management: Models and methods. International Journal of Management and Decision Making 18: 31–75. [Google Scholar] [CrossRef]
  46. Zavalko, N. A., V. O. Kozhina, E. V. Yudina, O. N. Beketova, and A. V. Lavrenova. 2020. Innovative approaches to business modeling at an enterprise. Revista Inclusiones 7: 84–92. [Google Scholar]
  47. Zineb, E., B. Brahim, and A. Houdaifa. 2017. The impact of SCRM strategies on supply chain resilience: A quantitative study in the Moroccan manufacturing industry. International Journal of Supply Chain Management 6: 70–75. [Google Scholar]
Figure 1. Revenue dynamics of serviced stores and the level of ELT order servicing.
Risks 09 00197 g001
Figure 2. Key indicators of supply chain efficiency in the implementation of the second version of the model.
Risks 09 00197 g002
Figure 3. Forecast of the main indicators of the company’s financial activity.
Risks 09 00197 g003
Figure 4. Results of forecasting financial indicators in the event of a technogenic risk at P = 1.
Risks 09 00197 g004
Figure 5. The dynamics of service indicators in the supply chain as a result of the occurrence of the risk event “fire in the DC”.
Risks 09 00197 g005
Table 1. Sources of raw data for analysis.
DocumentsSources
Monthly product sales reportsData from the corporate automated accounting system 1C: Enterprise 8
New year sales report
Marketing campaign results reports
Production plans for own products
Plans for reconstruction, repairs of premises and vehicles
Table 2. Input statistical data of the supply chain risk analysis model.
Statistical Data GroupsInformation Content
Financialinformation about the income earned and expenses incurred
Distanceinformation about the distance traveled by vehicles
Productsinformation about the products within the supply chain
Time information about the time spent on processing tasks or downtime
Transportationinformation about the vehicles used within the supply chain
Ordersinformation about all orders within the supply chain
Table 3. Calculation of the BWE index (“as is” model).
MonthsPlaced Demand (Input Flow), Cubic Meters (IN)The Volume of Outgoing Deliveries (Output Flow), Cubic Meters (OUT)
1435.6386.7
2536.2688.8
3712.8544.9
4614.4698.2
5817.7788.4
6660.3756.9
7598.8550.3
8640.2671.9
9666.4551.7
10718.6652.9
11720.5788.1
12822.1865.8
Variance σ2 11,076.7516,564.46
Mathematical expectation µ661.97662.05
σ216.7325.02
BWE1.495
Table 4. Risk events that occurred in 2019.
EventClosing TimeOpening Time after a FailureDuration of Object Restoration
Fire at the DC28.04.201927.06.201960
Failure at a dairy plant—a supplier of milk and fermented milk products03.07.1910.07.197
Publisher’s Note: MDPI stays neutral with regard to jurisdictional claims in published maps and institutional affiliations.

