
Drivers of the Cash Paradox


Department of Economics, University of Economics in Katowice, 40-287 Katowice, Poland
Risks 2021, 9(12), 227; https://doi.org/10.3390/risks9120227
Submission received: 5 November 2021
/
Revised: 3 December 2021
/
Accepted: 7 December 2021
/
Published: 16 December 2021
Abstract
:An upward trend in the share of cash in GDP has been observed since the beginning of the 21st century and has not yet been fully explained in the literature. In fact, the interest rate is the only variable that has been well researched and well confirmed as a determinant of the cash/GDP ratio. The novelty of this study is primarily considering new determinants of the share of cash in GDP (including in particular monetization and financial development), as well as testing the significance of uncertainty and institutions. The data cover the period 2001–2020 for 82 countries. The most important conclusions include: the share of cash in GDP is primarily dependent on its lagged values (payment habits) and the ultra-loose monetary policy of central banks. However, some other variables also contribute to this process—such as monetization and crises in the real economy.
1. Introduction
In recent years, a growing trend in the share of cash in gross domestic product (GDP) has been observed. This trend has occurred even though an increasing number of transactions are now being carried out with the use of electronic payment instruments. The phenomenon of the simultaneous increase of the cash/GDP ratio and the increase in the number of non-cash transactions is often referred to as the “cash paradox” (Jiang and Shao 2020; Zamora-Pérez 2021). Current data indicate that the period of the COVID-19 pandemic contributed to the further popularization of electronic payments, for sanitary reasons (Auer et al. 2020; Wisniewski et al. 2021) and a parallel increase in the share of cash in GDP (Ashworth and Goodhart 2020a).
These trends in the share of cash in GDP are difficult to explain. There are only a few published empirical studies that have attempted to test hypotheses about the determinants of the increase in the use and holding of cash. Most of them date back to the pre-COVID-19 era (Ashworth and Goodhart 2020b; Jobst and Stix 2017a, 2017b; Liñares-Zegarra and Willesson 2021; Reimers et al. 2020; Titova et al. 2021; Rösl and Seitz 2021; Cevik 2020; Armelius et al. 2021). In particular, low interest rates have been proposed in the discussion as a key determinant of the growing importance of cash (Liñares-Zegarra and Willesson 2021; Jobst and Stix 2017a). In fact, they are the only variable that has been well researched and well confirmed as a determinant of the cash/GDP ratio. Other phenomena that may be behind this surprising trend have also been considered, especially uncertainty. However, this discussion is far from reaching a clear conclusion and the number of empirical studies is relatively small.
The intention of this article is to empirically test the hypotheses relating to the drivers of the increase in the share of cash in GDP. These are partly variables studied in previous studies, and partly new. Additionally, it was taken into account that the process is dynamic and the cash/GDP ratio is inertial, strongly dependent on the previous values. This is due to the large role of payment habits and because of people imitating the behavior of others—which is confirmed in research with the use of microdata (van der Cruijsen and Knoben 2021). Therefore, the system GMM estimator, appropriate for the estimation in the case of dynamic panels, was used.
Thus, main research question is: what determines the (varied across countries) changes in the share of cash in GDP? The novelty of this study is primarily taking into account new determinants of the cash/GDP ratio (including in particular monetization and financial development) as well as testing the significance of uncertainty and institutions. The most important conclusions include: the share of cash in GDP is primarily dependent on lagged values (payment habits) and the ultra-loose monetary policy of central banks. However, some other variables also contribute to this process—such as monetization, financial development, the rule of law, and crises in the real economy.
2. Recent Trends in Cash Usage
It is worth starting with a very brief overview of trends in the cash/GDP ratio, the more so as these trends are not intuitively obvious in the times of a rapidly developing digital economy.
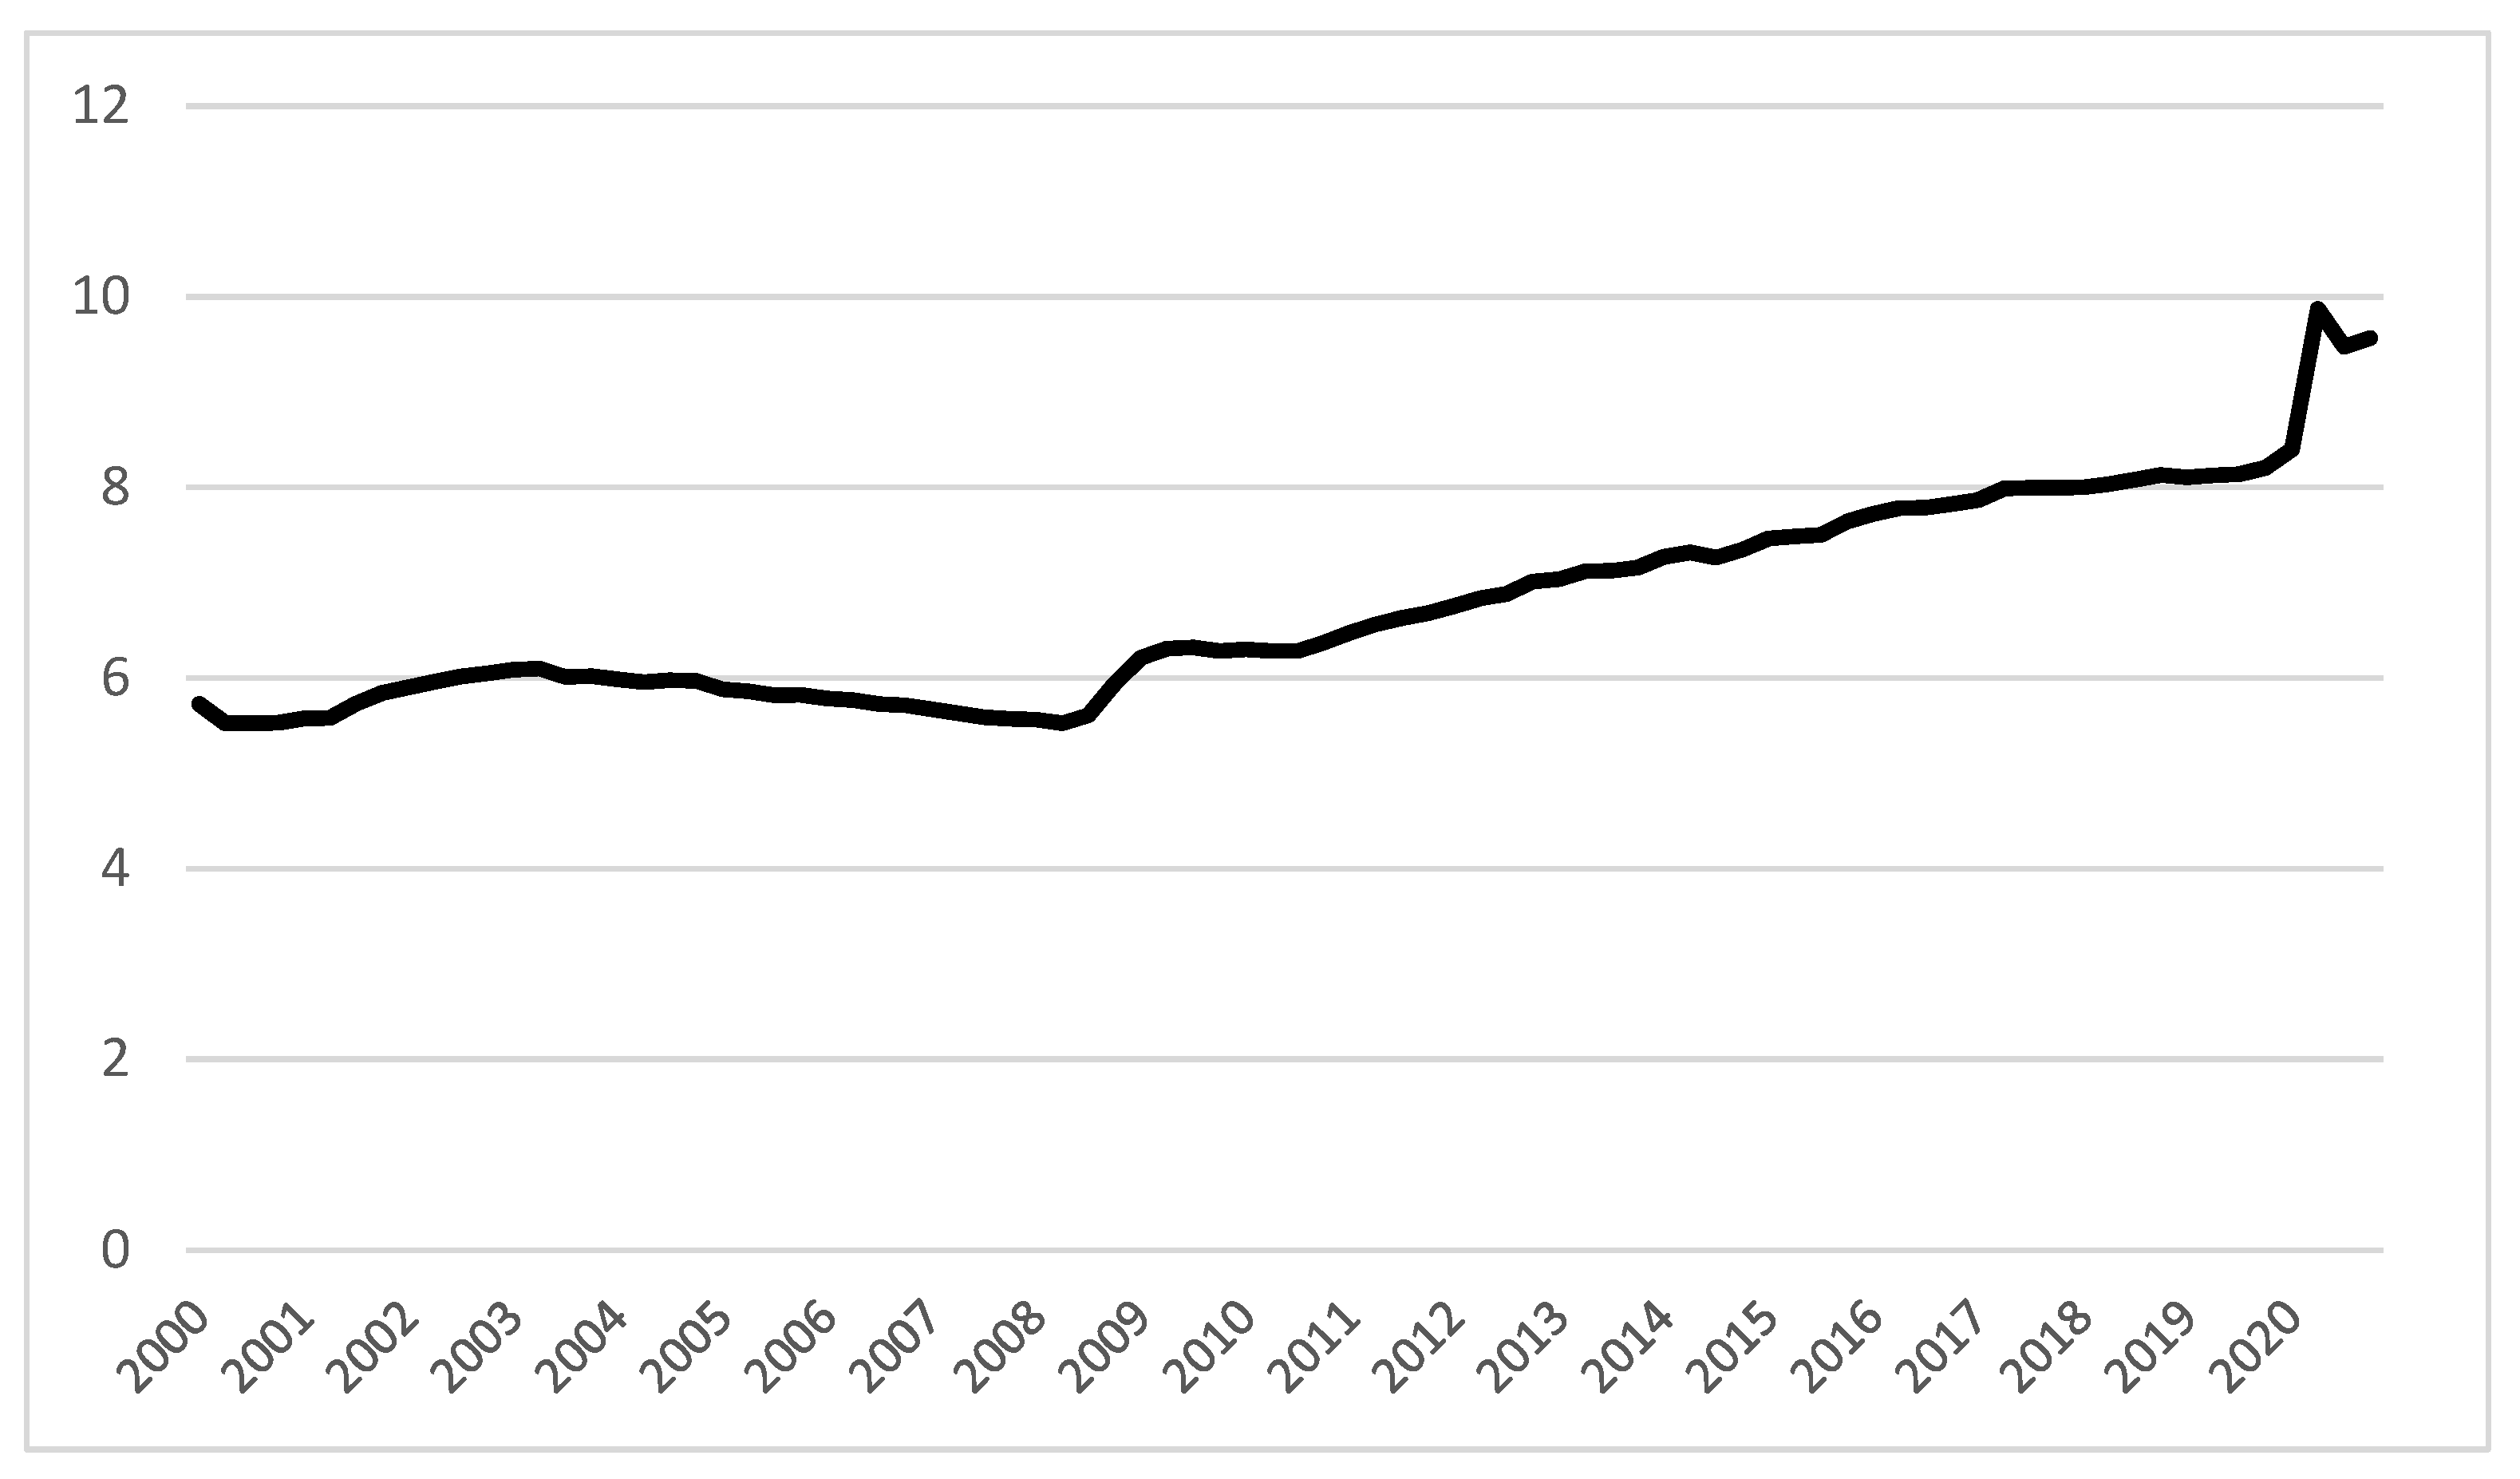
In the USA, the trend of an increasing share of cash in GDP started in 2008 (Figure 1). From this point until the outbreak of the COVID-19 pandemic, the ratio of cash to GDP increased from approximately 6% to 8%. Another abrupt increase occurred during the pandemic—temporarily to approximately 10% of GDP. Similar trends can be observed in other countries (Figure 2). In some countries, the upward trend began at the beginning of the 21st century.
In only 26 out of 124 countries (for which data on the value of the currency in circulation are available in the International Financial Statistics Database of the International Monetary Fund) can a decreasing share of cash in GDP be observed over the period 2001–2019 (IMF 2021). This mainly applies to countries at a low or medium-low level of development (e.g., Central African Republic, Chad, Bhutan, Kenya, and Mongolia). Among highly developed countries, a downward trend has occurred only in Israel, Sweden, Norway, and Denmark.
The COVID-19 pandemic has exacerbated this trend. Out of 113 countries for which data are available in the IMF International Financial Statistics, only in three cases has the cash/GDP ratio decreased (Guinea, Togo, and Angola) in 2020 compared to 2019. In all other countries, the data show an increase in the share of cash in GDP – and in many cases a significantly so (IMF 2021). As a consequence, the vast majority of countries show a higher cash/GDP ratio in 2020 than in 2001 (Figure 3).
3. Literature Review
A starting point for a discussion on the share of cash in GDP may be the extensive literature dealing with the relative costs and benefits of use of cash and non-cash payments, especially e-payments. Research in this area indicates in particular the importance of the availability of technical infrastructure, education, and age as determinants of the choice to use electronic payments (Bounie et al. 2016; Bagnall et al. 2018; Snellman et al. 2001; von Kalckreuth et al. 2014; Pietrucha and Maciejewski 2020). However, these conclusions can only be a starting point for further considerations. The decision to choose one form of money for transactions does not mean resignation from maintaining another form of money, and therefore does not necessarily mean a reduction in the demand for cash. Cash can also be kept for reasons other than transactional.
Beginning with Keynes (1936), the literature distinguishes three motives behind the demand for money—transactional, precautionary, and speculative. This theoretical framework allows us to organize the discussion on the understanding of the recent trends in the use of cash.
In the case of the demand from the transactional motive, the key determinant of the demand for money is the value of all transactions, and in macroeconomic terms, GDP. GDP growth may result in an increase in the demand for cash, even if its share in the total number of transactions decreases. Therefore, GDP should be controlled when examining the determinants of cash use, which in most studies is done directly (GDP is one of the control variables) or indirectly by expressing the amount of cash in circulation as a percentage of GDP. In the case of cash, the relative (compared to alternative payment methods) cost of obtaining cash is additionally of key importance; similarly, so is the convenience of making e-payments. The research usually takes into account variables such as the number of ATMs per capita (ease of obtaining cash) or the availability of other electronic payment infrastructure (e.g., internet access). Due to the fact that the propensity to make non-cash payments is related to age and education, these variables should also be controlled for when the subject of interest is demand for cash from a transactional motive.
Speculative demand for money is the holding of money for the purpose of avoiding losses from holding other assets such as bonds or stocks. This is the case when rates of return are expected to decline. More generally, the interest rate is assumed to be the determinant. Its decline means a decline in the opportunity cost of holding cash. The last of the Keynesian motives for the demand for money is the precautionary one. The demand for money from the precautionary motive is traditionally defined as that part of the demand for money that does not result from scheduled payments, but instead from the uncertainty resulting from the scale of payments that will have to be made. In terms of use and holding cash, it can also be interpreted as that part of the demand for money which (in the case of multiple payment methods) results from maintaining an additional cash balance for unpredictable cases when it is not possible to use the preferred form of payment. It can be assumed that the decision on the amount of the balance kept for this reason depends, inter alia, on the perception of the impossibility of making a payment by the preferred form of payment. The uncertainty associated with this does not have to be constant over time (e.g., depending on sociocultural factors) but may fluctuate significantly in times of crisis. Unfortunately, in the theory of money demand, the demand for the precautionary motive is reduced to a specific variation of the transaction demand.
As already mentioned, the empirical literature on the sources of the sudden increase in the share of cash in GDP is relatively scarce (e.g., Armelius et al. 2021; Ashworth and Goodhart 2020b; Jobst and Stix 2017a, 2017b; Liñares-Zegarra and Willesson 2021; Reimers et al. 2020; Titova et al. 2021). Contrary to the literature on the choice of payment method (where, as mentioned above, the transactional approach is dominant), this stream of empirical research also considers the use of cash for non-transactional reasons.
Most studies emphasize the crucial role of the interest rate (Amromin and Chakravorti 2009; Arvidsson 2019; Ashworth and Goodhart 2020b; Jobst and Stix 2017a; Liñares-Zegarra and Willesson 2021). Liñares-Zegarra and Willesson (2021) additionally indicate that this effect is stronger in countries applying negative interest rates. Bech et al. (2018) showed that this relationship is true mainly for large-value banknotes used as a means of storage. Most often, however, it is emphasized that although the decline in interest rates after the 2007+ crisis is a significant determinant, it does not fully explain the increase in demand for cash (Ashworth and Goodhart 2020b; Jobst and Stix 2017a).
Two other explanations for the increase in the share of cash in GDP indicated in the literature are crises in the real sector and financial crises. The main argument regarding the consequences of the crisis in the real sector (GDP decline) is that there is an incomplete immediate adjustment by economic agents to changes in the real sector. Friedman and Schwartz (1963) in A Monetary History of the United States indicate that if we assume that economic agents react to permanent income rather than current income, then they will maintain surplus cash reserves in periods of GDP decline. Therefore, the level of maintained cash relative to the current GDP will grow, as economic agents will not adjust their demand for money to the decline in GDP (Jobst and Stix 2017a). Unfortunately, there are no studies that systematically verify this issue.
Financial crises, periods of financial system instability, and banking panic can increase the interest in cash as it is seen as a relatively safe reserve asset. Both the Great Depression of the 1930s and the 2007+ crisis resulted in an increase in the share of cash in circulation in major economies (Jobst and Stix 2017a). Jobst and Stix (2017a) examined the effects of the banking crises related to the 2007–8 financial crisis, finding an increase in the share of cash in major developed economies. However, they caution that only a small number of economies were hit by the 2008 banking crisis. In a further study by Jobst and Stix (2017b), where they also took into account the financial crises that occurred before 2008, the authors came to the conclusion that the crises may partially explain the upward trend in cash. A similar conclusion is reached by Rösl and Seitz (2021) examining the consequences of the 2007+ crisis. However, these studies only refer to selected financial crises (mostly only to 2007+ crisis).
A simultaneous narrative analysis of trends in the use of cash and events that increase uncertainty may indicate that changes in the demand for cash may result from using cash as a safe asset in a period of increased uncertainty. The importance of uncertainty in this context is nothing new in the theory of money and has been considered in many classical works on the demand for money. For example, J.M. Keynes, in a 1937 article, emphasized the role of uncertainty and factors such as trust, and saw money as a “protective device against unpredictable adverse events” when he defined the demand for money resulting from the precautionary motive (Keynes 1937; Cardim de Carvalho 2010). Friedman and Schwartz (1963) also emphasized the role of uncertainty in the demand for cash: “The more uncertain the future, the greater the value of flexibility [of cash] and hence the greater the demand for money is likely to be”, quoted after Jobst and Stix (2017b).
Although the hypothesis about the role of uncertainty seems very attractive as a potential explanation of trends in the use of cash, it has not been confirmed by empirical research so far. To some extent, this is due to the difficulty of measuring uncertainty. Uncertainty is measured using data from financial markets (Ozturk and Sheng 2017) or the text mining of press materials (Baker et al. 2016). Two studies (Bech et al. 2018; Shirai and Sugandi 2019) did not show the impact of uncertainty measured with data from financial markets on the amount of currency in circulation. However, the indicator based on information from financial markets does not fully reflect the essence of the problem related to the impact of uncertainty on the behavior of economic agents (both households and most non-financial enterprises) regarding the maintenance of cash. From this point of view, indicators based on the overtone of press materials may better characterize the incentives for a wide group of economic actors. Unfortunately, the uncertainty index based on the analysis of press materials was available for only a few countries, mainly for large developed economies. Only the recently published index prepared by the International Monetary Fund (Ahir et al. 2018) gives an opportunity to systematically include the issue of uncertainty in research on the growing importance of cash.
Several studies have considered institutional and cultural variables. Liñares-Zegarra and Willesson (2021) did not obtain a statistically significant relationship for the variable “rule of law” from the World Bank’s Worldwide Governance Indicators database. However, the sample included only EU countries (i.e. homogeneous countries from the point of view of this indicator) and therefore this result is difficult to interpret. Armelius et al. (2021) also did not obtain confirmation of the impact of the quality of regulation from the same database. However, there is not enough research on this subject to draw any unequivocal conclusions.
Two potential determinants of the trends in the share of cash in circulation that are difficult or impossible to be empirically verified should be mentioned: the shadow economy and privacy.
The informal economy was the main argument in the discussions on the cash-free economy proposals, which found its final expression in the widely discussed book by K. Rogoff, The Curse of Cash (Rogoff 2016). Therefore, it is often postulated that limiting cash payments could be a remedy for the shadow economy. Apart from the above narrative considerations (usually difficult to empirically confirm), from the point of view of the role of the shadow economy in the growing trends in the use of cash, another issue is of key importance. The fact that cash is used (and its modern cryptocurrency alternatives) in illegal transactions and in the shadow economy is beyond doubt. In the context of trends in the share of cash in GDP, it is not, however, whether and to what extent cash is used in the shadow economy (which is obvious), but whether the shadow economy is actually what explains the upward trend in the cash/GDP ratio. In other words, in order for the shadow economy to explain the upward trend and its acceleration during a pandemic, the value of unregistered (cash) transactions would have to increase significantly during this period, and faster than GDP.
Empirical research on the informal economy is difficult due to the difficulties in measuring it. It is usually assumed that the shadow economy is correlated with other variables, such as self-employment, unemployment, tax rates or the share of taxes in GDP (Medina and Schneider 2018; Reimers et al. 2020). These variables are then used to estimate the unobservable size of the shadow economy. Therefore, it is not particularly surprising that the few studies on the role of the shadow economy in the upward trend of cash show inconclusive results. In some studies, the importance of the shadow economy for cash demand is not confirmed (Jobst and Stix 2017a; Takala and Viren 2010) or the results are mixed (Deutsche Bundesbank 2019; Seitz et al. 2018). The role of the shadow economy has been confirmed in various studies (Ashworth and Goodhart 2020a, 2020b; Cevik 2020; Reimers et al. 2020). In all these studies, the Multiple Indicator-Multiple Cause (MIMIC) model was adopted, and the authors adopted the share of the self-employed in total employment, VAT rates, and cigarette consumption as variables allowing estimates of the shadow economy. The above attempts show both the difficult-to-cross problems related to the gray economy estimates and the ambiguity of the relationship between the shadow economy and the increase in the share of cash in GDP.
Another discussed determinant of the use of cash is privacy. Sometimes the social benefits of losing the anonymity of the transaction are emphasized (Rogoff 2016). As a result of the use of electronic payments, it is easier to combat illegal activities, terrorist activities, and tax crimes. However, in the case of individual calculations, the issue of privacy has become increasingly important in recent years. Concerns in this regard cannot be limited to issues related to illegal and socially unacceptable activities. There is a whole group of reasons for the reluctance to disclose one’s preferences/behaviors/lifestyle that are not related to illegal or socially unacceptable activity. Starting from the reluctance to disclose data with marketing value, through important spheres of life (e.g., health data with a potential impact on employment), to psychological issues (reluctance to be a “public person”). In recent years, there has been a growing conviction that, unlike Rogoff’s argument, “not all of the privacy provided by cash is bad, and if cash disappears we will need new ways of providing that privacy” (Kahn 2018). Unfortunately, as a qualitative variable, privacy is extremely difficult to measure and there are no comparable data for a wide range of countries. As a consequence, there are no empirical studies in which attempts are made to quantify the relationship between privacy and the trends in the use of cash observed in recent years.
Table 1 summarizes key determinants of the cash/GDP ratio in the current empirical research.
The pandemic period was characterized by an intensification of previous medium-term trends. The scale of payments made by households with the use of electronic payment instruments has increased significantly. This was due to both concerns about health safety (information about the possibility of virus transmission via banknotes) and changes in consumer behavior, including the increase in online shopping (Ardizzi et al. 2020; Jonker et al. 2020; Kotkowski and Polasik 2021; Wisniewski et al. 2021). At the same time, however, cash maintenance has increased significantly. Both the data and analyses of central banks indicate that during the pandemic, especially in its first months, the demand for cash increased significantly (Bank of England 2020; Chen et al. 2021). Unfortunately, there are no studies yet that explain this phenomenon in the context of COVID-19. Cevik (2020) examined the effects of earlier pandemics and showed that the spread of infectious diseases (such as ebola and SARS) lowers demand for physical cash. However, we saw the opposite effect in the initial period of COVID-19. It is too early for now to draw conclusions from in-depth empirical cross-sectional research due to the limited scope of available data. It can only be assumed that the potential mechanisms are probably the same in this case as those verified in studies relating to medium-term phenomena (loosening of monetary policy, uncertainty, real economy shock).
4. Data Sources and Research Methodology
The dependent variable is the nominal cash in circulation as a share of nominal GDP, which is frequently used in the literature (Armelius et al. 2021; Cevik 2020). Using the share of nominal cash in circulation in nominal GDP is beneficial for three reasons. First, it eliminates the need of using the current exchange rate to convert monetary aggregates from the national currency to dollars, so that the data can be comparable between countries, as they do, for example in Jobst and Stix (2017a). Second, the cash/GDP ratio is adjusted for inflation, which means that a possible inflationary increase in the nominal amount of currency in circulation does not distort the results. Third, the main determinant of demand from a transaction motive is implicitly controlled. The increase in the cash/GDP ratio should be interpreted as a faster increase in the demand for cash than the increase resulting from the transaction motive alone.
The explanatory variables were selected in accordance with the literature. These include: technical infrastructure (represented by the use of the internet and number of ATMs), level of education (represented by the number of years of formal education), age (represented by the percentage of the population aged 65 and over). The interest rate (bank deposit interest rate) is a measure of the opportunity cost of holding cash. Due to the significance of crises in the real sector as postulated in the literature, the growth of real GDP was taken into account. Data on financial crises is taken from Systemic Banking Crises Database II (Laeven and Valencia 2020). Based on these data, several indicators of financial crises were created—from the simplest (dummy variable, 1 for the country affected by the crisis in a given year), to variables taking into account the long memory of the crisis. A variable showing tensions in the world economy was created separately—the number of crises in a given year. Obtaining or estimating reliable data on the informal economy is difficult for a wide range of countries and over a long period of time. Therefore, the study does not include the informal economy. As a substitute, a corruption indicator was considered, being more easily accessible and at the same time showing informal processes in the economy. Control of corruption (from Worldwide Governance Indicators) captures perceptions of the extent to which public power is exercised for private gain, including both petty and grand forms of corruption, as well as “capture” of the state by elites and private interests.
The standard set of variables was extended to include the measure of monetization of the economy and the index of financial development. Monetization is defined as the share of a broad monetary aggregate in GDP. From the point of view of studying the role of cash, taking into account monetization is important due to the fact that a larger share of cash in GDP should be expected in more monetized economies ceteris paribus. In other words, if the broad money/GDP ratio increases, the share of cash in GDP can be expected to increase in parallel (according to the principle that “a rising tide lifts all boats”). Thus, monetization allows for the inclusion of general trends in the money supply in the study. This is especially important in times of loose monetary policy, which result in many economies increasing the total money supply.
To capture the level of financial development we use the Financial Development Index (FDI) created by the IMF. The FDI is a composite index taking into account three dimensions of financial development: depth, access, and efficiency. The main intuition behind this is that in more developed systems the use and holding of cash is less necessary. Most studies to date use a simple measure of technical infrastructure. However, this approach does not reflect all the technical and banking factors that determine the use of cash. Hence, expanding the range of variables to include financial development seems to be the appropriate approach.
An index published by the IMF—the World Uncertainty Index (WUI) —was used as a measure of uncertainty. For the first time, this indicator makes it possible to conduct an empirical study for a wide group of countries. In parallel, the IMF published another indicator—the World Pandemic Uncertainty Index (WPUI). In both cases, the indices were created using text mining techniques in IMF documents (Economist Intelligence Unit reports). More on the index methodology is available in Ahir et al. (2018).
Research on the role of institutions typically uses publicly available databases containing variables representing the rule of law, economic freedoms, quality of governance, and control of corruption. This study used the World Bank’s Worldwide Governance Indicators database. Rule of law captures perceptions of the extent to which agents have confidence in and abide by the rules of society, and in particular the quality of contract enforcement, property rights, the police, and the courts, as well as the likelihood of crime and violence. Political stability and absence of violence/terrorism measure perceptions of the likelihood of political instability and/or politically motivated violence, including terrorism.
Information on the definition of variables and the data sources is presented in Table 2.
The panel includes data for the period of 2001–2020 for 82 countries. The full list of the countries is presented in Appendix A. Both the time scope and the number of countries are limited primarily by the availability of data. Annual data were transformed into 3-year non-overlapping averages (2-year for the first period). Thus, seven periods were obtained. There were two reasons for this decision. First, using averages instead of annual data can reduce the impact of short-term random events. Such data transformation is often undertaken in macroeconomic research when it is necessary to eliminate very short-term events. Second, the use of averages instead of annual data reduces the technical problems associated with too many instruments, which are usually among the more serious problems in studies using GMM estimators. The use of 3-year or 5-year non-overlapping averages is a standard approach, especially in studies using GMM estimators (Williams 2018; Ramírez-Rondán et al. 2020; Acedański and Pietrucha 2019; Breunig and Majeed 2020; Pietrucha and Żelazny 2017).
The process is dynamic, i.e., the cash/GDP ratio is determined by the previous realization of the share of cash in GDP. This phenomenon is due to the fact that the use of cash is largely dependent on payment habits. The transfer of payment habits from period to period causes the subsequent values of the cash/GDP ratio to be strongly correlated. An adequate methodological approach in this case is to assume that the panel is dynamic, which can be written as:
where i is the index country and t the index 3-year time periods, Y denotes cash/GDP, and X is the vector of independent variables.
Yit = γYit−1 + Xit + uit
In the case of dynamic panels, the standard OLS estimator is inconsistent. The standard estimators used for static panels (such as FE, RE) fail to account for dynamics in the dynamic panel data models. This is due to the fact that the lagged dependent variable becomes endogenous (correlated with error term). The difference GMM estimator attributed to Arellano and Bond (1991) and system GMM estimator (Arellano and Bover 1995) address most of the issues related to dynamic panels. Both are estimators designed for small T (time dimension), large N (cross-sectional dimension) panels, when a left-hand-side variable is dynamic, depending on its own past realizations (Baltagi 2021; Roodman 2009). However, the AB (difference) estimator deteriorates, especially when Y exhibits a substantial persistence, i.e., γ is close to unity. Finally, taking into account the characteristics of the database, we used the system estimator, robust standard errors of estimation, and a small sample correction. The set of instruments consists of a lagged dependent variable (GMM-style instrument) and other regressors (IV-style instruments). In all interpretations, 0.05 was used as the standard level of statistical significance.
Unbiased estimation requires the absence of second-order serial correlation in the error term. To test this requirement, we performed the Arellano-Bond AR(2) test. Secondly, to test the validity of the instruments, we performed the Hansen test (Sargan test in cases where the robust estimation did not apply). GMM estimates can suffer from instrument proliferation problems. However, as a result of using 3-year non-overlapping averages instead of annual data, the number of instruments does not exceed the rule of thumb that the number of instruments should not exceed the number of groups. In addition, the Hansen test can also be used as an indicator of a possible proliferation problems—too large a p-value (close to 1) indicates an incorrect model specification (Roodman 2009).
5. Results
The research started with the group of variables most frequently postulated in the literature: internet access, age, education, and interest rate (Table 3, Model 1). From this group, only the interest rate (assuming a standard significance level of 0.05) can be interpreted as a variable showing an impact on the share of cash in GDP. Other variables—such as age, education, and internet access are not statistically significant. The share of cash in GDP is also not dependent on the level of GDP per capita (Table 3, model 2).
It is worth noting the high value of the autocorrelation of the explained variable with its lagged value, which means that the share of cash in GDP is determined especially by past values of this variable. This result is maintained in all other estimates.
Two variables that have not been studied so far in the context of the share of cash in GDP were also taken into account. Both the monetization of the economy and the level of financial development can be interpreted as determinants of the cash/GDP ratio (Table 3, model 3). The growing monetization of the economy supports the increase in the share of cash in GDP. This is consistent with the intuition that an increase in the total money supply to GDP may be accompanied by an increase in the share of cash in GDP. Improving the level of financial development, in turn, favors a decrease in the share of cash in circulation, which is also relatively easy to explain. The scope and availability of banking services in contemporary banking systems is conducive to decisions to limit the use and maintenance of cash.
In the next step, the hypotheses concerning the significance of crises in the real sector (Table 4, model 4) and financial crises (Table 4, model 5 and 6) were tested. The change in real GDP has statistically significant effects on the share of cash in GDP. The negative sign of this relationship should be interpreted as meaning that the share of cash in GDP increases (decreases) in periods of GDP decline (growth). Therefore, it is a mechanism consistent with delayed adjustment of monetary reserves to changes in GDP, as described by M. Friedman and A. Schwartz.
The significance of the financial crises cannot be confirmed. Their role was studied both with the use of a variable showing the occurrence of a crisis in a given economy (model 5) and a variable showing the number of crises in a given year in the world economy (model 6). Additionally (calculations are not presented), other approaches to financial crises and longer memory of the crisis (moving average) were experimented with; in all cases the results were not statistically significant and cannot be interpreted.
Then the significance of the uncertainty was examined. The uncertainty measured by the WUI indicator does not show any relation to the share of cash in circulation (Table 5 model 7). A similar result was obtained for the uncertainty related to political instability (Table 5 model 8).
Control of corruption shows a negative relationship with the cash/GDP ratio, which is in line with the intuition that in countries with higher corruption, the use of cash is more widespread (Table 5 model 9).
The significance of the institution in the research represented by the rule of law is noteworthy (Table 5 model 10). Contrary to previous (sparse) studies, this institutional variable shows a statistically significant relationship with the cash/GDP ratio: the higher the rating of the institution quality in the Worldwide Governance Indicators database, the smaller the share of cash in GDP.
Several additional calculations were performed to test the sensitivity of the obtained results. First of all, it was verified whether the results depended on the choice of 3-year averages instead of annual data. The use of annual data causes the number of instruments to increase dramatically. Therefore, it is necessary to take measures aimed at limiting the number of instruments. It was decided to use the collapse option (Roodman 2009). As a result, the number of instruments was not too large and the model passed the Hansen test. The results (Table 6) do not show any significant differences from the results obtained with the use of 3-year averages. In particular, the results for the interest rate, financial development, monetization, and GDP growth were confirmed. However, the results in Table 3, Table 4 and Table 5 should be preferred to these results.
6. Discussion
The above results partially confirm the results of previous research and partially provide new information. The significant role of the drop in interest rates in explaining the growing share of cash in GDP was confirmed. Therefore, questions arise about the sources of the decline in interest rates that caused the increase in the cash/GDP ratio. Two parallel processes took place during this period. First, the switch by the central banks to an ultra-loose monetary policy involving the reduction of the central banks’ interest rates close to zero, as well as unconventional measures, especially in providing additional liquidity to the economy (Joyce et al. 2012; Feldkircher et al. 2021; Kisel’akova et al. 2020; Papadamou et al. 2020). Second, the interest rate policy of central banks coincided with the ongoing downward trend in long-term interest rates and the equilibrium interest rate. There is discussion about the causes of the latter process, but it is usually attributed to the phenomenon of secular stagnation, demographic trends, and an imbalance in the market for loanable funds or between savings and investments (Del Negro et al. 2019; Demertzis and Viegi 2021; Yi and Zhang 2017).
Therefore, the first explanation for the growing share of cash in GDP is the ultra-loose monetary policy after 2007 and a drop in interest rates of the central banks to close to zero or negative. Besides the decline in the opportunity cost of holding cash (due to close to zero or negative interest rates), the additional liquidity provided by central banks due to loose liquidity policies (quantitative easing) may have identical effects. The monetization of the economy shows the general scope of the use of money in the economy, including cash. The positive sign of the relationship between monetization and the cash/GDP ratio can be interpreted from the point of view of loose monetary policy of central banks. These policies, especially non-standard measures such as quantitative easing, increase the money supply. Therefore, the results show that the increase in cash/GDP may be partially a side effect of the increase in the total money supply and the loose monetary policy of central banks. The monetization results therefore support the conclusion regarding the role of monetary policy.
However, the above conclusions require additional comment. The results can be interpreted as evidence that the increase in cash/GDP ratio is a side effect of the loose monetary policy of central banks. This interpretation is not wrong but needs to be supplemented. The increase in the share of cash in GDP began in many countries before 2008, and therefore before the year of the start of loose monetary policy. Thus, the issue should not be considered only from the point of view of the current interest rate policy of the central banks. Long-term interest rates and investment returns started to decline well before 2008 (Del Negro et al. 2019; Demertzis and Viegi 2021). This decline has been visible in many countries since the 1990s and in some countries even since the early 1980s. Considering the opportunity cost of holding cash solely as the side effect of central bank interest rates policy is therefore insufficient and can be confusing. The results reflect rather two parallel processes: a downward trend in interest rates and a loose monetary policy after the 2007+ crisis.
A noteworthy result is the key role of the relationship with delayed cash/GDP ratio values. This means a significant inertia in the use of cash resulting from payment habits. However, if this result is interpreted from the point of view of the research objective, it should be said that this process in itself does not increase the share of cash in GDP, but constitutes the initial state for the impact of other variables.
An interesting result of the research is also the role of financial development and monetization of the economy as control variables. Taking monetization into account allows the overall trends of the money supply in holding cash to be controlled. If the broad money/GDP ratio increases, it can be expected that the share of cash in GDP will increase in parallel (“a rising tide lifts all boats”).Thus, the positive sign obtained in the study is in line with expectations. In turn, a higher level of financial development usually means a greater prioritization of non-cash payments (and therefore the negative sign is as expected). An aggregate measure of financial development should therefore complement the standard set of control variables. The hypothesis about the incomplete adjustment of the cash holding to changes in GDP was also confirmed. Therefore, periods of strong decline or growth of GDP will result in changes in the cash/GDP ratio.
The results do not confirm the financial crises as a source of increased interest in cash. These results, however, may not be surprising. As mentioned in the literature review, the arguments about the role of the crises are mostly narrative in nature, stemming from case studies or a narrow group of countries. For example, although the 2007 crisis was a shock to most economies, only a few of them had the nature of a financial crisis. The trend of cash/GDP growth applies to most economies. Additionally, if you look at the main argument—bank panic—this argument seems to be misleading in the modern banking system. Due to the developed micro-prudential policy, extensive deposit guarantee schemes and the lack of significant examples of loss of savings due to bank failures in recent years, societies may not be sensitive to the temporary effects of financial crises (i.e., the effects on the use of cash).
Contrary to the previous (sparse) studies in the studied sample, the quality of institutions is related to trends in the share of cash in GDP. This result, different from those of previous studies, can be explained by a relatively wide and diverse sample that also includes developing countries (as opposed to, for example, only EU countries in previous studies). Highly aggregated measures of institutions are usually difficult to interpret. The definition of institutions and their role is currently carried out within the framework of the institutional economy; in this case they are understood as rules (including legal regulations), while their role becomes to guarantee the ordering of property rights, compliance with contracts and the reduction of corruption. The institutional environment within this research approach is a factor that determines the type of activities undertaken by entities. In line with this understanding of institutions, the aggregate measures of institutions show the scope of adjusting formal rules to their normatively defined functions, i.e., to a certain institutional pattern that defines the “quality” of the institution. For the variable included in this study, it is especially the extent to which agents have confidence in and abide by the rules of society, and in particular the quality of contract enforcement. Returning to the interpretation of the obtained results, it can only be said that a higher assessment of the quality of an institution is conducive to reducing interest in cash. This is probably due to the fact that in a safer and more stable institutional environment, cash is less needed as an asset to be kept just in case, i.e., for precautionary reasons. However, this hypothesis requires verification in further studies using microdata.
The hypothesis regarding the importance of uncertainty could not be confirmed. The WUI ratio is not related to the cash/GDP ratio. This hypothesis, attractive from the point of view of surprising trends in the use of cash, is therefore still not empirically confirmed. However, the use of the aggregate approach in research has some drawbacks and it certainly does not provide a complete picture of the phenomenon under study. This is especially true of the potential significance of uncertainty. The use of indicators such as WUI implies the assumption that the level of perceived uncertainty felt by economic agents (including households) is well described by changes in the index describing the uncertainty seen in the economy by academic economists who prepare reports for the IMF. As in the case of indicators based on market data, this significantly narrows the understanding of perceived uncertainty, and in particular the uncertainty felt by households. This issue certainly requires further research and the role of uncertainty in decisions about holding cash seems to be still open.
Funding
This research received no external funding.
Institutional Review Board Statement
Not applicable.
Informed Consent Statement
Not applicable.
Data Availability Statement
Available upon request.
Conflicts of Interest
The author declares no conflict of interest.
Appendix A. List of Countries in Alphabetical Order
Albania, Algeria, Angola, Armenia, Australia, Azerbaijan, Bangladesh, Belarus, Bolivia, Bosnia and Herzegovina, Botswana, Brazil, Bulgaria, Cambodia, Canada, Chile, Colombia, Costa Rica, Cote d’Ivoire, Croatia, Czech Republic, Denmark, Dominican Republic, Egypt, Arab Rep., Georgia, Ghana, Guatemala, Guinea-Bissau, Haiti, Honduras, Hungary, Indonesia, Israel, Jamaica, Japan, Kazakhstan, Kenya, Korea, Rep., Kuwait, Kyrgyz Republic, Malaysia, Mali, Mexico, Moldova, Mongolia, Morocco, Mozambique, Myanmar, Namibia, New Zealand, Nicaragua, Niger, Nigeria, North Macedonia, Norway, Pakistan, Papua New Guinea, Paraguay, Peru, Philippines, Poland, Qatar, Romania, Russian Federation, Rwanda, Senegal, Sierra Leone, South Africa, Sri Lanka, Sweden, Switzerland, Tajikistan, Tanzania, Thailand, Togo, Turkey, Uganda, Ukraine, United Kingdom, United States, Uruguay, Zambia.
References
- Acedański, Jan, and Jacek Pietrucha. 2019. Level and Dynamics of Financial Depth: Consequences for Volatility of GDP. Applied Economics 51: 3389–400. [Google Scholar] [CrossRef]
- Ahir, Hites, Nicholas Bloom, and Davide Furceri. 2018. The World Uncertainty Index. SSRN Scholarly Paper. Available online: https://papers.ssrn.com/sol3/papers.cfm?abstract_id=3275033 (accessed on 11 October 2021). [CrossRef] [Green Version]
- Amromin, Gene, and Sujit Chakravorti. 2009. Whither Loose Change? The Diminishing Demand for Small-Denomination Currency. Journal of Money, Credit and Banking 41: 315–35. [Google Scholar] [CrossRef]
- Ardizzi, Guerino, Andrea Nobili, and Giorgia Rocco. 2020. A Game Changer in Payment Habits: Evidence from Daily Data During a Pandemic. SSRN Electronic Journal. [Google Scholar] [CrossRef]
- Arellano, Manuel, and Olympia Bover. 1995. Another look at the instrumental variable estimation of error-components model. Journal of Econometrics 68: 29–51. [Google Scholar] [CrossRef] [Green Version]
- Arellano, Manuel, and Stephen Bond. 1991. Some tests of specification for panel data: Monte Carlo evidence and an application to employment equations. Review of Economic Studies 58: 277–97. [Google Scholar] [CrossRef] [Green Version]
- Armelius, Hanna, Carl Andreas Claussen, and Andre Reslow. 2021. Withering Cash: Is Sweden Ahead of the Curve or Just Special? Working Paper Series, no. 393; Stockholm: Sveriges Riksbank. [Google Scholar]
- Arvidsson, Niklas. 2019. Building a Cashless Society: The Swedish Route to the Future of Cash Payments. Springer Briefs in Economics. Cham: Springer International Publishing. [Google Scholar] [CrossRef] [Green Version]
- Ashworth, Jonathan, and Charles A. E. Goodhart. 2020a. Coronavirus Panic Fuels a Surge in Cash Demand. CEPR Discussion Paper No. DP14910. London: Centre for Economic Policy Research. [Google Scholar]
- Ashworth, Jonathan, and Charles A. E. Goodhart. 2020b. The Surprising Recovery of Currency Usage. International Journal of Central Banking 16: 39. [Google Scholar]
- Auer, Raphael, Giulio Cornelli, and Jon Frost. 2020. Covid-19, Cash, and the Future of Payments. BIS Bulletin 3: 1–9. [Google Scholar]
- Bagnall, John, David Bounie, Kim P. Huynh, Anneke Kosse, Tobias Schmidt, and Scott Schuh. 2018. Consumer Cash Usage: A Cross-Country Comparison with Payment Diary Survey Data. International Journal of Central Banking 46. [Google Scholar]
- Baker, Scott R., Nicholas Bloom, and Steven J. Davis. 2016. Measuring Economic Policy Uncertainty. The Quarterly Journal of Economics 131: 1593–636. [Google Scholar] [CrossRef]
- Baltagi, Badi H. 2021. Econometric Analysis of Panel Data, 6th ed. Springer Texts in Business and Economics. Cham: Springer International Publishing. [Google Scholar] [CrossRef]
- Bank of England. 2020. Cash in the Time of Covid|Bank of England. Bank of England Quarterly Bulletin No. 4. London: Bank of England. [Google Scholar]
- Bech, Morten Linnemann, Umar Faruqui, Frederik Ougaard, and Cristina Picillo. 2018. Payments Are A-Changin’ but Cash Still Rules. BIS Quarterly Review 1: 67–80. [Google Scholar]
- Bounie, David, François Abel, and Waelbroeck Patrick. 2016. Debit Card and Demand for Cash. Journal of Banking & Finance 73: 55–66. [Google Scholar] [CrossRef]
- Breunig, Robert, and Omer Majeed. 2020. Inequality, Poverty and Economic Growth. International Economics 161: 83–99. [Google Scholar] [CrossRef]
- Cardim de Carvalho, Fernando J. 2010. Uncertainty and Money: Keynes, Tobin and Kahn and the Disappearance of the Precautionary Demand for Money from Liquidity Preference Theory. Cambridge Journal of Economics 34: 709–25. [Google Scholar] [CrossRef]
- Cevik, Serhan. 2020. Dirty Money: Does the Risk of Infectious Disease Lower Demand for Cash? International Finance 23: 460–71. [Google Scholar] [CrossRef]
- Chen, Heng, Walter Engert, and Kim P. Huynh. 2021. Cash and COVID-19: The Effects of Lifting Containment Measures on Cash Demand and Use. Staff Discussion Paper No. 3. Ottawa: Bank of Canada. [Google Scholar]
- Del Negro, Marco, Domenico Giannone, Marc P. Giannoni, and Andrea Tambalotti. 2019. Global Trends in Interest Rates. Journal of International Economics 118: 248–62. [Google Scholar] [CrossRef]
- Demertzis, Maria, and Nicola Viegi. 2021. Low Interest Rates in Europe and the US: One Trend, Two Stories. Policy Contribution 7: 1–19. [Google Scholar]
- Deutsche Bundesbank. 2019. Cash Demand in the Shadow Economy. Monthly Report 3: 43–48. [Google Scholar]
- Feldkircher, Martin, Florian Huber, and Michael Pfarrhofer. 2021. Measuring the Effectiveness of US Monetary Policy during the COVID-19 Recession. Scottish Journal of Political Economy 68: 287–97. [Google Scholar] [CrossRef]
- FRED. 2021. Federal Reserve Economic Data. Available online: https://fred.stlouisfed.org/ (accessed on 30 September 2021).
- Friedman, Milton, and Anna Jacobson Schwartz. 1963. A Monetary History of the United States, 1867–1960. Princeton: Princeton University Press. [Google Scholar]
- IMF. 2021. International Monetary Fund International Financial Statistics. Available online: https://data.imf.org (accessed on 30 September 2021).
- Jiang, Janet Hua, and Enchuan Shao. 2020. The Cash Paradox. Review of Economic Dynamics 36: 177–97. [Google Scholar] [CrossRef]
- Jobst, Clemens, and Helmut Stix. 2017a. Doomed to Disappear? The Surprising Return of Cash across Time and across Countries. CEPR Discussion Paper Series, DP12327; London: Centre for Economic Policy Research, pp. 1–58. [Google Scholar]
- Jobst, Clemens, and Helmut Stix. 2017b. Is Cash Back? Assessing the Recent Increase in Cash Demand. SUERF Policy Note 19. Wien: The European Money and Finance Forum, pp. 1–12. [Google Scholar]
- Jonker, Nicole, Carin van der Cruijsen, Michiel Bijlsma, and Wilko Bolt. 2020. Pandemic Payment Patterns. SSRN Electronic Journal. [Google Scholar] [CrossRef]
- Joyce, Michael, David Miles, Andrew Scott, and Dimitri Vayanos. 2012. Quantitative Easing and Unconventional Monetary Policy—An Introduction. The Economic Journal 122: F271–F288. [Google Scholar] [CrossRef] [Green Version]
- Kahn, Charles M. 2018. The Threat of Privacy. Journal of Financial Market Infrastructures 1: 1–16. [Google Scholar] [CrossRef]
- Keynes, John M. 1936. The General Theory of Employment, Interest and Money. London: Palgrave MacMillan. [Google Scholar]
- Keynes, John M. 1937. The General Theory of Employment. The Quarterly Journal of Economics 51: 209–23. [Google Scholar] [CrossRef]
- Kisel’akova, Dana, Paulina Filip, Erika Onuferova, and Tomas Valentiny. 2020. The Impact of Monetary Policies on the Sustainable Economic and Financial Development in the Euro Area Countries. Sustainability 12: 9367. [Google Scholar] [CrossRef]
- Kotkowski, Radoslaw, and Michal Polasik. 2021. COVID-19 Pandemic Increases the Divide between Cash and Cashless Payment Users in Europe. Economics Letters 209: 110139. [Google Scholar] [CrossRef]
- Laeven, Luc, and Fabian Valencia. 2020. Systemic Banking Crises Database II. IMF Economic Review 68: 307–61. [Google Scholar] [CrossRef]
- Liñares-Zegarra, José M., and Magnus Willesson. 2021. The Effects of Negative Interest Rates on Cash Usage: Evidence for EU Countries. Economics Letters 198: 109674. [Google Scholar] [CrossRef]
- Medina, Leandro, and Friedrich Schneider. 2018. Shadow Economies Around the World: What Did We Learn Over the Last 20 Years? IMF Working Papers WP/18/17. Washington, DC: International Monetary Fund. [Google Scholar] [CrossRef]
- Ozturk, Ezgi, and Xuguang Sheng. 2017. Measuring Global and Country-Specific Uncertainty. IMF Working Paper WP/17/219. Washington, DC: International Monetary Fund. [Google Scholar]
- Papadamou, Stephanos, Costas Siriopoulos, and Nikolaos A. Kyriazis. 2020. A Survey of Empirical Findings on Unconventional Central Bank Policies. Journal of Economic Studies 47: 1533–77. [Google Scholar] [CrossRef]
- Pietrucha, Jacek, and Grzegorz Maciejewski. 2020. Precautionary Demand for Cash and Perceived Risk of Electronic Payments. Sustainability 12: 7977. [Google Scholar] [CrossRef]
- Pietrucha, Jacek, and Rafał Żelazny. 2017. Interdependence of Innovations and Institutions: Consequences for GDP Growth. Ekonomista 5: 17. [Google Scholar]
- Ramírez-Rondán, Nelson Rafael, Marco E. Terrones, and Andrea Vilchez. 2020. Does Financial Sector Development Affect the Growth Gains from Trade Openness? Review of World Economics 156: 475–515. [Google Scholar] [CrossRef]
- Reimers, Hans-Eggert, Friedrich Schneider, and Franz Seitz. 2020. Payment Innovations, the Shadow Economy and Cash Demand of Households in Euro Area Countries. CESifo Working Paper No. 8574. Munich: CESifo, pp. 1–27. [Google Scholar]
- Rogoff, Kenneth S. 2016. The Curse of Cash. Princeton: Princeton University Press. [Google Scholar]
- Roodman, David. 2009. How to Do Xtabond2: An Introduction to Difference and System GMM in Stata. The Stata Journal 9: 86–136. [Google Scholar] [CrossRef] [Green Version]
- Rösl, Gerhard, and Franz Seitz. 2021. Cash and Crises: No Surprises by the Virus. IMFS Working Paper Series No. 150; Frankfurt: Institute for Monetary and Financial Stability, pp. 1–16. [Google Scholar]
- Seitz, Franz, Hans-Eggert Reimers, and Friedrich Schneider. 2018. Cash in Circulation and the Shadow Economy: An Empirical Investigation for Euro Area Countries and Beyond. CESifo Working Papers No. 7143. Munich: CESifo, pp. 1–20. [Google Scholar]
- Shirai, Sayuri, and Eric Alexander Sugandi. 2019. Growing Global Demand for Cash. International Business Research 12: 60–74. [Google Scholar] [CrossRef] [Green Version]
- Snellman, Jussi S., Jukka M. Vesala, and David B. Humphrey. 2001. Substitution of Noncash Payment Instruments for Cash in Europe. Journal of Financial Services Research 19: 131–45. [Google Scholar] [CrossRef]
- Takala, Kari, and Matti Viren. 2010. Is Cash Used Only in the Shadow Economy? International Economic Journal 24: 525–40. [Google Scholar] [CrossRef]
- Titova, Yulia, Delia Cornea, and Sébastien Lemeunier. 2021. What Factors Keep Cash Alive in the European Union? De Economist 169: 291–317. [Google Scholar] [CrossRef]
- van der Cruijsen, Carin, and Joris Knoben. 2021. Ctrl+C Ctrl+Pay: Do People Mirror Electronic Payment Behavior of Their Peers? Journal of Financial Services Research 59: 69–96. [Google Scholar] [CrossRef]
- von Kalckreuth, Ulf, Tobias Schmidt, and Helmut Stix. 2014. Choosing and Using Payment Instruments: Evidence from German Microdata. Empirical Economics 46: 1019–55. [Google Scholar] [CrossRef] [Green Version]
- Williams, Kevin. 2018. Has the Finance–Growth Link Been Broken? Panel Data Evidence from Latin America and the Caribbean. EconomiA 19: 404–23. [Google Scholar] [CrossRef]
- Wisniewski, Tomasz Piotr, Michal Polasik, Radosław Kotkowski, and Andrea Moro. 2021. Switching from Cash to Cashless Payments during the COVID-19 Pandemic and Beyond. SSRN Electronic Journal. [Google Scholar] [CrossRef]
- Yi, Kei-Mu, and Jing Zhang. 2017. Understanding Global Trends in Long-Run Real Interest Rates. Economic Perspectives 2: 1–20. [Google Scholar]
- Zamora-Pérez, Alejandro. 2021. The Paradox of Banknotes: Understanding the Demand for Cash beyond Transactional Use. ECB Economic Bulletin 2. Frankfurt am Main: European Central Bank. [Google Scholar]


Table 1.
Key determinants of the cash/GDP ratio in the current empirical research.
| Variable | Relationship | Remarks |
|---|---|---|
| technical infrastructure for cashless payments | - | a well-confirmed relationship in numerous studies on the choice of the type of payment |
| demographic characteristics: | a well-confirmed relationship in numerous studies on the choice of the type of payment | |
| age | + | |
| education | - | |
| interest rate | - | a well-confirmed relationship in numerous studies |
| crises in the real sector | + | no systematic empirical research |
| financial crisis | no relationship/+ | ambiguous results mainly related to the 2007–8 crisis |
| uncertainty | no relationship | a few empirical studies using data from financial markets; no research using other measures of uncertainty |
| institutional order | no relationship | a few empirical studies |
Table 2.
Definition of variables and the data sources.
| Variable | Definition | Source |
|---|---|---|
| cash/GDP | cash in circulation as a share of nominal GDP (national currency) | cash in circulation: IMF international financial statistics, national central banks GDP: World Bank, WDI |
| GDP per capita | logarithm of gross domestic product per capita, PPP | World Bank, WDI |
| GDP growth | real GDP change y2y, national currency | World Bank, WDI |
| age | population aged 65 and above (% of total population) | World Bank, WDI |
| internet | individuals using the internet (% of population) | World Bank, WDI |
| ATM | ATMs per 100,000 adults | IMF international financial statistics |
| education | mean years of schooling (years) | UNDP |
| financial crises | dummy variable (1 for crisis) number of the crises in the year | Systemic Banking Crises Database II (Laeven and Valencia 2020) |
| interest rate | nominal deposit interest rate | World Bank, WDI |
| monetization | broad money (% of GDP) | MFW International Financial Statistics |
| financial development | Financial Development Index | MFW, Financial Development Database |
| political stability | political stability and absence of violence/terrorism | World Bank, Worldwide Governance Indicators |
| corruption | control of corruption | World Bank, Worldwide Governance Indicators |
| rule of law | rule of law | World Bank, Worldwide Governance Indicators |
| uncertainty | World Uncertainty Index | IMF, World Uncertainty Index |
Table 3.
Results (I).
| 1 | 2 | 3 | |||||||
|---|---|---|---|---|---|---|---|---|---|
| Coef. | Std. Err. | p-Value | Coef. | Std. Err. | p-Value | Coef. | Std. Err. | p-Value | |
| cash/GDP (L1.) | 1.040 | 0.036 | 0.000 | 1.040 | 0.036 | 0.000 | 0.996 | 0.045 | 0.000 |
| ATM | −0.002 | 0.002 | 0.308 | −0.002 | 0.002 | 0.300 | 0.000 | 0.001 | 0.934 |
| education | 0.024 | 0.050 | 0.639 | 0.025 | 0.052 | 0.637 | 0.067 | 0.057 | 0.244 |
| age | −0.004 | 0.026 | 0.863 | −0.004 | 0.025 | 0.864 | −0.001 | 0.024 | 0.971 |
| internet | −0.003 | 0.004 | 0.474 | −0.003 | 0.004 | 0.491 | −0.003 | 0.004 | 0.383 |
| interest rate | −0.074 | 0.022 | 0.001 | −0.074 | 0.023 | 0.002 | −0.073 | 0.027 | 0.008 |
| GDP per capita | −0.013 | 0.068 | 0.850 | ||||||
| monetization | 0.013 | 0.006 | 0.028 | ||||||
| financial development | −2.610 | 0.994 | 0.010 | ||||||
| number of obs. | 491 | 491 | 491 | ||||||
| number of groups | 82 | 82 | 82 | ||||||
| number of instruments | 20 | 21 | 22 | ||||||
| AB (1) p-value | 0.008 | 0.008 | 0.008 | ||||||
| AB (2) p-value | 0.541 | 0.541 | 0.498 | ||||||
| Hansen test p-value | 0.110 | 0.108 | 0.101 | ||||||
Note: Dependent variable is cash/GDP ratio, cash/GDP (L1.) is lagged dependent variable.
Table 4.
Results (II).
| 4 | 5 | 6 | |||||||
|---|---|---|---|---|---|---|---|---|---|
| Coef. | Std. Err. | p-Value | Coef. | Std. Err. | p-Value | Coef. | Std. Err. | p-Value | |
| cash/GDP (L1.) | 0.991 | 0.044 | 0.000 | 0.997 | 0.043 | 0.000 | 0.998 | 0.042 | 0.000 |
| interest rate | −0.068 | 0.024 | 0.006 | −0.077 | 0.025 | 0.003 | −0.074 | 0.024 | 0.003 |
| monetization | 0.011 | 0.005 | 0.043 | 0.012 | 0.005 | 0.034 | 0.012 | 0.005 | 0.034 |
| financial development | −2.386 | 0.847 | 0.006 | −2.302 | 0.852 | 0.008 | −2.255 | 0.825 | 0.008 |
| GDP growth | −0.052 | 0.019 | 0.007 | ||||||
| financial crises | 0.270 | 0.276 | 0.331 | ||||||
| number of financial crises | 0.001 | 0.012 | 0.946 | ||||||
| number of obs. | 492 | 492 | 492 | ||||||
| number of groups | 82 | 82 | 82 | ||||||
| number of instruments | 19 | 19 | 19 | ||||||
| AB (1) p-value | 0.060 | 0.060 | 0.060 | ||||||
| AB (2) p-value | 0.381 | 0.413 | 0.483 | ||||||
| Hansen test p-value | 0.151 | 0.078 | 0.095 | ||||||
Note: Dependent variable is cash/GDP ratio, cash/GDP (L1.) is lagged dependent variable.
Table 5.
Results (III).
| 7 | 8 | 9 | 10 | |||||||||
|---|---|---|---|---|---|---|---|---|---|---|---|---|
| Coef. | Std. Err. | p-Value | Coef. | Std. Err. | p-Value | Coef. | Std. Err. | p-Value | Coef. | Std. Err. | p-Value | |
| cash/GDP (L1.) | 0.992 | 0.044 | 0.000 | 0.987 | 0.044 | 0.000 | 0.976 | 0.048 | 0.000 | 0.974 | 0.048 | 0.000 |
| interest | −0.069 | 0.024 | 0.005 | −0.072 | 0.024 | 0.003 | −0.076 | 0.024 | 0.002 | −0.077 | 0.025 | 0.002 |
| monetization | 0.011 | 0.005 | 0.046 | 0.011 | 0.005 | 0.032 | 0.012 | 0.005 | 0.032 | 0.012 | 0.005 | 0.028 |
| financial development | −2.373 | 0.854 | 0.007 | −2.217 | 0.803 | 0.007 | −1.586 | 0.674 | 0.021 | −1.240 | 0.637 | 0.055 |
| GDP growth | −0.048 | 0.018 | 0.011 | −0.052 | 0.018 | 0.006 | −0.052 | 0.018 | 0.006 | −0.053 | 0.018 | 0.005 |
| uncertainty | 0.717 | 2.339 | 0.760 | |||||||||
| political stability | −0.133 | 0.077 | 0.087 | |||||||||
| corruption | −0.304 | 0.136 | 0.028 | |||||||||
| rule of law | −0.428 | 0.160 | 0.009 | |||||||||
| number of obs. | 492 | 492 | 492 | 492 | ||||||||
| number of groups | 82 | 82 | 82 | 82 | ||||||||
| number of instruments | 20 | 20 | 20 | 20 | ||||||||
| AB (1) p-value | 0.060 | 0.060 | 0.050 | 0.060 | ||||||||
| AB (2) p-value | 0.391 | 0.374 | 0.369 | 0.408 | ||||||||
| Hansen test p-value | 0.142 | 0.153 | 0.142 | 0.142 | ||||||||
Note: Dependent variable is cash/GDP ratio, cash/GDP (L1.) is lagged dependent variable.
Table 6.
Additional results.
| 11 | 12 | 13 | |||||||
|---|---|---|---|---|---|---|---|---|---|
| Coef. | Std. Err. | p-Value | Coef. | Std. Err. | p-Value | Coef. | Std. Err. | p-Value | |
| cash/GDP (L1.) | 1.003 | 0.027 | 0.000 | 0.977 | 0.027 | 0.000 | 0.990 | 0.025 | 0.000 |
| ATM | −0.001 | 0.001 | 0.325 | ||||||
| education | 0.041 | 0.021 | 0.053 | ||||||
| age | −0.011 | 0.011 | 0.290 | ||||||
| internet | −0.002 | 0.002 | 0.221 | ||||||
| interest rate | −0.023 | 0.009 | 0.010 | −0.026 | 0.009 | 0.003 | −0.023 | 0.008 | 0.004 |
| monetization | 0.006 | 0.003 | 0.061 | 0.008 | 0.003 | 0.018 | 0.007 | 0.003 | 0.037 |
| financial development | −1.160 | 0.571 | 0.046 | −1.005 | 0.372 | 0.008 | −1.323 | 0.486 | 0.008 |
| GDP growth | −0.055 | 0.010 | 0.000 | −0.055 | 0.010 | 0.000 | −0.054 | 0.010 | 0.000 |
| corruption | −0.151 | 0.071 | 0.035 | ||||||
| uncertainty | 0.358 | 0.697 | 0.610 | ||||||
| number of obs. | 1558 | 1558 | 1558 | ||||||
| number of groups | 82 | 82 | 82 | ||||||
| number of instruments | 59 | 56 | 56 | ||||||
| AB (1) p-value | 0.035 | 0.032 | 0.033 | ||||||
| AB (2) p-value | 0.353 | 0.348 | 0.355 | ||||||
| Hansen test p-value | 0.167 | 0.156 | 0.163 | ||||||
Note: Dependent variable is cash/GDP ratio, cash/GDP (L1.) is lagged dependent variable.
Publisher’s Note: MDPI stays neutral with regard to jurisdictional claims in published maps and institutional affiliations. |
© 2021 by the author. Licensee MDPI, Basel, Switzerland. This article is an open access article distributed under the terms and conditions of the Creative Commons Attribution (CC BY) license (https://creativecommons.org/licenses/by/4.0/).
Share and Cite
MDPI and ACS Style
Pietrucha, J. Drivers of the Cash Paradox. Risks 2021, 9, 227. https://doi.org/10.3390/risks9120227
AMA Style
Pietrucha J. Drivers of the Cash Paradox. Risks. 2021; 9(12):227. https://doi.org/10.3390/risks9120227
Chicago/Turabian StylePietrucha, Jacek. 2021. "Drivers of the Cash Paradox" Risks 9, no. 12: 227. https://doi.org/10.3390/risks9120227
APA StylePietrucha, J. (2021). Drivers of the Cash Paradox. Risks, 9(12), 227. https://doi.org/10.3390/risks9120227
Note that from the first issue of 2016, this journal uses article numbers instead of page numbers. See further details here.