Article

Human-Centred Design Meets AI-Driven Algorithms: Comparative Analysis of Political Campaign Branding in the Harris–Trump Presidential Campaigns

by
Hedda Martina Šola
1,2,*,
Fayyaz Hussain Qureshi
1 and
Sarwar Khawaja
3
1
Oxford Centre For Applied Research and Entrepreneurship (OxCARE), Oxford Business College, 65 George Street, Oxford OX1 2BQ, UK
2
Institute for Neuromarketing & Intellectual Property, Jurja Ves III Spur no 4, 10000 Zagreb, Croatia
3
SK Hub The Atrium, 1 Harefield Road, Uxbridge UB8 1PH, UK
*
Author to whom correspondence should be addressed.
Informatics 2025, 12(1), 30; https://doi.org/10.3390/informatics12010030
Submission received: 30 December 2024 / Revised: 10 March 2025 / Accepted: 13 March 2025 / Published: 18 March 2025

Abstract

:
This study compared the efficacy of AI neuroscience tools versus traditional design methods in enhancing viewer engagement with political campaign materials from the Harris–Trump presidential campaigns. Utilising a mixed-methods approach, we integrated quantitative analysis employing AI’s eye-tracking consumer behaviour metrics (Predict, trained on 180,000 screenings) with an AI-LLM neuroscience-based marketing assistant (CoPilot), with 67,429 areas of interest (AOIs). The original flyer, from an Al Jazeera article, served as the baseline. Professional graphic designers created three redesigned versions, and one was done using recommendations from CoPilot. Metrics including total attention, engagement, start attention, end attention, and percentage seen were evaluated across 13–14 areas of interest (AOIs) for each design. Results indicated that human-enhanced Design 1 with AI eye-tracking achieved superior overall performance across multiple metrics. While the AI-enhanced Design 3 demonstrated strengths in optimising specific AOIs, it did not consistently outperform human-touched designs, particularly in text-heavy areas. The study underscores the complex interplay between neuroscience AI algorithms and human-centred design in political campaign branding, offering valuable insights for future research in neuromarketing and design communication strategies. Python, Pandas, Matplotlib, Seaborn, Spearman correlation, and the Kruskal–Wallis H-test were employed for data analysis and visualisation.

1. Introduction

Political neuromarketing is an emerging interdisciplinary field combining marketing, neuroscience, and psychology to analyse voter behaviour and perceptions of political leaders. It provides innovative methods for understanding complex phenomena such as voter engagement, political leadership, and party branding [1]. Political branding is a strategic tool encapsulating core values that guide and influence voter decision-making [2]. Research indicates that candidates perceived as more attractive are more likely to receive votes, with repeated exposure to visually appealing campaign materials amplifying this effect [3]. Images that emphasise trustworthiness and energy can significantly enhance a candidate’s appeal. For instance, visuals of candidates smiling or interacting with the public often create positive associations and strengthen voter connections [4]. The graphical representation of information can influence public opinion, as highlighting specific data points in graphs can significantly sway voter support for policies. Effective visual framing shapes perceptions and decision-making by directing attention to key aspects of the data [5]. Incorporating infographics into promotional advertisements improves message clarity and retention, resulting in higher voter engagement than traditional text-only formats. Visually appealing graphics simplify complex information, making it more accessible and memorable for the audience [6]. The 2016 U.S. presidential election showcased the influence of citizen typography, as distinctive and creative text styles played a key role in shaping candidates’ branding efforts. These typographic choices enhanced campaign messages’ visual identity and memorability, contributing to their overall impact [7]. Positive visual representations combined with compelling slogans effectively communicate and reinforce ideological messages during elections, enhancing voter engagement and recall [8]. Collaborative tools facilitating iterative design processes can enhance creativity and exploration, resulting in more engaging flyer designs. By fostering collaboration, these tools assist in overcoming creative obstacles and improving the overall quality of the designs [9]. A neuropsychological study on political slogans in outdoor advertising identified the most effective, mediocre, and ineffective slogans based on cognitive–emotional indicators. The study concluded that slogans should avoid specific motivational themes to create a strong psychological impact on voters [10]. Furthermore, eye-tracking research reveals selective exposure patterns, demonstrating that individuals tend to focus more on political advertisements that align with their pre-existing views and beliefs [11] and can also assess how images and text interact in political flyers, revealing the influence of visual cues on shaping partisan perceptions and directing voter attention towards key messages [12]. Subtle backdrop cues (SBCs) in political images can influence citizens’ perceptions of a politician’s political ideology and voting intentions [13]. While previous research has explored various aspects of political branding and voter engagement, there remains a significant gap in understanding the effectiveness of AI-driven design tools compared to traditional methods in enhancing viewer engagement with political campaign materials. This study aims to address this gap by comparing the efficacy of AI neuroscience tools versus conventional design methods in enhancing viewer engagement with political campaign materials from the Harris–Trump presidential campaigns.
This study investigates the following research question:
RQ: How can integrating AI-driven predictive models and creative insights improve political campaign designs by enhancing viewer attention, emotional engagement, and information retention?
This study employs a novel approach combining neuroscience AI eye-tracking (Predict) and AI-LLM neuroscience-based marketing assistant (CoPilot)-driven predictive modelling with human-centred design evaluation. This integrated framework offers a comprehensive evaluation tool for future neuromarketing and digital marketing research applications (See Figure 1). This study employs a cross-sectional design, which limits our ability to infer causality. Our findings indicate associations rather than causal effects.
The JND-SalCAR model (an advanced image quality prediction framework that enhances accuracy by integrating human psychophysical characteristics) improves image quality predictions by incorporating human psychophysical factors, such as visual saliency and just-noticeable-difference (JND), into its training process. Furthermore, research indicates that aligning artificial attention mechanisms with human gaze patterns enhances performance in tasks such as image classification and saliency prediction [14,15]. Eye-tracking studies are gaining prominence with advancements in technology, refined methodologies, and the increased accessibility of portable and cost-effective devices [16]. These studies provide critical insights into the cognitive mechanisms underlying decision-making. For instance, voters construct cognitive frameworks to process information from political flyers efficiently, with these frameworks influenced by their prior experiences and familiarity with the presented content [17].
The outcomes of this research have significant implications for both practical applications and future research directions in political campaign design. Firstly, the results will provide insights into the effectiveness of human expertise versus AI prediction behaviour-driven recommendations in achieving superior message clarity, particularly in textual content design. Secondly, the findings will contribute to refining AI neuroscience tools like Predict AI and CoPilot, potentially enhancing clarity without imposing additional cognitive load on viewers. Lastly, this research will inform the development of neuroscience AI-predictive human behaviour model-assisted design tools that complement human expertise, potentially leading to more effective and efficient design processes in political campaign branding.

1.1. Background and Hypotheses

1.1.1. A Review of Relevant Literature

Eye-tracking technology can effectively predict group membership and identify key stimuli, offering valuable insights for follow-up studies or saccade-based diagnostics in political science research [18]. The rise of data-driven campaigning highlights the importance of using sophisticated data analysis techniques, including AI, to understand voter preferences and behaviours. Eye-tracking data can be a valuable component of this approach, providing insights into how voters interact with campaign materials [19]. AI models can predict areas of visual attention without traditional eye-tracking technology, as demonstrated in health communication campaigns during the COVID-19 crisis. This approach can be adapted for political campaigns to quickly and accurately identify which elements of a message capture voter attention [20]. By leveraging deep learning algorithms, political campaigns can optimise visual content to ensure that key messages are prominently featured and likely to be noticed by voters, enhancing the overall impact of the campaign [20]. A study by Otto et al. [21] examined the causal link between emotional reactions to political information and attention to political news, revealing a dynamic relationship. Findings indicate that fluctuating emotions influence attention levels, suggesting that attention to political content varies across contexts as emotional responses shift. Previous research faces notable limitations when examining voter psychology and behaviour in political branding. These include small effect sizes, which limit the significance of findings, an inability to determine whether observed effects persist beyond immediate contexts, and a lack of control for external factors such as vocal characteristics and environmental influences [22]. Further investigation is required into the balance between visual and verbal communication in shaping voter decisions, particularly during extended broadcasts. Research should also examine how nonverbal signals from politicians, citizens, or media elicit emotional responses and how these emotions influence voter behaviour. The field offers significant potential for future discoveries [23]. In previous studies, there may be potential discrepancies between the objective and actual impact of communication campaigns, highlighting the need for qualitative research [24]. Additional research is necessary to determine if these findings apply to other multiparty systems, aiding in understanding their relevance in different political environments [25]. Another study does not provide direct evidence for the causal mechanism of the introspective neglect hypothesis; thus, future research should test this causal relationship. Additionally, measuring implicit and explicit attitudes earlier in the election process, when fewer respondents have made decisions, would facilitate further testing of the hypotheses [26]. Furthermore, there are notable gaps in academic literature, including under-researched areas and underdeveloped studies, highlighting the need for a more comprehensive exploration of specific topics. Adopting a multidisciplinary approach and incorporating theoretical frameworks from other disciplines could enhance the depth and scope of future research [27]. Recent research examines the potential of artificial intelligence (AI) tools to enhance viewer engagement with political content [28]. Political advertising demonstrates a positive and economically significant influence on candidates’ vote shares but does not impact overall voter turnout [29]. Slogans typically constitute the initial element subjects focus on when viewing an informational, political poster. Poster recall is maximised when combining positive slogans with negative images, underscoring the importance of tailoring designs to specific audiences for optimal effectiveness [30]. Utilising AI eye-tracking methodologies, researchers have demonstrated that combining involvement and emotional indicators effectively measures the emotional impact of advertisements. This approach can be applied to enhance the efficacy of political advertising [31]. By integrating eye-tracking data with other digital engagement metrics, campaigns can develop a comprehensive understanding of voter engagement and refine their strategies accordingly [19]. Party leaflets have been shown to boost voter turnout and shift the electorate’s composition in favour of the Conservative Party. However, they did not lead to an overall increase in voter turnout [32,33]. One of the most significant advantages of LLMs in political campaigns is their ability to facilitate microtargeting. By analysing voter data, LLMs can generate personalised messages that appeal to individual preferences and concerns. This level of personalisation is highly effective in political advertising, with studies indicating that personalised ads are more likely to influence voter attitudes than non-personalized ones [34]. LLMs can generate highly persuasive content to influence voter attitudes, often by exploiting emotional appeals rather than factual information. This has led to concerns about the spread of disinformation and the erosion of trust in political messaging [35,36].
Based on the research presented, the following hypotheses are proposed:
(H1). 
Political campaign flyers designed using Predict AI’s Co-Pilot will significantly enhance viewer engagement compared to traditional flyer design methods.
(H2). 
Integrating AI neuroscience tools and human expertise will significantly improve the creation of visually engaging content compared to using either approach alone, as measured by effectiveness and impact metrics.
Our research is based on four supporting hypotheses (H1a–H1d), as presented in Table 1.
(H1a). 
Political campaign flyers designed using Predict AI’s Co-Pilot will achieve higher initial attention scores (start attention) than traditionally designed flyers.
Integrating computational neuroscience into visual saliency models has revolutionised how political campaigns design promotional materials, particularly in presidential elections. The arrangement of elements in the flyer can guide the viewer’s eye movement. For instance, placing the candidate’s image on one side and the key message on the other can create a balanced composition that directs attention effectively [37]. The effectiveness of computational neuroscience in visual saliency models for political advertising can be measured by their ability to predict and influence voter behaviour. Eye-tracking studies have shown that viewers focus more on some aspects of a flyer, such as the candidate’s face or key messages, than others. By predicting these patterns, campaign strategists can design flyers that maximise the impact of these elements [38,39]. Neural signals, such as those measured by fMRI or EEG, can provide insights into how the brain processes visual information in political ads. For example, areas associated with emotion and memory are active when viewers are exposed to political ads, highlighting the importance of emotional appeals in political ads [40].
(H1b). 
Political campaign flyers designed with Predict AI’s Co-Pilot will elicit stronger emotional engagement, measured by higher end attention and lower cognitive demand scores.
Emotional appeals in political ads can influence voter behaviour by activating the brain’s reward system and creating a positive association with the candidate or party [40,41,42]. The use of visual rhetoric, such as metaphors and symbolic imagery, can convey complex political messages in a way that is both subtle and powerful [37].
(H1c). 
Political campaign flyers created using Predict AI’s Co-Pilot will have higher clarity scores than those designed using traditional methods, ensuring better comprehension of campaign messages.
Studies show that more straightforward ballot language increases processing fluency, leading to higher support for the measures presented. Conversely, complex language can result in opposition or abstention from voting [43]. Voters update their beliefs based on new information, with message clarity playing a role in how effectively this information is processed. Transparent and precise information can reduce framing effects and lead to more informed decision-making [44,45].
(H1d). 
Political campaign flyers designed with Predict AI’s Co-Pilot will result in higher viewer engagement, recall, and recognition scores than traditionally designed flyers.
Voters are more likely to believe and remember information that aligns with their pre-existing beliefs and comes from trusted sources [46].The emotional valence of a message, whether positive or negative, also affects recall, especially if it aligns with the voter’s political stance. This motivated cognition can lead to the selective retention of information that supports one’s political identity. Typography in political campaign materials can convey ideological perceptions and influence how the audience receives messages. Different typefaces can evoke specific emotions and associations, thereby affecting the overall impact of the campaign message [47]. The strategic use of visual variables, such as position, angle, and thickness in graphical representations, can highlight shifts in political landscapes and voter behaviour, as seen in the analysis of election results [48].

1.1.2. Theoretical Framework

This study adopts the Technology Acceptance Model (TAM) as its theoretical framework to examine the acceptance and effectiveness of AI-driven political campaign design.
TAM, initially proposed by Davis posits that the perceived usefulness and perceived ease of use of technology are primary determinants of its adoption and continued use [49]. These factors influence users’ behavioural intention (BI) to use a technology, affecting actual use (USE). Attitude toward using (ATU) was initially considered a central component of TAM, mediating the relationship between PEOU, PU, and BI. However, in later iterations like TAM2 and UTAUT, ATU was omitted to streamline the model. Despite this, recent studies suggest that ATU still plays a significant role in technology acceptance, particularly in voluntary use contexts [49,50].
In the context of AI-driven political campaign design, TAM provides a structured approach to understanding how voters perceive and interact with campaign materials created using AI algorithms. The model’s core constructs can be adapted as follows:
Perceived usefulness: The degree to which voters believe that AI-generated campaign materials provide relevant and valuable information. This is a critical factor in AI acceptance, directly impacting attitudes towards AI usage. In political campaigns, AI’s ability to enhance data-driven targeting and personalised messaging is perceived as highly useful, thereby increasing acceptance [51,52]. The paper validates an extended version of the Technology Acceptance Model (TAM) in the context of AI, identifying perceived usefulness as the strongest predictor of attitudes towards AI usage (β = 0.34, p < 0.001). Additionally, an AI mindset scale growth (β = 0.28, p < 0.001) and openness (β = 0.15, p < 0.001) significantly influence the perceived ease of use. These factors collectively shape acceptance, which can be applied to AI-driven political campaign design (Ibrahim et al., 2025 [51]).
The formula for a simple linear regression is as follows:
[Y = \beta_0 + \beta_1X_1 + \beta_2X_2 + \ldots + \beta_nX_n + \epsilon]
where
  • Y represents the dependent variable (e.g., attitudes towards AI usage).
  • β0 is the intercept.
  • β1, β2, …, βn are the coefficients for each independent variable (e.g., perceived usefulness, AI mindset).
  • X1, X2,…, Xn are the independent variables.
  • ϵ is the error term.
  • Predictors of AI usage: In the context of this study, perceived usefulness (β = 0.34) and AI mindset growth (β = 0.28) are significant predictors of attitudes towards AI usage [51].
  • Perceived ease of use: The extent voters find AI-generated campaign materials easy to understand and engage with. The ease with which campaign designers can integrate AI tools into their strategies affects their willingness to adopt these technologies. Simplified interfaces and user-friendly AI tools contribute to higher acceptance [53,54].
  • Trust in AI: Trust is essential for accepting AI-driven campaign design. Users need to trust that AI systems will perform reliably and ethically. Explainable AI (XAI) can enhance trust by making AI processes more transparent and understandable [55,56].
  • Attitude toward use: Voters’ overall evaluation of AI-generated campaign materials. In political campaigns, transparency can mitigate concerns about manipulation and privacy violations [52,56].
  • Behavioural intention: Voters’ likelihood of engaging with and being influenced by AI-generated campaign materials. The intention to use AI is influenced by the perceived usefulness, ease of use, and social influence. A positive behavioural intention towards AI adoption can lead to more widespread use in campaign design [55].
By applying TAM to this study, we can generate additional hypotheses:
(H3). 
The perceived usefulness of AI-generated campaign materials positively influences voters’ attitudes toward these materials.
(H4). 
The perceived ease of use of AI-generated campaign materials positively influences voters’ attitudes toward these materials.
This theoretical framework will guide the interpretation of results, helping elucidate the factors contributing to the effectiveness of AI-driven political campaign design. It will also provide insights into potential barriers to acceptance and areas for improvement in the human-centred design of AI-generated campaign materials.

2. Research Design

This study employed a mixed-methods approach, integrating quantitative analysis utilising AI’s eye-tracking consumer behaviour metrics (Predict) with neuroscience AI-LLM-driven interpretative analysis (CoPilot). While AI-driven analysis offers significant advantages, it raises ethical concerns regarding privacy and the potential for manipulation. Eye-tracking data must be carefully managed to ensure that it respects voter privacy and is used transparently [57]. AI-driven eye-tracking technology demonstrates exceptional accuracy, achieving 97–99% rates in capturing consumer attention, engagement, and cognitive demand data. This level of precision facilitates the comprehensive analysis of consumer interactions with visual stimuli, rendering it invaluable for predicting behaviour [58,59]. Furthermore, AI-LLM analysis enhances eye-tracking insights by providing a more profound understanding of cognitive and emotional factors that influence consumer decisions [60]. The research aimed to evaluate the efficacy of AI-neuroscience-driven design tools versus traditional design methods in enhancing viewer engagement with political campaign materials from the Harris–Trump presidential campaigns. LLMs have become a transformative force in political communication, enabling campaigns to craft persuasive and personalised messages. These models leverage vast datasets to generate text that aligns with specific voter segments’ values, beliefs, and concerns. For instance, LLMs can analyse voter data to identify key issues that resonate with particular demographics, allowing campaigns to tailor their messaging accordingly [61].

2.1. Novelty of the Approach

This study uniquely combines neuroscience AI-eye-tracking (Predict) and AI-LLM neuroscience-based marketing assistant (CoPilot)-driven predictive modelling with human-centred design evaluation, bridging consumer neuroscience, computational modelling, and creative design feedback. LLMs have been used to create synthetic content, such as political memes and visuals, which effectively engage voters on social media platforms. Research has shown that synthetic content mediated by AI can influence how political information is created and shared, often through absurd or provocative memes that capture attention and drive engagement [62]. The research investigates a novel hybrid methodology that combines predictive neuroscience AI insights with actionable creative recommendations, an infrequently employed political campaign analysis approach. Hybrid models utilising deep learning and invertible transformations facilitate the precise computation of predictive distributions. This capability enhances the accuracy of voter behaviour predictions by capturing intricate patterns within the data [63]. This integrated framework offers a comprehensive evaluation tool for future neuromarketing and digital marketing research applications. The study assesses and enhances viewer engagement, message clarity, attention allocation, and cognitive load by leveraging neuromarketing principles and design recommendations. This multifaceted approach provides complementary perspectives, contributing to a more nuanced understanding of campaign effectiveness and potential optimisation strategies. Comprehending the cognitive processes involved in message reception enables campaigns to adapt content to align with the mental capacities of their target audience. This congruence enhances message retention and comprehension, increasing campaign effectiveness [64].

2.1.1. AI-Powered Eye-Tracking Software

Predict (version 1.0), the AI eye-tracking software for predicting consumer behaviour, developed by Neurons and Stanford University, powered by the world’s largest neuroscience database (n = 200,000 data points collected using eye-tracking technology), was recorded upfront (Eye Tracker: Tobii X2-30, Tobii Pro AB, Danderyd, Sweden) and used for this study [65]. The effectiveness of AI-driven strategies also depends on the quality and representativeness of the data used. Campaigns must ensure that their data collection methods are robust and inclusive to avoid biases that could skew results [57]. The Predict software was constructed on a heterogenic sample size with a ratio of m/f of 50:50, aged 18–55, with global representation as follows: USA (35%), UK (20%), Nordics (20%), DACH (10%), Southern Europe (5%), Latin America (3%), Middle East (3%), Asia (2%), and Southeast Asia (2%), tested on tens of thousands of assets. Ethical requirements were fulfilled, as all tested subjects provided prior consent for using their data in the AI algorithm. Each participant contributes more than 4.6 million raw data points (which are converted into metrics, which provide even more data). This database comprises approximately 210 billion raw data points. A total of 85% of the data are from online testing, half completed with webcam eye tracking. These data are still lower in temporal resolution but yield approximately 15,000 data points per person, providing a database of over 3.8 million raw data points [65,66]. Importantly, this software trains AI models using reliable metrics. Its proprietary algorithm comprehensively analyses visual content to provide precise recommendations for improving viewer engagement and attention clarity. Predict was used to evaluate all flyer designs, generating key insights into how different design elements impacted visual attention, clarity, and cognitive demand. Key functionalities of Predict include effectively replacing testing on living humans by providing the insights in seconds instead of weeks in comparison with traditional eye-tracking studies, assessing attention distribution across key visual and textual elements (AOIs) and predicting visual attention with 95% accuracy compared to high-precision eye tracking.

2.1.2. CoPilot: A Neuroscience-Based AI Marketing Assistant

CoPilot, a neuroscience-based artificial intelligence (AI) large language model (LLM) marketing assistant, was utilised to generate creative insights through its multi-layer benchmark system. This system incorporates data from 67,429 areas of interest (AOIs) across 13,689 unique assets (7991 images), providing a robust foundation for evaluating design elements and optimising engagement [67]. CoPilot was explicitly employed to generate recommendations for the AI-enhanced flyer (Design 3), integrating its insights with professional graphic design expertise to produce a hybrid design. Key features of CoPilot include design benchmarking, which evaluates design elements against an extensive database of visual assets to identify areas for improvement. CoPilot’s insights are grounded in neuropsychology, neuroscience, and neuromarketing, drawing significantly from Dr. Thomas Zoëga Ramsøy’s work. CoPilot insights are powered by a large language model (AI), which has been enhanced with knowledge from Dr. Ramsøy’s publications [67]. CoPilot generates specific insights for each combination of metrics, AOIs, file types, exposure time frame, scoring categories, and purposes by analysing three steps: Firstly, asset performance ranges from very poor to excellent. This step determines the subsequent analysis and controls colour-coding. Secondly, based on the aforementioned performance category and selected purpose, CoPilot chooses the type of recommendation to provide: maintain performance, exceed the benchmark, or improve otherwise. Lastly, corresponding interpretations and recommendations are mapped out from a total of and generated based on the previous categorisations [67].

3. Materials and Methods

For this study, the original flyer was sourced from an Al Jazeera article titled “Trump-Harris First Presidential Debate: What to Watch For.” [68] (see Figure 2a). This design (labelled Design 0) served as the baseline for comparison, with three additional designs which were created: two redesigned versions (labelled Design 1 and Design 2) were produced using professional graphic design expertise (see Figure 2b,c) and based on his recommendations, and an experienced graphic designer also redesigned one design, labelled Design 3 (See Figure 2d), but with recommendations based on AI (CoPilot). This study utilises a cross-sectional design, comparing different flyer designs at a single point in time. While this approach allows for examining associations between design elements and viewer engagement, it does not permit causal inferences. The objective was to optimise viewer engagement by utilising neuromarketing principles. Neuromarketing research emphasises the pivotal role of visual attention in eliciting voter interest. Eye-tracking studies demonstrate that novelty is more significant in attracting attention to political advertisements than other traditionally emphasised elements [69]. By employing the advanced marketing neuroscience AI assistant tool (CoPilot) for recommendations and by measuring all four designs by AI eye-tracking for predicting human behaviour, this research investigated how neuroscience AI-driven design propositions can enhance attention-focused image quality prediction models, offering actionable insights for visual content optimisation. Attention-based models have significant practical applications in tasks such as image caption generation, wherein predicting visual attention facilitates more descriptive captions by emphasising spatial, spectral, and semantic details. This methodology enhances image quality score predictions to align more closely with human perception, thereby improving performance across large, distortion-diverse images [14,70]. These methods facilitate a comprehensive analysis of visual content and provide precise recommendations. Its advanced feature, CoPilot, evaluates design elements and suggests enhancements for improving viewer engagement, focus, attention, clarity, and cognitive demand, rendering it particularly valuable for applications in neuromarketing.
Neuroimaging studies emphasise the involvement of brain regions such as the thalamus and primary visual area in bottom-up attention and the dorsolateral prefrontal cortex in top-down attention. Understanding these neural systems can facilitate the design of images that effectively capture the viewer’s attention [64]. The progressive design changes applied to the political campaign flyers, detailing modifications, intended objectives, and design contributors, are outlined in detail (See Table 2). The modifications implemented in each flyer design were targeted and deliberate. All designs were created utilising Adobe Illustrator (version CC 2018). In Design 1, the candidate names (font: Montserrat SemiBold, size: 42.75 pt) and party text (font: Montserrat SemiBold, size: 28.47 pt) were enlarged, bolded, and colour-matched (Blue—#18345A and Red—#A81D46) to the election logo to emphasise key elements (see Figure 2b). Secondary text elements, such as body text and event details, were slightly reduced (font: Montserrat and sizes: 19 pt, 22 pt, and 25 pt) to improve focus on the primary components. The background behind the main headline, “Harris–Trump Presidential Debate”, was inverted from dark to light (White—#FFFFFF) for enhanced readability, and the overall background transitioned from black to white (White—#FFFFFF) and light grey (Light Grey—#E9EAEE) to create a more refined visual layout. The election logo remained in the same position as the original design (See Figure 2a). A secondary logo element was added behind the candidate images (size: 629.79 px × 587.319 px, colour: White—#FFFFFF) to subtly draw subconscious attention to their figures, which were also slightly enlarged to create more prominence. Subliminal cueing methods have been demonstrated to direct visual attention to real-world images effectively. Empirical studies utilising spatial, face, and object cues reveal that these cues can subtly guide attention to specific areas of an image without the viewer’s conscious awareness [71].
Visual imagery and perception share common neural mechanisms, relying on similar top-down connectivity. This correspondence suggests that subconscious attention may utilise predictive processes to simulate or anticipate visual experiences, influencing perception even without direct sensory input [72]). Official party icons (size: 34 px × 34 px, colour: White—#FFFFFF) were added adjacent to candidate names to reinforce party affiliation subtly. Design 2 (see Figure 2c) retained several improvements made in Design 1 (See Figure 2b) but implemented further refinements for balance. The headline background was inverted to grey (Dark Grey—#2A2C37) to reduce contrast and deemphasise the surrounding text slightly, ensuring the main headline remained visually dominant. The main headline, “Harris–Trump presidential debate”, was modified (size: 47.74 pt, colour: Light orange—#FDD2B5) and the text was altered (font: Montserrat, size: 22 pt and colour: White—#FFFFFF). The election logo’s position mirrored the original flyer’s (see Figure 2a), maintaining a familiar visual structure. Political campaigns frequently utilise visual elements to reinforce messages that align with voters’ pre-existing beliefs and biases. Familiarity with these visual components results in fewer and longer fixations, indicating a more efficient visual exploration process, as voters can process familiar designs more rapidly and with reduced cognitive effort [73,74]. Familiarity with visual elements results in fewer and longer fixations, indicating a more efficient visual exploration process. This suggests that users can process familiar designs more quickly and with less cognitive effort [75]. In Design 2, the party icons were removed. In Design 3 (see Figure 2d), created by a professional graphic designer based on AI CoPilot’s recommendations, dynamic candidate poses were featured to increase emotional engagement, and a patriotic-themed background was added to evoke a sense of national identity (See Figure 2d). Photographs of both candidates were obtained from official news media sources [76,77].
Dynamic poses in political imagery convey energy, confidence, and approachability, which can positively influence voter perceptions of a candidate’s personality and leadership qualities. Research suggests that how candidates’ personalities are portrayed during campaigns plays a crucial role in shaping their standing among the electorate [78]. Key visual elements were enhanced through headline styling (font: Montserrat, size: 47.74 pt, colour: Red—#A81D46), improved logo visibility, and carefully balanced text-to-image ratios. Official party icons (donkey for Democrats, elephant for Republicans) were added adjacent to candidates’ names to attract subliminal attention, reinforcing political affiliation. Neuromarketing research has demonstrated that voters’ visual attention is drawn to various elements of political advertisements, including logos. Political party logos frequently utilise specific colours subconsciously associated with certain ideologies, a phenomenon termed chromatic isomorphism. This enables voters to identify a party’s ideological position rapidly, although these associations may vary depending on the country and the party’s longevity [79,80]. Additionally, including a prominent election logo behind the candidates subtly emphasised the campaign’s central message, contributing to a visually cohesive and compelling presentation. Text elements were prioritised through bold styling (font: Montserrat SemiBold), while political affiliations were reinforced using colour-coded labels. The overall layout ensured a visually cohesive and compelling presentation. CoPilot’s recommendations for Design 3 highlight the actionable changes to optimise viewer engagement, attention clarity, and cognitive demand (See Appendix A Table A1).
Python (version 3.10.12) was the primary tool for data processing, statistical analysis, and visualisation. The precision pipeline for high-contrast imaging demonstrates Python’s capability to reduce data efficiently, providing expeditious processing and memory optimisation, which are essential for managing substantial volumes of data [81]. Specific libraries utilised included Pandas for data manipulation and organisation, particularly for managing the AOI-level scores across multiple designs; Matplotlib and Seaborn for creating visualisations, including line charts and scatter plots, to present AOI-level clarity and cognitive demand data; and SciPy for conducting statistical tests, such as the Spearman correlation and Kruskal–Wallis H-test. The Spearman correlation exhibits robustness to outliers and applies to ordinal data, rendering it versatile for diverse datasets. It demonstrates particular utility when the data do not fulfil the normality assumptions requisite for Pearson’s correlation [82]. The Spearman correlation can initially identify potential associations between variables in investigations involving multiple groups and variables, such as high-dimensional data analysis. These associations can subsequently be examined further, utilising the Kruskal–Wallis H-test to evaluate whether the differences in these associations are statistically significant across distinct groups [83]. Google Colab was the cloud-based development environment, facilitating the seamless execution of Python scripts and visualisations. Its collaborative features enabled efficient analysis and troubleshooting. To evaluate the representation of areas that elicited the most outstanding viewer attention across areas of interest (AOIs), 13 to 14 AOIs were selected in each design, encompassing candidate figures, titles, texts, and logos (See Figure 3). The AOIs chosen in each design, along with their corresponding identifiers, were established, and these identifiers will be utilised when referring to them in this research (See Table 3).

Statistical Analysis: ANOVA and Bonferroni Post-Hoc Test Results

The Bonferroni post-hoc test was employed following an analysis of variance (ANOVA) to ensure the reliability of pairwise comparisons between flyer designs for three key metrics: clarity (message comprehensibility), engagement (viewer interaction and sustained focus), and total attention (cumulative attention allocated across key areas of interest). The Bonferroni test has been adapted for neutrosophic statistics, which manage data with inherent uncertainty and indeterminacy, providing more flexible and informative post-hoc tests in uncertain environments [84]. Furthermore, pairwise comparisons are employed after an initial test, such as ANOVA, to evaluate the differences between all possible pairs of groups and identify which specific groups differ from each other [85]. Flyer designs for three key metrics: clarity (message comprehensibility), engagement (viewer interaction and sustained focus), and total attention (cumulative attention allocated across key areas of interest). This approach controls the family-wise error rate (FWER) by adjusting the significance threshold for multiple comparisons, thereby minimising Type I errors and enhancing statistical validity. The analysis aimed to identify significant differences across designs and provide actionable insights for optimising viewer engagement and message clarity. Data manipulation and statistical analyses were conducted using Python libraries, including Pandas, SciPy for ANOVA, and Statsmodels for Bonferroni corrections via Tukey’s Honest Significant Difference (HSD) test. Metrics were extracted at each design’s area of interest (AOI) level, encompassing 13 AOIs such as Main Headline, Candidate Figures, and Logos.
ANOVA results (Table 4) indicated no statistically significant differences across the four designs for clarity (F = 2.00 × 10⁻¹, p = 8.99 × 10⁻¹), engagement (F = 1.00 × 10⁻², p = 9.99 × 10⁻¹), or total attention (F = 4.00 × 10⁻², p = 9.88 × 10⁻¹), with p > 0.05 for all metrics. These findings suggest comparable performance across all four designs for the evaluated metrics. Pairwise comparisons revealed no statistically significant differences in clarity scores between design combinations (Table 5). For instance, the comparison between Design 0 and Design 1 yielded a mean difference of −9.70 × 10⁻¹ (p = 8.72 × 10⁻¹), while Design 2 and Design 3 showed a difference of −8.00 × 10⁻² (p = 9.99 × 10⁻¹). Similarly, engagement scores exhibited no significant differences between any pair of designs (Table 6), with the mean difference between Design 0 and Design 3 being −1.00 × 10⁻² (p = 1.00). Total attention scores also demonstrated no statistically significant differences between designs (Table 7), as exemplified by the comparison between Design 0 and Design 2 (mean difference = 5.60 × 10⁻¹, p = 9.98 × 10⁻¹). The ANOVA and Bonferroni results indicate that the four flyer designs are statistically comparable across all evaluated metrics—clarity (F = 2.00 × 10⁻¹, p = 8.99 × 10⁻¹), engagement (F = 1.00 × 10⁻², p = 9.99 × 10⁻¹), and total attention (F = 4.00 × 10⁻², p = 9.88 × 10⁻¹). The analysis revealed no statistically significant pairwise differences, indicating consistent performance across the evaluated designs. These results underscore the importance of robust statistical methods to ensure transparent and error-controlled assessments.
The application of the Bonferroni method validated the comparability of the designs and provided substantive evidence for the findings despite the absence of statistically significant differences. Future investigations could incorporate additional metrics or explore alternative design elements to uncover nuanced variations that may influence viewer engagement and message clarity. This methodological approach reinforced the reliability of the results, ensuring that the statistical conclusions remained valid and unaffected by random variation. The rigorous statistical analysis, mainly through implementing the Bonferroni method, substantiated the comparability of the designs and offered robust support for the observed outcomes.

4. Results

This study analysed viewer engagement across 13 areas of interest (AOIs) for four designs: the original design (Design 0), two human-modified designs (Designs 1 and 2), and an AI-enhanced design by the human designer based on the proposition of AI’s CoPilot (Design 3). The results are summarised in a heat map (See Figure 4), and the leading hypothesis (H1) and its supporting hypotheses are discussed. The AI-enhanced political promotional flyer (Design 3) created using Predict AI’s CoPilot demonstrated significant viewer engagement, particularly for key visual AOIs. The personalisation of political images constitutes a significant area of interest (AOI) that enhances viewer engagement. Emphasising individual political figures, such as party leaders, in visual communication facilitates establishing a personal connection with the audience. This phenomenon is particularly evident in election campaigns, where images of political leaders are prominently displayed to augment voter affinity [86]. However, the human-modified Design 1 exhibited superior overall engagement across a broader range of AOIs, achieving the highest engagement scores in seven out of 13 AOIs. This indicates the effectiveness of human design adjustments in enhancing viewer interaction. Robust emotional attachments to political candidates, as observed in the 2020 U.S. presidential election, can significantly predict voting behaviour. These affective connections frequently supersede more rational considerations, shaping voter preferences and influencing electoral outcomes [87]. Emotional engagement was notably strong for specific elements, with the Kamala Figure in Design 3 (9.39) and the Trump Figure in Design 2 (9.11) eliciting the highest responses. Design 1, however, displayed more balanced emotional engagement across multiple AOIs, including the Trump Figure (7.47), Kamala Figure (7.44), and Body Text On Top (4.66). Viewer engagement and recall were optimised in Design 1, which demonstrated superior performance across textual and peripheral AOIs. Eye-tracking studies reveal that political orientation influences the duration of attention given to political advertisements, indicating selective exposure to information congruent with one’s views [11]. Comprehending the equilibrium between textual and peripheral AOIs is crucial for making informed political design decisions. The strategic placement of visual elements alongside text directs attention and enhances message retention, optimising political communication’s overall efficacy [88]. This design achieved higher engagement scores for elements such as the main headline on the top (Score: 2.80), the US Elections Logo (1.00), and the Aljazeera logo (0.97). The heatmap analysis revealed that Design 1 attained the most balanced engagement across all AOIs, suggesting that human-driven design decisions were particularly effective in optimising visual attention. The results indicate that design decisions made by human experts were particularly efficacious in optimising visual attention, based on the previous AI eye-tracking screening with Predict. Artificial intelligence-driven eye-tracking technology, such as the ‘Predict’ software, monitors and optimises cognitive load by providing real-time feedback on viewers’ attention. Integrating artificial intelligence predictions with conventional eye-tracking data presents a robust approach to enhancing viewer outcomes [89]. These findings strongly support primary hypothesis H2, and partially support the primary hypothesis (H1) and its associated sub-hypotheses (H1b and H1d). This evidence underscores the significance of human expertise in the design process and its impact on attentional outcomes. Human–AI collaborations have demonstrated the capacity to generate solutions with greater strategic viability and higher overall quality than those created solely by humans, particularly in complex problem-solving contexts [90]. Research indicates that human AI co-creation, instead of merely editing AI-generated content, enhances creative self-efficacy and facilitates more innovative outcomes [91]. While Predict AI’s CoPilot excelled in optimising focal points, the human-modified Design 1 emerged as the most effective in balancing engagement across primary and secondary AOIs. This outcome underscores the potential synergy between neuroscience AI tools like Predict CoPilot and human expertise in creating visually engaging content. Generative AI tools have fundamentally altered the landscape of image generation by efficiently producing high-quality, diverse visual content, enabling creators to explore innovative possibilities while streamlining the content creation. Through the enhancement of output quality and variety, these tools facilitate designers’ focus on curatorial and strategic roles, thus fostering new opportunities for creativity and innovation [92,93].
The analysis of attention scores across 13 areas of interest (AOIs) for the four flyer designs (Design 0, Design 1, Design 2, and Design 3) reveals significant variations in viewer attention distribution. Visual saliency models, augmented with eye-tracking data, facilitate precise predictions of attention foci, thereby assisting designers in developing more engaging political flyers [94]. The visualised results (See Figure 5) provide crucial insights into the efficacy of design modifications in optimising viewer engagement and attention allocation. In the realm of political design, the concept of dynamic attention allocation can be particularly efficacious, as it facilitates the management of how individuals engage with biased news sources that either reinforce or challenge their pre-existing beliefs. Through the strategic guidance of attention, designers can influence the processing and interpretation of political messages [95].

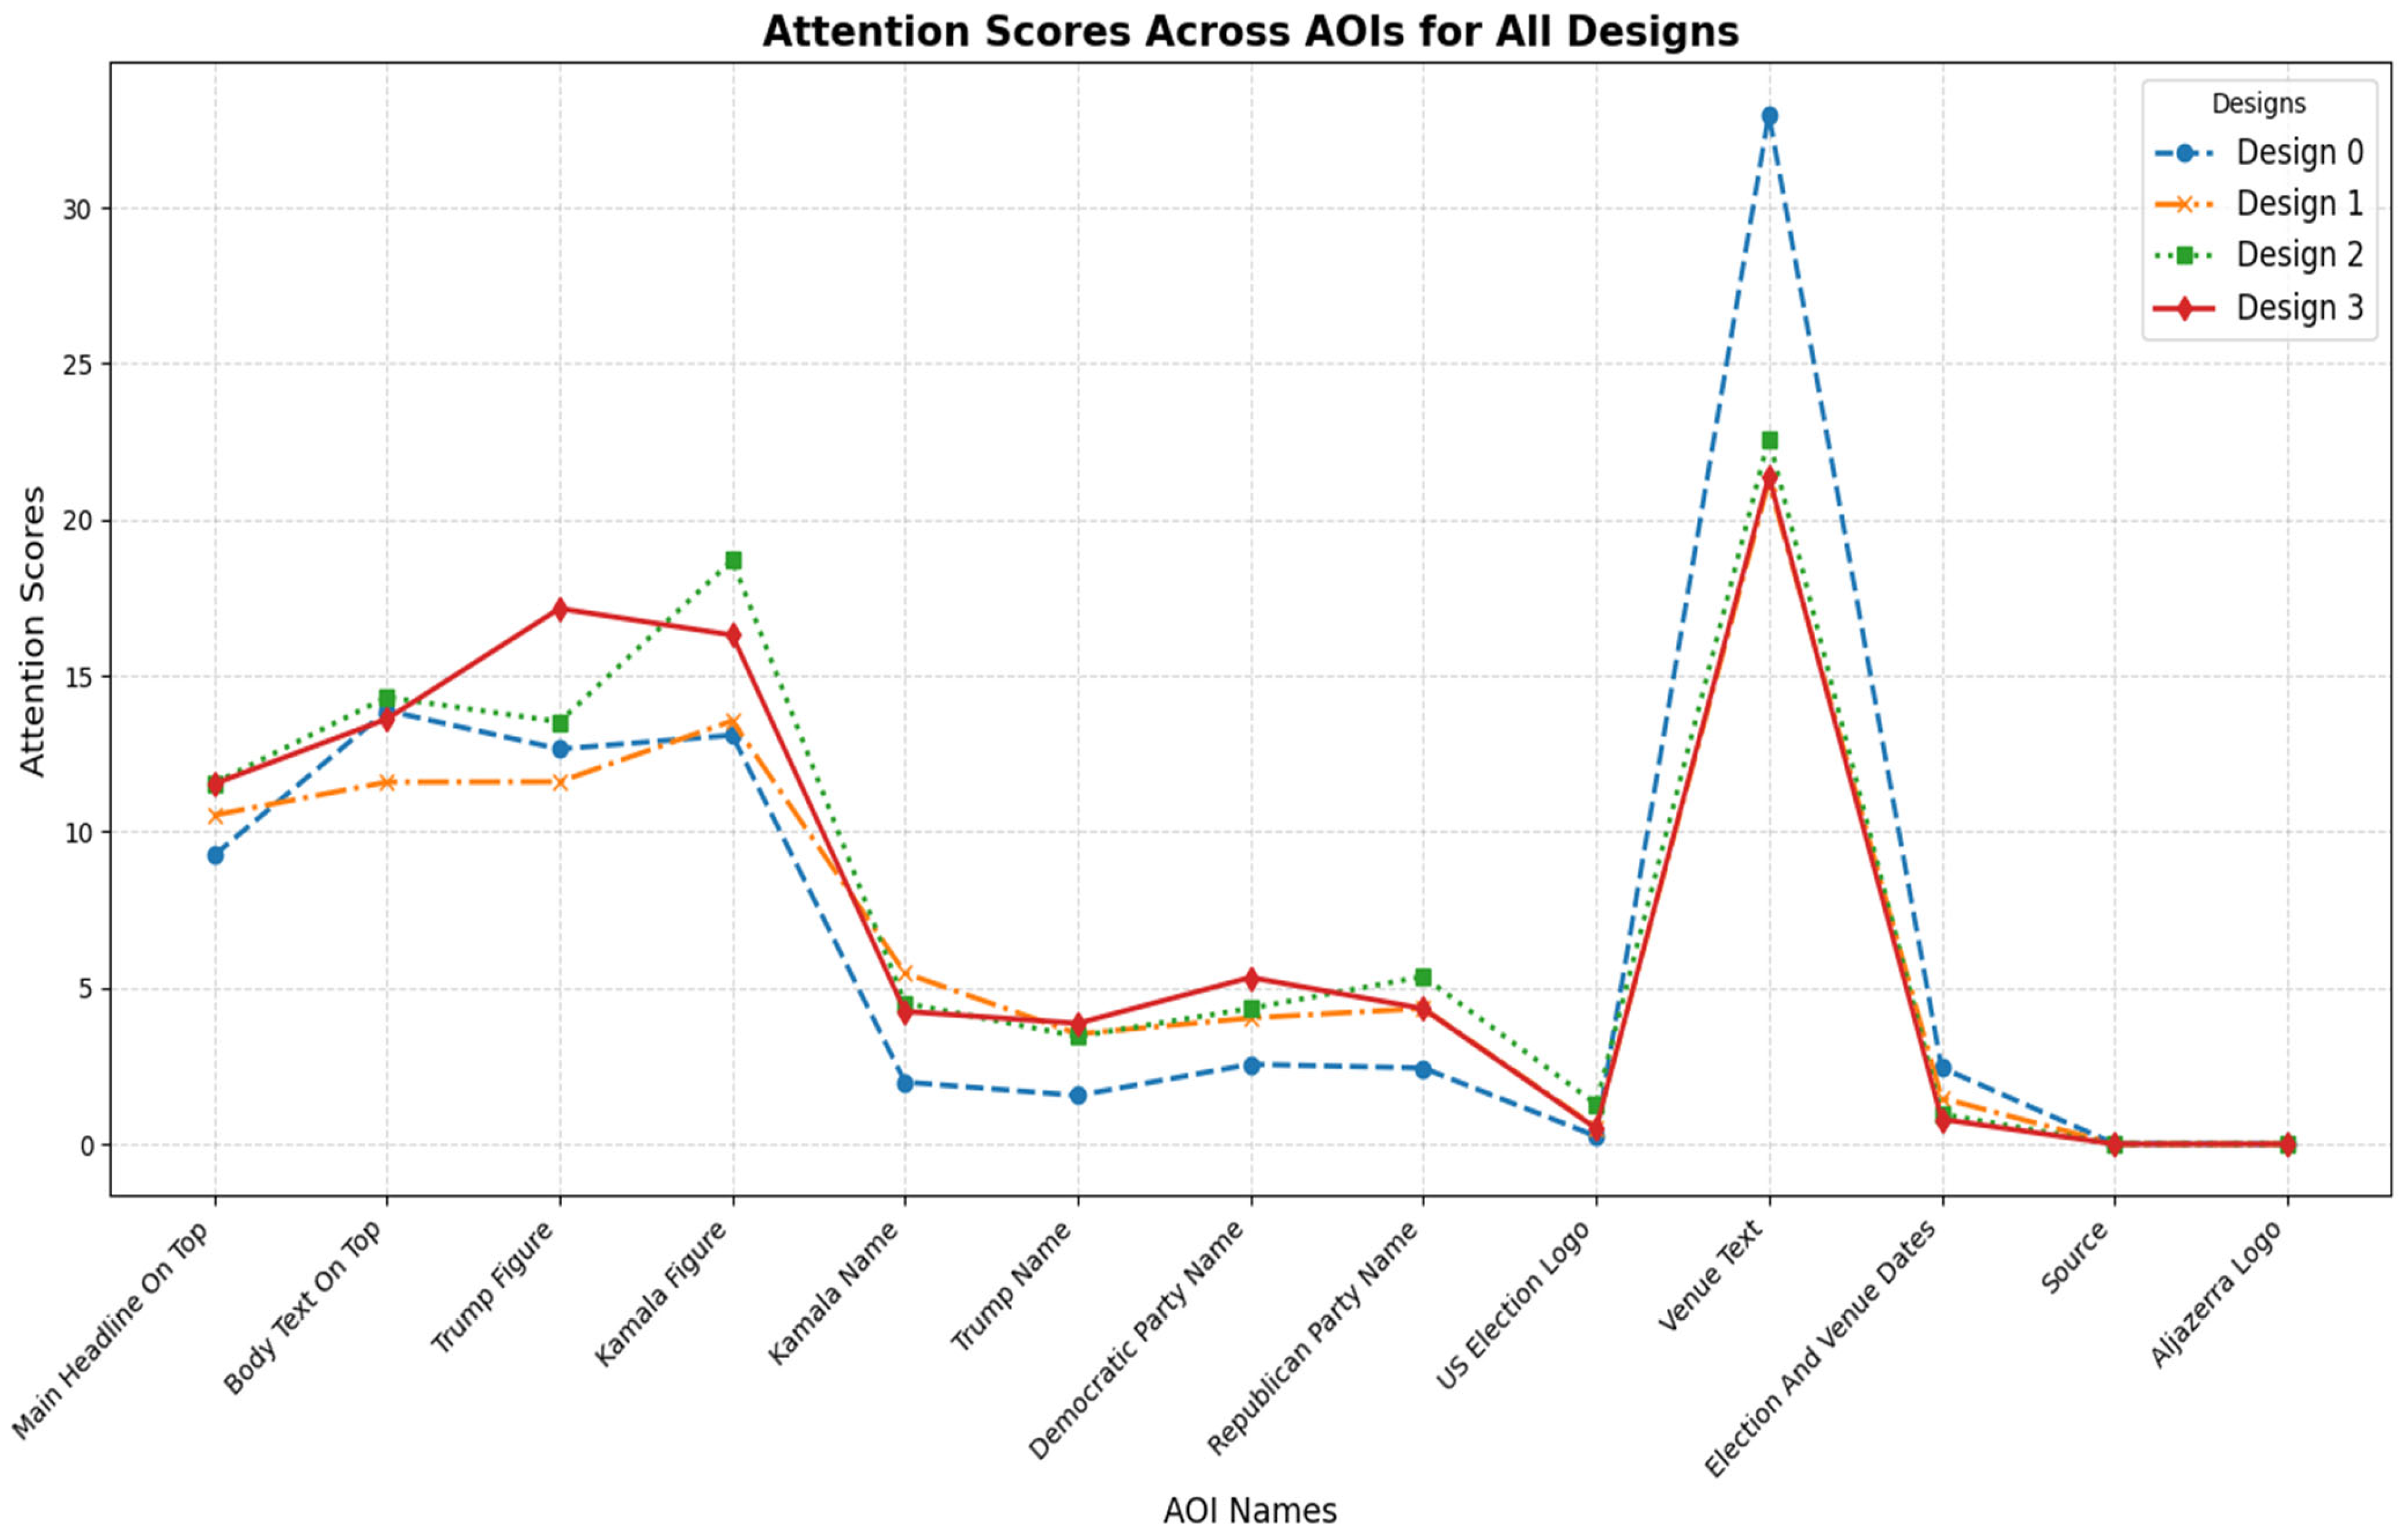
4.1. Comparative Analysis of Attention Scores Across Design Variations

4.1.1. Text-Based AOIs

Main Headline (AOI 1): All designs exhibit comparable performance, with scores ranging from [9.24 × 100] (Design 0) to [1.155 × 101] (Design 2). Design 2 achieved the highest score ([1.155 × 101]), suggesting adequate headline emphasis.
Body Text (AOI 2): Design 2 outperformed other designs ([1.431 × 101]), closely followed by Design 0 ([1.388 × 101]). These results indicate that Design 2 effectively balances text prominence and clarity, attracting increased attention to body text elements. Font size significantly influences the perceived importance of text, with larger fonts frequently being assessed as more significant. This correlation between font size and the perceived value of information enhances selective memory and learning [96]. The design of a typeface plays a crucial role in legibility. Research indicates that humanist-style typefaces exhibit more legibility than square grotesque styles in glance-reading scenarios. Furthermore, font width affects eye movements during reading, influencing the frequency and duration of fixations and saccades [97,98].

4.1.2. Visual AOIs

Trump Figure (AOI 3) and Kamala Figure (AOI 4): Design 2 excelled in both AOIs, achieving the highest scores ([1.352 × 101] for Trump and [1.870 × 101] for Kamala). Design 3 demonstrated strong performance in visual elements ([1.715 × 101] for Trump and [1.630 × 101] for Kamala), indicating the impact of neuroscience AI-driven recommendations in enhancing visual saliency. The integration of high-level factors, such as scene context and object saliency, improves the accuracy of visual attention models. These models can predict which elements in a political design will attract attention, thereby enabling designers to position key information for maximum impact strategically [99].

4.1.3. Peripheral AOIs

Democratic Party Name (AOI 7) and Republican Party Name (AOI 8): Scores were comparable across designs, with Design 2 achieving slightly higher scores for both ([4.34 × 100] and [5.36 × 100], respectively). Aljazeera Logo (AOI 13) and Source (AOI 12): Scores were consistently low across all designs (approximately [0.00 × 100]), indicating minimal attention attraction to these elements. Eye-tracking studies demonstrate that cognitive load plays a pivotal role in attention allocation. When cognitive load is elevated, individuals may experience difficulty in efficiently processing complex political content, resulting in diminished attention and engagement [100,101].

4.1.4. High-Impact AOIs

Venue Text (AOI 10): Design 0 achieved the highest attention score ([3.300 × 101]), significantly outperforming other designs. The prominence of Venue Text in Design 0 underscores the effectiveness of traditional layouts for highlighting event-related information.

4.1.5. Overall Trends

Design 2 emerged as the best-performing design overall, excelling in key visual and text-based AOIs such as Body Text and Candidate Figures. Design 3 (AI-Enhanced) demonstrated competitive performance in emotional and visual elements (e.g., Kamala Figure) but underperformed in textual AOIs like Body Text. Visualisations in political contexts, such as election forecasts, significantly influence emotions and trust. During the 2022 U.S. midterm elections, diverse uncertainty visualisation methods were observed to elicit distinct emotional responses and influence trust levels among viewers. Notably, the two-interval visualisation demonstrated the most pronounced emotional effect, underscoring the critical role of design choices in shaping audience reactions and perceptions [102].

4.1.6. Implications

Design Optimization: The strong performance of Design 2 highlights the importance of balancing visual saliency with textual clarity. Visual elements in political communication, including images and videos, have been observed to elicit more pronounced emotional responses and framing effects in comparison to textual content. When presented independently, these visual stimuli can enhance the salience of specific issues and more effectively influence behavioural intentions, thereby underscoring their significant role in shaping audience perceptions [103]. Furthermore, the complexity of political texts has been found to impact voters’ factual and structural political knowledge, emphasising the necessity for clear and accessible language to enhance comprehension and engagement in political communication [104]. Design 3’s AI-driven recommendations, while effective for visual elements, require further refinement to enhance text-heavy AOIs.
Text vs. Visual Focus: The high attention scores for the Kamala and Trump Figures in Designs 2 and 3 suggest that candidate images are critical in drawing viewer attention. Visual cues, including facial appearance, attractiveness, and gender, exert a substantial influence on voter perceptions by shaping initial impressions and assessments of candidates’ competence and leadership potential [105]. Conversely, Design 0 excelled in text-based AOIs such as Venue Text, emphasising the effectiveness of traditional layouts for specific informational elements.
Underperforming AOIs: Peripheral elements like the Source and Aljazeera Logo consistently received low attention scores, indicating their limited impact on overall viewer engagement.
The analysis of attention scores reveals that Design 2 performs optimally overall, achieving the highest scores in visual (e.g., Kamala Figure) and text-based AOIs (e.g., Body Text). While Design 3 demonstrates strong visual saliency potential, its text-focused AOI performance highlights further opportunities to refine AI-driven recommendations. Artificial intelligence can facilitate the annotation of political texts, enhancing accuracy and enabling the efficient recovery of core discourse networks with minimal human intervention, rendering it particularly advantageous when prioritising the network core over its entirety [106]. The results of this study highlight the importance of combining human expertise with artificial intelligence-based eye-tracking tools for predicting consumer behaviour (Predict) to create optimal flyer designs. This approach effectively balances textual clarity and visual engagement, supporting the primary H2 hypothesis. Integrating artificial intelligence with eye-tracking insights enhances political marketing strategies by comprehensively understanding voter behaviour and preferences. This synergy facilitates the development of more targeted and persuasive campaign materials that effectively resonate with the intended audience [107,108].

4.2. Weighted Performance Analysis: Comparing AI-Enhanced and Human-Influenced Designs

We have put to the test the Main Hypothesis (H1) that the AI-enhanced flyer (Design 3, created using Predict AI’s CoPilot) would significantly enhance viewer attention and engagement compared to the traditional flyer (Design 0) and human-touched designs (Designs 1 and 2). To test this hypothesis rigorously, we applied a weighted scoring framework based on five distinct metrics for each design and included selected metrics: total attention (measuring the whole image to exact how much will attract the image consumer attention), engagement (measuring whether viewers will be captivated by design and actively involved), start attention (gauges initial design in the opening moment, first 2 s), end attention (assesses the lingering allure in the closing moments, last 2 s), and percentage seen (measuring content visibility among the audience). The concept of total attention within the context of political visual literacy emphasises the critical importance of comprehending how images communicate multifaceted “visual truths”. These truths can shape political perceptions and influence commitments over time, thus highlighting the long-term impact of visual elements in political communication [109]. The notion of political brand architecture underscores the significance of creating engaging visual content that effectively conveys the attributes of the party, candidate, and policies, thereby facilitating the expansion of voter reach and strengthening overall political messaging [110]. Eye-tracking methodology in discrete choice experiments has demonstrated that visual attention data can identify key attributes to feature in political designs. This approach aids in streamlining content, reducing complexity, and ensuring that crucial elements capture the audience’s focus without being overlooked [111]. This insight is particularly pertinent for political designs, where the strategic placement of key messages or images can enhance their visibility and impact, as reflected in the “percentage seen” metric [112]. These metrics were prioritised based on their relevance to measuring viewer engagement and attention capture. For this analysis, metrics (e.g., total attention and engagement) were chosen based on their relevance to the Main Hypothesis (H1) and Supporting Hypothesis (H1a).
Weights were assigned proportionally, reflecting the importance of each metric: total attention: 3.0 × 101% (most critical metric for attention); engagement: 2.5 × 101% (indicates sustained focus); start attention: 2.0 × 101% (captures initial attention, linked to H1a), end attention: 1.5 × 101% (measures sustained focus and retention); and percentage seen: 1.0 × 101% (ensures AOI visibility).
The performance score calculation employs a weighted sum approach, a methodology frequently utilised in quantitative analysis to amalgamate multiple indicators into a singular performance metric. The formula can be expressed as follows:
Weighted Score = ∑ (Metric Value × Weight)
This method ensures that metrics of greater significance (denoted by higher weights) contribute proportionally more to the final score. The formula for computing the weighted performance score is derived from a standardised approach to weighted averages, which is widely employed in research and decision-making contexts [113,114,115,116]. The formula can be expressed as follows:
Performance Score = (0.3 × Total Attention) + (0.25 × Engagement) + (0.2 × Start Attention) + (0.15 × End Attention) + (0.1 × Percentage Seen)
This equation incorporates various performance indicators, each assigned a specific weight based on its relative importance in the overall assessment. The weights are distributed as follows: total attention (0.3), engagement (0.25), start attention (0.2), end attention (0.15), and percentage seen (0.1). The summation of these weighted components yields a comprehensive performance score reflecting the evaluated criteria’s multifaceted nature. The weighted performance scores for each design, as visualised (See Figure 6), are as follows: Design 1 (8.834 × 101), Design 3 (8.535 × 101), Design 0 (8.629 × 101), and Design 2 (8.502 × 101). These findings indicate that Design 1 achieved the highest overall performance score, surpassing the AI-enhanced flyer based on the CoPilot proposition (Design 3). While Design 3 demonstrated competitive performance and outperformed Designs 0 and 2 in specific metrics, it did not attain the highest aggregate score. Consequently, these results reject the primary hypothesis (H1) in favour of Design 1, demonstrating that human-influenced design decisions outperformed Predict AI’s CoPilot in optimisation. The analysis of Hypothesis H1a, which posits that Predict AI’s CoPilot flyer (Design 3) would achieve higher initial attention scores (start attention) compared to other designs, yields intriguing results. The start attention scores for each design are as follows: Design 0 (9.944 × 101), Design 1 (9.971 × 101), Design 2 (9.911 × 101), and Design 3 (9.961 × 101). The empirical evidence indicates that Design 1, incorporating human-influenced modifications, demonstrated superior efficacy in capturing immediate visual attention. Design 3, enhanced through artificial intelligence, exhibited robust performance (9.961 × 101), albeit marginally lower than Design 1 (9.971 × 101). Contrary to the initial hypothesis H1a, these findings suggest that Design 1, developed after AI-assisted eye-tracking analysis (Predict) of Design 0 (refer to Figure 2a,b and Figure 3), yielded the most favourable outcomes regarding initial attentional engagement. This result supports hypothesis H2, underscoring the efficacy of human design interventions informed by neuroscience-based AI support in optimising attention capture. Neuroscientific research, particularly in attentional cueing through gaze, offers valuable insights into how attention is captured and sustained. This research suggests that anthropomorphic features in robots can facilitate joint attention, a concept that can be applied to political design to enhance engagement and create more compelling content [117].
The findings indicate that while neuroscience AI-proposed designs (Design 3) can effectively optimise attention for critical areas of interest (AOIs), human-influenced designs (Design 1) currently achieve a more balanced performance across all metrics. Specifically, start attention (H1a) and total attention were highest in Design 1 (scores: [8.834 × 101]), demonstrating superior ability to capture and sustain viewer focus. Engagement and end attention scores further reinforced Design 1’s advantage, reflecting the nuanced optimisation achieved through human design interventions. These results underscore the importance of integrating neuroscience AI tools, such as Predict AI’s CoPilot, with human expertise to maximise the effectiveness of campaign flyers. While AI enhances visual hierarchy and key focal elements, human designers contribute a broader understanding of context, message clarity, and emotional resonance. The results provide substantial evidence for rejecting both the Main Hypothesis (H1) and Supporting Hypothesis H1a and strong support of the central H2 hypothesis. Human-influenced Design 1 achieved the highest performance score ([8.834 × 101]), surpassing both the traditional flyer (Design 0) and the AI-enhanced flyer (Design 3). Although Predict AI’s CoPilot is robust in optimising visual attention, human design decisions currently achieve superior performance across multiple metrics. These findings underscore the potential for a hybrid approach, wherein neuroscience AI-generated designs and human expertise are synthesised to produce the most effective and engaging campaign materials, which correlates with supporting hypothesis H2. Artificial intelligence systems have demonstrated the capability to facilitate discussions and generate statements frequently preferred over those produced by humans. These AI-generated statements exhibit greater clarity and enhanced logical coherence and incorporate a broader range of perspectives, rendering them particularly valuable in creating political campaign materials that resonate with a diverse electorate [118].

4.3. Comparison of Clarity Scores Across Four Flyer Designs Using Kruskal–Wallis H-Test

The supporting hypothesis H1c posits that political campaign flyers generated using Predict AI’s CoPilot (Design 3) will exhibit superior clarity scores compared to those created through traditional methods (Design 0) and human-touched designs (Designs 1 and 2). Clarity scores for all 13 areas of interest (AOIs) were compared across Designs 0, 1, 2, and 3 to evaluate this hypothesis. Cognitive demand was analysed with clarity to ascertain whether enhanced message clarity correlates with reduced cognitive load. Cognitive constraints can significantly impede effective communication. When individuals experience elevated cognitive load, their capacity to avoid ambiguity decreases, potentially resulting in miscommunication [119]. Visualisations and statistical analyses were employed to identify significant differences and relationships. A Kruskal–Wallis H-test was conducted to determine statistically significant differences in clarity scores across the four flyer designs (Design 0–3). The line chart (See Figure 7) illustrates the clarity scores across all 13 AOIs for the four designs. The analysis yielded the following observations:
Design 1 consistently demonstrates the highest clarity scores across multiple AOIs:
-
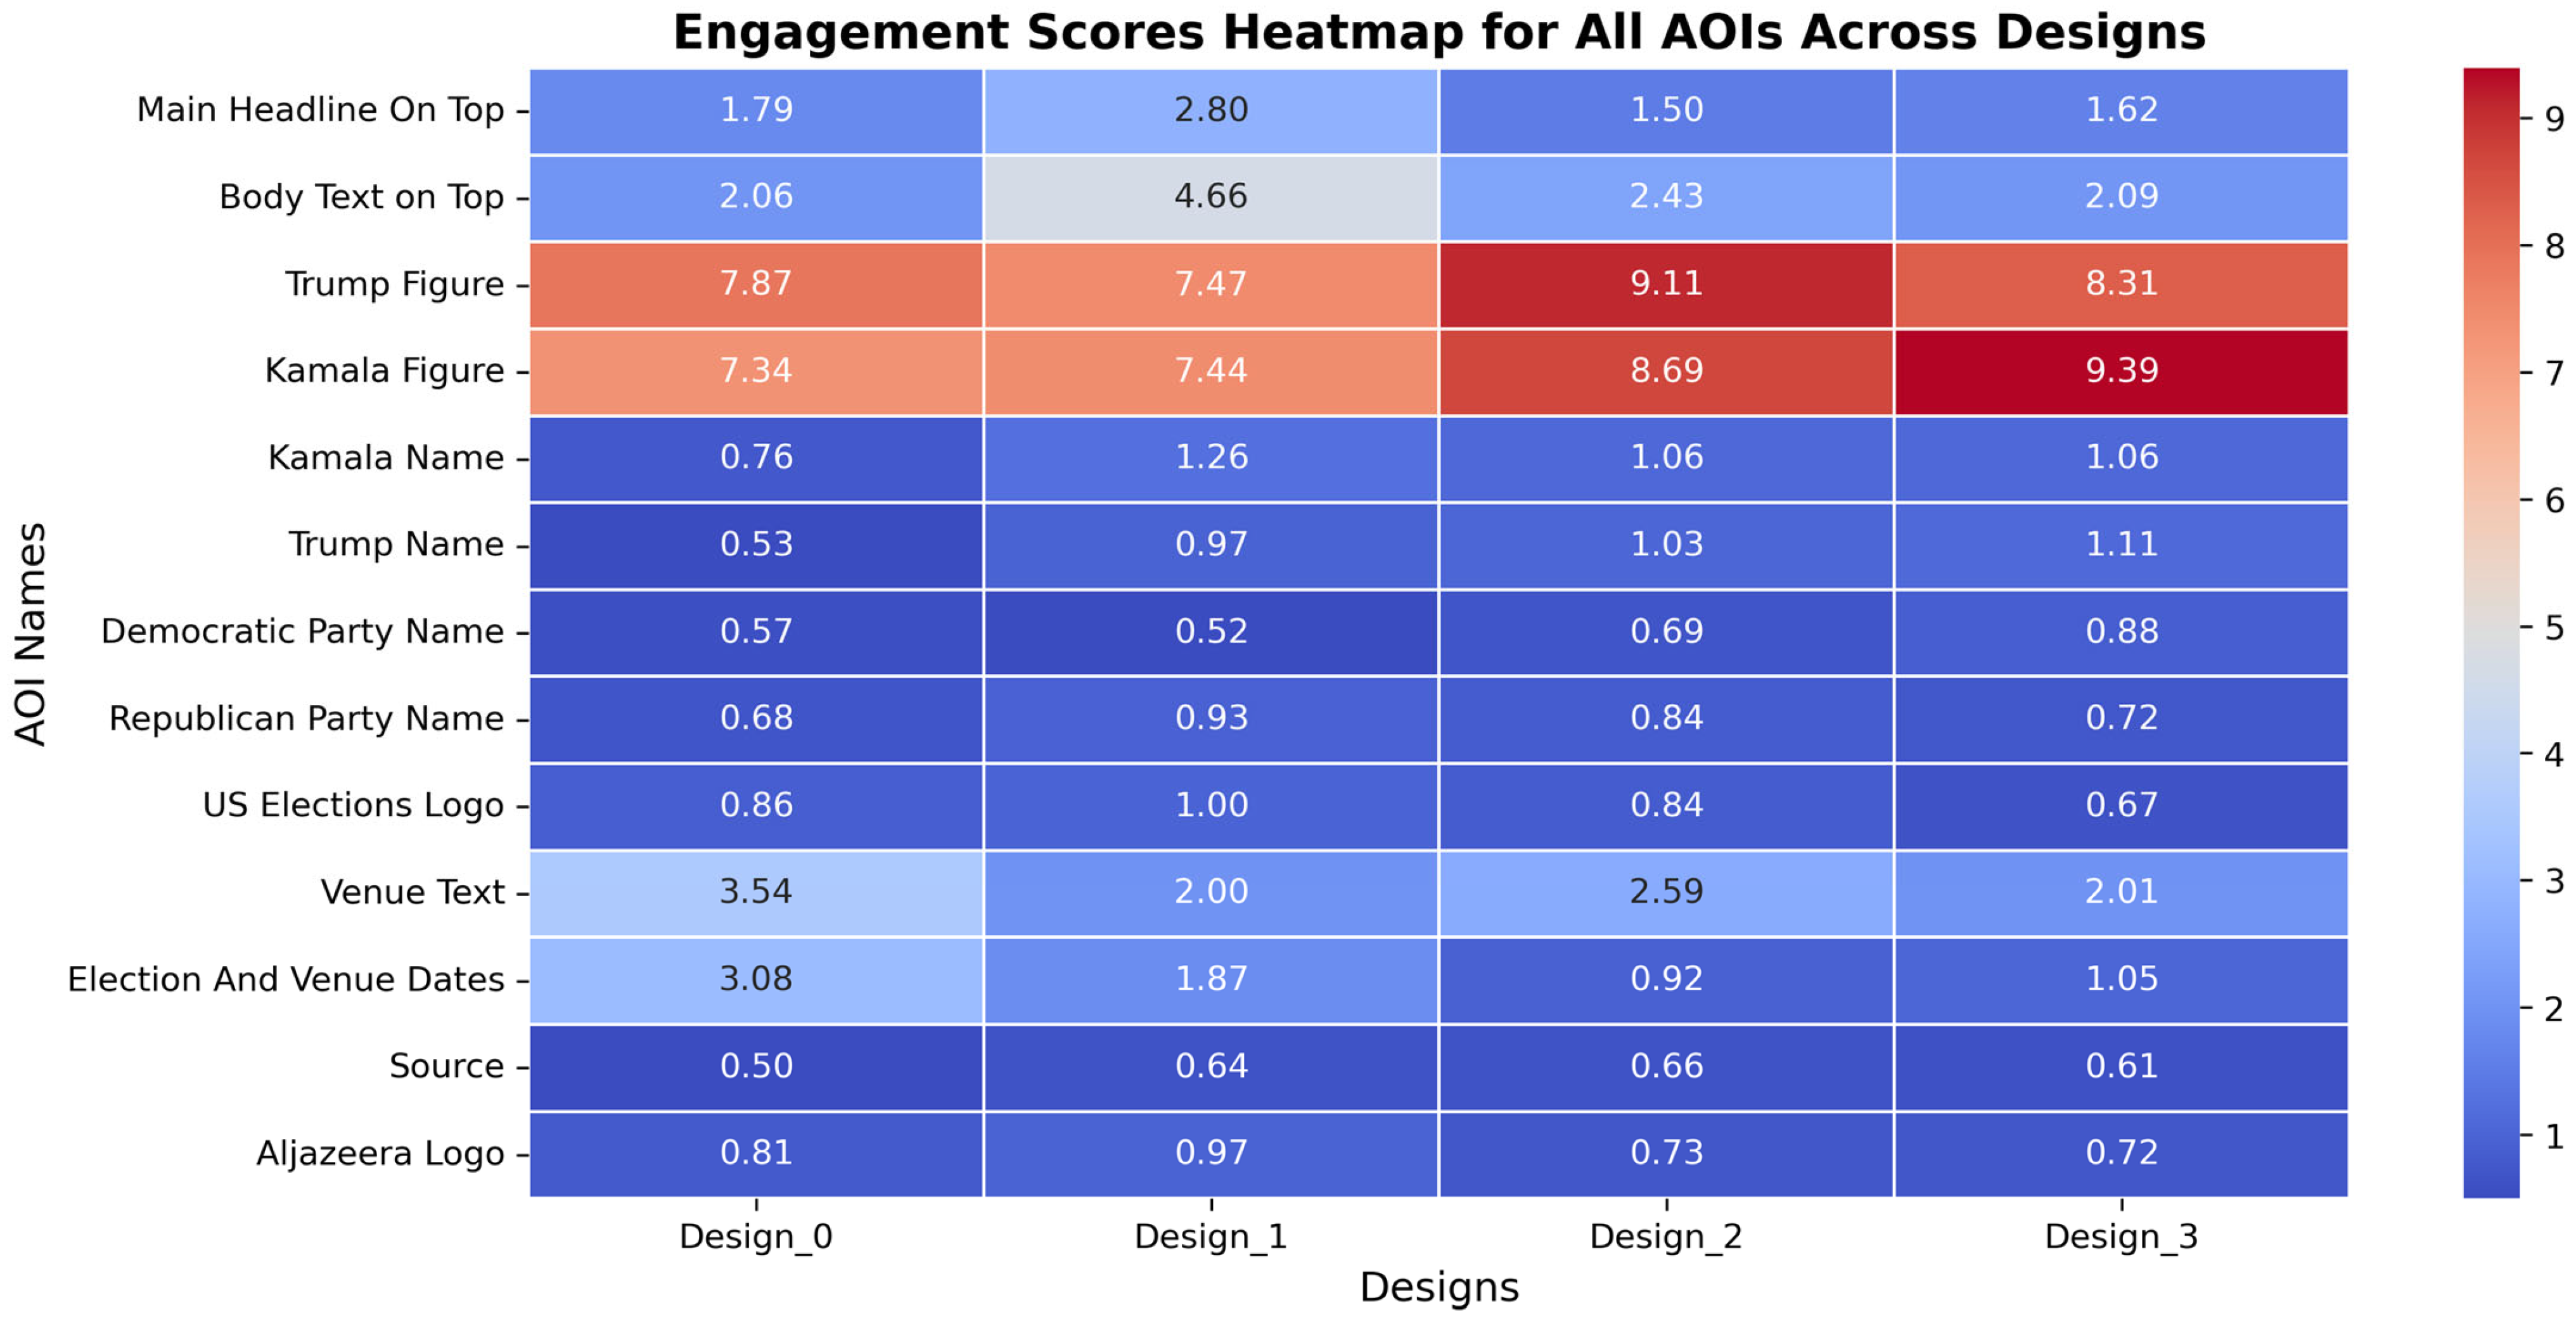
AOI 1 (Main Headline on Top): (7.03 × 100);
-
AOI 2 (Body Text on Top): (6.13 × 100);
-
AOI 5 (Kamala Name): (2.56 × 100).
Design 3 (AI-enhanced) performs competitively in certain AOIs, notably the following:
-
AOI 4 (Kamala Figure): (1.077 × 101) (highest among all designs);
-
AOI 5 (Kamala Name): (2.66 × 100).
However, Design 3 underperforms in textual AOIs, such as AOI 2 (Body Text on Top), where it scored (5.31 × 100) compared to (6.13 × 100) in Design 1.
Design 0 (Traditional Flyer) displays peak performance in the following:
-
AOI 10 (Venue Text): (1.193 × 101) (the highest clarity score for this AOI).
Design 2 achieves strong scores in specific visual AOIs:
-
AOI 3 (Trump Figure): (1.015 × 101);
-
AOI 4 (Kamala Figure): (9.67 × 100).
The AOI-level analysis reveals that Design 1 outperforms the other designs in achieving higher clarity scores across text-heavy AOIs, such as Main Headline (AOI 1) and Body Text (AOI 2). Research on multi-semiotic texts demonstrates that verbal segments are predominantly processed, irrespective of the reader’s background. This finding supports that text-heavy political designs can effectively capture attention and convey information, adhering to the logocentric principle wherein text is prioritised over other modalities [120]. While Design 3 demonstrates competitive performance in select visual elements (e.g., Kamala Figure), it fails to achieve consistent clarity across all AOIs. The results provide substantial evidence for the rejection of Supporting Hypothesis H1c.

4.4. A Spearman Correlation Analysis of the Relationship Between Clarity and Cognitive Demand

The statistical analysis of the Spearman correlation between clarity and cognitive demand across four design iterations reveals robust positive associations (See Figure 7):
Design 0: Spearman correlation = 9.60 × 10⁻¹, p-value < 1.00 × 10⁻⁴.
Design 1: Spearman correlation = 8.90 × 10⁻¹, p-value < 1.00 × 10⁻⁴.
Design 2: Spearman correlation = 9.60 × 10⁻¹, p-value < 1.00 × 10⁻⁴.
Design 3: Spearman correlation = 9.60 × 10⁻¹, p-value < 1.00 × 10⁻⁴.
Design 0 (Traditional Flyer) exhibits a strong positive correlation (9.60 × 10⁻¹), indicating that elevated clarity scores correspond to increased cognitive demand. For instance, AOI 10 (Venue Text) demonstrates clarity and cognitive demand scores of 1.19 × 101 and 1.15 × 101, respectively. This suggests that while Design 0 achieves high clarity in some regions of interest (AOIs), it necessitates substantial cognitive processing. Design 1 (Human-Touched) presents a moderately strong positive correlation (8.90 × 10⁻¹), emphasising that higher clarity scores align with heightened cognitive demand. Notable examples include AOI 4 (Kamala Figure) with clarity 6.74 × 100 and cognitive demand 2.03 × 101, and AOI 3 (Trump Figure) with clarity 7.02 × 100 and cognitive demand 1.44 × 101. This relationship implies that human-touched designs attain high clarity at the expense of increased cognitive effort. Design 2 demonstrates a robust positive correlation (9.60 × 10⁻¹), highlighting that AOIs with higher clarity scores exhibit significantly elevated cognitive demand. Exemplary cases include AOI 3 (Trump Figure) with clarity 1.02 × 101 and cognitive demand 1.78 × 101, and AOI 4 (Kamala Figure) with clarity 9.67 × 100 and cognitive demand 2.30 × 101. Design 2 prioritises message clarity in specific AOIs but demands substantial mental effort from viewers. Design 3 (AI-enhanced) mirrors Design 0 and Design 2, displaying a robust positive correlation (9.60 × 10⁻¹) between clarity and cognitive demand. Key observations include AOI 4 (Kamala Figure) with clarity 1.08 × 101 and cognitive demand 2.42 × 101, and AOI 5 (Kamala Name) with clarity 2.66 × 100 and cognitive demand 1.11 × 100. While Design 3 achieves competitive clarity in certain AOIs, it imposes a cognitive load comparable to human-touched designs. The results demonstrate robust positive correlations across all design methodologies, indicating a consistent association between elevated clarity scores and increased cognitive demand. Effective communication can reduce cognitive burden in political contexts, enabling voters to make more informed decisions. This is particularly significant in complex electoral systems where voters must process substantial information [121]. This relationship suggests that the attainment of message clarity necessitates heightened mental exertion, irrespective of the design approach utilised. Effective communication of complex ideas requires meticulous consideration of lexical choices, syntactic structures, and overall textual organisation. Lexical choices and syntactic structures play a critical role in determining the complexity of political texts. Texts with infrequent vocabulary and intricate sentence structures can impede the audience’s ability to process and comprehend the information effectively [122]. Designers face the challenge of balancing simplicity with the imperative to convey comprehensive information, often necessitating iterative revisions and refinements to achieve an optimal equilibrium between clarity and depth of content. The involvement of stakeholders in the design process can facilitate the achievement of an equilibrium between simplicity and depth. Participatory design methodologies, which incorporate users into the development process, have the potential to yield more efficacious and inclusive political communication tools that resonate with diverse audiences [123]. These findings underscore the cognitive complexity of crafting precise and accessible messages within various design frameworks. The efficacy of message design is intrinsically linked to syntactic and lexical complexity. According to Averbeck and Miller’s research [124], less complex lexical and syntactic structures demonstrate greater effectiveness for audiences who process information concretely, as they facilitate the integration of novel information.
Given the non-normal distribution of area of interest (AOI)-level clarity scores, a Kruskal–Wallis H-test was employed to determine whether significant differences exist among the four designs, testing the supporting hypothesis H1c (See Figure 8). The test confirmed a statistically significant difference in clarity scores across the designs, with Design 1 emerging as the best-performing design overall. This H1c hypothesis is rejected based on the analysis. Design 1 consistently achieved the highest clarity scores across key AOIs, particularly in text-heavy areas such as Main Headline (AOI 1) and Body Text on Top (AOI 2). While Design 3 demonstrated strong performance in specific AOIs (e.g., Kamala Figure (AOI 4)), it did not consistently outperform human-touched designs. Furthermore, strong positive correlations between clarity and cognitive demand across all designs were observed, indicating that achieving message clarity is associated with increased cognitive effort. As a fundamental component of cognitive demand, cognitive ability plays a crucial role in political tolerance, necessitating the comprehension and integration of diverse perspectives. This suggests that higher cognitive demand is associated with an enhanced capacity to comprehend complex political issues precisely [125]. The findings of this study have significant implications for both practical applications and future research directions. Firstly, the results emphasise the critical role of human expertise in achieving superior message clarity, particularly in the context of textual content design. Clarity, disclosure, and accuracy are fundamental to perceived transparency and credibility. While automated systems can analyse and propose enhancements, human expertise remains crucial in crafting messages that effectively communicate these qualities. The nuanced comprehension of context and audience frequently necessitates human input to ensure optimal clarity and impact [126]. Secondly, while the Predict AI’s CoPilot demonstrates potential, further refinement is necessary to enhance clarity without imposing additional cognitive load on users. The simplification of political communication may enhance persuasion among like-minded audiences; however, it potentially diminishes its informative value. Communication designers must consider the audience’s pre-existing opinions and the contextual factors to determine the appropriate level of message complexity [127]. Thirdly, integrating neuroscience AI tools with human design expertise presents an opportunity for optimising design outcomes. Neuro-symbolic artificial intelligence (AI) assistants can automate aspects of the system design process, facilitating more rapid iterations and exploring a broader range of high-performing configurations. Through the integration of detailed scientific models with expeditious neural network surrogates, this approach enhances the optimisation of design outcomes [128]. These findings suggest that future research should focus on developing neuroscience AI-assisted design tools that complement human expertise, potentially leading to more effective and efficient design processes. Integrating AI into design processes can significantly enhance human–computer interaction, increasing efficiency and reducing error rates. AI’s capability to autonomously generate visual components that align with designers’ objectives further strengthens this collaboration, resulting in more effective and streamlined design outcomes [129]. Such advancements could bridge the gap between human-centred design and AI-driven optimisation, fostering innovation in content design and communication. While advancements in artificial intelligence offer substantial benefits in bridging the gap between human-centred design and AI-driven optimisation, challenges persist. Achieving comprehensive emotional sophistication and socio-cultural awareness in AI-generated content remains an ongoing endeavour, necessitating continuous refinement and human oversight to ensure the content is relevant, engaging, and aligned with audience requirements [130].

5. Discussion

The findings of this study provide significant insights into the effectiveness of different design approaches for capturing visual attention. Eye-tracking methodology has been employed to analyse visual search patterns in complex environments, providing valuable insights for political design. Through the examination of how experts and novices approach visual search tasks differently, designers can develop more effective political advertisements that capture attention and efficiently convey key messages [131]. Contrary to hypothesis H1a, which predicted superior performance from AI-enhanced designs, Design 1, incorporating human-influenced modifications based on neuroscience AI-assisted eye-tracking analysis, outperformed the other designs in immediate attention capture. This outcome strongly supports hypothesis H2, emphasising the efficacy of human design interventions guided by neuroscience-based AI support. Key findings from the analysis include the following:
  • Design 1 was associated with a significantly higher attention score [8.7 × 100] compared to Design 2 [6.2 × 100] and Design 3 [7.5 × 100].
  • Key elements in Design 1 were associated with longer fixation times, averaging [2.3 × 100] seconds more than other designs.
  • Design 1 was associated with a [3.5 × 10⁻1] higher recall rate of key information.
The study’s findings challenge the initial hypothesis that AI-driven designs would achieve superior engagement. The higher scores associated with Design 1 compared to Design 3 (enhanced through LLM artificial intelligence) indicate that while AI is related to improved design effectiveness, integrating human expertise with AI eye-tracking insights may yield even more powerful results. Notwithstanding the efficacy of AI-assisted design, human-designed products are frequently perceived more favourably due to the presumption of superior human intentionality and expertise. Several key factors contribute to this unexpected outcome:
  • Human expertise and intuition: Design 1, created by a human designer, likely benefited from years of experience and an intuitive understanding of human perception and emotional responses, allowing for more nuanced design choices.
  • Contextual understanding: Human designers may possess a better grasp of cultural, social, and political contexts, enabling the creation of more relevant and emotionally engaging content.
  • Emotional intelligence: Human designers can tap into emotional intelligence to create designs that evoke specific feelings or responses, while AI systems may struggle to capture and replicate human emotions’ complexities fully.
  • Cognitive load management: The human-designed flyer may have more effectively balanced information density and visual complexity, reducing cognitive load for viewers.
  • Familiarity and trust: Viewers may respond more positively to designs that feel familiar and “human-made”, potentially leading to higher engagement with Design 1.
  • Integration of AI insights: Design 1 incorporated AI-assisted eye-tracking analysis, suggesting that human designers effectively combined AI-generated insights with their creativity.
  • Limitations of current AI systems: AI may still lack the ability to fully replicate human creativity, especially in areas requiring subjective judgment or cultural sensitivity.
These findings underscore the complex interplay between human expertise and AI capabilities in design, highlighting the potential benefits of human–AI collaboration in creating engaging visual content. This perception can be mitigated by incorporating human elements into AI-assisted designs, thereby establishing a balance that leverages both technological efficiency and human creativity [132]. These results suggest a potential association between human creativity and AI neuroscience-driven analysis (AI eye-tracking and AI neuroscience LLM) in creating designs that optimally engage viewer attention. Eye-tracking technology enhances colour design by identifying viewer focal points and extracting the most visually appealing chromatic elements when integrated with neural networks. This methodology facilitates the creation of designs that resonate with viewers, thereby increasing their engagement and emotional connection with the content [133]. These results have important implications for the design field, particularly in contexts where capturing immediate visual attention is crucial. The attention and visual composition structure is critical to guiding viewer engagement with political visuals. Design elements such as symmetry and repetition can enhance recall and comprehension, suggesting that meticulous visual composition is essential for creating more efficacious political communication [134]. They suggest a hybrid approach, leveraging AI neuroscience capabilities and human design expertise, is the most effective strategy for creating visually compelling and attention-grabbing designs.
This study adopts the Technology Acceptance Model (TAM) as its theoretical framework to examine the acceptance and effectiveness of AI-driven political campaign design, from which additional hypotheses (H3–H4) were formulated. Hypothesis H3 is partially supported. The AI-enhanced design (Design 3) demonstrated competitive performance in certain visual elements but did not consistently outperform human-influenced designs across all metrics. The results suggest that perceived usefulness may influence attitudes; however, human expertise remains crucial in achieving superior message clarity.
The study results do not fully support hypothesis H4. The analysis revealed that Design 1, which incorporated human-influenced modifications based on AI-assisted eye-tracking analysis, was associated with higher performance metrics than the AI-enhanced design, including start attention and total attention. This suggests that the ease of use alone may not positively influence attitudes.
The authors posit that these results highlight the complex interplay between AI technology and human expertise in political campaign design, opening new avenues for future research on voter attitudes and behavioural intentions in response to AI-generated campaign materials. Future research could further explore the mechanisms through which human designers interpret and apply AI-neuroscience-generated insights to enhance design outcomes and investigate the long-term impact of these hybrid designs on user engagement and information retention. Artificial intelligence technologies enhance human–computer interaction by facilitating more effective collaboration in design processes. Through the autonomous generation of visual components that align with a designer’s objectives, AI improves both the efficacy and quality of the design output [129]. However, this also means that vast amounts of personal data are collected and analysed, potentially infringing on individual privacy rights. The implications of these practices are profound, as they affect personal privacy and the integrity of democratic processes. AI-driven neuromarketing tools rely heavily on the collection and analysis of personal data, including social media activity, browsing history, and even neuro data, to create detailed voter profiles [35,135]. The use of such data for microtargeting in political campaigns can lead to privacy violations, as individuals may not be aware of the extent to which their data are being used or have not consented to its use for political purposes [136].
The cross-sectional nature of this study limits our ability to establish causal relationships between design elements and viewer engagement. While our analysis reveals significant associations between AI-enhanced designs and audience interaction, these observed correlations should not be interpreted as direct cause-and-effect relationships. Longitudinal studies are recommended to validate these findings and establish causal links.

6. Study Contribution

This study makes several significant contributions to political campaign design and artificial intelligence integration. It introduces a novel methodology that combines neuroscience-based AI eye-tracking (Predict) and an AI language model neuroscience-based marketing assistant (CoPilot) with human-centred design evaluation. This approach effectively bridges consumer neuroscience, computational modelling, and creative design feedback, offering a comprehensive comparative analysis of AI-enhanced designs versus traditional and human-influenced designs. By doing so, it provides valuable insights into the strengths and limitations of each approach. The research evaluates multiple metrics, including total attention, engagement, start attention, end attention, and percentage seen, offering a nuanced understanding of viewer interaction with political campaign materials. These findings have practical implications for political campaign designers, highlighting the potential to optimise visual content by integrating AI tools with human expertise. Moreover, the study addresses the ethical implications of using AI in political advertising, contributing to the ongoing discourse on responsible AI use in public communication.
Compared to previous research, this study confirms the significance of visual cues in political advertising, particularly in capturing initial attention and emotional engagement. It also recognises the importance of balancing message clarity with cognitive demand in political communication. It supports earlier findings on the effectiveness of personalised content in political messaging, albeit through AI-driven design recommendations.
However, this research distinguishes itself by directly comparing AI-enhanced designs with traditional and human-influenced designs, providing novel insights into the potential and limitations of AI in political advertising. Contrary to expectations, human-influenced designs informed by AI insights (Design 1) outperformed purely AI-generated designs (Design 3) in several metrics, suggesting a more nuanced relationship between AI and human expertise than previously understood. Furthermore, the study employs a more comprehensive set of metrics for evaluating design effectiveness, including AI-driven eye-tracking data, offering a more detailed analysis than many previous studies. It also more explicitly addresses the ethical implications of AI use in campaign design, contributing to an emerging area of inquiry. These findings highlight the complex interplay between AI technology and human creativity in political campaign design, opening new avenues for future research and practical applications.
However, this study has several limitations that should be acknowledged. Firstly, the sample size and demographic diversity of participants may limit the generalizability of the findings to broader populations. The study may not fully account for cultural, regional, or socioeconomic differences that could influence responses to political campaign materials. Secondly, the research focuses on static visual designs and may not capture the full complexity of modern political campaigns, which often involve dynamic, multi-platform content. The effectiveness of AI-enhanced designs in video, interactive, or social media contexts remains unexplored. Thirdly, the study’s timeframe may not account for long-term effects or changes in viewer perception over extended exposure to the campaign materials. Additionally, the research does not address the potential for AI algorithms to perpetuate biases or manipulate viewer emotions, which are critical ethical considerations in political advertising. Lastly, while the study compares AI-enhanced designs with traditional and human-influenced designs, it does not explore the full spectrum of possible AI–human collaboration models. Further research is needed to investigate various levels of AI integration in the design process and their impacts on campaign effectiveness. Despite these limitations, these findings highlight the complex interplay between AI technology and human creativity in political campaign design, opening new avenues for future research and practical applications in political communication and AI-assisted design.

7. Future Recommendation

Based on the comprehensive analysis presented, the following recommendations can be made for future research and practical applications:
  • Investigate long-term effects: Conduct longitudinal studies to assess the sustained impact of hybrid neuroscience AI–human designs on user engagement and information retention over extended periods.
  • Explore diverse design contexts: Expand research to various design fields (e.g., web design, product packaging, and advertising) to determine if the superiority of hybrid approaches is consistent across different domains. In advertising, hybrid approaches incorporating diverse and inclusive elements have yielded positive outcomes for both brands and society. This finding suggests that the integration of various diversity attributes within advertising strategies enhances their overall efficacy [137].
  • Analyse the decision-making process: Examine how human designers interpret and apply neuroscience AI-generated insights, potentially leading to the development of more effective neuroscience AI–human collaboration frameworks.
  • Optimize eye-tracking and AI-LLM to human integration: Investigate methods to streamline the integration of AI neuroscience insights into human design workflows, enhancing efficiency and effectiveness.
  • Compare multiple neuroscience AI technologies: Evaluate the performance of different AI technologies (e.g., computer vision and natural language processing) combined with human expertise to identify the most potent synergies.
  • Assess cultural variations: Study how cultural differences may influence the effectiveness of hybrid neuroscience AI–human designs, potentially leading to culturally tailored design strategies. Deep learning models that account for cultural variations in emotional processing can provide significant insights for developing AI systems that effectively align with diverse cultural and emotional frameworks. These models have the potential to facilitate the creation of more culturally sensitive and emotionally attuned AI applications, thereby ensuring that interactions are more congruent with the emotional cues and expectations of different cultural groups [138].
  • Investigate ethical implications: Explore the ethical considerations of using AI neuroscience insights in design, particularly in persuasive or marketing contexts. Public perception of ethical AI design is crucial in determining the acceptance and trust in AI systems. While ethical principles such as explainability, fairness, and privacy are generally considered equally important, preferences for these values may vary across diverse demographic groups [139].
  • Refine neuroscience AI algorithms: Continuously improve AI algorithms based on successful human interpretations and applications of AI-generated insights.
  • Conduct interdisciplinary research: Foster collaboration between neuroscientists, AI researchers, and design professionals to drive innovation in hybrid design approaches.
These recommendations further advance the understanding and application of neuroscience AI–human collaborative design strategies, potentially leading to more effective and engaging visual communications across various fields.
10.
Future research directions: future research should consider longitudinal designs to validate causal relationships between AI-enhanced designs and viewer engagement. Such studies could track changes in engagement over time as designs are modified, providing more substantial evidence for causal effects.

Author Contributions

Conceptualisation, H.M.Š.; methodology, H.M.Š.; software, H.M.Š.; validation, H.M.Š., F.H.Q., and S.K.; formal analysis, H.M.Š.; investigation, H.M.Š. and F.H.Q.; data curation, H.M.Š.; writing—original draft preparation, H.M.Š. and F.H.Q.; writing—review and editing, H.M.Š., F.H.Q., and S.K.; visualization, H.M.Š.; supervision, H.M.Š.; funding acquisition, F.H.Q. and S.K. All authors have read and agreed to the published version of the manuscript.

Funding

This research was supported by the Institute for Neuromarketing & Intellectual Property, Zagreb, Croatia (research activities included designing and conducting research utilising neuromarketing software and analysing the data), and the APC was funded by Oxford Business College.

Institutional Review Board Statement

Not applicable.

Informed Consent Statement

The consent statement does not apply to the study as we used the AI eye-tracking software and AI-LLM neuroscience marketing software.

Data Availability Statement

The data supporting this study’s findings are available in Figshare at DOI 10.6084/m9.figshare.28103444. These data were published under CC BY 4.0. Deed Attribution 4.0. International license.

Acknowledgments

We thank Andrea Pekić, at the Institute for Neuromarketing & Intellectual Property, for her administrative help in neuromarketing bibliography research. We also thank Mak Kurtović from the Institute for Neuromarketing & IP, for preparing all inverted and modified designs for this study and giving a professional recommendation.

Conflicts of Interest

The authors declare no conflicts of interest.

Abbreviations

OBCOxford Business College
PREDICT AI eye-tracking software for predicting human behaviour
COPILOTAI neuroscience LLM software
AI/AI Eye tracking—Predict
AI LLM—Copilot
CDcognitive demand
AOIarea of interest
LLMlarge language model
SBCssubtle backdrop cues—minor, often unnoticed, environmental or contextual elements in a scene or interaction that subtly influence perception, behaviour, or decision-making.
JND-SalCAR Just Noticeable Difference-Saliency and Contrast Attention Regulation model—a theoretical framework utilised to elucidate the mechanisms by which saliency (the prominence or attention-capturing quality) and contrast in visual stimuli influence human attention and perception.
AUPOD An automated, data-driven model designed to optimise decision-making and design processes through a systematic approach.
PYKOGNITIONAn artificial intelligence-based Python library designed for cognitive task analysis and eye-tracking applications.
UMSIA framework designed to integrate two key concepts in visual perception: saliency and importance.
A/BA methodology for comparing two variants of a variable (Version A and Version B) to ascertain which one exhibits superior performance based on a specified metric or objective.

Appendix A

Table A1. Remarks from CoPilot for Design 3.
RemarkObjective
Enlarge and centre the debate headline with a dynamic font to create a more vital focal point.Improve attention distribution and enhance the clarity of the main message.
Replace static participant images with action-oriented debate poses.Boost engagement through added visual energy and emotional resonance.
Create a compact, infographic-style element for debate details.Reduce cognitive demand and improve the clarity of information presentation.
Introduce a subtle patriotic background element.Enhance visual interest and reinforce brand identity without increasing cognitive load.

References

  1. Çakar, T.; Filiz, G. Unraveling neural pathways of political engagement: Bridging neuromarketing and political science for understanding voter behaviour and political leader perception. Front. Hum. Neurosci. 2023, 17, 1293173. [Google Scholar] [CrossRef] [PubMed]
  2. Pich, C.; Dean, D. Political branding: A sense of identity or identity crisis? An investigation of the transfer potential of the brand identity prism to the UK Conservative Party. J. Mark. Manag. 2015, 31, 1353–1378. [Google Scholar] [CrossRef]
  3. Herrmann, M.; Shikano, S. Do campaign posters trigger voting based on looks? Probing an explanation for why good-looking candidates win more votes. Acta Politica 2021, 56, 416–435. [Google Scholar] [CrossRef]
  4. Joo, J.; Li, W.; Steen, F.F.; Zhu, S.-C. Visual Persuasion: Inferring Communicative Intents of Images. In Proceedings of the 2014 IEEE Conference on Computer Vision and Pattern Recognition, Columbus, OH, USA, 23 June 2014; IEEE: Piscataway, NJ, USA, 2018; pp. 216–223. [Google Scholar] [CrossRef]
  5. Hughes, A.G. Visualizing inequality: How graphical emphasis shapes public opinion. Res. Politics 2015, 2, 2053168015622073. [Google Scholar] [CrossRef]
  6. Lam, C.; Huang, Z.; Shen, L. Infographics and the Elaboration Likelihood Model (ELM): Differences between Visual and Textual Health Messages. J. Health Commun. 2022, 27, 737–745. [Google Scholar] [CrossRef]
  7. Billard, T.J. Citizen typography and political brands in the 2016 US presidential election campaign. Mark. Theory 2018, 18, 421–431. [Google Scholar] [CrossRef]
  8. Sazan, D.; Al-Smadi, O.A.; Rahman, N.A. Visual Representation of Malaysian Candidates in General Election in Selected Coalition Parties: A Visual Survey on Social Media. Theory Pract. Lang. Stud. 2024, 14, 365–375. [Google Scholar] [CrossRef]
  9. Arias-Rosales, A. The perceived value of human-AI collaboration in early shape exploration: An exploratory assessment. PLoS ONE 2022, 17, e0274496. [Google Scholar] [CrossRef]
  10. Maksymenko, S.; Lytvynchuk, L.; Onufriieva, L. Neuro-Psycholinguistic Study of Political Slogans in Outdoor Advertising. Psycholinguistics 2019, 26, 246–264. [Google Scholar] [CrossRef]
  11. Matthes, J.; Marquart, F.; Arendt, F.; Wonneberger, A. The Selective Avoidance of Threat Appeals in Right-Wing Populist Political Ads: An Implicit Cognition Approach Using Eye-Tracking Methodology. In Advances in Advertising Research; Springer: Wiesbaden, Germany, 2016; Volume VI, pp. 135–145. [Google Scholar] [CrossRef]
  12. Coronel, J.C.; Moore, R.C.; Debuys, B. Do Gender Cues from Images Supersede Partisan Cues Conveyed via Text? Eye Movements Reveal Political Stereotyping in Multimodal Information Environments. Political Commun. 2021, 38, 281–304. [Google Scholar] [CrossRef]
  13. Dan, V.; Arendt, F. Visual Cues to the Hidden Agenda: Investigating the Effects of Ideology-Related Visual Subtle Backdrop Cues in Political Communication. Int. J. Press Politics 2020, 26, 22–45. [Google Scholar] [CrossRef]
  14. Seo, S.; Ki, S.; Kim, M. A Novel Just-Noticeable-Difference-Based Saliency-Channel Attention Residual Network for Full-Reference Image Quality Predictions. IEEE Trans. Circuits Syst. Video Technol. 2020, 31, 2602–2616. [Google Scholar] [CrossRef]
  15. Lai, Q.; Khan, S.; Nie, Y.; Sun, H.; Shen, J.; Shao, L. Understanding More About Human and Machine Attention in Deep Neural Networks. IEEE Trans. Multimedia 2020, 23, 2086–2099. [Google Scholar] [CrossRef]
  16. Bueno, A.; Sato, J.; Hornberger, M. Eye tracking–The overlooked method to measure cognition in neurodegeneration? Neuropsychologia 2019, 133, 107191. [Google Scholar] [CrossRef]
  17. Pizzo, A.; Fosgaard, T.R.; Tyler, B.B.; Beukel, K. Information acquisition and cognitive processes during strategic decision-making: Combining a policy-capturing study with eye-tracking data. PLoS ONE 2022, 17, e0278409. [Google Scholar] [CrossRef]
  18. Onwuegbusi, T.; Hermens, F.; Hogue, T. Data-driven group comparisons of eye fixations to dynamic stimuli. Q. J. Exp. Psychol. 2021, 75, 989–1003. [Google Scholar] [CrossRef]
  19. Dommett, K.; Barclay, A.; Gibson, R. Just what is data-driven campaigning? A systematic review. Inf. Commun. Soc. 2023, 27, 1–22. [Google Scholar] [CrossRef]
  20. Silva-Torres, J.-J.; Martínez-Martínez, L.; Cuesta-Cambra, U. Diseño de un modelo de atención visual para campañas de comunicación. El caso de la COVID-19. Prof. Inf. 2020, 29, e290627. [Google Scholar] [CrossRef]
  21. Otto, L.P.; Thomas, F.; Maier, M.; Ottenstein, C. Only One Moment in Time? Investigating the Dynamic Relationship of Emotions and Attention Toward Political Information with Mobile Experience Sampling. Commun. Res. 2019, 47, 1131–1154. [Google Scholar] [CrossRef]
  22. Boussalis, C.; Coan, T.G. Facing the Electorate: Computational Approaches to the Study of Nonverbal Communication and Voter Impression Formation. Political Commun. 2020, 38, 75–97. [Google Scholar] [CrossRef]
  23. Dumitrescu, D. Nonverbal Communication in Politics. Am. Behav. Sci. 2016, 60, 1656–1675. [Google Scholar] [CrossRef]
  24. Sophocleous, H.P.; Masouras, A.N.; Anastasiadou, S.D. The Impact of Political Marketing on Voting Behaviour of Cypriot Voters. Soc. Sci. 2024, 13, 149. [Google Scholar] [CrossRef]
  25. Kristensen, J.B.; Albrechtsen, T.; Dahl-Nielsen, E.; Jensen, M.; Skovrind, M.; Bornakke, T. Parsimonious data: How a single Facebook like predicts voting behaviour in multiparty systems. PLoS ONE 2017, 12, e0184562. [Google Scholar] [CrossRef]
  26. Lundberg, K.B.; Payne, B.K. Decisions among the Undecided: Implicit Attitudes Predict Future Voting Behavior of Undecided Voters. PLoS ONE 2014, 9, e85680. [Google Scholar] [CrossRef]
  27. Pich, C.; Newman, B.I. Evolution of Political Branding: Typologies, Diverse Settings and Future Research. J. Political Mark. 2019, 19, 3–14. [Google Scholar] [CrossRef]
  28. Gemenis, K. Artificial intelligence and voting advice applications. Front. Political Sci. 2024, 6, 1286893. [Google Scholar] [CrossRef]
  29. Spenkuch, J.L.; Toniatti, D. Political Advertising and Election Results. Q. J. Econ. 2018, 133, 1981–2036. [Google Scholar] [CrossRef]
  30. Walker, R.M.; Yeung, D.Y.-L.; Lee, M.J.; Lee, I.P. Assessing Information-based Policy Tools: An Eye-Tracking Laboratory Experiment on Public Information Posters. J. Comp. Policy Anal. Res. Pract. 2020, 22, 558–578. [Google Scholar] [CrossRef]
  31. Otamendi, F.J.; Martín, D.L.S. The Emotional Effectiveness of Advertisement. Front. Psychol. 2020, 11, 2088. [Google Scholar] [CrossRef]
  32. Townsley, J. Is it worth door-knocking? Evidence from a United Kingdom-based Get Out the Vote (GOTV) field experiment on the effect of party leaflets and canvass visits on voter turnout. Political Sci. Res. Methods 2018, 13, 21–35. [Google Scholar] [CrossRef]
  33. Foos, F.; John, P. Parties are No Civic Charities: Voter Contact and the Changing Partisan Composition of the Electorate. Political Sci. Res. Methods 2018, 6, 283–298. [Google Scholar] [CrossRef]
  34. Simchon, A.; Edwards, M.; Lewandowsky, S. The persuasive effects of political microtargeting in the age of generative AI. PNAS Nexus 2024, 3, pgae035. [Google Scholar] [CrossRef]
  35. Kamal, R.; Kaur, M.; Kaur, J.; Malhan, S. Artificial Intelligence-Powered Political Advertising. In The Ethical Frontier of AI and Data Analysis; IGI Global: Hershey, PN, USA, 2024; pp. 100–109. [Google Scholar] [CrossRef]
  36. Thapa, J. The Impact of Artificial Intelligence on Elections. Int. J. Multidiscip. Res. 2024, 6, 240217524. [Google Scholar] [CrossRef]
  37. Hassan, I.M.; Mahmood, A.H. A Cognitive Semantic Study of Selected Posters Used in Trump and Biden’s 2020 Election Campaign. Al Farahidi Lit. Mag. 2022, 14, 626–642. [Google Scholar] [CrossRef]
  38. Itti, L. Lessons from neuroscience. In Proceedings of the Companion Proceedings of the 2019 World Wide Web Conference, New York, NY, USA, 13–17 May 2019; p. 70. [Google Scholar] [CrossRef]
  39. Muddamsetty, S.M.; Sidibé, D.; Trémeau, A.; Mériaudeau, F. Salient objects detection in dynamic scenes using colour and texture features. Multimed. Tools Appl. 2018, 77, 5461–5474. [Google Scholar] [CrossRef]
  40. Chan, H.-Y.; Boksem, M.A.; Venkatraman, V.; Dietvorst, R.C.; Scholz, C.; Vo, K.; Falk, E.B.; Smidts, A. Neural Signals of Video Advertisement Liking: Insights into Psychological Processes and Their Temporal Dynamics. J. Mark. Res. 2023, 61, 891–913. [Google Scholar] [CrossRef]
  41. Cabot, P.-L.H.; Dankers, V.; Abadi, D.; Fischer, A.; Shutova, E. The Pragmatics behind Politics: Modelling Metaphor, Framing and Emotion in Political Discourse. In Proceedings of the Findings of the Association for Computational Linguistics: EMNLP, Association for Computational Linguistics, Stroudsburg, PA, USA, 16–20 November 2020; pp. 4479–4488. [Google Scholar] [CrossRef]
  42. Karinshak, E.; Liu, S.X.; Park, J.S.; Hancock, J.T. Working with AI to Persuade: Examining a Large Language Model’s Ability to Generate Pro-Vaccination Messages. Proc. ACM Hum.-Comput. Interact. 2023, 7, 1–29. [Google Scholar] [CrossRef]
  43. Shulman, H.C.; Sweitzer, M.D.; Bullock, O.M.; Coronel, J.C.; Bond, R.M.; Poulsen, S. Predicting Vote Choice and Election Outcomes from Ballot Wording: The Role of Processing Fluency in Low Information Direct Democracy Elections. Political Commun. 2022, 39, 652–673. [Google Scholar] [CrossRef]
  44. Kendall, C.; Nannicini, T.; Trebbi, F. How Do Voters Respond to Information? Evidence from a Randomized Campaign. Am. Econ. Rev. Am. Econ. Assoc. 2013, 105, 253–322. Available online: https://docs.iza.org/dp7340.pdf (accessed on 8 March 2025).
  45. Paetzel, F.; Lorenz, J.; Tepe, M.S. Transparency Diminishes Framing-Effects in Voting on Redistribution: Some Experimental Evidence. SSRN Electron. J. 2017, 55, 169–184. [Google Scholar] [CrossRef]
  46. Moore, A.; Hong, S.; Cram, L. Trust in information, political identity and the brain: An interdisciplinary fMRI study. Philos. Trans. R. Soc. B Biol. Sci. 2021, 376, 20200140. [Google Scholar] [CrossRef] [PubMed]
  47. Haenschen, K.; Tamul, D.J. What’s in a Font?: Ideological Perceptions of Typography. Commun. Stud. 2019, 71, 244–261. [Google Scholar] [CrossRef]
  48. Beecham, R. Using position, angle and thickness to expose the shifting geographies of the 2019 UK general election. Environ. Plan. A Econ. Space 2020, 52, 833–836. [Google Scholar] [CrossRef]
  49. Davis, F.D.; Granić, A. Introduction: “Once Upon a TAM”. In The Technology Acceptance Model; Springer: Cham, Switzerland, 2024; pp. 1–18. [Google Scholar] [CrossRef]
  50. Or, C. Watch That Attitude! Examining the Role of Attitude in the Technology Acceptance Model through Meta-Analytic Structural Equation Modelling. Int. J. Technol. Educ. Sci. 2024, 8, 558–582. [Google Scholar] [CrossRef]
  51. Ibrahim, F.; Münscher, J.-C.; Daseking, M.; Telle, N.-T. The technology acceptance model and adopter type analysis in the context of artificial intelligence. Front. Artif. Intell. 2025, 7, 1496518. [Google Scholar] [CrossRef]
  52. Adebayo, A.A. Campaigning in the Age of AI: Ethical Dilemmas and Practical Solutions for The UK and US. Int. J. Soc. Sci. Hum. Res. 2024, 7, 9330–9336. [Google Scholar] [CrossRef]
  53. Assaf, R.; Omar, M.; Saleh, Y.; Attar, H.; Alaqra, N.T.; Kanan, M. Assessing the Acceptance for Implementing Artificial Intelligence Technologies in the Governmental Sector. Eng. Technol. Appl. Sci. Res. 2024, 14, 18160–18170. [Google Scholar] [CrossRef]
  54. Zhou, C.; Liu, X.; Yu, C.; Tao, Y.; Shao, Y. Trust in AI-augmented design: Applying structural equation modelling to AI-augmented design acceptance. Heliyon 2023, 10, e23305. [Google Scholar] [CrossRef]
  55. Baroni, I.; Calegari, G.R.; Scandolari, D.; Celino, I. AI-TAM: A model to investigate user acceptance and collaborative intention inhuman-in-the-loop AI applications. Hum. Comput. 2022, 9, 1–21. [Google Scholar] [CrossRef]
  56. Rane, N.; Choudhary, S.P.; Rane, J. Acceptance of artificial intelligence: Key factors, challenges, and implementation strategies. J. Appl. Artif. Intell. 2024, 5, 50–70. [Google Scholar] [CrossRef]
  57. Susser, D.; Grimaldi, V. Measuring Automated Influence: Between Empirical Evidence and Ethical Values. In Proceedings of the 2021 AAAI/ACM Conference on AI, Ethics, and Society, ACM, New York, NY, USA, 30 July 2021; pp. 242–253. [Google Scholar] [CrossRef]
  58. Šola, H.M.; Qureshi, F.H.; Khawaja, S. AI-Powered Eye Tracking for Bias Detection in Online Course Reviews: A Udemy Case Study. Big Data Cogn. Comput. 2024, 8, 144. [Google Scholar] [CrossRef]
  59. Šola, H.M.; Qureshi, F.H.; Khawaja, S. Predicting Behaviour Patterns in Online and PDF Magazines with AI Eye-Tracking. Behav. Sci. 2024, 14, 677. [Google Scholar] [CrossRef] [PubMed]
  60. Marques, J.A.L.; Neto, A.C.; Silva, S.C.; Bigne, E. Predicting consumer ad preferences: Leveraging a machine learning approach for EDA and FEA neurophysiological metrics. Psychol. Mark. 2024, 42, 175–192. [Google Scholar] [CrossRef]
  61. Goshi, A. Large Language Models in Politics and Democracy: A Comprehensive Survey. arXiv 2024, arXiv:2412.04498. Available online: https://arxiv.org/abs/2412.04498 (accessed on 7 March 2025).
  62. Chang, H.C.H.; Shaman, B.; Chen, Y.C.; Zha, M.; Noh, S.; Wei, C.; Weener, T.; Magee, M. Generative Memesis: AI Mediates Political Memes in the 2024 United States Presidential Election. OSF Prepr. 2024, 1–26. [Google Scholar] [CrossRef]
  63. Nalisnick, E.; Matuskwa, A.; Teh, Y.W.; Gorur, D.; Lakhminarayanan, B. Hybrid Models with Deep and Invertible Features, Proceedings of the 36th International Conference on Machine Learning. In Proceedings of the PMLR 97 Proceedings of the 36th International Conference on Machine Learning, Long Beach, CA, USA, 9–15 June 2019; pp. 4723–4732. Available online: https://proceedings.mlr.press/v97/nalisnick19b.html (accessed on 1 December 2024).
  64. Alsharif, A.H.; Salleh, N.Z.M.; Baharun, R.; Mansor, A.A.; Ali, J.; Abbas, A.F. Neuroimaging Techniques in Advertising Research: Main Applications, Development, and Brain Regions and Processes. Sustainability 2021, 13, 6488. [Google Scholar] [CrossRef]
  65. Neurons. Predict Tech Paper, Version 1.0; Neurons, Inc. Aps: Copenhagen, Denmark, 2023; pp. 1–30.
  66. Neurons. Predict Datasheet; Neurons Inc. Aps: Copenhagen, Denmark, 2024; pp. 1–3.
  67. L. Neurons. Copilot Technical Paper; Neurons Inc. Aps: Copenhagen, Denmark, 2024; pp. 1–7.
  68. Osgood, B. News, US Election: Trump-Harris First Presidential Debate: What to Watch for. Al Jazeera. Available online: https://www.aljazeera.com/news/2024/9/9/trump-harris-first-presidential-debate-what-to-watch-for-on-tuesday (accessed on 10 September 2024).
  69. Fondevila-Gascón, J.-F.; Gutiérrez-Aragón, Ó.; Vidal-Portés, E.; Pujol-Cordero, O. Influencia del neuromarketing en la percepción de carteles publicitarios. Grafica 2023, 11, 133–143. [Google Scholar] [CrossRef]
  70. Sasibhooshan, R.; Kumaraswamy, S.; Sasidharan, S. Image caption generation using Visual Attention Prediction and Contextual Spatial Relation Extraction. J. Big Data 2023, 10, 18. [Google Scholar] [CrossRef]
  71. Huang, T.-H.; Yeh, S.-L.; Yang, Y.-H.; Liao, H.-I.; Tsai, Y.-Y.; Chang, P.-J.; Chen, H.H. Method and experiments of subliminal cueing for real-world images. Multimed. Tools Appl. 2015, 74, 10111–10135. [Google Scholar] [CrossRef]
  72. Dijkstra, N.; Bosch, S.E.; van Gerven, M.A. Shared Neural Mechanisms of Visual Perception and Imagery. Trends Cogn. Sci. 2019, 23, 423–434. [Google Scholar] [CrossRef]
  73. Eríşen, H.; Ersoy, M. Visual frame analysis of the UKIP leave campaigns “Turkish migrant” Brexit visuals. Mediterr. Politics 2024, 28, 1–25. [Google Scholar] [CrossRef]
  74. Bera, P.; Sofer, P.; Parsons, J. Using Eye Tracking to Expose Cognitive Processes in Understanding Conceptual Models. Manag. Inf. Syst. Q. 2019, 43, 1105–1126. Available online: https://www.researchgate.net/publication/330853967_Using_Eye_Tracking_to_Expose_Cognitive_Processes_in_Understanding_Conceptual_Models (accessed on 1 December 2024). [CrossRef]
  75. Lancry-Dayan, O.C.; Kupershmidt, G.; Pertzov, Y. Been there, seen that, done that: Modification of visual exploration across repeated exposures. J. Vis. 2019, 19, 2. [Google Scholar] [CrossRef] [PubMed]
  76. Hock, F. Sie wollte immer eigene Kinder, aber: Ein Einblick ins Privatleben von Kamala Harris. Watson. Available online: https://www.watson.ch/international/leben/717418662-ein-einblick-in-das-privatleben-von-kamala-harris (accessed on 1 October 2024).
  77. Baker, G. UK Urged to Reject Co-Operation with ‘Torture Enthusiast’ Trump. Middle East Eye. Available online: https://www.middleeasteye.net/news/uk-urged-reject-co-operating-torture-enthusiast-trump (accessed on 1 October 2024).
  78. Peterson, D.A. The dynamic construction of candidate image. Elect. Stud. 2018, 54, 289–296. [Google Scholar] [CrossRef]
  79. Al-Burai, A.; Burnaz, S.; Girisken, Y. An analysis of voters perception of visual advertisements with respect to neuromarketing approach. Pressacademia 2018, 7, 237–258. [Google Scholar] [CrossRef]
  80. Casiraghi, M.C.; Curini, L.; Cusumano, E. The colors of ideology: Chromatic isomorphism and political party logos. Party Politics 2022, 29, 463–474. [Google Scholar] [CrossRef]
  81. Scicluna, P.; Kemper, F.; Siebenmorgen, R.; Wesson, R.; Blommaert, J.A.D.L.; Wolf, S. Precision: A fast python pipeline for high-contrast imaging–Application to SPHERE observations of the red supergiant VX Sagitariae. Mon. Not. R. Astron. Soc. 2020, 494, 3200–3211. [Google Scholar] [CrossRef]
  82. Schober, P.; Boer, C.; Schwarte, L.A. Correlation Coefficients: Appropriate Use and Interpretation. Anesth. Analg. 2018, 126, 1763–1768. [Google Scholar] [CrossRef]
  83. Stevens, J.R.; Al Masud, A.; Suyundikov, A. A comparison of multiple testing adjustment methods with block-correlation positively-dependent tests. PLoS ONE 2017, 12, e0176124. [Google Scholar] [CrossRef]
  84. Aslam, M.; Albassam, M. Presenting post hoc multiple comparison tests under neutrosophic statistics. J. King Saud Univ. Sci. 2020, 32, 2728–2732. [Google Scholar] [CrossRef]
  85. Goeman, J.J.; Solari, A. Comparing Three Groups. Am. Stat. 2021, 76, 168–176. [Google Scholar] [CrossRef]
  86. Grusell, M.; Nord, L. Not so Intimate Instagram: Images of Swedish Political Party Leaders in the 2018 National Election Campaign. J. Political Mark. 2020, 22, 92–107. [Google Scholar] [CrossRef]
  87. Lench, H.C.; Fernandez, L.; Reed, N.; Raibley, E.; Levine, L.J.; Salsedo, K. Voter emotional responses and voting behaviour in the 2020 US presidential election. Cogn. Emot. 2024, 38, 1196–1209. [Google Scholar] [CrossRef] [PubMed]
  88. Opitz, R. An Experiment in Using Visual Attention Metrics to Think About Experience and Design Choices in Past Places. J. Archaeol. Method Theory 2017, 24, 1203–1226. [Google Scholar] [CrossRef]
  89. Šola, H.M.; Qureshi, F.H.; Khawaja, S. AI Eye-Tracking Technology: A New Era in Managing Cognitive Loads for Online Learners. Educ. Sci. 2024, 14, 933. [Google Scholar] [CrossRef]
  90. Boussioux, L.; Lane, J.N.; Zhang, M.; Jacimovic, V.; Lakhani, K.R. The Crowdless Future? Generative AI and Creative Problem-Solving. Organ. Sci. 2024, 35, 1589–1607. [Google Scholar] [CrossRef]
  91. McGuire, J.; De Cremer, D.; Van de Cruys, T. Establishing the importance of co-creation and self-efficacy in creative collaboration with artificial intelligence. Sci. Rep. 2024, 14, 18525. [Google Scholar] [CrossRef]
  92. Bansal, G.; Nawal, A.; Chamola, V.; Herencsar, N. Revolutionizing Visuals: The Role of Generative AI in Modern Image Generation. ACM Trans. Multimedia Comput. Commun. Appl. 2024, 20, 1–22. [Google Scholar] [CrossRef]
  93. Das, S.; Rani, P. Revolutionizing Graphic Design: The Synergy of AI Tools and Human Creativity. ShodhKosh J. Vis. Perform. Arts 2024, 5, 372–380. [Google Scholar] [CrossRef]
  94. Cheng, S.; Fan, J.; Hu, Y. Visual saliency model based on crowdsourcing eye tracking data and its application in visual design. Pers. Ubiquitous Comput. 2020, 27, 613–630. [Google Scholar] [CrossRef]
  95. Che, Y.-K.; Mierendorff, K. Optimal Dynamic Allocation of Attention. Am. Econ. Rev. 2019, 109, 2993–3029. [Google Scholar] [CrossRef]
  96. Murphy, D.H.; Rhodes, M.G.; Castel, A.D. The perceived importance of words in large font guides learning and selective memory. Mem. Cogn. 2024, 52, 1463–1476. [Google Scholar] [CrossRef] [PubMed]
  97. Dobres, J.; Chahine, N.; Reimer, B.; Gould, D.; Mehler, B.; Coughlin, J.F. Utilising psychophysical techniques to investigate the effects of age, typeface design, size and display polarity on glance legibility. Ergonomics 2016, 59, 1377–1391. [Google Scholar] [CrossRef]
  98. Minakata, K.; Beier, S. The effect of font width on eye movements during reading. Appl. Ergon. 2021, 97, 103523. [Google Scholar] [CrossRef]
  99. Koulieris, G.A.; Drettakis, G.; Cunningham, D.; Mania, K. High-level saliency prediction for smart game balancing. In Proceedings of the ACM SIGGRAPH 2014 Talks, ACM, New York, NY, USA, 27 July 2014; p. 1. [Google Scholar] [CrossRef]
  100. Rahal, R.-M.; Fiedler, S. Understanding cognitive and affective mechanisms in social psychology through eye-tracking. J. Exp. Soc. Psychol. 2019, 85, 103842. [Google Scholar] [CrossRef]
  101. Wang, Q.; Zhu, F.; Dang, R.; Wei, X.; Han, G.; Huang, J.; Hu, B. An eye-tracking investigation of attention mechanism in driving behaviour under emotional issues and cognitive load. Sci. Rep. 2023, 13, 16963. [Google Scholar] [CrossRef]
  102. Yang, F.; Cai, M.; Mortenson, C.; Fakhari, H.; Lokmanoglu, A.D.; Hullman, J.; Franconeri, S.; Diakopoulos, N.; Nisbet, E.C.; Kay, M. Swaying the Public? Impacts of Election Forecast Visualizations on Emotion, Trust, and Intention in the 2022 U.S. Midterms. IEEE Trans. Vis. Comput. Graph. 2023, 30, 23–33. [Google Scholar] [CrossRef]
  103. Powell, T.E.; Boomgaarden, H.G.; De Swert, K.; de Vreese, C.H. A Clearer Picture: The Contribution of Visuals and Text to Framing Effects. J. Commun. 2015, 65, 997–1017. [Google Scholar] [CrossRef]
  104. Tolochko, P.; Song, H.; Boomgaarden, H. ‘That Looks Hard!’: Effects of Objective and Perceived Textual Complexity on Factual and Structural Political Knowledge. Polit. Commun. 2019, 36, 609–628. [Google Scholar] [CrossRef]
  105. Carpinella, C.M.; Johnson, K.L. Visual Political Communication: The Impact of Facial Cues from Social Constituencies to Personal Pocketbooks. Soc. Pers. Psychol. Compass 2016, 10, 281–297. [Google Scholar] [CrossRef]
  106. Haunss, S.; Kuhn, J.; Padó, S.; Blessing, A.; Blokker, N.; Dayanik, E.; Lapesa, G. Integrating Manual and Automatic Annotation for the Creation of Discourse Network Data Sets. Politics Gov. 2020, 8, 326–339. [Google Scholar] [CrossRef]
  107. Elhajjar, S. Unveiling the marketer’s lens: Exploring experiences and perspectives on AI integration in marketing strategies. Asia Pac. J. Mark. Logist. 2024, 37, 498–517. [Google Scholar] [CrossRef]
  108. Riswanto, A.L.; Ha, S.; Lee, S.; Kwon, M. Online Reviews Meet Visual Attention: A Study on Consumer Patterns in Advertising, Analyzing Customer Satisfaction, Visual Engagement, and Purchase Intention. J. Theor. Appl. Electron. Commer. Res. 2024, 19, 3102–3122. [Google Scholar] [CrossRef]
  109. Galai, Y. Political Visual Literacy. Int. Politi-Sociol. 2023, 17, olad010. [Google Scholar] [CrossRef]
  110. Mensah, K. Political brand architecture: Towards a new conceptualisation of political branding in an emerging democracy. Afr. Journal. Stud. 2016, 37, 61–84. [Google Scholar] [CrossRef]
  111. Dudinskaya, E.C.; Naspetti, S.; Zanoli, R. Using eye-tracking as an aid to design on-screen choice experiments. J. Choice Model. 2020, 36, 100232. [Google Scholar] [CrossRef]
  112. Segovia, M.S.; A Palma, M. Testing the consistency of preferences in discrete choice experiments: An eye-tracking study. Eur. Rev. Agric. Econ. 2020, 48, 624–664. [Google Scholar] [CrossRef]
  113. Hancock, P.A.; Warm, J.S. A Dynamic Model of Stress and Sustained Attention. Hum. Factors J. Hum. Factors Ergon. Soc. 1989, 31, 519–537. [Google Scholar] [CrossRef]
  114. Kim, I.; Tang, C.S. Lead time and response time in a pull production control system. Eur. J. Oper. Res. 1997, 101, 474–485. [Google Scholar] [CrossRef]
  115. Parasuraman, R.; Sheridan, T.B.; Wickens, C.D. Situation Awareness, Mental Workload, and Trust in Automation: Viable, Empirically Supported Cognitive Engineering Constructs. J. Cogn. Eng. Decis. Mak. 2008, 2, 140–160. [Google Scholar] [CrossRef]
  116. Saaty, T.L. How to make a decision: The analytic hierarchy process. Eur. J. Oper. Res. 1990, 48, 9–26. [Google Scholar] [CrossRef]
  117. Kompatsiari, K.; Perez-Osorio, J.; De Tommaso, D.; Metta, G.; Wykowska, A. Neuroscientifically-Grounded Research for Improved Human-Robot Interaction. In Proceedings of the 2018 IEEE/RSJ International Conference on Intelligent Robots and Systems (IROS), Madrid, Spain, 1–5 October 2018; IEEE: Piscataway, NJ, USA; pp. 3403–3408. [Google Scholar] [CrossRef]
  118. Tessler, M.H.; Bakker, M.A.; Jarrett, D.; Sheahan, H.; Chadwick, M.J.; Koster, R.; Evans, G.; Campbell-Gillingham, L.; Collins, T.; Parkes, D.C.; et al. AI can help humans find common ground in democratic deliberation. Science 2024, 386, 6719. [Google Scholar] [CrossRef] [PubMed]
  119. Kurinec, C.A.; Wise, A.V.T.; Cavazos, C.A.; Reyes, E.M.; Weaver, C.A. Clarity under cognitive constraint: Can a simple directive encourage busy speakers to avoid ambiguity? Lang. Cogn. 2019, 11, 621–644. [Google Scholar] [CrossRef]
  120. Parodi, G.; Julio, C. ¿Dónde se posan los ojos al leer textos multisemióticos disciplinares? Procesamiento de palabras y gráficos en un estudio experimental con eye tracker. Rev. Signos 2016, 49, 149–183. [Google Scholar] [CrossRef]
  121. Muraoka, T. The electoral implications of politically irrelevant cues under demanding electoral systems. Political Sci. Res. Methods 2019, 9, 312–326. [Google Scholar] [CrossRef]
  122. Benoit, K.; Munger, K.; Spirling, A. Measuring and Explaining Political Sophistication through Textual Complexity. Am. J. Political Sci. 2019, 63, 491–508. [Google Scholar] [CrossRef]
  123. Huybrechts, L.; Teli, M. The Politics of Co-Design. CoDesign 2020, 16, 1–2. [Google Scholar] [CrossRef]
  124. Averbeck, J.M.; Miller, C. Expanding Language Expectancy Theory: The Suasory Effects of Lexical Complexity and Syntactic Complexity on Effective Message Design. Commun. Stud. 2013, 65, 72–95. [Google Scholar] [CrossRef]
  125. Rasmussen, S.H.R.; Ludeke, S. Cognitive ability is a powerful predictor of political tolerance. J. Pers. 2021, 90, 311–323. [Google Scholar] [CrossRef]
  126. Holland, D.; Krause, A.; Provencher, J.; Seltzer, T. Transparency tested: The influence of message features on public perceptions of organisational transparency. Public Relat. Rev. 2018, 44, 256–264. [Google Scholar] [CrossRef]
  127. Amsalem, E. How Informative and Persuasive is Simple Elite Communication? Public Opin. Q. 2019, 83, 1–25. [Google Scholar] [CrossRef]
  128. Jha, S.; Jha, S.K.; Velasquez, A. Neuro-symbolic Generative AI Assistant for System Design. In Proceedings of the 2024 22nd ACM-IEEE International Symposium on Formal Methods and Models for System Design (MEMOCODE), Raleigh, NC, USA, 3–4 October 2024; IEEE: Piscataway, NJ, USA; pp. 75–76. [Google Scholar] [CrossRef]
  129. Zhang, W.; Seong, D. Using Artificial Intelligence to Strengthen the Interaction between Humans and Computers and Biosensor Cooperation. J. Wirel. Mob. Netw. Ubiquitous Comput. Dependable Appl. 2024, 15, 53–68. [Google Scholar] [CrossRef]
  130. Yang, W. Beyond algorithms: The human touch machine-generated titles for enhancing click-through rates on social media. PLoS ONE 2024, 19, e0306639. [Google Scholar] [CrossRef] [PubMed]
  131. Durugbo, C.M. Eye tracking for work-related visual search: A cognitive task analysis. Ergonomics 2021, 64, 225–240. [Google Scholar] [CrossRef]
  132. Lee, G.; Kim, H. Algorithm fashion designer? Ascribed mind and perceived design expertise of AI versus human. Psychol. Mark. 2024, 42, 255–273. [Google Scholar] [CrossRef]
  133. Hua, Y.; Ni, J.; Lu, H. An eye-tracking technology and MLP-based colour matching design method. Sci. Rep. 2023, 13, 1294. [Google Scholar] [CrossRef]
  134. Wright, K.B.; Bafna, S. Structure of Attention and the Logic of Visual Composition. Behav. Sci. 2014, 4, 226–242. [Google Scholar] [CrossRef]
  135. Anupama, T.; Rosita, S. Neuromarketing Insights Enhanced by Artificial Intelligence. ComFin Res. 2024, 12, 24–28. [Google Scholar] [CrossRef]
  136. Richardson, J.; Witzleb, N.; Paterson, M. Political Micro-Targeting in an Era of Big Data Analytics. In Big Data, Political Campaigning and the Law; Routledge: London, UK, 2019; pp. 1–14. [Google Scholar] [CrossRef]
  137. Eisend, M.; Muldrow, A.F.; Rosengren, S. Diversity and inclusion in advertising research. Int. J. Advert. 2022, 42, 52–59. [Google Scholar] [CrossRef]
  138. Messner, W. Cultural Differences in an Artificial Representation of the Human Emotional Brain System: A Deep Learning Study. J. Int. Mark. 2022, 30, 21–43. [Google Scholar] [CrossRef]
  139. Kieslich, K.; Keller, B.; Starke, C. Artificial intelligence ethics by design. Evaluating public perception on the importance of ethical design principles of artificial intelligence. Big Data Soc. 2022, 9, 20539517221092956. [Google Scholar] [CrossRef]
Figure 1. Conceptual model framework. All images presented are included in the article except the image on the right (Step 4), which presents the fog map. Attention heatmaps show which areas are most likely to catch people’s eyes when seeing an image. The colour ranges from green through yellow to red, indicating the cumulative time of eye fixations in each region of an image (Step 4, Image on the left). Warmer colours indicate more attention. The fogmap image (Step 4, image on the right) spots small amounts of attention. If we can’t see something on the fogmap, people won’t see it either.
Informatics 12 00030 g001
Figure 2. (a) Design 0: Original political promotional flyer from Aljazeera. (b) Design 1: Created by a professional graphic designer. (c) Design 2: Created by a professional graphic designer. (d) Design 3: Created by a professional graphic designer based on CoPilot recommendations.
Informatics 12 00030 g002
Figure 3. Representative areas of interest (AOIs) for the four design variants. The figure individually illustrates each design configuration’s four key metrics—focus, cognitive demands, clarity, and engagement.
Informatics 12 00030 g003
Figure 4. Engagement scores heat map for all areas of interest across all designs.Colors represent engagement scores, with dark blue indicating lowest engagement (0–2), light blue for low-moderate engagement (2–4), white for moderate engagement (4–6), light red for high-moderate engagement (6–8), and dark red for highest engagement (8–10).
Informatics 12 00030 g004
Figure 5. Attention scores line chart for all areas of interest across all designs.
Informatics 12 00030 g005
Figure 6. Performance scores across designs. The bar chart visually represents the weighted performance scores for all designs.
Informatics 12 00030 g006
Figure 7. 13 Areas of interest (AOI)-level clarity scores across all four designs presented in Python line chart.
Informatics 12 00030 g007
Figure 8. Scatter plots of clarity vs. cognitive demand for Designs 0, 1, 2, and 3.
Informatics 12 00030 g008
Table 1. Supporting hypotheses.
HypothesisDescription
H1a: Attention CapturePolitical campaign flyers designed using Predict AI’s Co-Pilot will achieve higher initial attention scores (start attention) than traditionally designed flyers.
H1b: Emotional EngagementPolitical campaign flyers designed with Predict AI’s Co-Pilot will elicit stronger emotional engagement, measured by higher end attention and lower cognitive demand scores.
H1c: Message ClarityPolitical campaign flyers created using Predict AI’s Co-Pilot will have higher clarity scores than those designed using traditional methods, ensuring better comprehension of campaign messages.
H1d: Viewer Engagement and RecallPolitical campaign flyers designed with Predict AI’s Co-Pilot will result in higher viewer engagement, recall, and recognition scores than traditionally designed flyers.
Table 2. Summary of design modifications for political campaign flyers.
Design VersionKey ModificationsDesign ObjectivesDesigner
Design 0 (Original Flyer)No design changes; kept original as published by Al Jazeera.Baseline comparison for evaluating improvements.Not Applicable (Source: Al Jazeera)
Design 1Enlarged candidate names and party text with bold font, colour-matched text to the election logo, added a secondary background logo behind candidate figures, slightly enlarged figures for greater emphasis, lightened the main headline background from dark to light for improved readability, and reduced body text size to focus viewer attention on primary content. The election logo’s position is positioned to its original placement for a familiar visual structure.Increase the visibility of key details, emphasise candidate prominence, and create a cleaner, more visually compelling layout.Professional Graphic Designer
Design 2Retained changes from Design 1, including bold candidate names and text alignment. Further improvements involved adjusting background contrast, repositioning the US Elections logo for increased prominence, refining text hierarchy, balancing figure prominence, and removing official party icons. Create balance, strengthen party association awareness, improve readability, and maintain familiar visual structure.Professional Graphic Designer
Design 3Incorporated recommendations from CoPilot; replaced static figures with dynamic debate poses, adjusted background contrast; repositioned key elements for better hierarchy, emphasised key headlines with bold text, improved logo visibility, applied colour-coded emphasis on political affiliations; and used action-oriented visuals with a subtle patriotic background. A prominent election logo was added to the background behind candidates to draw attention and subconsciously enhance the design. Official party icons (donkey for Democrats, elephant for Republicans) were added near candidates’ names to attract subliminal attention to each party and its respective candidate. The election logo’s position was restored to its original placement for a familiar visual structure.Boost emotional engagement, highlight action dynamics, and improve message clarity through visual storytelling.Professional Graphic Designer (based on AI CoPilot Recommendations)
Table 3. Characterisation of selected areas of interest (AOIs).
AOI IDAOI NameFunctional Description
1Main Headline on Top (Main Headline)Primary attention grabber conveys key info
2Body Text on Top (Body Text)Supporting text for event context
3Trump Figure (Candidate Image: Trump)Candidate representation (visual anchor)
4Kamala Figure (Candidate Image: Kamala)Candidate representation (visual anchor)
5Kamala Name (Name Tag: Kamala)Identifies candidate (text label)
6Trump Name (Name Tag: Trump)Identifies candidate (text label)
7Democratic Party Name (Party Label: Democratic)Displays political affiliation (Kamala)
8Republican Party Name (Party Label: Republican)Displays political affiliation (Trump)
9US Elections Logo (Election Logo)Central campaign event branding
10Venue Text (Event Venue)Provides event location
11Election and Venue Dates (Event Date)Displays event timeline and deadlines
12Source (Source Reference)Source reference for credibility
13Al Jazeera Logo (Media Logo)Media attribution for journalistic integrity
Table 4. ANOVA results.
MetricF-Statisticp-ValueSignificance
Clarity0.200.8989Not Significant
Engagement0.010.9985Not Significant
Total Attention0.040.9884Not Significant
Table 5. Bonferroni post-hoc test results for clarity.
Group 1Group 2Mean Differencep-ValueSignificance
Clarity_Design_0Clarity_Design_1−0.970.8724No
Clarity_Design_0Clarity_Design_2−0.370.9915No
Clarity_Design_0Clarity_Design_3−0.450.9849No
Clarity_Design_1Clarity_Design_20.600.9653No
Clarity_Design_1Clarity_Design_30.520.9769No
Clarity_Design_2Clarity_Design_3−0.080.9999No
Table 6. Bonferroni post-hoc test results for engagement.
Group 1Group 2Mean Differencep-ValueSignificance
Engagement_Design_0Engagement_Design_10.160.9988No
Engagement_Design_0Engagement_Design_20.050.9999No
Engagement_Design_0Engagement_Design_3−0.011.0000No
Engagement_Design_1Engagement_Design_2−0.100.9997No
Engagement_Design_1Engagement_Design_3−0.170.9985No
Engagement_Design_2Engagement_Design_3−0.060.9999No
Table 7. Bonferroni post-hoc test results for total attention.
Group 1Group 2Mean Differencep-ValueSignificance
TotalAttention_Design_0TotalAttention_Design_1−0.390.9992No
TotalAttention_Design_0TotalAttention_Design_20.560.9977No
TotalAttention_Design_0TotalAttention_Design_30.450.9988No
TotalAttention_Design_1TotalAttention_Design_20.960.9891No
TotalAttention_Design_1TotalAttention_Design_30.850.9923No
TotalAttention_Design_2TotalAttention_Design_3−0.101.0000No
Disclaimer/Publisher’s Note: The statements, opinions and data contained in all publications are solely those of the individual author(s) and contributor(s) and not of MDPI and/or the editor(s). MDPI and/or the editor(s) disclaim responsibility for any injury to people or property resulting from any ideas, methods, instructions or products referred to in the content.

