Article

Modelling Service Quality of Internet Service Providers during COVID-19: The Customer Perspective Based on Twitter Dataset

by
Bagus Setya Rintyarna
1,*,
Heri Kuswanto
2,
Riyanarto Sarno
3,
Emy Kholifah Rachmaningsih
4,
Fika Hastarita Rachman
5,
Wiwik Suharso
6 and
Triawan Adi Cahyanto
6
1
Department of Electrical Engineering, Universitas Muhammadiyah Jember, Jember 68124, Indonesia
2
Department of Statistics, Institut Teknologi Sepuluh Nopember, Surabaya 60111, Indonesia
3
Department of Informatics, Institut Teknologi Sepuluh Nopember, Surabaya 60111, Indonesia
4
Department of Government Studies, Universitas Muhammadiyah Jember, Jember 68124, Indonesia
5
Department of Informatics, Universitas Trunojoyo Madura, Bangkalan 69162, Indonesia
6
Department of Informatics, Universitas Muhammadiyah Jember, Jember 68124, Indonesia
*
Author to whom correspondence should be addressed.
Informatics 2022, 9(1), 11; https://doi.org/10.3390/informatics9010011
Submission received: 1 November 2021 / Revised: 22 January 2022 / Accepted: 24 January 2022 / Published: 29 January 2022

Abstract

:
Internet service providers (ISPs) conduct their business by providing Internet access features to their customers. The COVID-19 pandemic has shifted most activity being performed remotely using an Internet connection. As a result, the demand for Internet services increased by 50%. This significant rise in the appeal of Internet services needs to be overtaken by a notable increase in the service quality provided by ISPs. Service quality plays a great role for enterprises, including ISPs, in retaining consumer loyalty. Thus, modelling ISPs’ service quality is of great importance. Since a common technique to reveal service quality is a timely and costly pencil survey-based method, this work proposes a framework based on the Sentiment Analysis (SA) of the Twitter dataset to model service quality. The SA involves the majority voting of three machine learning algorithms namely Naïve Bayes, Multinomial Naïve Bayes and Bernoulli Naïve Bayes. Making use of Thaicon’s service quality metrics, this work proposes a formula to generate a rating of service quality accordingly. For the case studies, we examined two ISPs in Indonesia, i.e., By.U and MPWR. The framework successfully extracted the service quality rate of both ISPs, revealing that By.U is better in terms of service quality, as indicated by a service quality rate of 0.71. Meanwhile, MPWR outperforms By.U in terms of customer service.

1. Introduction

Internet service providers (ISPs) conduct their business by providing features of Internet access to their customers. In the digital age, access to the Internet has become a basic need, enabling us to communicate, shop and even work. The demand for Internet services has significantly increased, especially since the spread of the coronavirus disease (COVID-19), which was first identified in Wuhan in 2019. The pandemic has shifted work and school activities to an online mode performed from home. Business and marketing are carried out by online marketplaces, and millions of workplaces shift to remote methods. These facts demand the increase in the real-time connection through the Internet. As reported by Forbes, global Internet consumption has increased by 50%. From that portion, up to 70% of this traffic is comprised of video streaming.
This significant rise in the appeal of Internet services needs to be overtaken by the notable increase in the service quality provided by ISPs [1]. To retain the constant growth of their business in the era of competition, ISPs are required to ensure great customer experiences [2]—customer satisfaction and loyalty can be thus retained. Service quality (SERVQUAL) is a common measure to indicate the business performance of an enterprise based on customer perceptions [3]. The measure comprises five dimensions of quality, i.e., (1) tangible; (2) reliability; (3) responsiveness; (4) assurance; and (5) empathy. SERVQUAL plays a great role for enterprise, including ISPs, since it has a direct impact on its success or failure [4]. Thus, the continuous assessment of the service quality is a challenging task.
The SERVQUAL assessment is commonly conducted by pencil-based survey involving a number of respondents answering the query that indicates five quality dimensions. Thaichon [5] evaluates the service quality of ISPs in Thailand to determine customer loyalty to the product by defining four measures of service quality for ISPs, i.e., (1) network quality; (2) customer service; (3) information quality; (4) privacy and security. This study was based on an online pencil survey. The survey covered 1507 samples of residential Internet users in all regions of Thailand. This work revealed that information support is the only dimension that strongly relates to consumer commitment.
However, the pencil survey technique is judged to be timely and costly [6] in the era of the online platform. In this regard, this work proposes to assess the service quality of ISPs based on a reliable yet effective computational intelligence-based technique, namely Sentiment Analysis (SA) [6], to reveal the service quality of ISPs. Sentiment Analysis is a natural language processing (NLP)-based technique that reveals people’s opinions towards a certain entity by using a piece of online text data spread in social media or electronic word of mouth (e-WOM) [7]. This technique commonly assigns value to determine whether an entity is positive, negative or neutral [8].
Since online platforms, including social media, have become an inseparable part of most individuals’ daily life needs of sharing and communication, it has the potential to shape people’s opinions. With the exponential growth of electronic word of mouth, the online platform has become a rich source of information that can reveal certain trends based on a computational text mining-based technique [9], i.e., making sentiment analysis a promising technique to model various public patterns and tendencies. According to Wallach [10], Sentiment Analysis has become a part of computational social sciences (CSS), i.e., a discipline that learns social tendencies by employing digital, computational and statistical approaches.
Compared with the pencil survey-based technique, Sentiment Analysis offers a reliable yet fast analysis. SA has many fields of application. Sentiment Analysis was employed to model consumer acceptance towards online car-hailing as an alternative low-carbon mode of travel for today’s society. The work proposed a framework based on an experimental model of a memory neural network. Combined with the attention mechanism, the result of the experiment confirmed a higher F1 value compared with the baseline.
The popularity of social media platforms contributes to the broad range application of Sentiment Analysis. Another study employing Sentiment Analysis for the Twitter dataset attempted to model public perception in Saudi Arabia with regard to women’s right to drive in public areas [11]. This study aimed to provide the proportion of agreeing, opposing and neutral opinions towards establishing women’s right to drive in public areas. The result was then mapped to the diffusion of innovation (DOI) theory point of view [12] as a suitable social theory to study women’s driving issues in Saudi Arabia. DOI considers innovation as a new custom or arrangement apprehended as new by an individual or unit of adoption [12].
In another study, Sentiment Analysis was employed to study public tendency towards organic food consumption during the COVID-19 pandemic [6]. Under the pandemic situation, healthy food, including organic food, is believed to maintain an optimal immune system that is important for coping with virus infection. The dataset was collected from Twitter with the hashtag #makananorganik by employing the OAuth package of R language. To simulate a spatial representation of a word network, this study incorporated ForceAtlas2 [13]. ForceAtlas2 makes it possible to represent key features of a word network spatialization, i.e., the attraction force F a and the repulsion force F r which denotes the distance between two nodes in word network. The sentiment of the text is then investigated using Valence Aware Dictionary and Sentiment Reasoner (VADER), i.e., a lexicon-based technique of Sentiment Analysis [14]. In the last step, the ratio of the acceptance is then presented.
Sentiment Analysis has also been adopted for implementing a restaurant recommendation system [15]. The system first extracts the user’s preference from the collected text data using a lexicon-based Sentiment Analysis technique employing SentiwordNet. SentiwordNet is a sentiment lexicon where the term collection originating from the WordNet database is assigned to three sentiment scores: positive, negative and neutral [16]. To recommend the restaurant, the system extracted the noun from sentences and clustered the nouns along with their similarity using the Wu and Palmer similarity algorithm. To cluster the noun, hierarchical clustering and partitioning categories were employed in that work.
In addition to the popularity and applicability of Sentiment Analysis, the motivation and the contribution of this work are as follows:
  • Extracting customer perception about the service quality of ISPs by adopting a computational intelligence technique—namely Sentiment Analysis. ISPs are paid very limited attention to among researcher compared with other types of enterprise.
  • Providing a framework for modelling the service quality of ISPs based on the sentiment score extracted from the Twitter dataset.
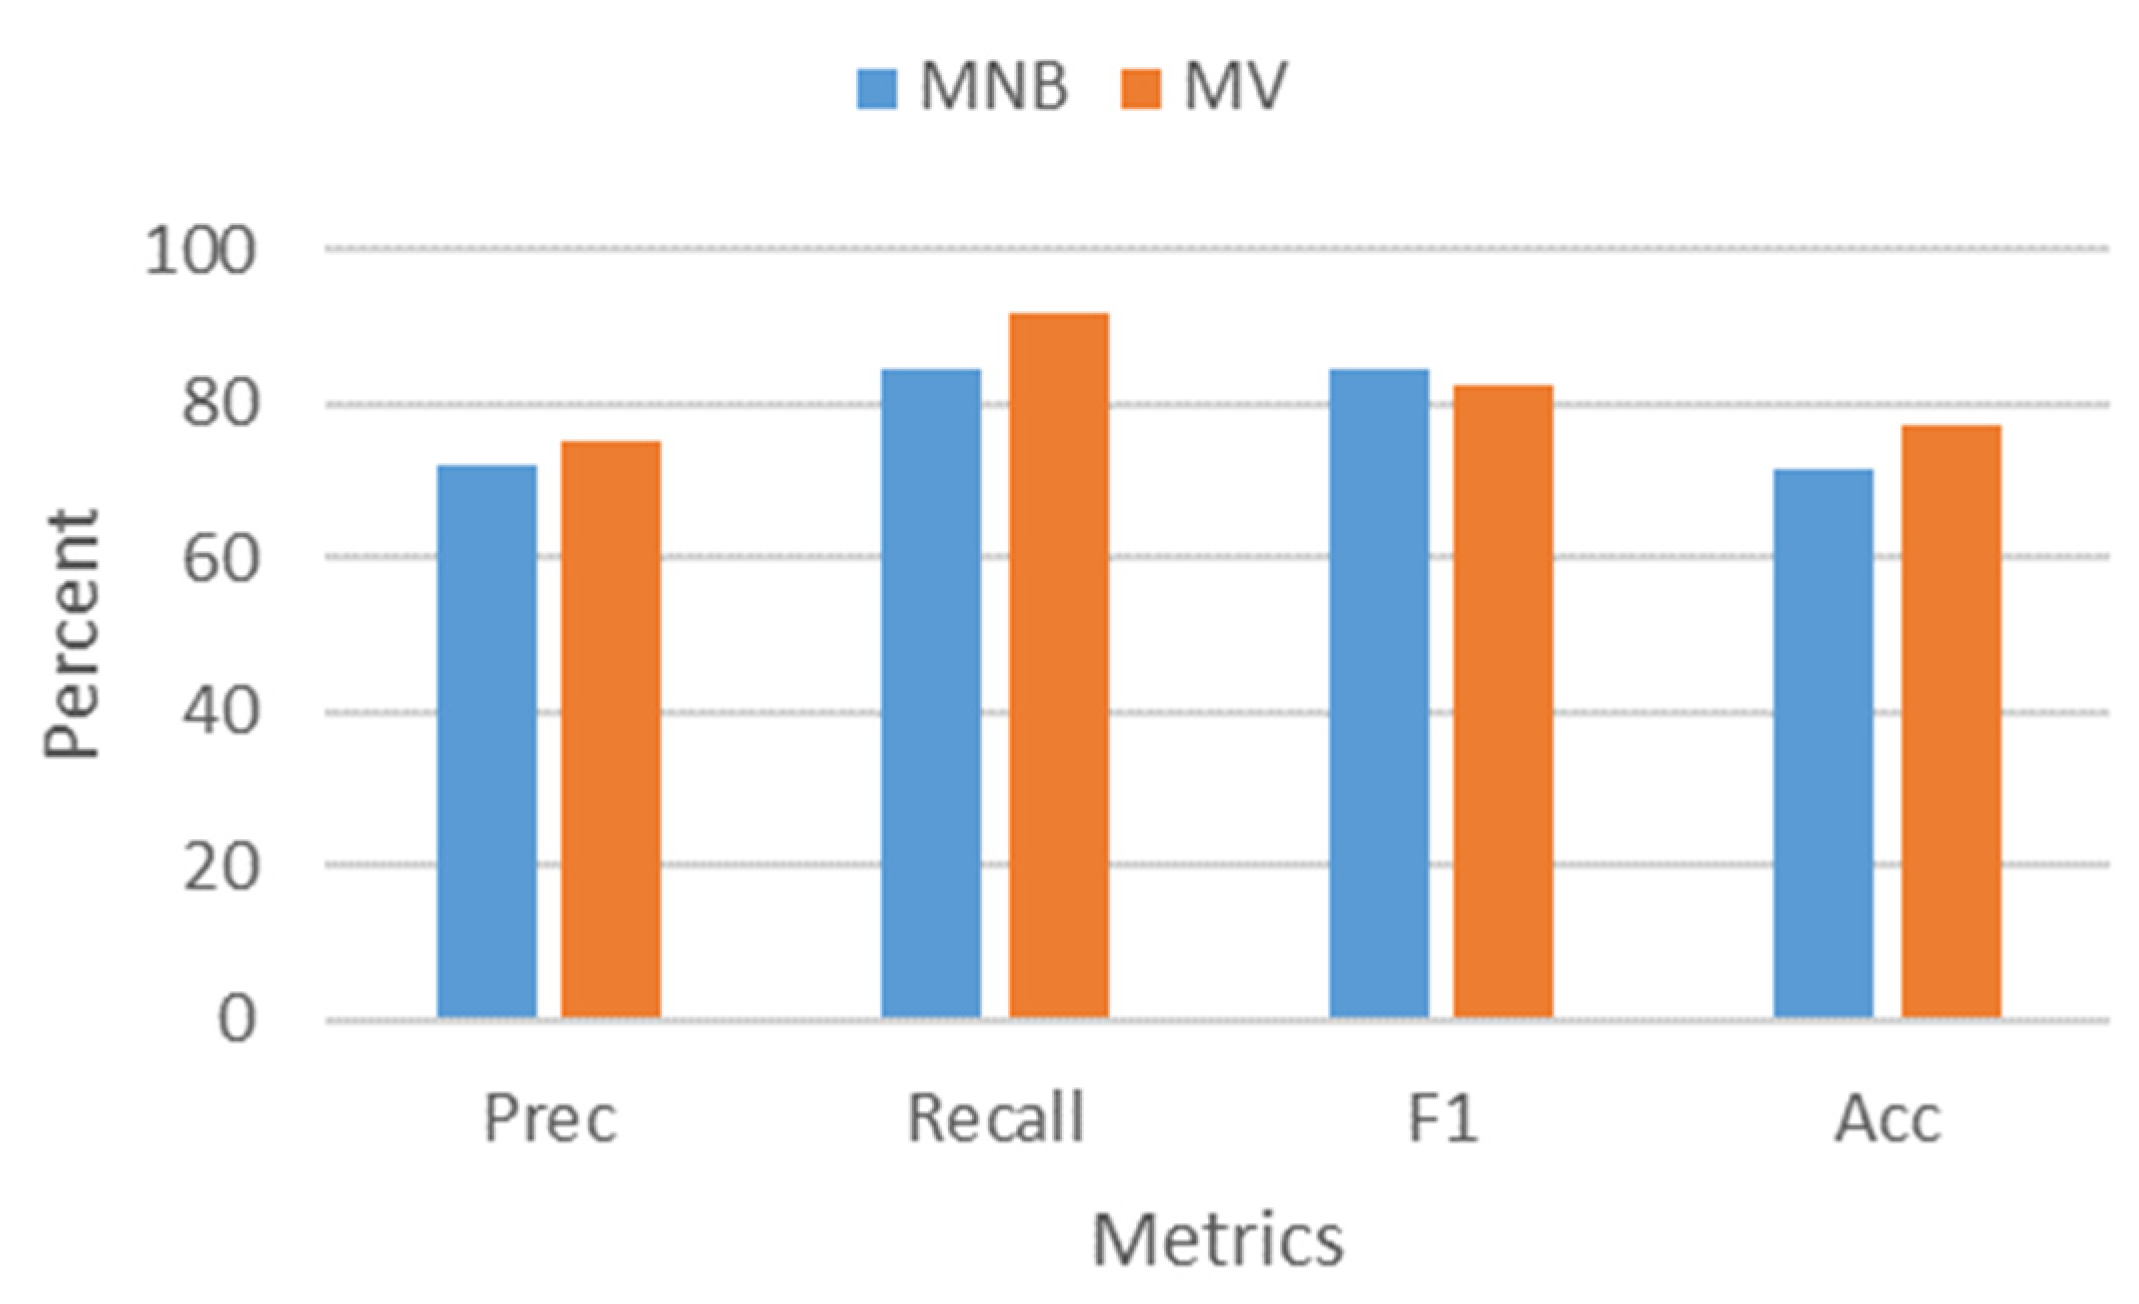
  • Evaluating the performance of the sentiment analysis task of the proposed framework using several performance metrics.
The rest of this paper is organized into the following five sections. The aim, the context of the research and the key references are described in Section 1. Section 2 presents related works on common techniques to reveal service quality. Section 3 describes the proposed method employed in this research. Meanwhile, Section 4 presents the scenario used in the experiment. Finally, Section 5 summarizes the result of the work which was performed.

2. Related Work

This section will explore several state-of-the-art studies on assessing service quality. Service quality (SERVQUAL) is a popular measure among researchers and institutional management indicating the business performance of an enterprise based on customer perceptions [3]. The COVID-19 pandemic has changed people’s attitudes in doing their online activities. This fact has triggered a significant increase in Internet consumption. For ISPs whose main business is providing an Internet connection, this fact is a great challenge. To maintain the growth of their business, ISPs need to assure good service quality. Evaluating service quality is urgent for ISPs and their customers [17]. For ISPs, the information is important for improving their service, mainly their product features. On the contrary, the information is important for customers to decide which ISPs are suitable for their needs.
Most work on assessing enterprise service quality, including ISPs, is based on the pencil survey technique. A study was conducted to assess the service quality of several seaports of The Economic Community of Western African States (ECOWAS) countries, i.e., Nigeria, Gambia, Ghana, Cote d’Ivoire, Benin and Togo. Customers of the seaport in those countries were asked to fill the prepared, structured questionnaire [18]. The questionnaire, which adopted SERVQUAL metrics of Parasuraman [19], comprises: (1) tangibility; (2) reliability; (3) responsiveness; (4) assurance; and (5) empathy. The assessment aimed at providing strategy and establishing arrangements for coping challenges in exporting and importing goods.
Shah [20] quantified the service quality of the Pakistan International Airline (PIA) employing the SERVQUAL from a passenger perspective. A systematic random sampling technique and process macros were adopted to sample the data. The questionnaire comprises three items of information: (1) the respondent’s demographic; (2) the respondent’s expectations; and (3) the passenger’s perception about SERVQUAL of Pakistan International Airline. Confirmatory factor analysis was used to explore the passenger’s perception. A correlation matrix was adopted to describe the impact of passengers’ perception about service quality on their behavioural intentions. Finally, the study also suggests improving in-flight and on-ground activities, facilities and environment.
Using 104 respondents from medical institutions, the service quality of pharmaceutical logistics was investigated [21]. The questionnaire followed the Parasuraman scale [22]. Service quality metrics from Parasuraman [3] were incorporated with the refined two dimensional Kano Model to reveal the rate of pharmaceutical logistic service quality. The refined Kano Model comprises two quality attributes: (1) potential quality and (2) care-free. To verify the constructs, Cronbach’s alpha coefficient [23] was employed. The convergent validity test was also performed along with the discriminant validity test. The work demonstrated that service quality was able to provide an edge for the customer in the market.
One previous state-of-the-art study of service quality was mostly concerned with employing a pencil survey-based method involving a number of respondents extensively interviewed using a questionnaire derived from several service quality metrics—mainly those developed by Parasuraman [22]. To extend the metrics, another work enriched Pasuraman’s by adopting the refined Kano Model [21]. In the era of big data platforms, a reliable and fast computer-assisted technique seems to be more promising and challenging for revealing service quality, including for ISP2. From the previously elaborated related study, several insights in this study can be highlighted as follows:
(1)
This study aimed to provide a framework for determining the service quality of ISPs by using an extensive dataset from social media, particularly Twitter. Compared with the common pencil-based survey that is time-consuming, costly and labour-intensive, this approach seems to be a promising alternative for revealing service quality;
(2)
Studies that explore service quality in Indonesia, especially the service quality of ISPs, have to date been extremely limited. To the best of our knowledge, this is the first study to model the service quality of Indonesian ISPs.

3. Materials and Methods

To extract ISP service quality using the Sentiment Analysis technique, we mostly applied the natural language processing (NLP) approach. This is a field of study under computational intelligence that interprets, resolves, and retrieves unstructured information from text data. NLP converts unstructured information into useful structured text data information widely spread on online platforms (29). In this work, our focus is on the Twitter dataset.
In the first step, we collect Tweets from Twitter using the Twitter API. We employed the OAuth package of R language to authenticate the link of the Twitter API with the Twitter account. We collect Tweets with the hashtag #by.u and #mpwr using R language as those two ISPs are the product of the two largest telecommunications companies in Indonesia: Telkomsel and Indosat. Choosing those hashtags is the simplest option to obtain Tweets commenting on the two ISPs.
To clean and prepare the data after collecting the Tweet, the initial step of the NLP approach usually involves text preprocessing, consisting of (1) case folding; (2) tokenizing; (3) normalization; (4) stop word removal; and (5) stemming. Case folding aims to change all the letters in the Tweets to lowercase. In this context, tokenizing is a process of splitting Tweets into words. Stop word removal or filtering is the stage of taking important words from the token results using a stop list algorithm. Meanwhile, stemming is the process of changing the word into its root form. In this work, we used Python Sastrawi (30), the extension of PHP Sastrawi, to perform text preprocessing. The general framework steps for extracting the service quality are presented in Figure 1.
Common measures for assessing the service quality of a common enterprise [19] involve five metrics: (1) tangible; (2) reliability; (3) responsiveness; (4) assurance; and (5) empathy. In the case of ISPs, Taichon [5] developed a dimension for evaluating the service quality of ISPs. The metrics comprise (1) network quality; (2) customer service; (3) information quality; and (4) privacy and security. We agree that the dimension of Thaicon is more suitable for ISPs since it is derived from a thorough study and is extensively validated [5]. We provide the keywords for Thaichon’s service quality metrics to determine the context of metrics in a Tweet as presented in Table 1.
The keyword is employed to determine the context of metrics delivered in Tweets. To determine the context of the metrics, we calculated the similarity between the dataset and the keywords using cosine similarity. The cosine comparing the similarity [24] between keywords k i and dataset d j is calculated using (1):
s i m ( k , d ) = k · d | | k | | | | d | |
where | | k | | is the Euclidean norm of vector k representing the length of k , defined as (2):
| | k | | = 1 m k i 2
Meanwhile, | | d | | is the length of d and is defined as (3):
| | d | | = 1 n d j 2
The service quality metrics for the Tweet is then determined by the keyword that has an argument minimum of s i m ( k , d ) .
To determine the sentiment orientation (SO) of the Tweet, we employed the three machine learning (ML) algorithms, namely: (1) Naïve Bayes; (2) Multinomial Naïve Bayes; and (3) Bernoulli Naïve Bayes. In this work, we used three classes of sentiment orientation: positive, neutral and negative. That sentiment orientation is commonly used in the SA task. For the first step to determine the Tweet’s SO, the algorithm builds the model for ML. To build the model of ML algorithms, datasets were manually annotated as a ground truth.
Naïve Bayes is a simple probabilistic classifier based on a statistical probabilistic assuming that features are independent. Given C S O is sentiment orientation class that needs to be assigned, t is the term feature of the dataset and conditional probability that specifies that Naïve Bayes can be decomposed as (4) [25]
p ( C S O | t ) = p ( C S O ) · p ( t | C S O ) p ( t )
At last, the sentiment orientation S O label is given by (5)
S O = arg max S O   { 1 , .. , K } p ( C S O ) i = 1 n p ( t i | C S O )
Multinomial Naïve Bayes is a text-oriented version of Naïve Bayes that generates features from the assumed simple multinomial distribution. As for the Bernoulli Naïve Bayes, it accepts Bernoulli distribution in the development of the learning model.
Since the bag of word (BoW) extracted in the ML stage comprises discrete values, the Multinomial Naïve Bayes is expected to work best with a smoothing Laplace parameter, eliminating the word absent in the vocabulary. As for Bernoulli, this handles the absent word in the vocabulary by penalizing the non-occurrence features. The sentiment orientation of the dataset is finally determined by the majority voting of the algorithms, as presented in Figure 2.
To evaluate the performance of all employed machine learning algorithms, we calculate the precision, recall, f1, and accuracy involving the true positive t p , true negative t n , false positive f p , and false negative f n of confusion metrics. The performance metrics are calculated using Equations (6)–(9) as follows:
p r e c i s i o n = t p t p + f p
r e c a l l = t p t p + f n
f 1 = 2 ( r e c a l l p r e c i s i o n ) r e c a l l + p r e c i s i o n
a c c u r a c y = t p + t n t p + t n + f p + f n
The last step is that of rating service quality. Based on the personal perspective of the Twitter user who experiences the service from ISPs, there is a chance that a service quality metric has a different sentiment orientation. Here, in Table 2, we provide an example of sentiment orientation assigned to service quality metrics S Q i by the majority voting of three ML algorithms for every Tweet document d j . In Table 2, we denote +, −, N for positive, negative, and neutral orientations.
We defined the service quality as a portion of positive comments to all comments revealed on Twitter. Thus, we calculate the rate of service quality s q r by employing our proposed Equation (10):
s q r = 1 n p o s S O 1 n p o s S O + 1 n n e g S O + 1 n n e u S O
where s q r is the service quality rate, n is the number of Tweet documents, and p o s S O , n e g S O ,   n e u S O are the positive, negative and neutral values of service quality, respectively.

4. Results and Discussion

Since service quality is important for ISPs, especially during the significant increase in the demand for Internet connection because of the pandemic, this study proposes a framework to automatically extract the service quality of ISPs without involving the labour-intensive technique based on pencil survey approach, yet making use of SA on the Twitter dataset.
In the first step, we successfully collected 9637 Tweets from Twitter using the hashtag #by.U and #mpwr from the period of 6 February–12 February 2021. The collected dataset is presented in Table 3.
To evaluate and validate the machine learning model built by the ML algorithms, we manually annotated the sentiment orientation label to each Tweet. The annotation result is presented in Table 4.
We then evaluated the performance of the ML algorithm on both datasets. The results of the validation using precision, recall, F1 and accuracy metrics is presented in Figure 3, Figure 4 and Figure 5. The majority voting of the three algorithms is expected to enhance the performance of individual ML algorithms. In Figure 3, Figure 4 and Figure 5, we compared the performance of majority voting with individual algorithms. On the other hand, in Figure 6, we compared the performance of MV with the average performance of ML algorithms.
To determine the service quality assigned in Tweets, we calculated the similarity between the service quality keywords and all words appearing in the Tweet document using (1), (2) and (3). The service quality was determined by the maximum value of s i m ( k , d ) which means that the word has the most similar meaning to the keywords. To achieve a better result in determining the service quality context of the Tweet, we extended initial keywords using the technique described in Figure 6. Since we used the synonym in the WordNet repository, we first translated the word into English. WordNet is a free and public computational linguistics tool that serves as an English lexical database. WordNet classifies verbs, nouns and adjectives into a set of synonym sets (synsets) that deliver different meanings.
In the last step, we then translated the synonym into Bahasa. Table 5 and Table 6 present the results of the keyword expansion.
Finally, we calculated the rate of service quality of By.U and MPWR using Equation (6) as presented in Figure 7. By.U is powerless in terms of network quality but better in customer service. On the other hand, MPWR outperformed By.U in terms of network quality, reaching a rate of 0.71. For the rest of service quality, both ISPs reached the average rate of 0.6 and 0.5 for information quality and security, respectively.
One of the advantages of our approach is that it can be used in other languages. To do so, we need to translate the expanded keywords of Thaicon’s service quality metrics into those languages. Subsequently, we can use the same method delivered in this work.

5. Conclusions

Internet service providers (ISPs) conduct their business by providing features of Internet access to their customers. The COVID-19 pandemic has shifted most activities to the remote method using an Internet connection. As a result, demand for Internet services increased 50%. To survive their business, ISPs need to increase the service quality of their enterprise. In that regard, this work proposed a method based on the Sentiment Analysis technique to reveal the service quality without conducting a commonly used pencil survey. We evaluated the performance of the Sentiment Analysis technique using the collected Twitter dataset and proved that the majority voting method outperforms the performance of individual machine learning algorithms. Using two ISPs in Indonesia as a case study, the method successfully extracted the service quality rate of both ISPs. As the initial study to reveal the service quality of ISPs using a computationally based technique of sentiment analysis, this work will be beneficial for both ISPs themselves and their customers for shaping their choice of service. For our future work, we will conduct an extensive experiment by collecting a large-scale Twitter dataset from a longer period of crawling to reveal service quality patterns that may be incurred during different periods of the COVID-19 pandemic. We will also employ an advanced machine learning algorithm technique. This work focuses on delivering a formula to a generate service quality rate. Another drawback that will also be anticipated in future work is that the synonym expansion was only performed for the keywords. In the future, we will expand synonyms for both keywords and text datasets to gain a fine-grained result.

Author Contributions

B.S.R. designed the methodology and running experiment. B.S.R. also wrote the manuscript under the supervision of H.K. and R.S. E.K.R., F.H.R., W.S. and T.A.C. wrote the manuscript. All authors have read and agreed to the published version of the manuscript.

Funding

This research received no external funding.

Institutional Review Board Statement

Not applicable.

Informed Consent Statement

Not applicable.

Data Availability Statement

Not applicable.

Acknowledgments

The authors would like to thank Universitas Muhammadiyah Jember for supporting this research. We also would like to thank to World Class Professor schema of Ministry of Education of Indonesia that support the publication of this manuscript trough fine tuning program.

Conflicts of Interest

The authors declare no conflict of interest.

References

  1. Quach, T.N.; Jebarajakirthy, C.; Thaichon, P. The effects of service quality on internet service provider customers’ behaviour: A mixed methods study. Asia Pac. J. Mark. Logist. 2016, 28, 435–463. [Google Scholar] [CrossRef]
  2. Alamsyah, A.; Bernatapi, E.A. Evolving Customer Experience Management in Internet Service Provider Company using Text Analytics. In Proceedings of the 2019 International Conference on ICT for Smart Society (ICISS), Bandung, Indonesia, 19–20 November 2019. [Google Scholar]
  3. Berry, L.L.; Parasuraman, A.; Zeithaml, V.A. SERVQUAL: A multiple-item scale for measuring consumer perceptions of service quality. J. Retail. 1988, 64, 12–40. [Google Scholar]
  4. Abbas, J. HEISQUAL: A modern approach to measure service quality in higher education institutions. Stud. Educ. Eval. 2020, 67, 100933. [Google Scholar] [CrossRef]
  5. Thaichon, P.; Lobo, A.; Prentice, C.; Quach, T.N. The development of service quality dimensions for internet service providers: Retaining customers of different usage patterns. J. Retail. Consum. Serv. 2014, 21, 1047–1058. [Google Scholar] [CrossRef]
  6. Rintyarna, B.S. Mapping acceptance of Indonesian organic food consumption under COVID-19 pandemic using Sentiment Analysis of Twitter dataset. J. Theor. Appl. Inf. Technol. 2021, 99, 1009–1019. [Google Scholar]
  7. Rintyarna, B.S.; Sarno, R.; Fatichah, C. Enhancing the performance of sentiment analysis task on product reviews by handling both local and global context. Int. J. Inf. Decis. Sci. 2018, 11. [Google Scholar] [CrossRef]
  8. Rintyarna, B.S.; Sarno, R.; Fatichah, C. Evaluating the performance of sentence level features and domain sensitive features of product reviews on supervised sentiment analysis tasks. J. Big Data 2020, 6, 84. [Google Scholar] [CrossRef] [Green Version]
  9. Eslami, S.P.; Ghasemaghaei, M.; Hassanein, K. Which online reviews do consumers find most helpful? A multi-method investigation. Decis. Support Syst. 2018, 113, 32–42. [Google Scholar] [CrossRef]
  10. Wallach, H. Conclusion: Computational social science: Toward a collaborative future. Comput. Soc. Sci. Discov. Predict. 2016. [Google Scholar] [CrossRef]
  11. Al-Razgan, M.; Alrowily, A.; Al-Matham, R.N.; Alghamdi, K.M.; Shaabi, M.; Alssum, L. Using diffusion of innovation theory and sentiment analysis to analyze attitudes toward driving adoption by Saudi women. Technol. Soc. 2021, 65, 101558. [Google Scholar] [CrossRef]
  12. Rogers, E.M.; Singhal, A.; Quinlan, M.M. Diffusion of Innovations; Taylor and Francis: Abingdon-on-Thames, UK, 2019; ISBN 9781351358712. [Google Scholar]
  13. Jacomy, M.; Venturini, T.; Heymann, S.; Bastian, M. ForceAtlas2, a Continuous Graph Layout Algorithm for Handy Network Visualization Designed for the Gephi Software. PLoS ONE 2014, 9, e98679. [Google Scholar] [CrossRef] [PubMed]
  14. Hutto, C.J.; Gilbert, E. VADER: A Parsimonious Rule-based Model for Sentiment Analysis of Social Media Text. In Proceedings of the International AAAI Conference on Web and Social Media, Ann Arbor, MI, USA, 1–4 June 2014; pp. 216–225. [Google Scholar]
  15. Asani, E.; Vahdat-nejad, H.; Sadri, J. Machine Learning with Applications Restaurant recommender system based on sentiment analysis. Mach. Learn. Appl. 2021, 6, 100114. [Google Scholar]
  16. Baccianella, S.; Esuli, A.; Sebastiani, F. SentiwordNet 3.0: An Enhanced Lexical Resource for Sentiment Analysis and Opinion Mining. In Proceedings of the Ninth International Conference on Language Resources and Evaluation, Valletta, Malta, 17–23 May 2010; pp. 2200–2204. [Google Scholar]
  17. Rintyarna, B.S.; Sarno, R.; Fatichah, C. Semantic Features for Optimizing Supervised Approach of Sentiment Analysis on Product Reviews. MDPI Computers 2019, 8, 55. [Google Scholar] [CrossRef] [Green Version]
  18. Sakyi, D. A comparative analysis of service quality among ECOWAS seaports. Transp. Res. Interdiscip. Perspect. 2020, 6, 100152. [Google Scholar] [CrossRef]
  19. Erdoǧmu, N.; Esen, M. An investigation of the effects of technology readiness on technology acceptance in e-HRM. Procedia-Soc. Behav. Sci. 2011, 24, 487–495. [Google Scholar] [CrossRef] [Green Version]
  20. Shah, F.T.; Syed, Z.; Imam, A.; Raza, A. The impact of airline service quality on passengers’ behavioral intentions using passenger satisfaction as a mediator. J. Air Transp. Manag. 2020, 85, 101815. [Google Scholar] [CrossRef]
  21. Chen, T.; Xu, R.; He, Y.; Wang, X. Improving sentiment analysis via sentence type classification using BiLSTM-CRF and CNN. Expert Syst. Appl. 2017, 72, 221–230. [Google Scholar] [CrossRef] [Green Version]
  22. Jaafar, M.; Abdul Aziz, A.R.; Ramayah, T.; Saad, B. Integrating information technology in the construction industry: Technology readiness assessment of Malaysian contractors. Int. J. Proj. Manag. 2007, 25, 115–120. [Google Scholar] [CrossRef]
  23. Tavakol, M.; Dennick, R. Making sense of Cronbach’s alpha. Int. J. Med. Educ. 2011, 2, 53–55. [Google Scholar] [CrossRef] [PubMed]
  24. Sidorov, G.; Gelbukh, A.; Gómez-Adorno, H.; Pinto, D. Soft similarity and soft cosine measure: Similarity of features in vector space model. Comput. Sist. 2014, 18, 491–504. [Google Scholar] [CrossRef]
  25. Lewis, D.D. Naive (Bayes) at forty: The independence assumption in information retrieval. In Proceedings of the European Conference on Machine Learning, Chemnitz, Germany, 21–23 April 1998; p. 16. [Google Scholar]
Figure 1. The framework of the service quality calculation.
Informatics 09 00011 g001
Figure 2. Determining SO using the majority voting of ML algorithms.
Informatics 09 00011 g002
Figure 3. Performance of NB vs. MV.
Informatics 09 00011 g003
Figure 4. Performance of MNB vs. MV.
Informatics 09 00011 g004
Figure 5. Performance of BNB vs. MV.
Informatics 09 00011 g005
Figure 6. Initial keywords extension.
Informatics 09 00011 g006
Figure 7. Comparison of service quality rate between By.U and MPWR.
Informatics 09 00011 g007
Table 1. Keywords for Thaichon’s service quality metrics of ISPs.
MetricsKeywordsDescription
network qualitykualitas jaringan, jaringan, network, sinyal, lambat, lemot
  • Internet disconnection
  • downloading and uploading speed
  • reduce in speed in peak or off-peak hours
customer servicelayanan pelanggan, layanan, CS, service, servis
  • CS is well informed
  • CS respond
information qualitykualitas informasi, informasi, up to date, lengkap, informatif
  • sufficient and up to date information
  • relevant information
privacy and securityprivasi, keamanan, kuota, paket data, paket, data, gagal, isi ulang, cepat habis
  • protection of personal and financial information
  • trust to security of transaction
Table 2. Example of SO assigned to SQ metrics.
S Q 1 S Q 2 S Q 3 S Q 4
d 1 +
d 2
d 3 N
d 4 +
d 5 +
d n N
Note: +, −, N for positive, negative, and neutral orientations.
Table 3. Statistics of the collected dataset.
ISPsGrabbed Twit
By.U5446
MPWR4198
Table 4. The result of manual annotation as ground truth.
ISPsPosNegNeu
By.U34517561232
MPWR23153211562
Table 5. The results of the expanded keywords.
MetricsInitial KeywordsExpanded Keywords
network quality625
customer service58
information quality528
privacy and security1024
Table 6. The expanded keywords.
MetricsInitial KeywordsTranslation ResultEnglish Synonym with WordNetExpanded Keywords
network qualitykualitas jaringan, jaringan, network, sinyal, lambat, lemot network quality, network, network, signal, slow, slowweb, net, network, mesh, meshing, meshwork, signalling, sign, dense, dim, dull, dumb, obtuse, boring, deadening, dull, ho-hum, irksome, tedious, tiresome, wearisomekualitas jaringan, jaringan, network, sinyal, lambat, lemot, bersih, bertautan, meshing, meshwork, pemberian isyarat, tanda, padat, redup, membosankan, bodoh, tumpul, membosankan, mematikan, membosankan, ho-hum, menjengkelkan, membosankan, melelahkan, melelahkan
customer servicelayanan pelanggan, layanan, CS, service, serviscustomer service, service, CS, service, servicingoverhaul, inspection and repairlayanan pelanggan, layanan, CS, service, servis, overhaul, inspeksi dan perbaikan
information qualitykualitas informasi, informasi, up to date, lengkap, informatifquality of information, information, up to date, complete, informativedata, entropy, cutting-edge, consummate, accomplished, double-dyed, everlasting, gross, perfect, pure, sodding, stark, staring, thorough, thoroughgoing, utter, unadulterated, concluded, ended, over, all over, terminatedkualitas informasi, informasi, up to date, lengkap, informative, data, entropi, mutakhir, sempurna, tercapai, dicelup ganda, abadi, kotor, sempurna, murni, basah kuyup, mencolok, menatap, menyeluruh, menyeluruh, mengucapkan, murni, menyimpulkan, berakhir, lebih, seluruh, diakhiri
privacy and securityprivasi, keamanan, kuota, paket data, paket, data, gagal, isi ulang, cepat habisprivacy, security, quota, data plan, packet, data, fail, recharge, run out fastprivateness, secrecy, concealment, certificate, limitation, information, go bad, give way, die, give out, conk out, go, break, break down, reloadprivasi, keamanan, kuota, paket data, paket, data, gagal, isi ulang, cepat habis, privasi, kerahasiaan, penyembunyian, sertifikat, pembatasan, informasi, rusak, memberi jalan, mati, memberikan, conk out, pergi, istirahat, mogok, reload
Publisher’s Note: MDPI stays neutral with regard to jurisdictional claims in published maps and institutional affiliations.

