Abstract
Predicting ICU readmission risk will help physicians make decisions regarding discharge. We used discharge summaries to predict ICU 30-day readmission risk using text mining and machine learning (ML) with data from the Medical Information Mart for Intensive Care III (MIMIC-III). We used Natural Language Processing (NLP) and the Bag-of-Words approach on discharge summaries to build a Document-Term-Matrix with 3000 features. We compared the performance of support vector machines with the radial basis function kernel (SVM-RBF), adaptive boosting (AdaBoost), quadratic discriminant analysis (QDA), least absolute shrinkage and selection operator (LASSO), and Ridge Regression. A total of 4000 patients were used for model training and 6000 were used for validation. Using the bag-of-words determined by NLP, the area under the receiver operating characteristic (AUROC) curve was 0.71, 0.68, 0.65, 0.69, and 0.65 correspondingly for SVM-RBF, AdaBoost, QDA, LASSO, and Ridge Regression. We then used the SVM-RBF model for feature selection by incrementally adding features to the model from 1 to 3000 bag-of-words. Through this exhaustive search approach, only 825 features (words) were dominant. Using those selected features, we trained and validated all ML models. The AUROC curve was 0.74, 0.69, 0.67, 0.70, and 0.71 respectively for SVM-RBF, AdaBoost, QDA, LASSO, and Ridge Regression. Overall, this technique could predict ICU readmission relatively well.
1. Introduction
Staying in the intensive care unit (ICU) is costly and stressful for patients and families. The cost of critical care is increasing annually, and ICU daily care costs are two to three-fold higher than costs on general medical or surgical wards [1]. The Centers for Medicare and Medicaid Services (CMS) recently began using readmission rate as a publicly reported metric to apply financial penalties to hospitals with rates above a pre-determined standardized goal [2]. Overall ICU readmission rates have changed little over time despite decades of research on estimating the readmission risk [3].
Increasing pressures on managing care and resources in ICUs has led them to employ strategies to rapidly free expensive ICU beds. While discharging patients from an ICU early may have a significant impact on reducing hospital costs, premature hospital discharge increases the risk for unplanned ICU readmission. Some have postulated that patients readmitted to ICUs have a higher risk of mortality and increased length of stay [4]. Therefore, estimating the readmission risk of ICU patients is of critical importance for both patent health and critical care costs for hospitals.
There is some controversy in the literature regarding whether ICU readmission is truly associated with increased mortality. One study did not find a relationship between ICU readmission and post-ICU admission hospital mortality [5]. Another study found that while units with high readmission rate had increased mortality, after adjusting for patient and institutional differences, there was no longer an association [6]. However, yet another study found that after adjusting for the severity of illness, ICU readmission was associated with an increased risk of in-hospital death [7]. There are also significant financial penalties to hospitals when it comes to readmissions. For instance, Medicare’s Hospital Readmissions Reduction Program (HRRP) institutes financial penalties for certain common categories for readmission, and this program has reduced readmission rates [8]. The reason why 30-day readmission was chosen in this study is that Medicare measures procedure-specific 30-day risk-standardized unplanned readmission for six conditions, calculating payment reduction based upon hospital performance [9].
To reach the goal of preventing readmissions and death, identifying the group of patients at greatest risk prior to discharge from the ICU is of paramount importance. ICU readmission risk prediction may help physicians to re-evaluate the patient’s physical condition before discharge and avoid preventable readmissions. The discharge summary encapsulates the most salient aspects of the hospitalization, helping to guide the patient’s future care. The Joint Commission (TJC) has standards about what information a discharge summary should contain, and these include reason for hospitalization, significant findings, procedures and treatments provided, the patient’s discharge condition, patient and family instructions, and attending physician signature [10].
State-of-the-Art
Several studies have focused on predicting which patients are likely to be readmitted, using logistic regression to assess the risk of readmission. They have used numerical data obtained from physiological variables measured during the patient’s stay prior to ICU discharge [11,12,13]. Machine learning algorithms such as artificial neural networks, fuzzy logic, and decision trees have been used to improve on the results from logistic regression techniques, which resulted in better predictive models [14,15,16]. Other studies have used the “bag-of-words” technique to predict readmission risk in various settings [17,18]. One study used a transformer to predict ICU readmission [19]. Overall, the objective of this study was to use discharge summaries to predict ICU 30-day readmission risk using natural language processing and machine learning on the MIMIC-III database.
2. Materials and Methods
In this section, we will describe the proposed methodology for predicting ICU 30-day readmission using unsupervised text mining and machine learning techniques.
2.1. Data
In recent years, there has been a concerted move toward the adoption of digital health record systems in hospitals. In the US, for example, the number of non-federal acute care hospitals with basic digital systems increased from 9.4% to 75.5% over the 7-year period between 2008 and 2014 [20]. In this study, we used data from the Medical Information Mart for Intensive Care (MIMIC-III) database, which is a large, freely available database comprising de-identified health-related data associated with over forty thousand patients who stayed in critical care units at Beth Israel Deaconess Medical Center in Boston, Massachusetts between 2001 and 2012. This dataset is freely available for researchers.
The database includes information such as demographics, vital signs taken at the bedside, laboratory test results, procedures, medications, caregiver notes, imaging reports, and mortality [21,22,23]. Data were downloaded from several sources, including archives from critical care information systems, hospital electronic health record databases, and the Social Security Administration Death Master File.
Before data were incorporated into the MIMIC-III database, they were first de-identified in accordance with Health Insurance Portability and Accountability Act (HIPAA) standards using structured data cleansing and date shifting. Protected health information was removed from free text fields. Dates were shifted into the future by a random offset to protect patient confidentiality. Dates are internally consistent for the same patient.
2.2. Data Processing
MIMIC-III is a relational database consisting of 26 tables. Tables are linked by identifiers that usually have a suffix ID. In this project, we will make use of the following MIMIC tables:
ADMISSIONS: a table containing admission and discharge information (has a unique identifier hadm-id for each admission)
NOTEEVENTS: contains all notes for each hospitalization (links with hadm-id)
The ADMISSIONS table has 58,976 rows that correspond to hospitalizations and 19 columns with the following names: row-id, subject-id, hadm-id, admit time, discharge time, death time, admission-type, admission-location, discharge-location, insurance, language, religion, marital status, ethnicity, edreg time, edouttime, diagnosis, hospital-expire-flag, and has-chartevents-data.
The admission-type column in the ADMISSIONS table has four types as shown in Table 1.

Table 1.
Admission types.
To predict unplanned re-admissions, we filtered out elective admissions. The NOTEEVENTS table contains 2,083,180 rows, which correspond to clinical notes, and 11 columns. The number of notes is naturally higher than the number of hospitalizations, since there are typically multiple notes for each hospitalization. The columns for the NOTEEVENTS table include the following: row-id, subject-id, hadm-id, chart date, chart time, sort time, category, description, cgid, iserror, and text.
The category column in the NOTEEVENTS table has fifteen different types, including the following: discharge summary, echo, ECG, nursing, physician, rehab services, case management, respiratory, nutrition, general, social work, pharmacy, consult, radiology, and nursing/other.
This work proposes using discharge summary notes in an ICU database to build predictive models using natural language processing and machine learning methods, but technically any other type of clinical note or a combination of some of them could be used.
We merged the two tables and removed the newborn category since there were a lot of notes with missing text for that category. We created a new column “labels” with an output value of 1 if the patient had a readmission within 30 days and 0 if not. We then divided our dataset to training and test sets. To balance the training dataset, we sub-sampled the negatives and resampled the training data to prevent the machine learning models from leaning toward negative prediction. Figure 1 shows a detailed pipeline for pre-processing the data before applying NLP and machine learning techniques.
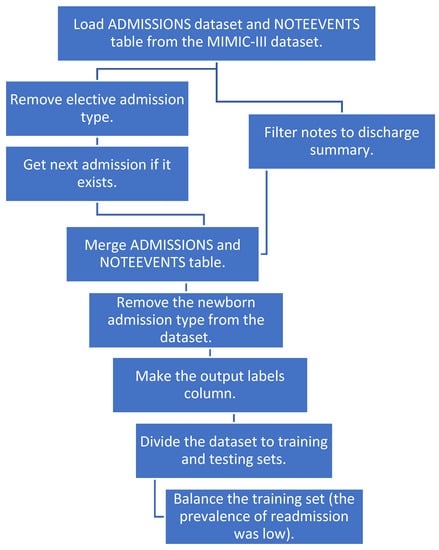
Figure 1.
The pipeline for data preprocessing.
2.3. Text Data Preprocessing Using NLP Techniques
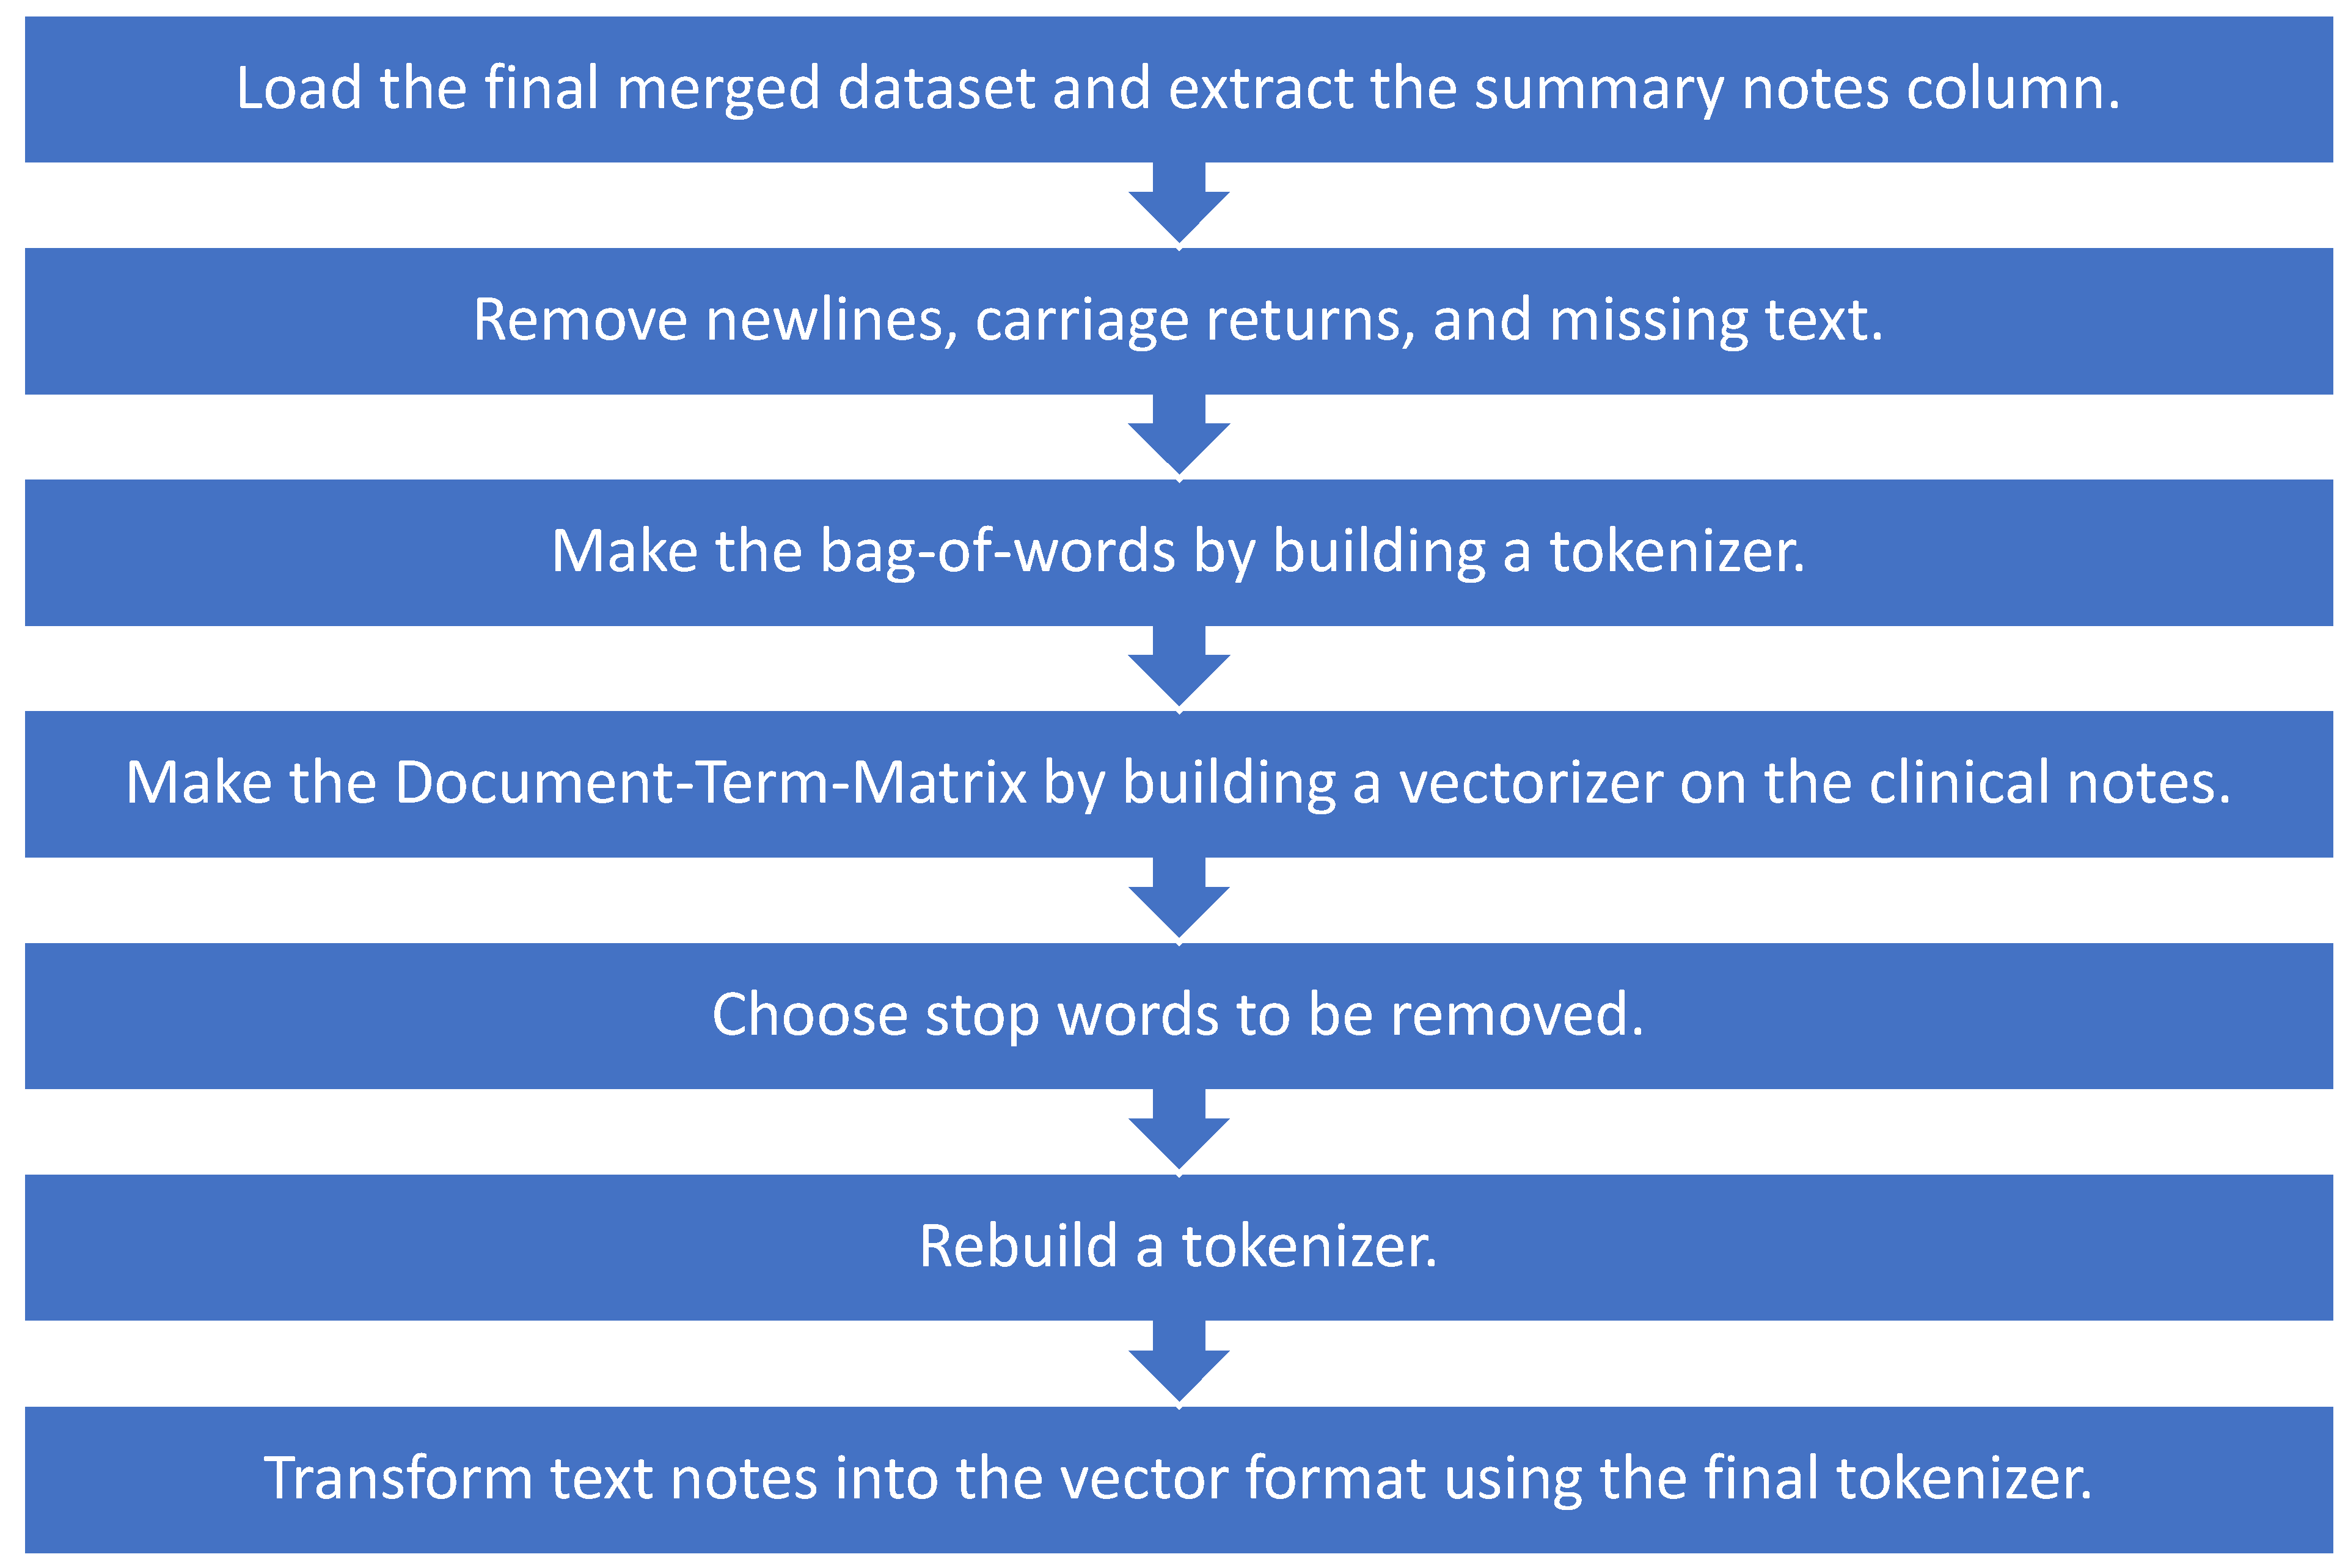
We selected discharge summary notes from the set of text notes. We used a bag-of-words approach from natural language processing on the discharge summary notes, applied machine learning models on the output, and compared the results. We modified all notes by removing newlines and carriage returns and replacing the missing text with space. Next, we built a tokenizer to split the note into individual words using the nltk.word-tokenize function. The output is a bag-of-words, and we made a Document-Term-Matrix using these bag-of-words. We used CountVectorizer from scikit-learn and built a vectorizer on the clinical notes where every row represents a different document, and every column represents a different word.
The output is a space matrix called the Document-Term-Matrix. We made a histogram of all words in this matrix and looked at the most frequently used words, which might not add any value to our model (i.e., the, or, and), and added them to our stop words. We rebuilt a tokenizer with these new stop words and then used the final tokenizer to transform text notes in the dataset into the vector format as shown in Figure 2.
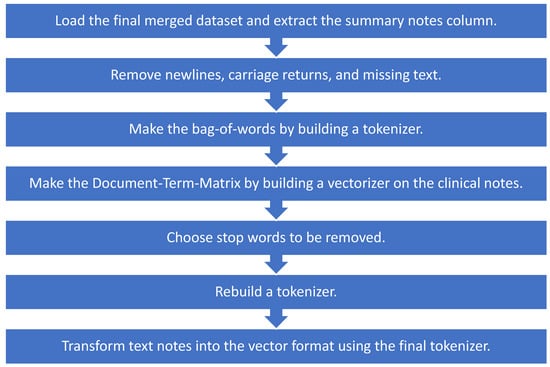
Figure 2.
Preprocessing notes using NLP techniques for machine learning models.
2.4. Machine Learning Predictive Model
Since this work consisted of assigning a combination of selected features to one of the two possible classes (either the patient will be readmitted or the patient will not be readmitted), the area under the receiver operating characteristic curve (AUROC) could be used to assess its discriminative performance. This describes the relationship between the true positive ratio and the false positive ratio, integrated over all thresholds. The true positive rate (TP) and true negative rate (TN) are related to the sensitivity and specificity of the model and, in this problem, represented the cases in which the patient was correctly classified as being readmitted and the cases in which the patient was correctly classified as not being readmitted.
We focused on discharge summary notes within the dataset and used a bag-of-words approach and NLP techniques to build the Document-Term-Matrix. We then applied a support vector machine with the radial basis function kernel (SVM-RBF), adaptive boosting (AdaBoost), quadratic discriminant analysis (QDA) using a pseudo-quadratic transformation, least absolute shrinkage and selection operator (LASSO), and Ridge Regression to all 3000 features and reported the AUROC curve. With an SVM, data are mapped into high-dimensional feature space, and separating hyperplanes are constructed to maximize the distance between data points and that hyperplane, separating them into different classes. This mapping is performed by a kernel, in this case the Gaussian radial basis function kernel, which is well-applied to high-dimensional data [24]. AdaBoost or Adaptive Boosting is an ensemble technique that combines multiple weak classifiers, or decision trees, that work in conjunction to reach the final classification decision [25]. Linear discriminant analysis seeks to find a linear combination of features to separate classes. Although the decision boundary for linear discriminant analysis is a line, the boundary for quadratic discriminant analysis is a quadratic equation, which increases model flexibility with the tradeoff of greater model complexity [26]. Regression is a modeling technique that seeks to discover the relationship between independent and dependent variables; linear regression seeks to predict a continuous dependent variable, whereas logistic regression aims to predict a categorical dependent variable [27]. Ridge regression employs L2 regularization to shrink model coefficients and reduce overfitting [28]. LASSO is a related method that employs L1 regularization and also accomplishes feature selection in order to make model predictions [29]. We analyzed algorithms commonly cited in the literature and sought to use machine learning algorithms of varying levels of complexity, from quadratic discriminant analysis to AdaBoost, to test the robustness of this technique [30]. Essentially, we sought to incorporate a diversity of algorithms, ranging from linear to more complex models, employing different major approaches in machine learning, as described above.
3. Results
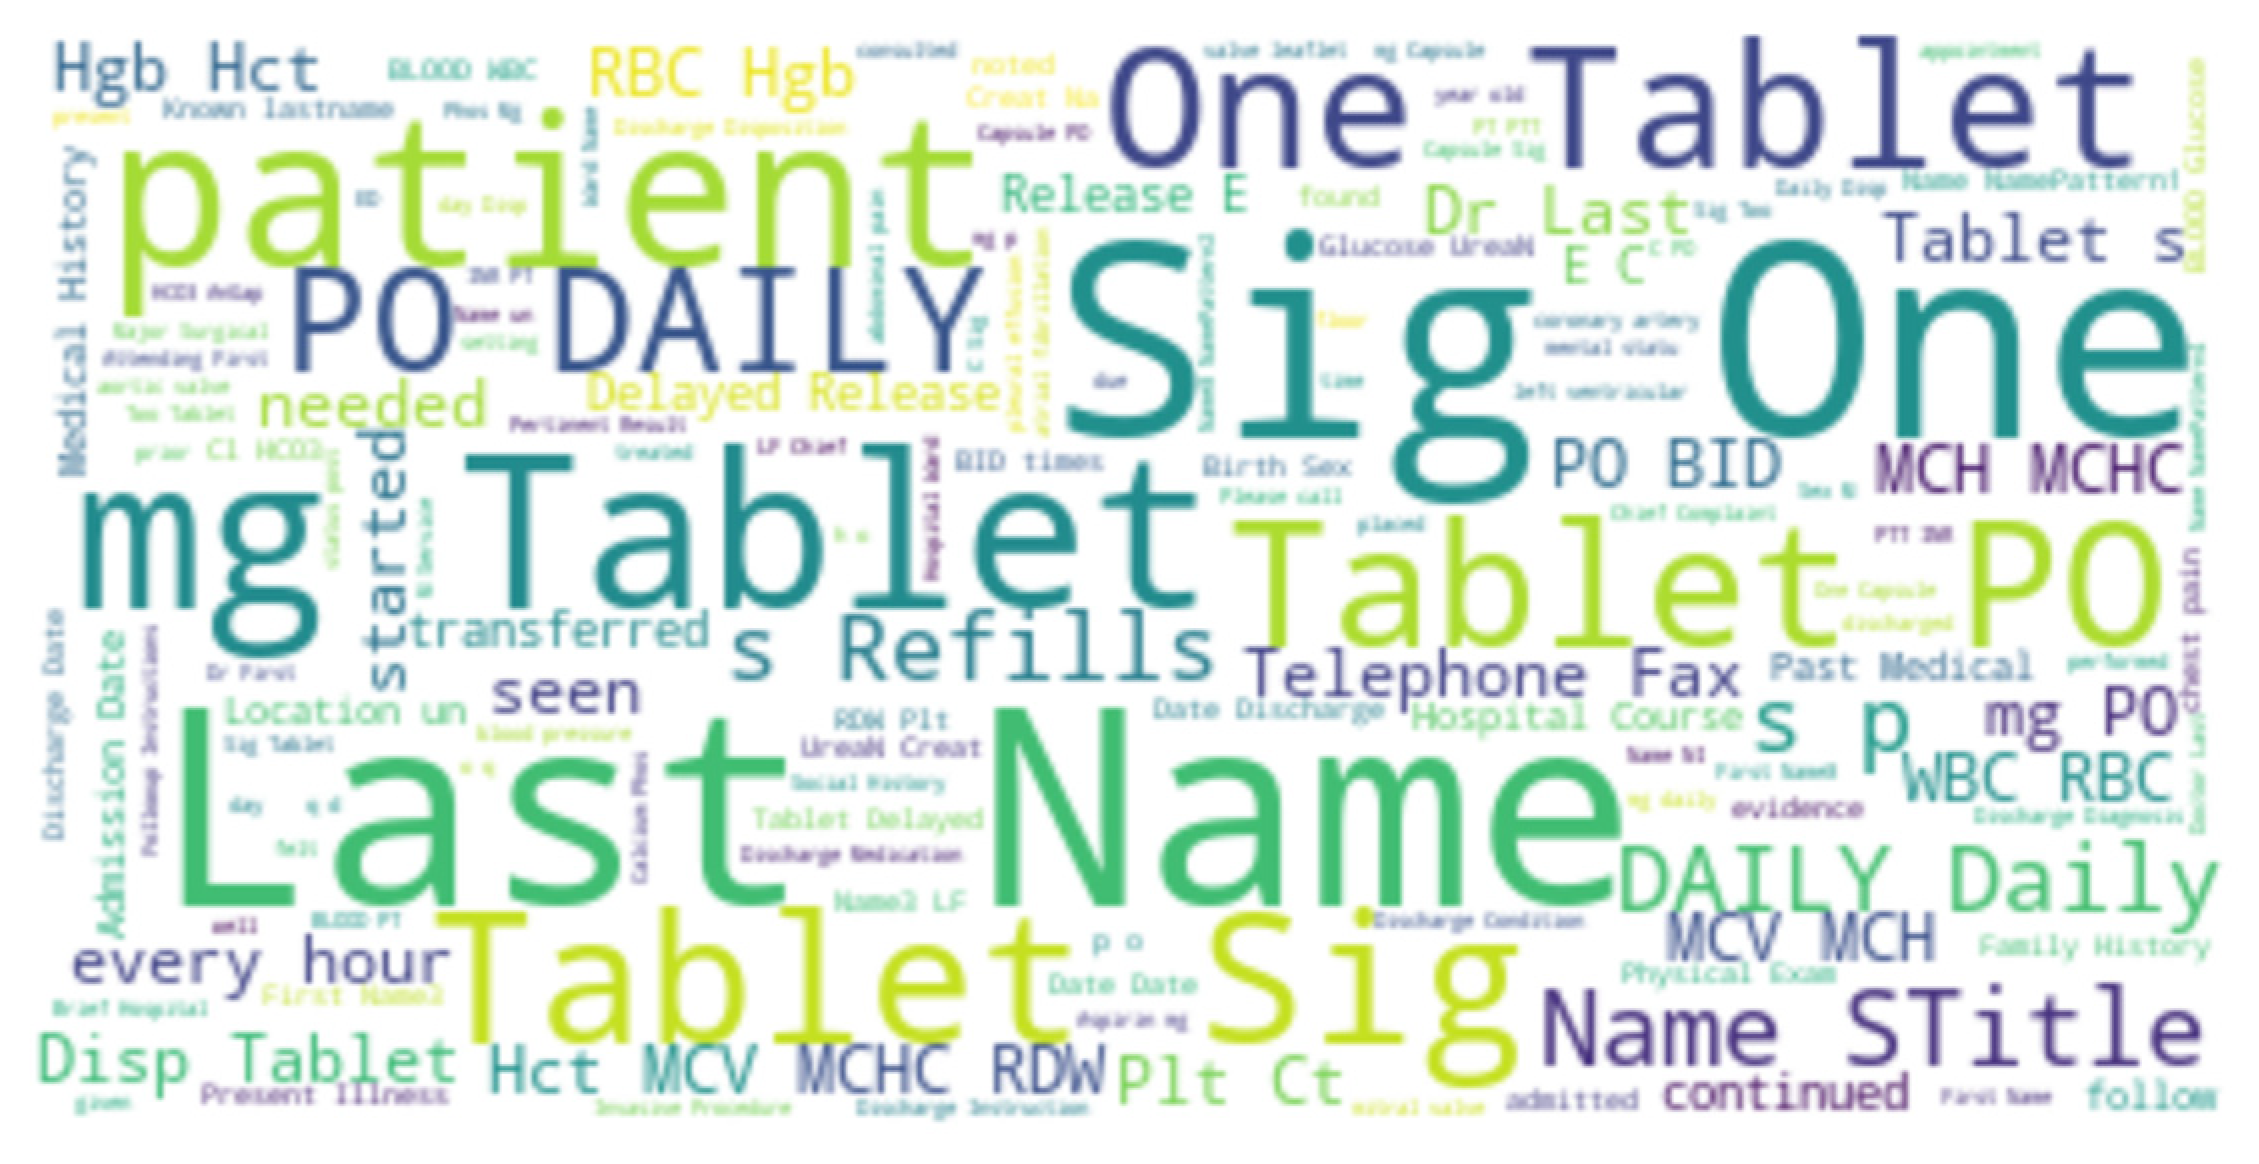
We applied a bag-of-words approach and NLP techniques to the discharge summary notes data. This resulted a Document-Term-Matrix with 3000 words (features). The word cloud of the discharge summary notes from all patients in the final dataset is shown in Figure 3.
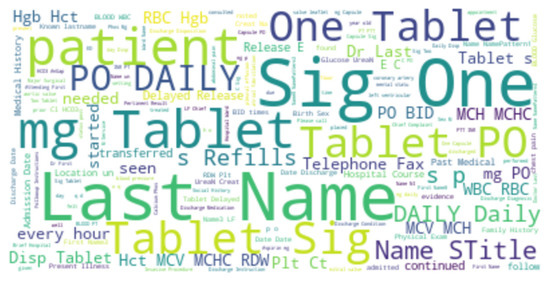
Figure 3.
Word cloud for the discharge summary notes for all patients.
To train and test the proposed machine learning models, we need the labels (ground truth), which are defined as the following: if the patient had less than a 30-day readmission, the label is true, otherwise it is false. The histogram of days between admission and readmission is given in Figure 4.
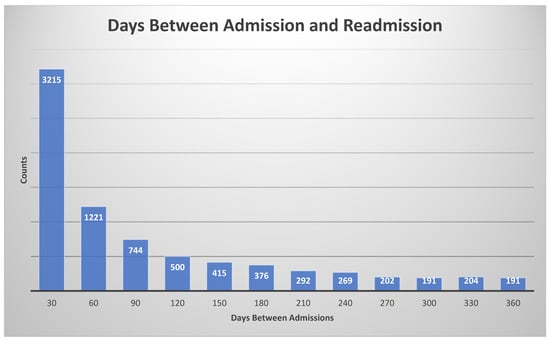
Figure 4.
Histogram for days between admission and readmission. The histogram bin size was 30 days.
We used area under the receiver operating characteristic curve (ROC) to compare the performance of each method. We divided our dataset into training and test sets, and we noticed that the prevalence of readmission in the training set was 0.059 (5.9%), which is low. To balance the training dataset, we sub-sampled the negatives and resampled the training data to roughly 4000 patients to prevent the machine learning models from leaning toward negative prediction. We used a support vector machine with the radial basis function kernel (SVM-RBF) for feature selection by incrementally adding several features to the model, between 1 and 3000 features, from the bag-of-words selected by the NLP process. Via this exhaustive search approach, we found that only 825 features (words) are the most dominant and important features. Using those 825 selected features, we then trained and validated the same machine learning models and calculated the AUROC curve.
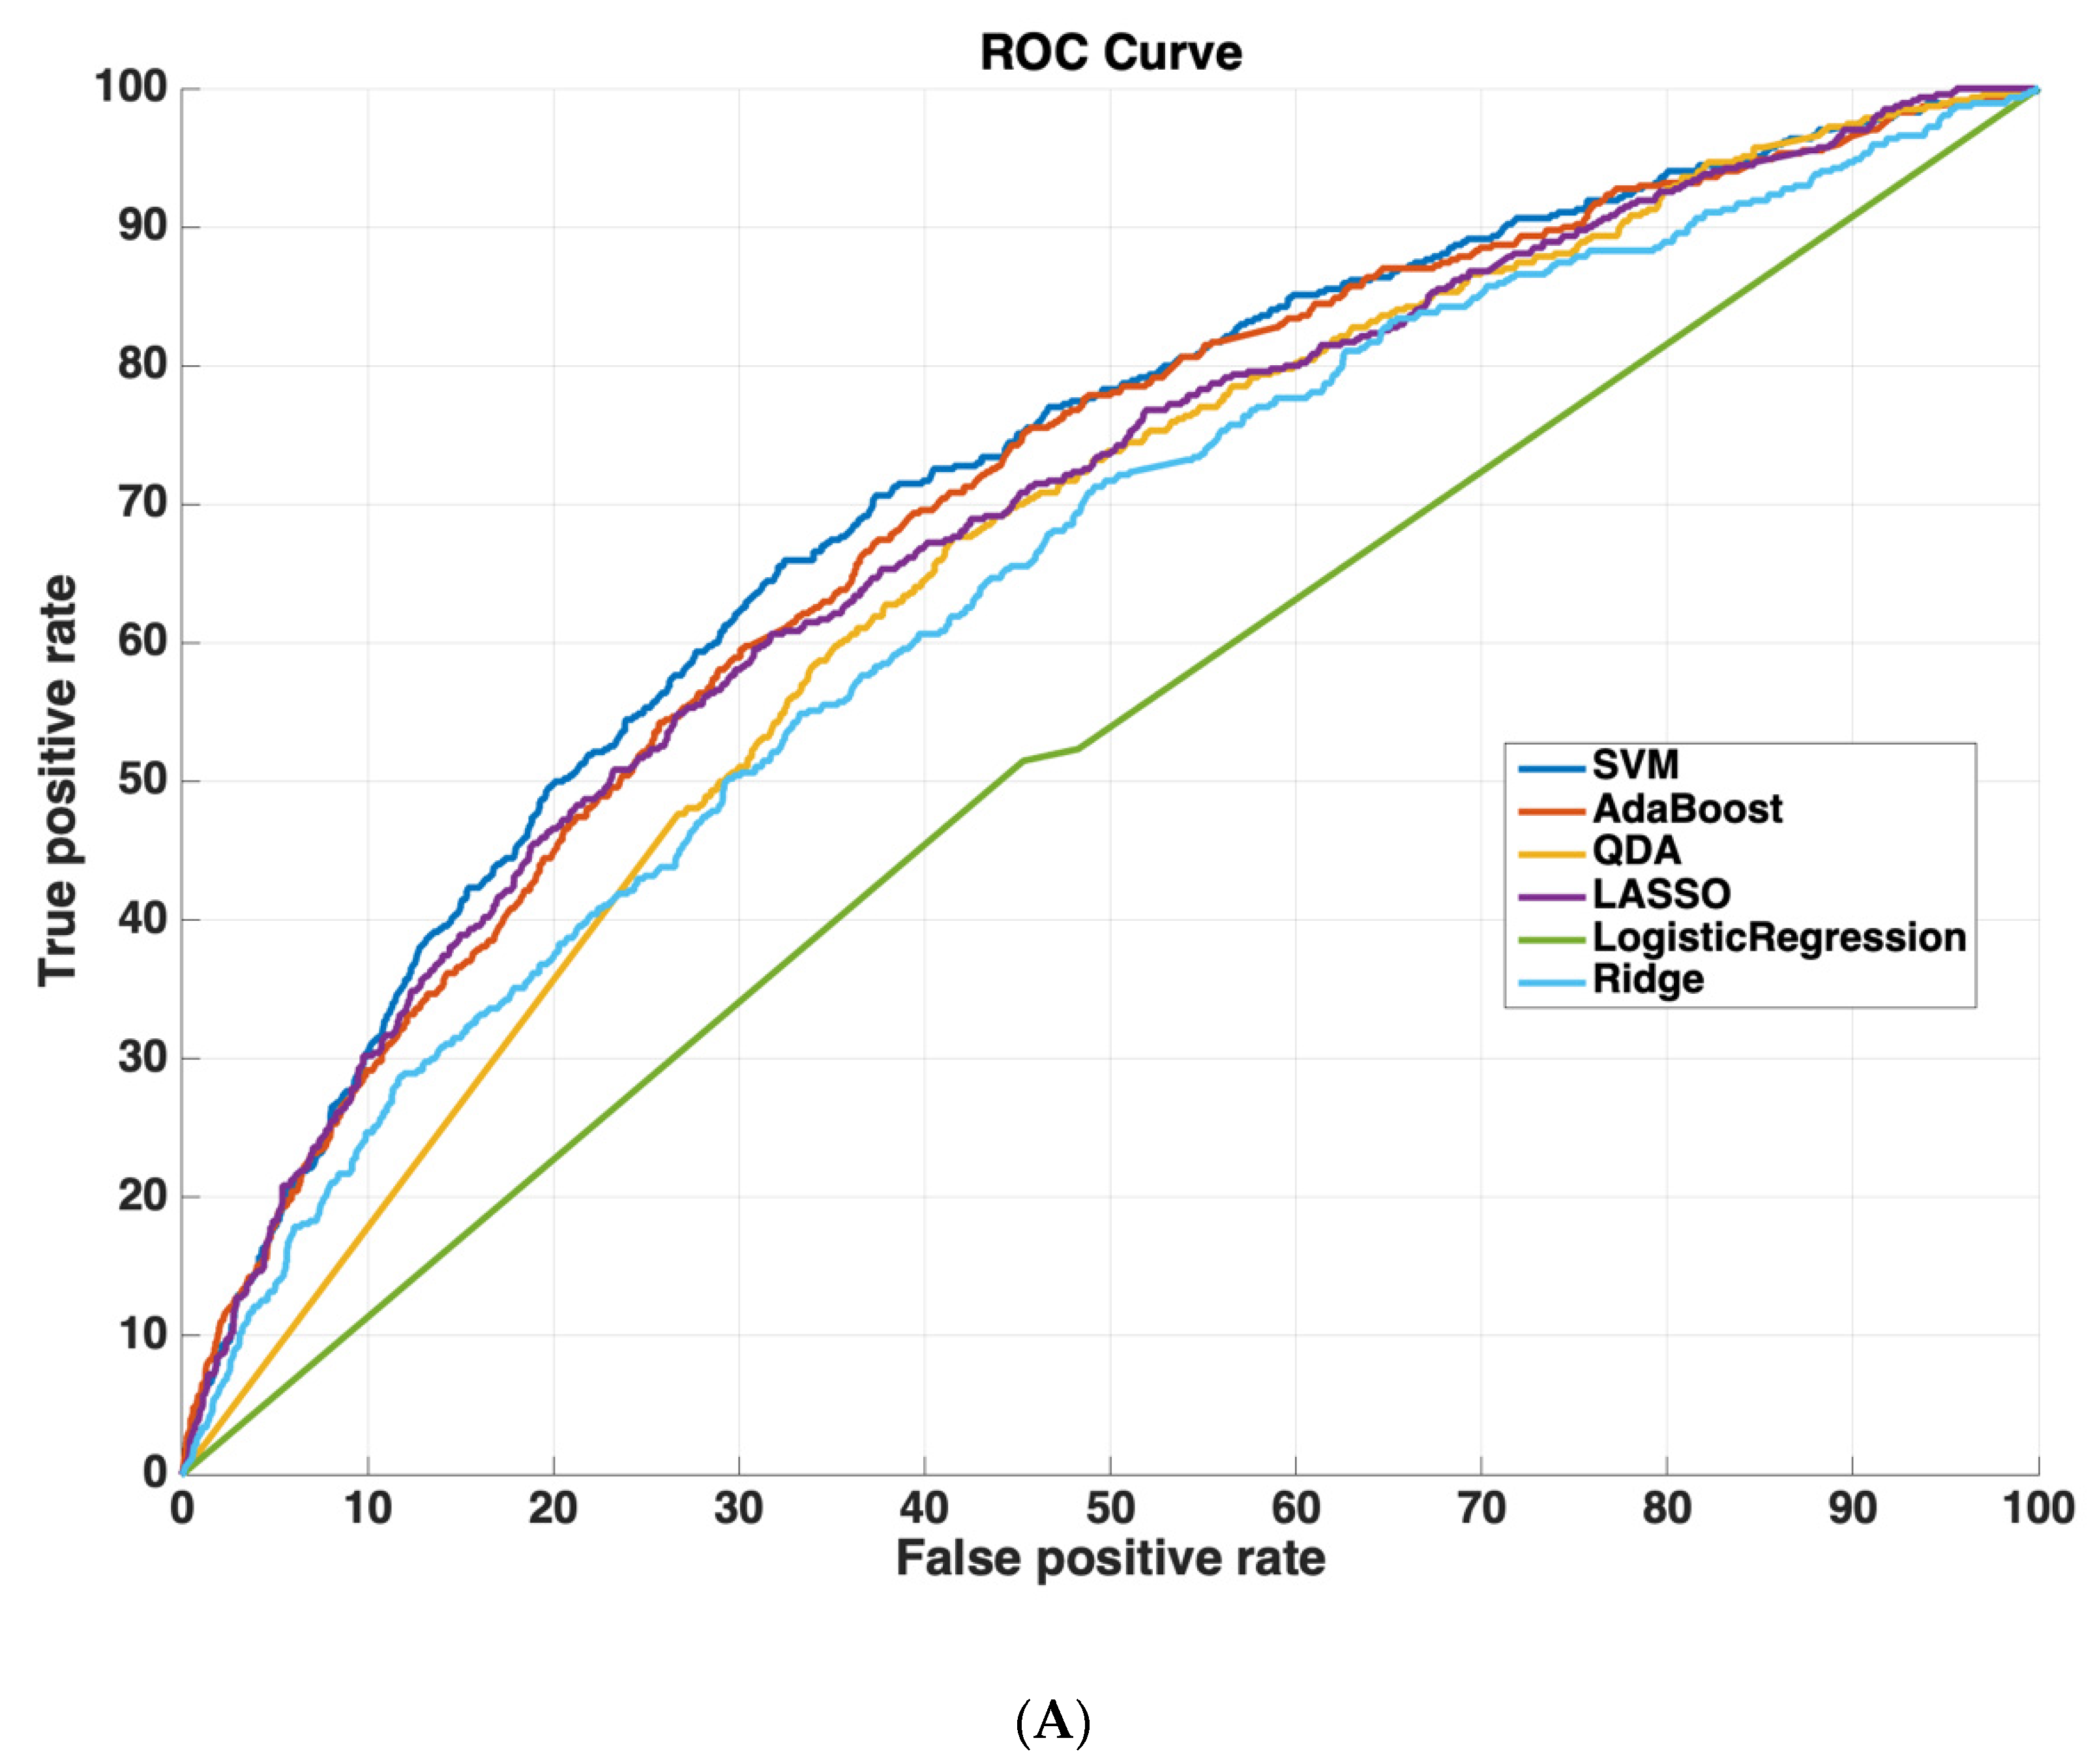
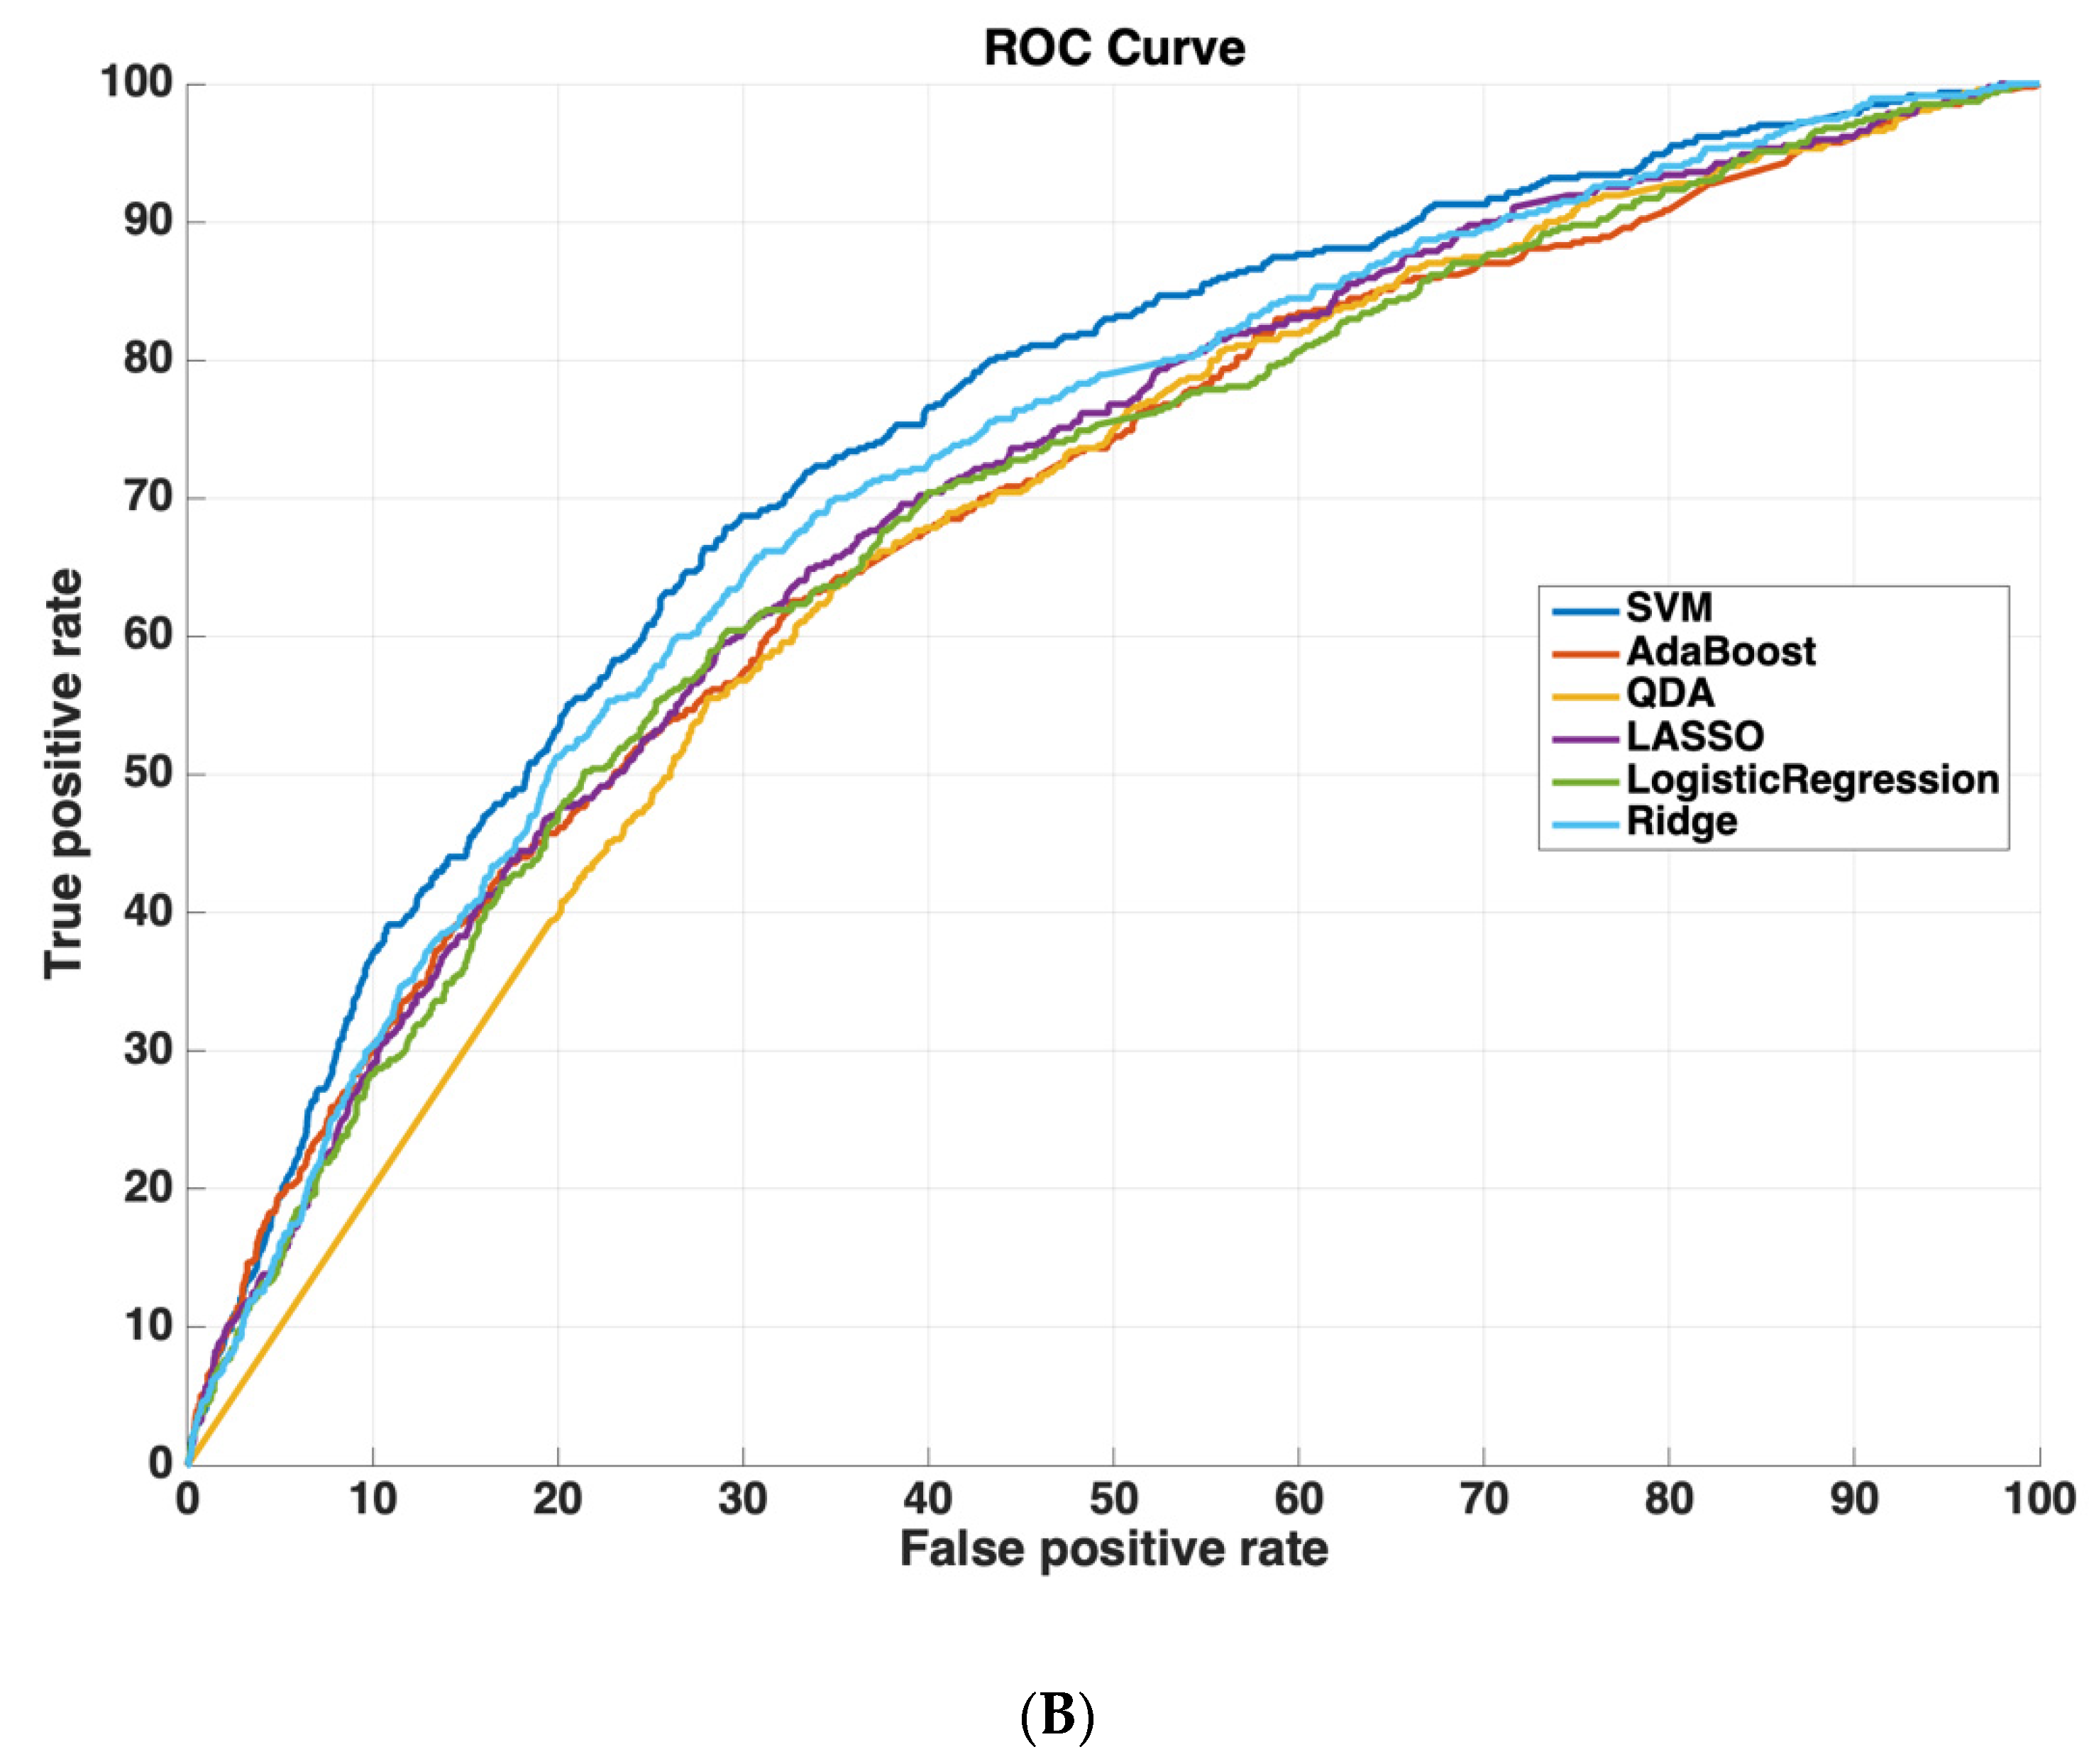
Table 2 shows the AUROC for SVM-RBF, AdaBoost, QDA, LASSO, and Ridge Regression using either all 3000 features or the 825 features selected by the SVM-RBF. The dataset size for training all machine learning models was 4096 cases. The testing dataset size for validating the performance of all machine learning models was 6798 cases. We chose this distribution as it ensured a sufficiently diverse training dataset with thousands of cases (which was also class-balanced to prevent the machine learning models from leaning towards negative predictions), while also ensuring a sufficiently large testing set for validating model performance. Using a small sample size for testing could potentially affect model generalizability, as it would not evaluate the model on as diverse a set of test cases, which is especially important because of the low prevalence of readmission (~5.9% in the dataset). These results suggest that using the features determined by machine learning methods improves model performance. Moreover, SVM-RBF methods have a higher AUROC curve compared to other methods. Figure 5 shows ROC curves for all features vs. ML-determined features as inputs to ML algorithms.
Table 2.
Model performance. Area under the receiver operating characteristic (ROC) curve for predicting 30-day readmission using different methods on the testing dataset. The dataset size for training all machine learning models was 4096 cases. The testing dataset size for validating the performance of all machine learning models was 6798 cases.
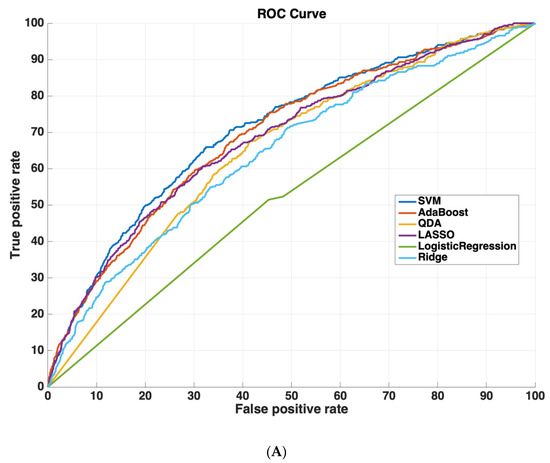
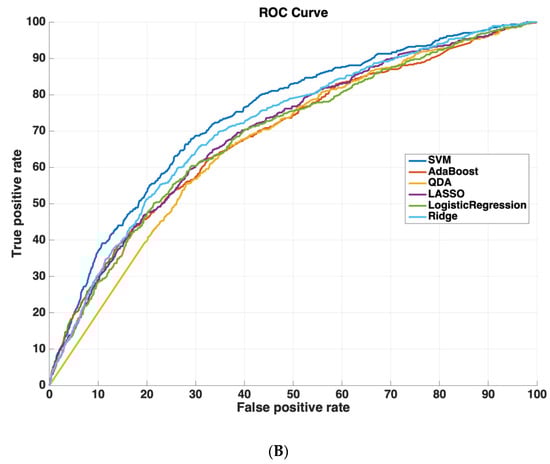
Figure 5.
Receiver operating characteristic (ROC) curves compare the performance of each machine learning algorithm to predict readmission either (A) using all 3000 features or (B) using only features determined by ML (825 features). Support vector machines had the highest performance of all machine-learning algorithms.
4. Discussion
We used the information contained within discharge summaries in the MIMIC-III dataset to predict 30-day readmission risk using NLP techniques, comparing the performance of five machine learning models, SVM-RBF, AdaBoost, QDA, LASSO, and Ridge Regression. After selecting for the 825 most dominant and important features (words) using an exhaustive search approach, we found that the SVM-RBF had the best performance with an AUROC curve of 0.74, followed by Ridge Regression, LASSO, AdaBoost, and QDA.
Compared to existing methods, we improved the predictive performance in estimating 30-day readmission risk. The literature shows a variety of results and performance using different methods. One study demonstrated a maximum AUROC curve of ~0.70 using the entire dataset to fit the data with logistic regression to assess the risk for readmission; this may cause overtraining [12]. A similar study also used logistic regression, but it achieved a maximum AUROC curve of ~0.65 using the entire dataset to fit the data with logistic regression [11]. Frost et al. used binary logistic regression to develop a predictive model for ICU readmission at Liverpool Hospital, Sydney, and the final AUROC curve was 0.66 [13]. Alternatively, Fialho et al. used fuzzy modeling combined with sequential forward selection to predict readmission between 24 and 72 h after ICU discharge with an AUC of 0.72. They did not specifically predict 30-day readmission risk [14]. There have been some other studies that attempted to predict 30-day readmission risk, but to boost the predictor performance, they used the majority of the data for training the algorithm and a small sample size for testing and validation, which could affect the model generalizability [18,19]. Nevertheless, this did not result in performance that was better than our achieved performance in this work.
Moreover, readmission risk in other applications has also been studied in different datasets rather than MIMIC-III. For instance, Rumshisky et al. developed an algorithm to predict early psychiatric readmission in a psychiatric inpatient unit, with AUROC of 0.78 on their dataset and one readmission type [17]. However, prior research has suggested that specific causes for readmission may be easier to predict than all-cause readmission. For instance, Walsh and Hripcsak found that while they could achieve an AUROC ranging from 0.92 for congestive heart failure to 0.71 for syncope, they had an AUROC of 0.68 for all-cause readmission in their patient cohort at Columbia University Medical Center [15]. This led them to conclude that cohort selection has a large impact on model performance, highlighting the difficulty in comparing results across different studies of predictive risk modeling. Moreover, focusing on only one readmission type limits the use case. Overall, predicting readmission risk is of key importance to hospitals. The techniques used in our study could lead to the development of models that predict whether or not patients are indeed ready for discharge.
As part of future directions, additional data could certainly improve the accuracy of the model. Our current paper makes use of data from discharge summaries after an ICU stay to predict the risk for readmission. By their very nature as a summary, as evidenced by the TJC standards for their required content, they do not capture all data about the hospital stay. However, there are many other types of data that could be used as inputs to NLP and machine learning algorithms, including laboratory values, vital signs, imaging reports, history and physical (H&P) notes, progress notes, EKG/telemetry, ventilator settings, etc. It is reasonable to expect that a future study incorporating this information could lead to models with even better performance. A future study could also employ other machine learning approaches, such as deep learning. In addition, future work could involve validating our techniques on independent clinical datasets. Our toolset could also be useful for other applications, such as predicting length of stay or patient survival, noting that such an approach would make use of other documents from the hospital stay, rather than the discharge summary.
5. Conclusions
This study sought to predict 30-day ICU readmission risk using discharge summaries from the MIMIC-III database and a combination of natural language processing and machine learning techniques (SVM-RBF, AdaBoost, QDA, LASSO, Ridge Regression). This technique also provided the 825 words that were most important for predicting readmission risk. After selecting for these words, SVM-RBF had the best performance with an AUROC of 0.74, followed by Ridge Regression (0.71), LASSO (0.70), AdaBoost (0.69), and QDA (0.67). While this study solely focused upon discharge summaries, a future study could employ all of the clinical documents and quantitative data from the ICU stay, potentially improving performance. Ultimately, such a tool could be used by hospitals to identify which patients are most ready for discharge, decreasing medical costs and improving patient care.
Author Contributions
Conceptualization, N.O.-F.; methodology, N.O.-F. and A.A.; software, N.O.-F.; validation, N.O.-F., A.A. and H.S.; formal analysis, N.O.-F., A.A. and H.S.; investigation, N.O.-F., A.A. and H.S.; resources, N.O.-F., A.A. and H.S.; data curation, N.O.-F. and A.A.; writing—original draft preparation, N.O.-F.; writing—review and editing, N.O.-F., A.A. and H.S.; visualization, N.O.-F., A.A. and H.S.; supervision, N.O.-F., A.A. and H.S.; project administration, N.O.-F. and H.S.; funding acquisition, H.S. All authors have read and agreed to the published version of the manuscript.
Funding
This research was funded by the Radiological Society of North America, grant number RSCH2028.
Institutional Review Board Statement
The data descriptor for MIMIC-III states, “The project was approved by the Institutional Review Boards of Beth Israel Deaconess Medical Center (Boston, MA, USA) and the Massachusetts Institute of Technology (Cambridge, MA, USA)”.
Informed Consent Statement
The data descriptor for MIMIC-III states, “Requirement for individual patient consent was waived because the project did not impact clinical care and all protected health information was deidentified”.
Data Availability Statement
The data presented in this study are openly available in PhysioNet at [23].
Conflicts of Interest
The authors declare no conflict of interest. The funders had no role in the design of the study; in the collection, analyses, or interpretation of data; in the writing of the manuscript, or in the decision to publish the results.
References
- Reardon, P.M.; Fernando, S.M.; Van Katwyk, S.; Thavorn, K.; Kobewka, D.; Tanuseputro, P.; Rosenberg, E.; Wan, C.; Vanderspank-Wright, B.; Kubelik, D.; et al. Characteristics, Outcomes, and Cost Patterns of High-Cost Patients in the Intensive Care Unit. Crit. Care Res. Pract. 2018, 2018, 5452683. [Google Scholar] [CrossRef]
- Kansagara, D.; Englander, H.; Salanitro, A.; Kagen, D.; Theobald, C.; Freeman, M.; Kripalani, S. Risk prediction models for hospital readmission: A systematic review. JAMA 2011, 306, 1688–1698. [Google Scholar] [CrossRef] [Green Version]
- Elliott, M.; Worrall-Carter, L.; Page, K. Intensive care readmission: A contemporary review of the literature. Intensive Crit. Care Nurs. 2014, 30, 121–137. [Google Scholar] [CrossRef]
- Kramer, A.A.; Higgins, T.L.; Zimmerman, J.E. Intensive care unit readmissions in U.S. hospitals: Patient characteristics, risk factors, and outcomes. Crit. Care Med. 2012, 40, 3–10. [Google Scholar] [CrossRef]
- Maharaj, R.; Terblanche, M.; Vlachos, S. The Utility of ICU Readmission as a Quality Indicator and the Effect of Selection. Crit. Care Med. 2018, 46, 749–756. [Google Scholar] [CrossRef]
- Kramer, A.A.; Higgins, T.L.; Zimmerman, J.E. The association between ICU readmission rate and patient outcomes. Crit. Care Med. 2013, 41, 24–33. [Google Scholar] [CrossRef]
- Ponzoni, C.R.; Correa, T.D.; Filho, R.R.; Serpa Neto, A.; Assuncao, M.S.C.; Pardini, A.; Schettino, G.P.P. Readmission to the Intensive Care Unit: Incidence, Risk Factors, Resource Use, and Outcomes. A Retrospective Cohort Study. Ann. Am. Thorac Soc. 2017, 14, 1312–1319. [Google Scholar] [CrossRef]
- Hoffman, G.J.; Yakusheva, O. Association Between Financial Incentives in Medicare’s Hospital Readmissions Reduction Program and Hospital Readmission Performance. JAMA Netw. Open 2020, 3, e202044. [Google Scholar] [CrossRef] [Green Version]
- CMS.gov. Hospital Readmissions Reduction Program (HRRP). Available online: https://www.cms.gov/Medicare/Medicare-Fee-for-Service-Payment/AcuteInpatientPPS/Readmissions-Reduction-Program (accessed on 17 January 2022).
- Kind, A.J.H.; Smith, M.A. Documentation of Mandated Discharge Summary Components in Transitions from Acute to Subacute Care. In Advances in Patient Safety: New Directions and Alternative Approaches (Vol. 2: Culture and Redesign); Henriksen, K., Battles, J.B., Keyes, M.A., Grady, M.L., Eds.; Advances in Patient Safety: Rockville, MA, USA, 2008. [Google Scholar]
- Campbell, A.J.; Cook, J.A.; Adey, G.; Cuthbertson, B.H. Predicting death and readmission after intensive care discharge. Br. J. Anaesth 2008, 100, 656–662. [Google Scholar] [CrossRef] [Green Version]
- Badawi, O.; Breslow, M.J. Readmissions and death after ICU discharge: Development and validation of two predictive models. PLoS ONE 2012, 7, e48758. [Google Scholar] [CrossRef]
- Frost, S.A.; Tam, V.; Alexandrou, E.; Hunt, L.; Salamonson, Y.; Davidson, P.M.; Parr, M.J.; Hillman, K.M. Readmission to intensive care: Development of a nomogram for individualising risk. Crit. Care Resusc. 2010, 12, 83–89. [Google Scholar]
- Fialho, A.S.; Cismondi, F.; Vieira, S.M.; Reti, S.R.; Sousa, J.M.C.; Finkelstein, S.N. Data mining using clinical physiology at discharge to predict ICU readmissions. Expert Syst. Appl. 2012, 39, 13158–13165. [Google Scholar] [CrossRef]
- Walsh, C.; Hripcsak, G. The effects of data sources, cohort selection, and outcome definition on a predictive model of risk of thirty-day hospital readmissions. J. Biomed. Inform. 2014, 52, 418–426. [Google Scholar] [CrossRef] [Green Version]
- Curto, S.; Carvalho, J.P.; Salgado, C.; Vieira, S.M.; Sousa, J.M.C. Predicting ICU readmissions based on bedside medical text notes. In Proceedings of the 2016 IEEE International Conference on Fuzzy Systems (FUZZ-IEEE), Vancouver, BC, Canada, 24–29 July 2016; p. 2144-a-2151-h. [Google Scholar]
- Rumshisky, A.; Ghassemi, M.; Naumann, T.; Szolovits, P.; Castro, V.M.; McCoy, T.H.; Perlis, R.H. Predicting early psychiatric readmission with natural language processing of narrative discharge summaries. Transl. Psychiatry 2016, 6, e921. [Google Scholar] [CrossRef] [Green Version]
- Li, Z.; Xing, X.; Lu, B.; Zhao, Y.; Li, Z. Early Prediction of 30-Day ICU Re-admissions Using Natural Language Processing and Machine Learning. Biomed. Stat. Inform. 2019, 4, 22–26. [Google Scholar] [CrossRef]
- Huang, K.; Altosaar, J.; Ranganath, R. ClinicalBERT: Modeling Clinical Notes and Predicting Hospital Readmission. In Proceedings of the Conference on Health, Inference, and Learning, Toronto, ON, Canada, 2–4 April 2020. [Google Scholar]
- Collins, F.S.; Tabak, L.A. Policy: NIH plans to enhance reproducibility. Nature 2014, 505, 612–613. [Google Scholar] [CrossRef] [Green Version]
- Goldberger, A.L.; Amaral, L.A.; Glass, L.; Hausdorff, J.M.; Ivanov, P.C.; Mark, R.G.; Mietus, J.E.; Moody, G.B.; Peng, C.K.; Stanley, H.E. PhysioBank, PhysioToolkit, and PhysioNet: Components of a new research resource for complex physiologic signals. Circulation 2000, 101, E215–E220. [Google Scholar] [CrossRef] [Green Version]
- Johnson, A.E.; Pollard, T.J.; Shen, L.; Lehman, L.W.; Feng, M.; Ghassemi, M.; Moody, B.; Szolovits, P.; Celi, L.A.; Mark, R.G. MIMIC-III, a freely accessible critical care database. Sci. Data 2016, 3, 160035. [Google Scholar] [CrossRef] [Green Version]
- Johnson, A.E.; Pollard, T.; Mark, R. MIMIC-III Clinical Database (version 1.4). PhysioNet 2016. [Google Scholar] [CrossRef]
- Schölkopf, B.; Sung, K.; Burges, C.; Girosi, F.; Niyogi, P.; Poggio, T.; Vapnik, V. Comparing support vector machines with Gaussian kernels to radial basis function classifiers. IEEE Trans. Signal. Process. 1997, 45, 2758–2765. [Google Scholar] [CrossRef] [Green Version]
- Freund, Y.; Schapire, R.E. A Decision-Theoretic Generalization of On-Line Learning and an Application to Boosting. J. Comput. Syst. Sci. 1997, 55, 119–139. [Google Scholar] [CrossRef] [Green Version]
- Tharwat, A. Linear vs. quadratic discriminant analysis classifier: A tutorial. Int. J. Appl. Pattern Recognit. 2016, 3, 145–180. [Google Scholar] [CrossRef]
- Dobson, A.J.; Barnett, A.G. An Introduction to Generalized Linear Models, 4th ed.; CRC Press: Boca Raton, FL, USA, 2018. [Google Scholar]
- Hoerl, A.E.; Kennard, R.W. Ridge Regression: Biased Estimation for Nonorthogonal Problems. Technometrics 1970, 12, 55–67. [Google Scholar] [CrossRef]
- Tibshirani, R. Regression Shrinkage and Selection Via the Lasso. J. R. Stat. Soc. Ser. B (Methodol.) 1996, 58, 267–288. [Google Scholar] [CrossRef]
- Hastie, T.; Tibshirani, R.; Friedman, J.H. The Elements of Statistical Learning: Data Mining, Inference, and Prediction, 2nd ed.; Springer: Berlin/Heidelberg, Germany, 2009; p. 745. [Google Scholar]


Publisher’s Note: MDPI stays neutral with regard to jurisdictional claims in published maps and institutional affiliations. |
© 2022 by the authors. Licensee MDPI, Basel, Switzerland. This article is an open access article distributed under the terms and conditions of the Creative Commons Attribution (CC BY) license (https://creativecommons.org/licenses/by/4.0/).