Article

Reaction Monitoring by Ultrasounds in a Pseudohomogeneous Medium: Triglyceride Ethanolysis for Biodiesel Production

Sciences Department, Institute for Advanced Materials and Mathematics (InaMat2), Universidad Pública de Navarra, 31006 Pamplona, Navarra, Spain
*
Author to whom correspondence should be addressed.
Processes 2022, 10(1), 12; https://doi.org/10.3390/pr10010012
Submission received: 30 November 2021 / Revised: 17 December 2021 / Accepted: 17 December 2021 / Published: 22 December 2021

Abstract

:
The sound propagation speed measurement us is used for monitoring triglyceride ethanolysis in a broad range of reaction conditions (mainly, temperature: 23–50 °C; ethanol/oil: from 6 to 24 mol/mol). Experimentally, us slightly increased with the reaction time in all cases as a result of the contribution of its dynamic mixture components. Nomoto’s expression for homogeneous mixtures offered suitable us estimation but with values notably higher than the experimental ones due to the resistance to sound propagation offered by the ethanol/oil interphase (non-homogeneous medium). Our strategy was based on both the comparison of the experimental us values and the theoretical ones correlated by means of triglyceride conversion and on the estimation of the sound speed of oil/ethanol that could emulate the resistance offered by the interphase. The evolution of the reactions was predicted quite well for all the experiments carried out with very different reaction rates. Nevertheless, at the beginning of the reaction, the estimated conversion (outside of industrial interests) showed important deviations. The presence of the intermediate reaction products, diglycerides, and monoglycerides could be responsible for those deviations.

1. Introduction

Due to the non-destructive nature of sound waves, the measure of its propagation speed has numerous applications in different fields of science and environmental [1,2], biomedical [3,4], mechanical, thermodynamic [5], marine, and civil applications. Depending on the application, the used ranges of ultrasonic wave frequencies can vary. In materials, field sound speed measurements can be used for the estimation of mechanical properties like the elastic parameters, corrosion, or mechanical failures [6,7], as well as for determining the thermal properties, such as conductivity. For liquid mixtures, mainly binary and ternary, this technique has been extensively applied with the aim to measure the physico-chemical properties [8,9,10]. The correlation of the experimental sound speed values with the corresponding prediction by semiempirical formulas such as Nomoto’s or ideal mixing relations allows for studying the nature of molecular interactions. Positive deviations are attributed to the molecular association, whereas negative deviations or lower positive deviations would indicate molecular dissociation, such as by the addition of solvents or increases in temperature [11].
The measurement of the sound velocity can also be applied for process monitoring, being remarkable for its use in the following processes, among others: alcoholic fermentation [12,13], kinetics of crystallization of palm fats [14], or epoxy curing processes [15]. Our research group demonstrated in a previous study that the real-time monitoring of the methanolysis of vegetable oils for obtaining fatty acid methyl esters (FAME) (biodiesel) is possible [16], with synthesis focused on the production of a biofuel for direct injection compression ignition engines [17,18,19,20].
In the area of biofuels, there are also several works focused on the properties of diesel/biodiesel mixtures and the performance of engines and gas emissions [21,22,23]. The biodiesel synthesis using ethanol (FAEEs) instead of methanol (FAMEs) is much less studied and referenced. Transesterification carried out with ethanol is very interesting, since alcohol can be obtained from renewable sources, thus contributing to improving the sustainability of biodiesel production. Samuel et al. [24] emphasized the preference for the ethylic technique compared with the methylic process of renewability and environmental friendliness. Additionally, FAEEs exhibit some improved fuel properties compared with FAMEs, such as a higher heat content and cetane number [25].
Nevertheless, the physicochemical evolution of the transesterification process is quite different depending on the alcohol selected, due to the lower polarity of ethanol making the reaction medium a pseudohomogeneous system, depending on the operation temperature and alcohol content used. A preliminary study of ethanolysis reactions indicated that there was a slight increase in sound speed propagation (5–10 units), which was much lower than that in the case of methanol (30–50 units). The aim of this research was to determine if this slight increase in the main variable allowed for monitoring the transesterification reaction progress using online ultrasound measurements with enough sensitivity.

2. Materials and Methods

The transesterification reactions were carried out at atmospheric pressure in a mechanically stirred, jacketed glass tank reactor of 1 L using a 6-cm in diameter turbine and a stirring speed of 400 rpm, which was enough to minimize the effects of mass transfer limitations according to the preliminary experiments. The reactor was fitted with a thermostatic circulating bath (HUBER UNISTAT 340 W) to control the reaction temperature within the 15–60 °C range, a thermocouple probe, and a reflux condenser [26]. Despite and due to the use of a circulating bath with temperature control, the reaction was exothermic, and the control of reaction temperature had little deviation from its target of ±1 °C, mainly at the beginning of the process.
Refined sunflower oil (acidity: 0.076 mg KOH/g oil) and HPLC-grade ethanol were used as reactants, with ethanol/oil molar ratios between 6:1 and 24:1. After the oil and most of the ethanol reached the reaction temperature in the reactor, the catalyst (NaOH, Sigma–Aldrich pellets 99.998%) was added and dissolved in the rest of the ethanol according to the selected alcohol/oil ratio and catalyst concentration (ranging from 0.05 wt.% to 0.20 wt.% referring to the oil mass).
Among the various techniques of measurement, the most versatile is the immersion technique, where the acoustic waves are generated and received by two piezo-electric transducers with one acting as transmitter and the other acting as the receiver. A low-intensity ultrasound sensor (PIOXS, 0.8 W/cm2, 2 MHz frequency) was placed inside the reactor in contact with the reaction mixture and registered continuous online measurements of the propagation of the sound speed (us) every 2 s. The ultrasound sensor also registered the temperature with a precision of ±0.1 °C, supposing an accuracy with the speed of sound of 0.3–0.4 m/s.
Different reaction samples (from 5 to 15, depending on the reaction conditions and rate of advance) were withdrawn from the reactor at different reaction times and subsequently analyzed by size-exclusion chromatography (SEC) at room temperature. The SEC equipment is described elsewhere [18], and it consisted of a Waters model 410 differential refractive index detector and three Styragel columns (HR2, HR1, and HR0.5, Waters) connected in series. Prior to the chromatographic analysis, the samples were neutralized with some drops of acetic acid and diluted with tetrahydrofuran (THF), which was also used as a mobile phase for analysis.
Additionally, the reactor was charged with approximately 600 mL of pure components (oil, biodiesel, ethanol, and glycerol) in order to measure the correspondent speed of sound propagation at 20 °C using the ultrasound probe. Measurements of us for the intermediate products (diglycerides and monoglycerides) were not possible due to the insufficient amount of these pure compounds.
For the treatment of the experimental data and estimation of the correlations shown in this work, Compaq Visual Fortran V6.6 that included the IMSL subroutines library (IMSL Fortran 90 MP Library) was used. In some cases, iterative calculations were performed to estimate oil conversion from the sound velocity values collected during the reactions’ progress using the DBCPOL subroutine (IMSL Fortran 90 MP Library), which used a complex method of direct search.

3. Results

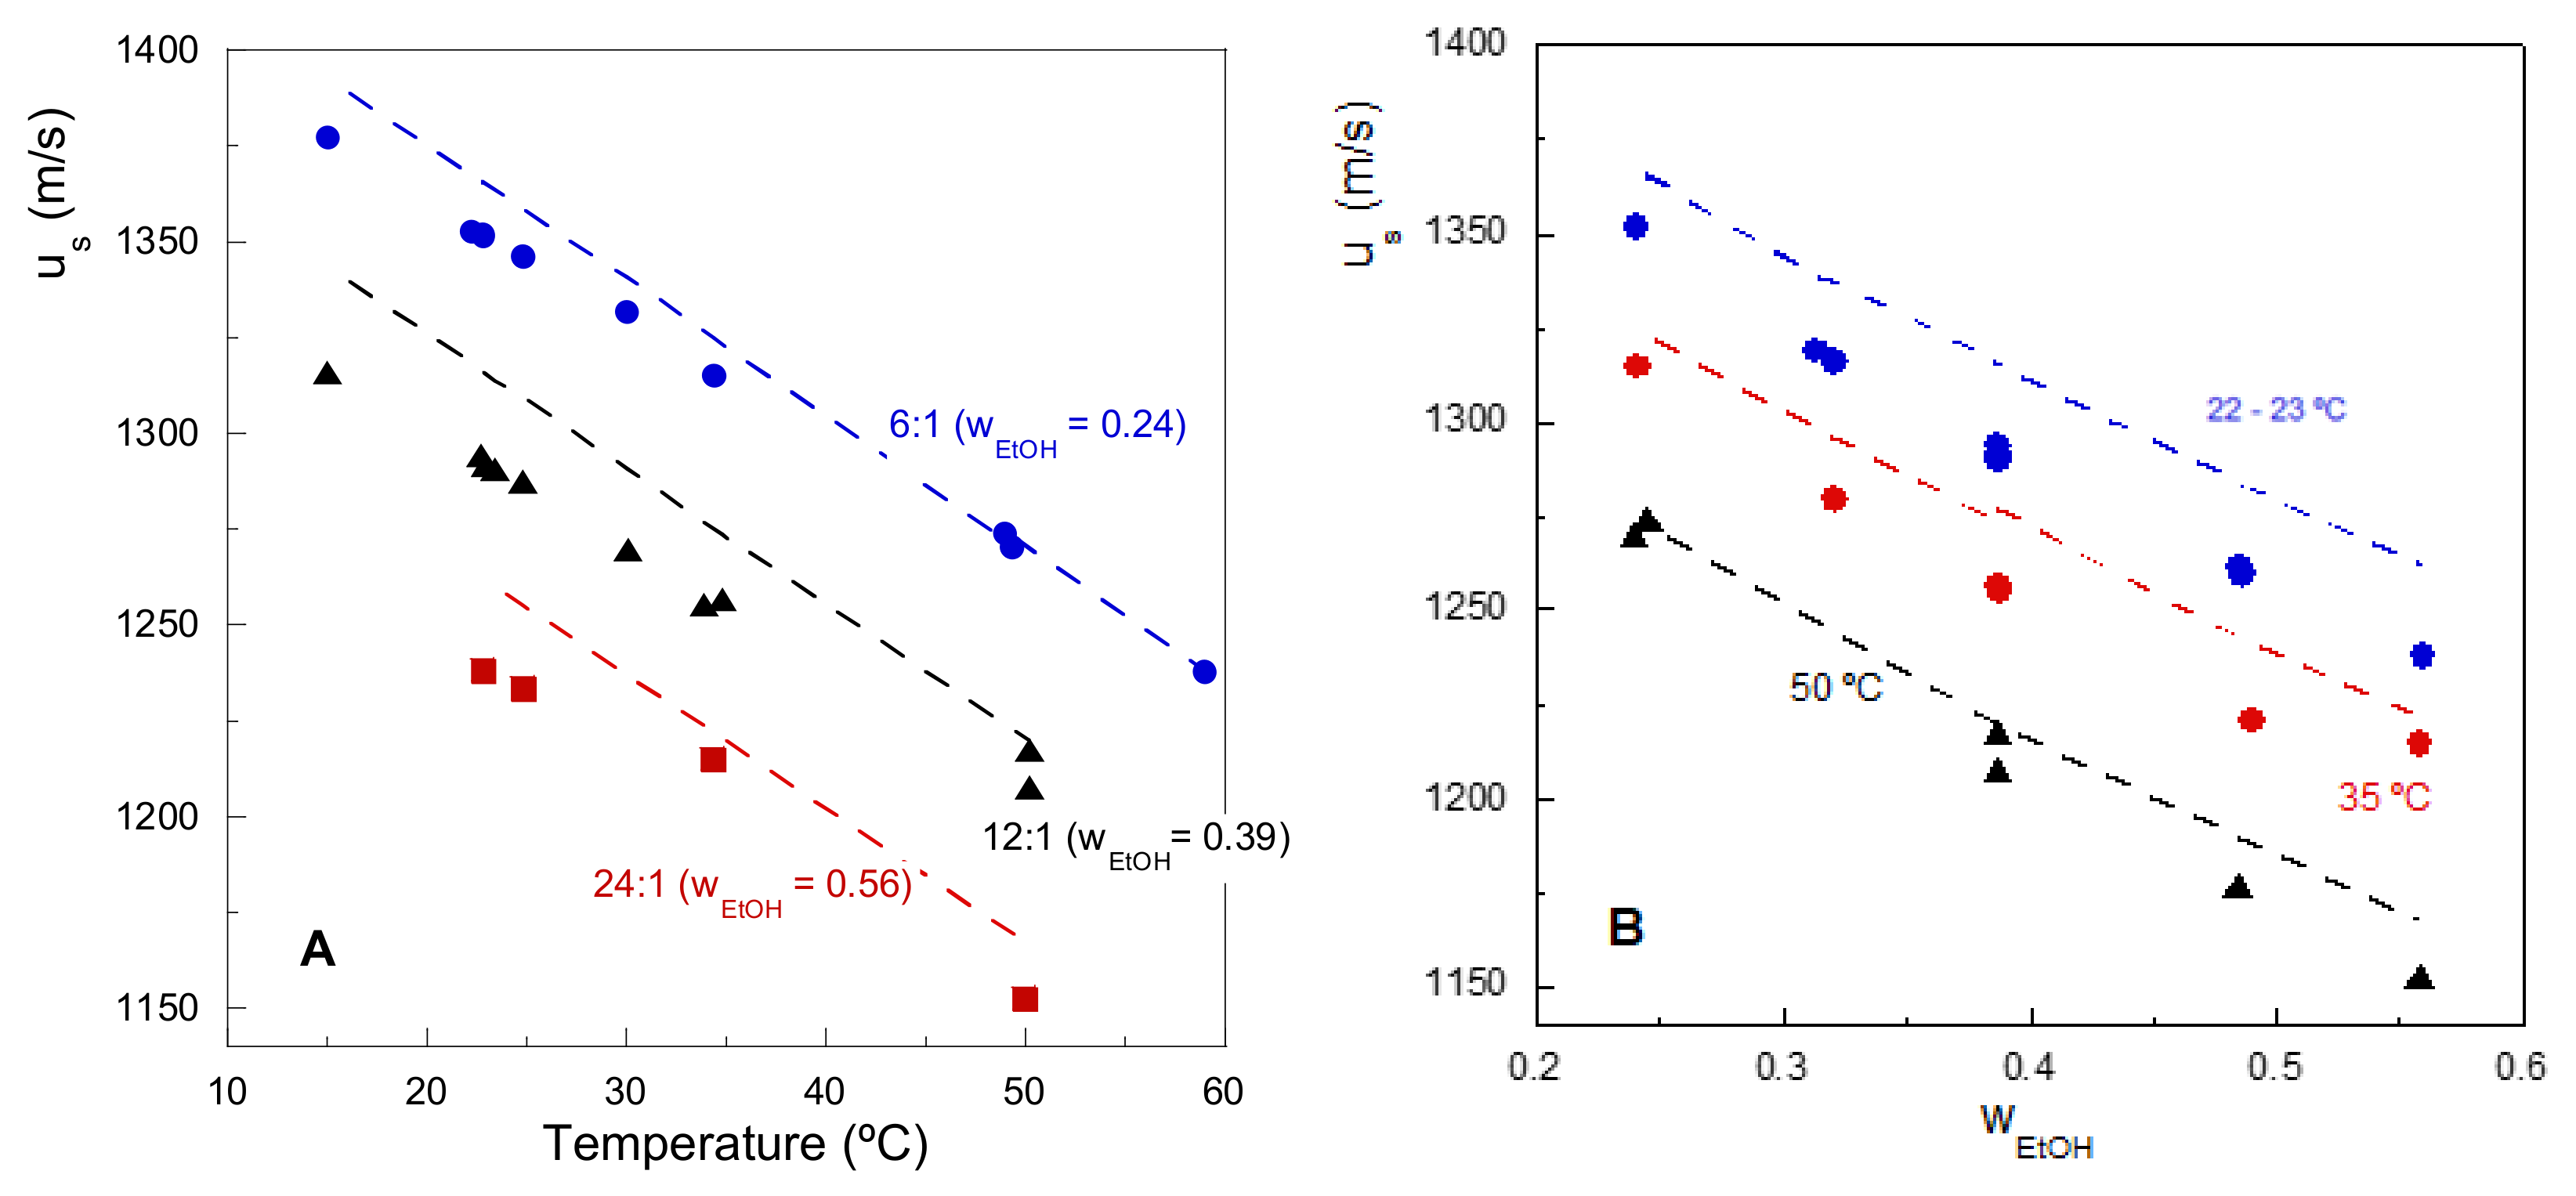
3.1. Experimental System Behavior

A slight increase in the experimental speed of sound values could be observed as the reaction progressed due to the alcohol consumption, which was the product with the lowest speed of sound value (us (20 °C) = 1152 m/s). At the same time, glycerol was formed, the compound with the highest value (us (20 °C) = 1921.3 m/s) that contributed to the noticed increase. These tendencies can be observed in Figure 1, where the experimental data obtained from the tests carried out at different alcohol molar ratios and reaction temperatures are shown. The good reproducibility of the experimental results can be also observed, showing the replicates (dotted lines) for the experimental tests carried out with a 6:1 alcohol oil molar ratio and reaction temperatures of 23 and 50 °C in this sense.
Furthermore, the reaction progression also implied a decrease in the oil concentration (us (20 °C) = 1464.3 m/s) in favor of the production of biodiesel with a slightly lower speed value (us (20 °C) = 1406 m/s). Both values measured in this work were in accordance with the values reported in the literature [23]. It can be noticed that biodiesel had a lower us value (60–100 units), which contributed to a decrease in the value of this variable. These effects are opposed to those previously mentioned, which could be due to the scarce sensitivity of this technique in the experimental conditions studied.
In Figure 2, the experimental data for the oil conversions (analyzed by SEC) and speed of sound for a series of reactions performed at a low alcohol/oil molar ratio (6:1) are represented. In this figure, the maximum oil conversions achieved under the operating conditions indicated can be observed. Moreover, the experimental us values obtained showed significant differences depending on the reaction temperature, being higher (around 15 units) between the initial time and the end of the reactions carried out at lower temperatures.
It can be noticed how the us differences during the reaction time decreased as the working temperature increased, standing out at reactions carried out at 50 °C, where the sensitivity of the measures was basically dependent on the system’s temperature stability.
The differences observed for the replicates carried out at 23 and 50 °C were also remarkable, where although the experimental oil conversions had good reproducibility, the lines representing the speed of sound propagation showed different values. This can be explained by attending to the reactant amount, which slightly differed between replicates. For the test conducted at 23 °C, the replicate (represented with black symbols) resulted in an alcohol ratio that was minimally higher (23.97 instead of 23.91 wt.%), which implicated a slightly lower us and barely higher rate of reaction. The same effect can be noticed for the tests conducted at 50 °C, where the effect is more easily appreciated, with the alcohol amount difference being slightly higher (24.56 for the replicate with black symbols, instead of 24.02 wt.%), which corresponded with higher deviations in the us measured values. These data could help to understand the precision of the technique applied to this reaction system.
Notwithstanding, a higher increase rate for the speed of sound by comparison with the oil conversion could be seen, especially in the reactions carried out at 15–35 °C, whereas the us curve for reactions at 50 °C slightly changed, although in all cases, the experimental curve shape was correctly reproduced.
It is important keep in mind that the present reaction system is pseudo-homogeneous, with an initial time period during which two immiscible phases (lipidic and alcoholic) could be distinguished, and as it progressed, it turned into a homogeneous system. This behavior change could be related to the reaction conditions, especially for the temperature and alcohol molar ratio, as is shown in Figure 3, where the experimental instant when these changes occurred have been depicted, taking as a reference the oil conversion values for all the operating conditions studied.
As the reaction temperature rose, the system’s transition between a heterogeneous and homogeneous nature occurred at lower oil conversions. However, contrary to what might be assumed, the more alcohol that was present in the reaction medium, the longer the system remained in a biphasic mode. Given that the oil conversion and reaction time were also related to the experimental conditions, the evolution of the reaction system was highly conditioned to both variables, being particularly important in the ethanolysis reaction, where the quantity of intermediate compounds, such as diglycerides and monoglycerides, is abundant for low-oil conversions (at around 30–35% [27]). These acylglycerols are compounds with intense interfacial activity, which could have an essential role in the behavior system [28].

3.2. Conversion Estimation from us

In order to estimate the conversion evolution from the us experimental values, two strategies were followed. The first one was trying to find an algebraic correlation of us and the reaction progress, taking into account the reaction temperature and the initial alcohol/oil molar ratio. This strategy was successfully applied in a previous work for monitoring the progress of methanolysis reactions for biodiesel production [16]. The second strategy was based on the description of the chemical-physical evolution of the components in the reaction mixture and their contribution to the system’s sound speed propagation following an additivity rule.

3.2.1. Conversion Estimation through an Algebraic Correlation

As can be observed in Equation (1), the sound velocity is a linear function of the variables’ reaction xi and its crossed interactions xi·xj:
u s = u 0 , Tref + i = 1 j a i x i + i = 1 j i a ij x i x j
Following the experimental observations, three main variables were defined: oil conversion (XToil), initial mass alcohol fraction (wEtOH), and relative reaction temperature (T–Tref, being 20 °C). Meanwhile, ai are the coefficients corresponding to the considered variables, named aX, aw, and aT, and aij is the coefficient that take into account the crossed effects between the variables, named aXT, aXw, and aTw.
Therefore, the oil conversion (XToil) could be calculated from the process variables and the measured speed of sound, as Equation (2) indicates:
X oil T = u s u 0 , 20 a T · T 20 a w · w EtOH a Tw · T 20 · w EtOH a X + a XT · T 20 + a Xw · w EtOH
In order to determine u0,20 and the coefficients ai and aij, the following objective function F was minimized:
F = i N R 1 n R j = 1 n R X oil T i , j X oil Exp i , j
where XExpoil is the experimental data of the oil conversion measured offline by SEC in a total of 32 reactions (NR), analyzing between 5 and 15 (n(R)) experimental points for each test. The estimated values achieved for each proposed parameter are shown in Table 1.
Negative values of the parameters obviously indicate that the effect of the corresponding variables was to decrease the value of the speed of sound propagation, which was the case for the temperature and the alcohol content, as can be observed in Figure 1. Positive values indicate an increasing effect on the speed of sound, which is the case of reaction conversion. Nevertheless, aXT took on a negative value, which led to a reduction in sensitivity as the temperature increased, as can be observed in Figure 4.
The monitoring of a series of ethanolysis reactions through online us measurement and offline SEC analysis is compared in Figure 4.
In Figure 4A–D, the evolution of oil conversion in the reactions carried out while varying the ethanol/oil ratio and reaction temperature is presented. In the initial instants of the reaction, the conversion evolution was very fast and seemed to stop without attaining the final conversion corresponding to the thermodynamical equilibrium characteristic of the reversible character of the serial reaction steps involved. This effect is particularly prominent for experiments run with lower ethanol/oil ratios, temperatures and catalyst contents, in agreement with Borovinskaya et al. [29].
According to Tsuji et al. [30] and Reyero et al. [31], the main side reaction in this system is the triglyceride saponification via a reaction with the hydroxide ions, which leads to soap formation and the consequent catalyst consumption, thus lowering the rate of the ethanolysis reactions and eventually stopping them when the initial alkali metal hydroxide concentration was low. This effect is favored by the excess of alcohol due to their direct influence on the forward transesterification steps.
In Figure 4. A, the good correlation between the calculated and experimental oil conversion for results obtained at different reaction temperatures with a high ethanol amount (24:1) can be seen, while in contrast, the experiments carried out under lower alcohol molar ratios (Figure 4C,D) resulted in an underestimation of the calculated oil conversion values compared with the experimental ones obtained by SEC. This effect could be explained by taking into account the intermediate products (diglyceride and monoglyceride) in the reaction medium, because as the ratio of the alcohol and temperature was reduced, the proportion of the intermediate compounds (of greater importance than in the case of the methanolysis reaction) increased, and this could be responsible for the adjustment difficulty found in these experimental conditions.
In addition, particularly noticeable for the reactions carried out with the lowest amount of alcohol (6:1) are the little oscillations for the estimated conversions, which were equivalent to the temperature differences (±0.1 °C) registered during the performed runs [27].

3.2.2. Conversion Estimation through the Contribution of Components in the Mixture to us

This correlation strategy was based on evaluating the progress of all the reaction components in terms of oil conversion (Xoil) and acylglycerol selectivity (Si) (Equations (4–7)) for later estimation of the contribution of each component to the global sound speed:
n oil = n oil , 0 · 1 X oil = m oil , 0 M oil · 1 X oil
n i = n oil , 0 · X oil · S i ; i = DG X ,   MG X , GL X
n BD = n DG , X + 2 · n MG , X + 3 · n GL , X
n EtOH = n EtOH , 0 n BD = m EtOH , 0 M ETOH n BD
where noil,0 and moil,0 are the initial oil moles and oil mass, respectively, and nEtOH,0 and mEtOH,0 are the initial ethanol moles and mass, respectively, charged in the reactor, while Moil and MEtOH are the corresponding molar mass of the oil and ethanol, respectively.
The evolution of monoglycerides and diglycerides for this system with the reaction progress is well-known and published in the previous work of this group [31]. Their progress with conversion depends mainly on the ethanol excess, observing a maximum diglyceride yield of about 25–30% at medium oil conversions (around 60%). In the case of the monoglycerides, the maximum yields are even higher than the maximum for diglycerides to the order of 35% at higher oil conversions (of about 85%), corresponding to the transesterification reaction consisting of three consecutive steps and to a slower conversion of monoglycerides into glycerol, especially when ethanol is used as transesterification alcohol.
For this study, polynomial expressions like the one below have been applied (Equation (8)):
S i = j = 0 5 s ij X oil j ;   i = DG ,   GL
The sij coefficients are included in Table 2. For the experimental alcohol molar ratios of 9:1 and 18:1, the sij values were interpolated from the calculated ones.
For the monoglycerides (MG), these values were calculated from the diglycerides and glycerol parameters, fulfilling the mass balance as follows:
S MG = 1 S DG S GL
Once the component moles were calculated, the molar fraction (xi)—and consequently the mixture composition—were known. At this point, it was possible estimate the contribution for each component in the global speed of sound propagation.
From the speed of sound values for each pure reaction component, the theoretical value of the speed of sound for the reactive mixture with a conversion X could be evaluated with the help of expressions available in the literature for liquid mixtures. In this sense, Nomoto’s relation was established based on the assumption of the additivity of the molar sound speed (R) and no change in volume upon mixing [32]:
u NR = x i R i x i V i 3 being   R i = V i · u i 1 / 3
where Ri is the molar sound speed, Vi is the molar volume, and xi is the molar fraction of the constituent components in the liquid mixture that depends on the temperature.
Furthermore, the sound velocity in oil and ethanol was measured in this work in the temperature range studied, and afterward, the sound velocity at the initial reaction time was estimated:
Oil: u0 = (1464.3 ± 3.2) − (3.45 ± 0.12) · (T − 20)
Ethanol: u0 = (1152 ± 2.2) − (3.47 ± 0.05) · (T − 20)
The expression for the ethanol u0 measured (Equation (12)) was close to that reported in the literature by Meister et al. [33].
Figure 5A,B shows the comparison between the experimental data obtained at the beginning of the reaction and the prediction made by Nomoto’s expression (Equation (10)).
In Figure 5A, the effect of the temperature reaction in the initial us values, noticing a decrease as the temperature increases, with a gradient of 3.1–3.5 m/s/°C can be appreciated. A similar tendency can be observed as the alcohol proportion increases, resulting in a gradient of 320–380 m/s/w/w in this case, as can be perceived in Figure 5B. Those values are in agreement with those found in the algebraic correlation (Equation (2)).
The theoretical Nomoto model (Equation (10)) fairly predicted the tendencies in the speed of sound with different temperatures and alcohol contents. The deviations in us indicate that it cannot assume the ideal behavior of alcohol/oil mixtures due to the poor miscibility of the system, especially at low temperatures. The initial us values measured experimentally were lower than the estimated ones, particularly at lower temperatures and higher alcohol relations. Nikam et al. also observed that deviations between the theoretical and experimental values of the speed of sound decreased with increasing temperatures [11]. Nevertheless, Nomoto’s correlation was the theoretical expression that best adjusted the experimental results shown in this work, also being tested in other well-known works in the literature such as Rao’s specific sound velocity relation [34], Junjie’s equation [35], or the ideal mixing relation proposed by Van Dael W. [36] without remarkable improvement.
These deviations or us overestimations appeared again when trying to emulate the speed of sound propagation as the reactants were consumed and products were formed. It has not been possible to adjust the speed of sound with the measured values of the pure compounds using only adjustable data corresponding to the diglycerides and monoglycerides which, despite not having been possible to measure experimentally, were considered necessary to include in Nomoto’s correlation. It would be necessary to start from lower values, initially due to the presence of the interphase between reactive compounds and subsequently due to the non-ideal system behavior that enhances the poor interaction of alcohol and glycerol with fatty compounds.
In order to determine the sound velocity of the pure components, the objective function (F) was minimized (Equation (3)). For the purpose of reducing the number of adjustable parameters, a unique value for both acylglycerols was proposed with the same gradient for all components. In Table 3, the estimated values can be found.
Regarding the obtained values, it is remarkable that this was higher for the diglycerides and monoglycerides when compared with the oil even for its experimentally measured value, which was probably related to the important interfacial behavior of the acylglycerols in the reactive mixture [37,38].
Once ui,T was calculated and the system composition evolution was known, it was possible to estimate the speed of sound propagation of the mixture as a function of oil conversion. In a contrary sense, from the experimental us values, it was possible to find the oil conversion that satisfied the value. This estimation was carried out by means of an iterative calculus performed using the subroutine DBCPOL from the IMSL Library.
In Figure 6, a comparison between the experimental conversion obtained by SEC and that calculated by Nomoto’s model and the parameters of Table 3 for the pure components is presented.
In Figure 6, the correlation between the experimental evolution of oil conversion and recovered conversion from us can be seen quite well. The fits were better for high alcohol/oil molar ratios and low temperatures. The adjustment was poor for lower oil conversion values, whereas the final conversion was quite well described. This tendency was even more prominent in the experiments carried out with lower catalyst concentrations (Figure 6D, 0.05 wt.%.).

4. Conclusions

In-line measurement of the speed of sound in the reaction mixture has been proposed for real-time monitoring of the transesterification of vegetable oils with ethanol. The methodologies proposed to calculate the oil conversion data from the sound velocity data presented some limitations, mainly due to the low variation in the speed of sound throughout the reaction progress in comparison with the transesterification reactions carried out with methanol.
Experimentally, an increase in the us values between the beginning and final reaction could clearly be observed, but the sensitivity throughout the reaction’s progress was low, mainly at high reaction temperatures.
The strategy of searching an arithmetic correlation to predict either the sound velocity or the oil conversion that we successfully achieved for the methanolysis reaction in the case of ethanolysis of vegetable oil was only successful for reactions carried out with very high alcohol contents. In the ethanolysis experiments, the diglyceride and monoglyceride content was much higher than in methanolysis which, together with the lower polarity of ethanol, led to a pseudohomogeneous system with low sensitivity to the ultrasound measurement.
The strategy based on the evaluation of the contribution of all reaction species to the global sound velocity by means of Nomoto’s relation allowed us to get closer to estimating the real evolution of the oil conversion, although not with the precision that we would have expected. For the low oil conversion values in the experiments carried out with low alcohol/oil molar ratios and with very low catalyst concentrations, the deviations are quite important. However, these conditions are outside of the industrial interest.
For future studies, it would be interesting to deepen the resistance offered by the interphase in the initial episodes of the reaction and to include interaction parameters in the theoretical models.

Author Contributions

Conceptualization and methodology, L.M.G., G.A. and I.R. and.; software, formal analysis and validation, G.A.; experimental work, I.R. and L.M.G.; writing—original draft preparation, I.R.; writing—review and editing, G.A., L.M.G. and I.R. All authors have read and agreed to the published version of the manuscript.

Funding

This research received no external funding.

Data Availability Statement

Data is contained within the article.

Acknowledgments

The advice and technical assistance by Carlos Lana from Lana Sarrate S.A. are gratefully acknowledged. Luis M. Gandía wishes to thank Banco de Santander and Universidad Pública de Navarra for their financial support under the “Programa de Intensificación de la Investigación 2018” initiative.

Conflicts of Interest

The authors declare no conflict of interest.

References

  1. Pensieri, S.; Bozzano, R. Active and Passive Acoustic Methods for In-situ Monitoring of the Ocean Status. In Advances in Underwater Acoustics; InTechOpen: London, UK, 2017. [Google Scholar] [CrossRef] [Green Version]
  2. Doubek, M.; Vacek, V.; Hallewell, G.; Pearson, B. Speed-of-sound based sensors for environmental monitoring. In Proceedings of the 2016 IEEE SENSORS, Orlando, FL, USA, 30 October–3 November 2016; pp. 1–3. [Google Scholar] [CrossRef]
  3. Foster, F.S.; Pavlin, C.J.; Harasiewicz, K.A.; Christopher, D.A.; Turnbull, D.H. Advances in ultrasound biomicroscopy. Ultrasound Med. Biol. 2000, 26, 1–27. [Google Scholar] [CrossRef]
  4. Hossain, M.Z. Monitoring of the Sound Velocity Variation in Rat Muscle and a Novel Approach to Quantify Muscle Injury. 2021. Available online: https://www.researchgate.net/publication/356664534_Monitoring_of_the_sound_velocity_variation_in_rat_muscle_and_a_novel_approach_to_quantify_muscle_injury (accessed on 17 December 2021).
  5. Ghazipour, H.; Gutiérrez, A.; Mohammad-Aghaie, D.; Alavianmher, M.M.; Hosseini, S.M.; Aparicio, S. Insights on biodiesel blends with alkanol solvents. J. Mol. Liq. 2021, 332, 115864. [Google Scholar] [CrossRef]
  6. Katunin, A.; Dragan, K.; Dziendzikowski, M. Damage identification in aircraft composite structures: A case study using various non-destructive testing techniques. Compos. Struct. 2015, 127, 1–9. [Google Scholar] [CrossRef]
  7. Rose, J.L. An Introduction to Ultrasonic Guided Waves. In Proceedings of the 4th Middle East NDT Conference and Exhibition; Kingdom of Bahrain, Manama, Bahrain, 9–13 December 2007. [Google Scholar]
  8. Dwivedi, K.; Vyas, V.; Tripathi, I.P. Evaluation of Molar Sound Velocity and Molar Compressibility for Binary System of 1-Butanol + Hexadecane and 1- Butanol + Squalane. Int. J. Pharm. Chem. 2016, 6, 92–99. [Google Scholar]
  9. Umadevi, M.; Kesavasamy, R.; Rathina, K.; Mahalakshmi, R. Studies on liquid-liquid interactions of some ternary mixtures by density, viscosity and ultrasonic speed measurements. J. Mol. Liq. 2016, 219, 820–828. [Google Scholar] [CrossRef]
  10. Simić, Z.V.; Kijevčanin, M.L.; Radović, I.R.; Grilc, M.; Ivaniš, G.R. Thermodynamic and transport properties of biomass-derived furfural, furfuryl alcohol and their mixtures. Energies 2021, 14, 7769. [Google Scholar] [CrossRef]
  11. Nikam, P.S.; Mahale, T.R.; Hasan, M. Molecular interactions in binary mixtures of ethyl acetate with 1-pentanol, 1-hexanol, 3,5,5 trimethyl hexanol, 1-octanol and 1-decanol at 298.15, 303.15 and 308.15K: An ultrasonic study. Indian J. Pure Appl. Phys. 1999, 37, 92–96. [Google Scholar]
  12. Lamberti, N.; Ardia, L.; Albanese, D.; Di Matteo, M. An ultrasound technique for monitoring the alcoholic wine fermentation. Ultrasonics 2009, 49, 94–97. [Google Scholar] [CrossRef]
  13. Resa, P.; Elvira, L.; De Espinosa, F.M. Concentration control in alcoholic fermentation processes from ultrasonic velocity measurements. Food Res. Int. 2004, 37, 587–594. [Google Scholar] [CrossRef]
  14. Awad, T.S. Ultrasonic studies of the crystallization behavior of two palm fats O/W emulsions and its modification. Food Res. Int. 2004, 37, 579–586. [Google Scholar] [CrossRef]
  15. Svilainis, L.; Rodriguez, A.; Liaukonis, D.; Chaziachmetovas, A. Assessment of ultrasound velocity application for chemical process monitoring. Elektronika Elektrotechnika 2015, 21, 50–55. [Google Scholar] [CrossRef] [Green Version]
  16. Zabala, S.; Arzamendi, G.; Reyero, I.; Gandia, L.M. Monitoring of the methanolysis reaction for biodiesel production by off-line and on-line refractive index and speed of sound measurements. Fuel 2014, 121, 157–164. [Google Scholar] [CrossRef]
  17. Van Gerpen J, K.G. 4—Biodiesel Production. In The Biodiesel Handbook, 2nd ed.; Gerhard Knothe, J.K., Van Gerpen, J., Eds.; AOCS Press: Champaign, IL, USA, 2010; pp. 31–96. ISBN 978-1-893997-62-2. [Google Scholar]
  18. Knothe, G. Biodiesel and renewable diesel: A comparison. Prog. Energy Combust. Sci. 2010, 36, 364–373. [Google Scholar] [CrossRef]
  19. Santacesaria, E.; Vicente, G.M.; Di Serio, M.; Tesser, R. Main technologies in biodiesel production: State of the art and future challenges. Catal. Today 2012, 195, 2–13. [Google Scholar] [CrossRef]
  20. Santori, G.; Di Nicola, G.; Moglie, M.; Polonara, F. A review analyzing the industrial biodiesel production practice starting from vegetable oil refining. Appl. Energy 2012, 92, 109–132. [Google Scholar] [CrossRef] [Green Version]
  21. Nikolić, B.D.; Kegl, B.; Marković, S.D.; Mitrović, M.S. Determining the speed of sound, density, and bulk modulus of rapeseed oil, biodiesel, and diesel fuel. Therm. Sci. 2013, 16, 505–514. [Google Scholar] [CrossRef]
  22. Lopes, A.F.G.; Talavera-Prieto, M.D.C.; Ferreira, A.G.M.; Santos, J.B.; Santos, M.J.; Portugal, A.T.G. Speed of sound in pure fatty acid methyl esters and biodiesel fuels. Fuel 2014, 116, 242–254. [Google Scholar] [CrossRef] [Green Version]
  23. Tat, M.E.; Van Gerpen, J.H. Measurement of Biodiesel Speed of Sound and Its Impact on Injection Timing; Final Report No. NREL/SR-510-31462; National Renewable Energy Laboratory, U.S. Department of Energy Laboratory: Golden, CO, USA, 2003.
  24. Samuel, O.D.; Okwu, M.O.; Amosun, S.T.; Verma, T.N.; Afolalu, S.A. Production of fatty acid ethyl esters from rubber seed oil in hydrodynamic cavitation reactor: Study of reaction parameters and some fuel properties. Ind. Crops Prod. 2019, 141, 111658. [Google Scholar] [CrossRef]
  25. Stamenković, O.S.; Veličković, A.V.; Veljković, V.B. The production of biodiesel from vegetable oils by ethanolysis: Current state and perspectives. Fuel 2011, 90, 3141–3155. [Google Scholar] [CrossRef]
  26. Arzamendi, G.; Arguiñarena, E.; Campo, I.; Gandía, L.M. Monitoring of biodiesel production: Simultaneous analysis of the transesterification products using size-exclusion chromatography. Chem. Eng. J. 2006, 122, 31–40. [Google Scholar] [CrossRef]
  27. Reyero, I. Avances en la Producción de Biodiésel: Etanolisis y Nuevos Catalizadores Heterogéneos. Ph.D. Thesis, Universidad Pública de Navarra, Pamplona, Spain, 2014. [Google Scholar]
  28. Chen, X.; Li, Z.; Chun, Y.; Yang, F.; Xu, H.; Wu, X. Effect of the Formation of Diglycerides/Monoglycerides on the Kinetic Curve in Oil Transesterification with Methanol Catalyzed by Calcium Oxide. ACS Omega 2020, 5, 4646–4656. [Google Scholar] [CrossRef]
  29. Borovinskaya, E.; Ritter, E.; Reschetilowski, W. Optimization of base catalyzed ethanolysis of vegetable oils in microreactors using design of experiments. Appl. Sci. 2020, 10, 1624. [Google Scholar] [CrossRef] [Green Version]
  30. Tsuji, T.; Kubo, M.; Shibasaki-Kitakawa, N.; Yonemoto, T. Is excess methanol addition required to drive transesterification of triglyceride toward complete conversion? Energy Fuels 2009, 23, 6163–6167. [Google Scholar] [CrossRef]
  31. Reyero, I.; Arzamendi, G.; Zabala, S.; Gandia, L.M. Kinetics of the NaOH-catalyzed transesterification of sunflower oil with ethanol to produce biodiesel. Fuel Process. Technol. 2015, 129, 147–155. [Google Scholar] [CrossRef]
  32. Nomoto, O. Empirical Formula for Sound Velocity in Liquid Mixtures. J. Phys. Soc. Jpn. 1958, 13, 1528–1532. [Google Scholar] [CrossRef]
  33. Meister, E.C. Measurement of the Temperature and Concentration Dependent Sound Velocity in Ethanol-Water Liquid Mixtures. In Physikalisch-Chemisches Praktikum; ETH: Zurich, Switzerland, 2015. [Google Scholar]
  34. Rode, S.; Bhandakkar, V.D.; Chimankar, O.P. Theoretical Evaluation of Ultrasonic Velocity in Binary Liquid Mixtures at 5 MHz for Temperature 298 K. IOSR J. Appl. Phys. 2016, 8, 10–14. [Google Scholar]
  35. Junjie, Z. Calculation of Ultrasonic Velocity in Binary Liquid Mixtures of Benzene. J. China Univ. Sci. Technol. 1984, 14, 298–299. [Google Scholar]
  36. Van Dael, W. Thermodynamic properties and the velocity of sound. In Experimental Thermodynamics, Experimental Thermodynamics of Non-Reacting Systems; Le Neindre, B., Vodar, B., Eds.; Butterworths: London, UK, 1975; Volume 2, pp. 527–575. ISBN 0-408-70566-3. [Google Scholar]
  37. Rarokar, N.R.; Menghani, S.; Kerzare, D.; Khedekar, P.B. Progress in Synthesis of Monoglycerides for Use in Food and Pharmaceuticals. J. Exp. Food Chem. 2017, 3, 1–6. [Google Scholar] [CrossRef]
  38. Nitbani, F.O.; Tjitda, P.J.P.; Nurohmah, B.A.; Wogo, H.E. Preparation of fatty acid and monoglyceride from vegetable oil. J. Oleo Sci. 2020, 69, 277–295. [Google Scholar] [CrossRef] [PubMed] [Green Version]
Figure 1. Experimental speed of sound data for reactions carried out at different temperatures and alcohol/oil molar ratios.
Processes 10 00012 g001
Figure 2. Experimental oil conversions () and speed of sound propagation data (------) for reactions carried out at a 6:1 ethanol/oil molar ratio and different reaction temperatures. In black (◆, ---) are the oil conversion and sound propagation data in the replicated reactions.
Processes 10 00012 g002
Figure 3. Transition from heterogeneous (purple) to homogeneous (yellow) system, depending on the reaction conditions and on the oil conversion achieved.
Processes 10 00012 g003
Figure 4. Evolution of oil conversion estimated through speed of sound propagation (lines) and offline SEC analyses (symbols) of a series of ethanolysis reactions with a 0.10 wt.% catalyst. (A) with 24:1; 4. (B) with 18:1, 4. (C) with 12:1 and (D) with 6:1 ethanol/oil molar ratio; all of them working at different temperatures (15 °C in green, 23 °C in red, 35 °C in blue and 50 °C in black).
Processes 10 00012 g004
Figure 5. Initial speed of sound, experimental values (symbols), and the prediction made by Nomoto’s expression (lines) for ethanolysis reactions carried out at different alcohol molar ratios and temperatures. (A) Effect of the temperature reaction, (B) Effect of the alcohol proportion.
Processes 10 00012 g005
Figure 6. Experimental conversion evolution (symbols) and conversion calculated from experimental sound velocity (lines) for ethanolysis carried out at different alcohol/oil molar ratios and catalyst contents. In (AC) are shown runs performed with 0.1 wt.% NaOH; (A) at 50 °C, (B) at 35 °C, and (C) at 23 °C. (D) show results from tests carried out at 23 °C and 0.05 wt.% NaOH.
Processes 10 00012 g006
Table 1. Optimal parameters for Equation (2).
ParameterValue
u0,Tref (m/s)1452.7
aT (m/s/°C)−3.5
aw (m/s)−373.8
aX (m/s)6.36
aTw (m/s)−0.029
aXw (m/s)43.7
aXT (m/s)−0.032
Table 2. Selectivity coefficients obtained for diglycerides (DG) and glycerol (GL) for selected alcohol molar ratios (6:1; 12:1, and 24:1).
Sisi,0si,1si,2si,3si,4si,5
DG; 6:11.00001.00001.0000−0.00000.00000.0000
DG; 12:1−1.4984−2.1438−2.311200.53761.60941.7145
DG; 24:11.48283.46503.23220−3.9000−8.8995−8.2972
GL; 6:1−1.0327−3.7899−1.8714014.60024.86122.322
GL; 12:11.09002.8252−0.01086−22.700−31.158−27.827
GL; 24:1−1.0421−1.3587−0.0373612.50014.56913.0670
Table 3. Estimated values for speed of sound propagation of pure components.
ui,T = a − b(T-20)a (m/s)b (m/s/°C)
Oil1430 ± 33.5 ± 0.1
Diglycerides, monoglycerides1490 ± 10
Ethyl esters1396 ± 4
Ethanol1144 ± 2
Glycerol1921.3 *
* Pure glycerol speed of sound was experimentally measured and used in this work.
Publisher’s Note: MDPI stays neutral with regard to jurisdictional claims in published maps and institutional affiliations.

