Article

Influence of Hydrodynamic Conditions on Precipitation Kinetics of Barium Sulfate in a Multifunctional Reactor

1
Department of Chemical Engineering and Process Design, Faculty of Chemistry, Silesian University of Technology, 44-100 Gliwice, Poland
2
Department of Physical Chemistry and Technology of Polymers, Faculty of Chemistry, Silesian University of Technology, 44-100 Gliwice, Poland
*
Author to whom correspondence should be addressed.
Processes 2022, 10(1), 146; https://doi.org/10.3390/pr10010146
Submission received: 6 December 2021 / Revised: 29 December 2021 / Accepted: 5 January 2022 / Published: 11 January 2022
(This article belongs to the Section Particle Processes)

Abstract

:
In this paper, the influence of hydrodynamic conditions in Kenics static mixer, which acts as a multifunctional reactor, on precipitation kinetics of barium sulfate is investigated. The investigated range of the Reynolds number varied between 500 and 5000, which covered both laminar and turbulent flow regimes. In all experiments, the relative supersaturation was maintained at the constant level (σ = 205). The obtained precipitate was collected and used for crystal size distribution (CSD) determination. On that basis, the kinetic parameters of the process were calculated using the mixed suspension mixed product removal (MSMPR) mathematical model of the process. It was found that for the whole investigated range of Reynolds number, the mixing conditions were satisfactory. CSD analysis showed that in the laminar regime, a clear tendency in crystal behavior could not be noticed. However, during the analysis of the turbulent regime, the presence of a critical Reynolds number was noticed. Above this value, there is a change in the flow pattern, which results in a change of kinetic parameters (B, G), as well as manifests in a form of a decrease in the value of mean diameters of crystals. The flow pattern change is caused by the geometry of the reactor’s inserts.

1. Introduction

Precipitation is a very rapid process accomplished by mixing reactants under appropriate process conditions. Unlike crystallization by cooling or solvent evaporation, crystallization with a chemical reaction is an irreversible process. Due to the relatively high local supersaturations, nucleation usually occurs in the labile state of the system. As a result, excellent conditions for homo- and heterogeneous primary nucleation are achieved. The crystallization with a chemical reaction, such as in the case of all crystallization processes, consists of three stages: supersaturation generation, nucleation, and crystal growth. They may be accompanied by additional (usually undesired) phenomena influencing the final crystallization product quality. Among the others, one may mention aggregation and breakage processes, as well as aging [1].
A static mixer is an apparatus developed for unconventional mixing, where the fluid is mixed by splitting and recombining streams using specially design mixing inserts [2]. This fluid movement increases the heat and mass transport in the cross-section by creating secondary transfer flows [3]. The high mixing efficiency of static mixers is achieved by specially shaped static mixing elements. These elements create vortices, providing local turbulence even at low flow velocities. The fluid flowing through the mixer hits these elements so that the flow energy is converted into mechanical energy. However, obtaining higher turbulence is associated with higher pressure drops [4]. Static mixers are exceptionally good in mixing laminar flows because of their ability to divide and redistribute streamlines by using only energy of flow [5]. This is especially important in viscous fluids flow. In such cases, velocity is relatively low—such that it is classified as a laminar regime. Static mixers, due to their great variety, are used in many industries, from the food industry [6], through petrochemistry [7], to wastewater treatment [8].
Barium sulfate takes the form of soft, rhombic, white crystals. However, the color of the barite mineral may vary, depending on the impurities [9]. Barium sulfate is used in many different fields of science, industry, and others. The most common ones are the application as a contrast medium for videography [10,11,12,13] and as a pigment in white paint [14,15]. Nevertheless, the less known applications of such crystalline solids are as a catalyst reservoir in Stille cross-coupling reaction [16], as a weighting agent for muds drilling to prevent blowout during drilling of oil and gas [17], as a waste-sorbing material in dye wastewater treatment [18], as a polymer additive [19,20], as a pyrotechnic time delay composition [21] and as a composition of thermal control coatings for spacecraft [22,23]. Additionally, barium sulfate has also found its application in catalytic processes of kinetic resolution as catalyst support [16,24,25,26].
Barium sulfate was investigated by many authors from various perspectives. Usually, the main focus is placed on finding a way to neutralize harmful BaCl2 by the production of BaSO4. Piotrowski et al. [27] made an attempt to investigate reaction kinetics of such a reaction, where BaCl2 is a toxic byproduct in steel hardening technology. The impact of the presence of sodium chloride on crystallization was considered. The focus was placed on the application of artificial neural networks to model the process—with success. Berenjian et al. [28] investigated the impact of various parameters on the particle size of barium sulfate, such as feeding rates, temperature, initial reagent concentrations, and presence of the additive. Fischer et al. [29] also tested the influence of pH and impurities present in the particle size of barium sulfate. Wojtas et al. [30] researched the hydrodynamic conditions of barium sulfate precipitation in a jet reactor, considering various reactor geometry (symmetric and vortex T-mixer), using Large Eddy Simulation. Ronquim et al. [31] analyzed the rate of seeded precipitation process, where the seeding agent was barium sulfate crystals. Kieffer et al. [32] investigated the influence of process parameters on barium sulfate particle precipitation in a hollow fiber membrane device. The concentration of reagents mainly affected the CSD, however, the effect of flow rates was less pronounced.
There is no information on experimental measurements of barium sulfate precipitation in a static mixer of Kenics geometry. As the parameter that allows one to compare precipitation kinetics in reactors of various geometry induction time was selected. It was investigated in the past but is a bit underestimated, as it can serve as a reference value for the comparison of precipitation kinetics in various types of reactors [33,34,35]. Symeopoulos et al. [33] tested spontaneous precipitation of barium sulfate. The reaction was performed in a double-walled reactor with the cylindrical-shaped reactor; however, the supersaturation was created by means of thermostated Y-shaped glass tube. Authors measured induction time, using UV-Vis spectrometry and proved that it is strongly dependent on supersaturations, i.e., concentrations of stock solutions in precipitation process. For concentration of 1 × 10 4   mol / dm 3 achieved induction time was 75   min . Cafiero et al. [34] tested precipitation of barium sulfate in spinning disc reactor achieving induction time approximately equal to 2.5 × 10 3   s for the concentration of 1 × 10 5   mol / dm 3 . McCarthy et al. [35] tested precipitation of barium sulfate in a narrow channel flow reactor. Obtained induction time varied from 1 to 32 × 10 3   s .
Concluding, experimental investigation of barium sulfate precipitation in Kenics static mixer used as a multifunctional reactor was never reported up till now. However, there was several research done on the crystallization of barium sulfate in plug flow reactors [36,37,38,39,40]. Nevertheless, the use of static mixers in reactive crystallization would be of large benefit from the process point of view. In comparison to standard tank reactors, a static mixer is more compact, provides good heat and mass transfer, is easily scalable, and the residence time is relatively short. For the above reasons, the attempt to describe the precipitation of barium sulfate in the reactor of the described geometry was made.

2. Mathematical Model of the Process

2.1. Kinetic Parameters

Efficiency (η) is defined as the ratio of the driving force consumed in the process to the driving force of the phenomenon at the inlet:
η = σ i n l e t σ o u t l e t σ i n l e t × 100 %
where: σ i n l e t / o u t l e t —relative supersaturation inlet and outlet, respectively ( ) .
In order to determine the kinetic parameters, the population balance needs to be considered. There are a few possibilities to model a Kenics static mixer as a reactor. One is to use a PFR (Plug Flow Reactor) [41,42]. The reactor used in this research may also be modeled as MSMPR (mixed suspension, mixed product removal) crystallizer under a few assumptions. Such a reactor is characterized primarily by [43]:
  • Perfect mixing of the suspension,
  • Zero crystal seeds size,
  • No aggregation and breakage of crystals,
  • McCabe law fulfilled,
  • No growth dispersion.
Population balances calculation results can be represented by the two functions q 3 and Q 3 [43]:
q 3 = m i m Δ L i ,
Q 3 = m i m × 100 %
where: m i —mass of i-th class particles ( kg ) , m —total mass of sample ( kg ) , Δ L i —particle class size width ( m ).
The number density function (n(Li)), is calculated as follows:
n ( L i ) = m i m T k v ρ s L i 3 Δ L i m i ,
where: m T —magma density ( kg / m 3 ) , k v —volume shape coefficient, ( ) ,   L i —average size of i-th particle class ( m ) , ρ s —density of crystals (kg/m3).
For MSMPR, the population balance can be simplified to Equation (5):
n ( L i ) = n 0 × e ( L i G · τ ) ,
where: n 0 —value of number density function for crystals nuclei ( 1 / m × m 3 ) .
The kinetic parameters that are determined on the basis of CSD are linear crystal growth rate G and nucleation intensity B. As overall linear growth rate is concerned, it can be defined as mass deposited per unit area of crystal surface and per unit time. As such, the expression for G will take the form [1]:
G = d L d t
Nucleation intensity and linear crystal growth rate can be related to each other as they can be also written in terms of supersaturation. This relation is [1]:
B = n 0 × G
Barium sulfate precipitation reaction can be described as follows:
B a 2 + + S O 4 2 B a S O 4 .
The driving force of the process determined by the relative supersaturation may be defined as [1,43]:
σ = S 1 ,
where: σ —relative supersaturation ( ) , S —supersaturation (—).
It is calculated on the basis of ionic activity and solubility [44]:
σ = ( I P K s p ) 1 v 1 ,
where: I P —ionic activity in solution [ ( mol dm 3 ) 3 ] , K s p —solubility product constant of B a S O 4 equal to 1.1 × 10 10 [45], v —the number of ions in the salt particle.
I P = [ C B a 2 + × γ B a 2 + ] [ C S O 4 2 × γ S O 4 2 ] ,
where: γ —ion activity coefficients [ ]
l g γ = 0.509 · z i 2 I 1 + I ,
where: z i —ion charge [ ] , I —ionic strength [ mol / dm 3 ]
I = 1 2 c i z i 2

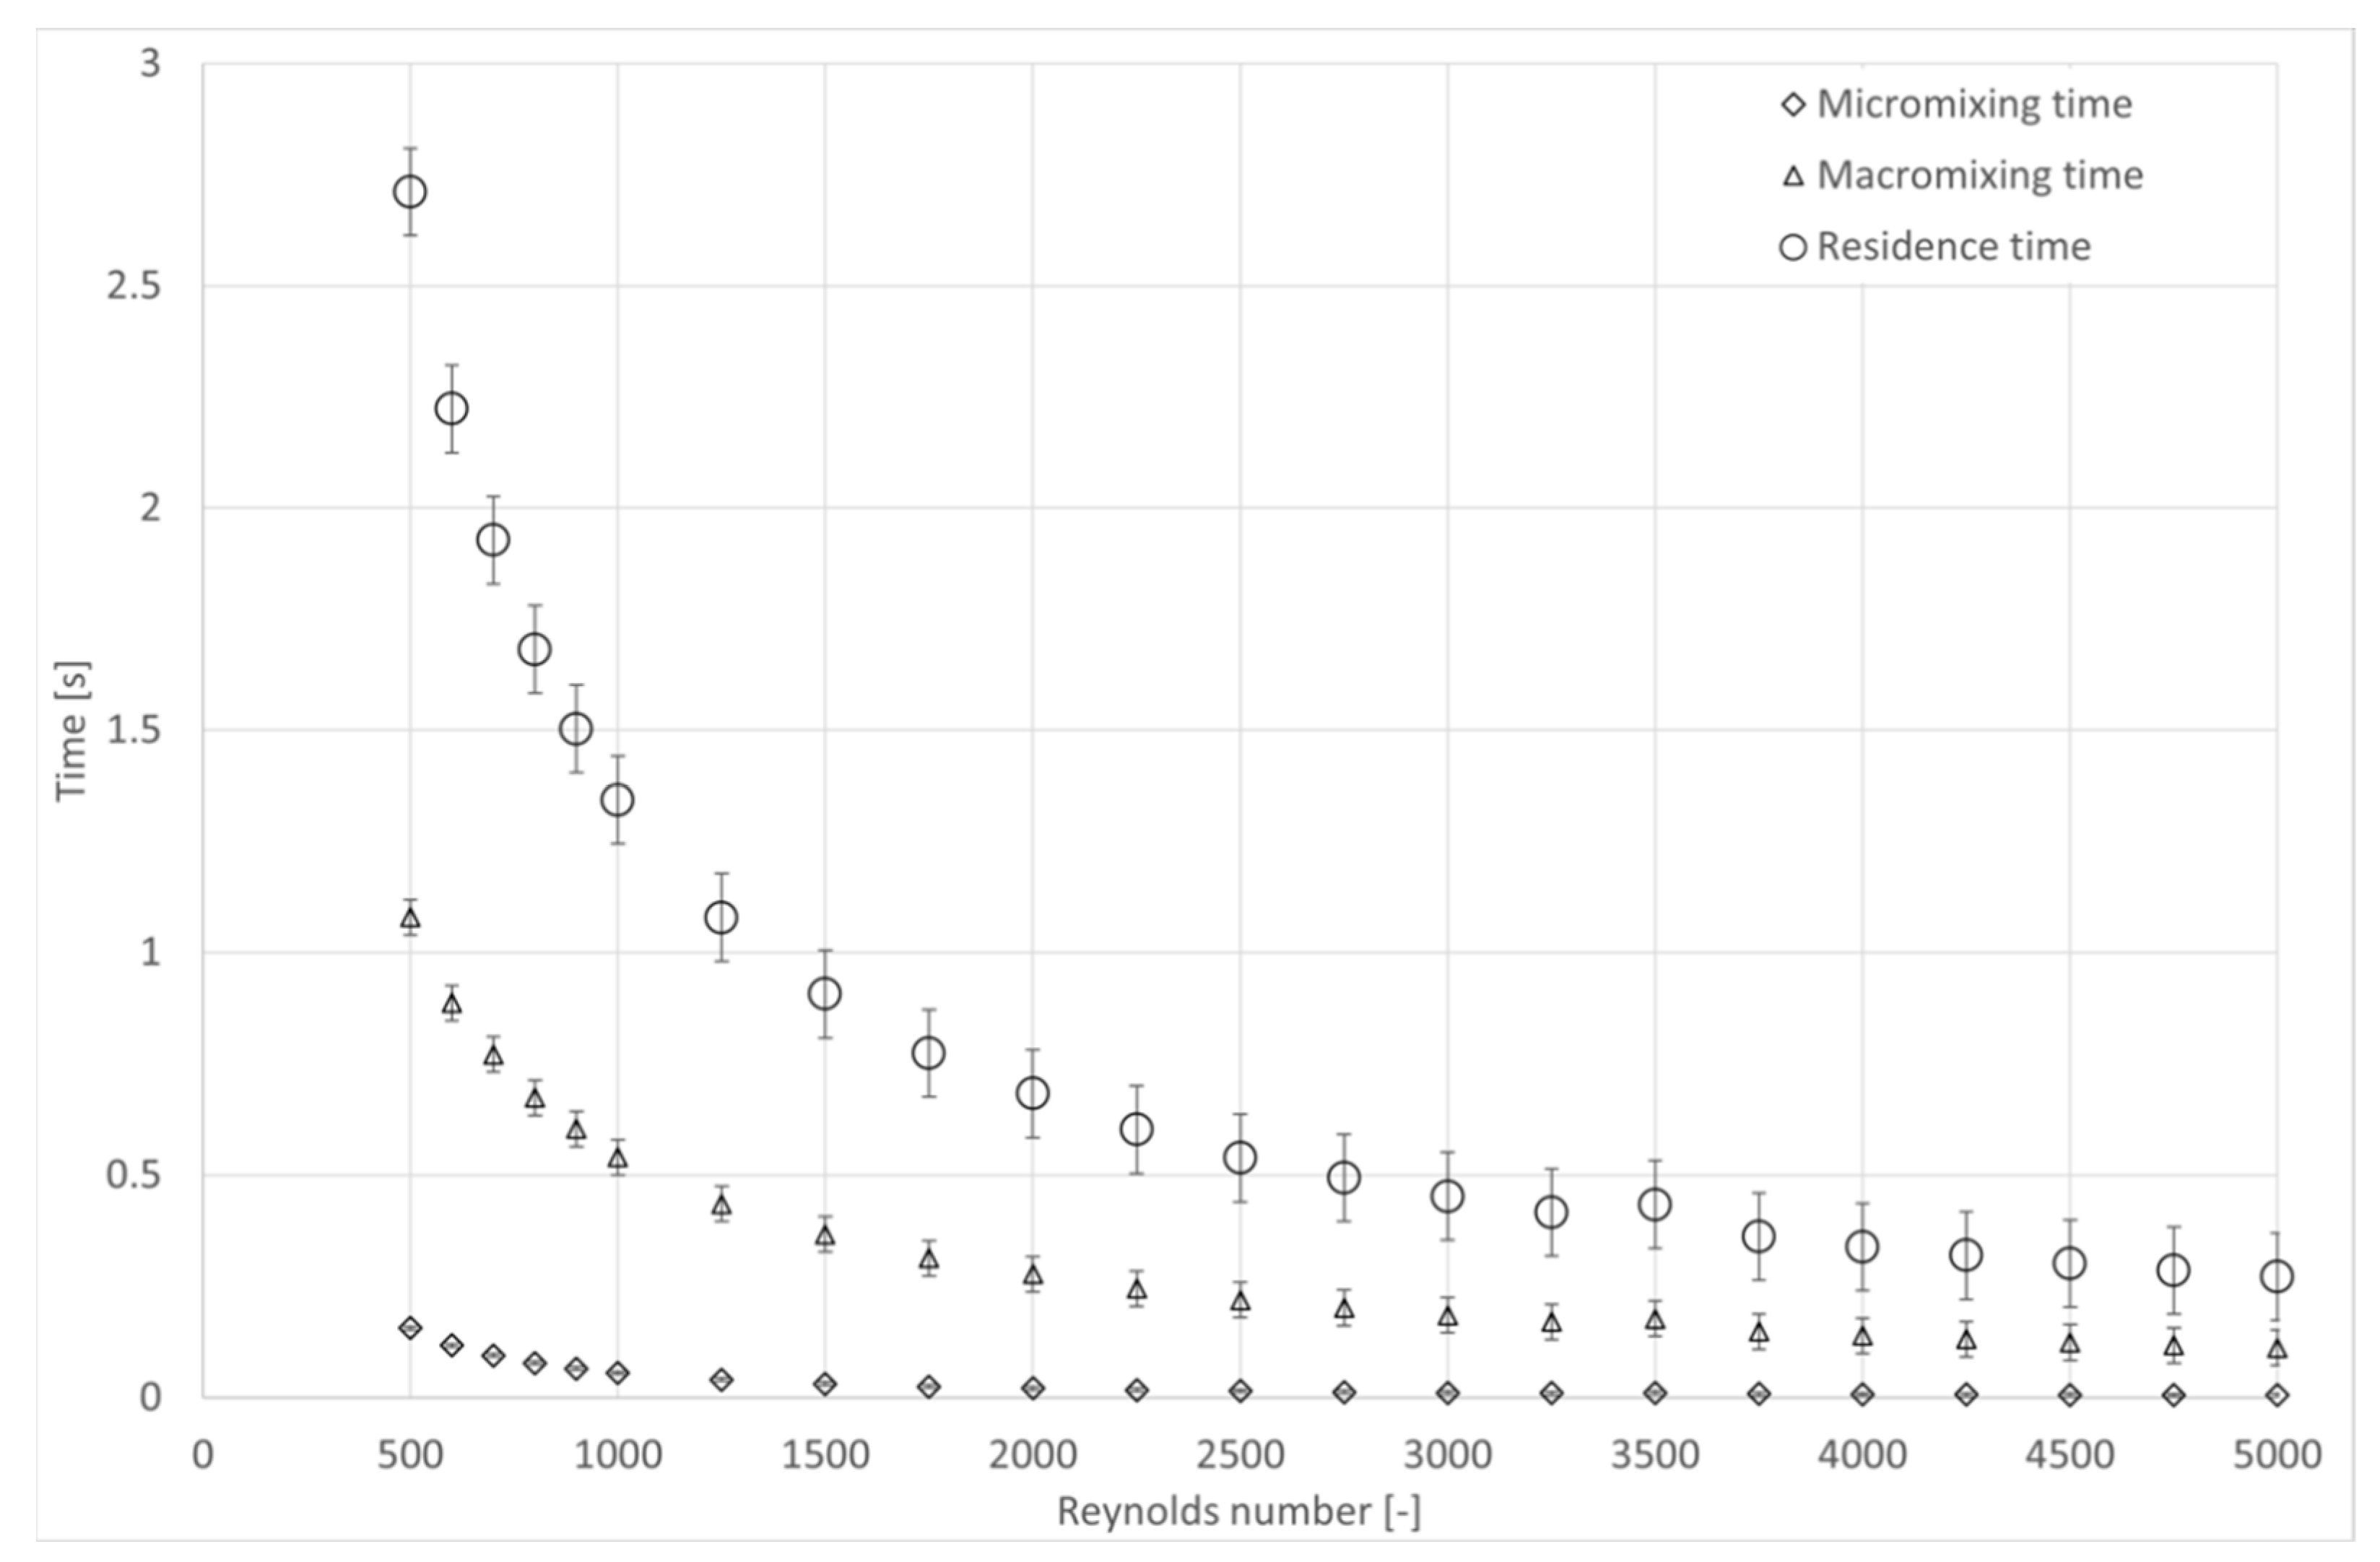
2.2. Hydrodynamic Conditions

With respect to hydraulic conditions, it is important to determine the dominant mixing mechanism in relation to crystallization. The first task is to determine the residence time ( τ ), which in the continuous reactors is defined in accordance with the idea of plug flow and defined as [1,43]:
τ = V V f e e d ,
where: V —volume of reactor ( m 3 ) ,   V f e e d —volumetric flow rate of feed ( m 3 / s ).
Induction time ( t i n d ) can be approximated by the following formula [1,43]:
t i n d = 80 × L M 2 D A B l n ( S )
where: L M 2 —characteristic size of the molecule equal to: 90.6 × 10 20 m2, D A B —kinematic diffusion coefficient equal to: 2 × 10 9   ( m 2 / s ).
Macromixing is responsible for homogenization of the mixture and reduction of the formation of zones with much larger supersaturation than the specified one. Therefore, the micromixing time should be significantly less than the residence time. This guarantees a good and quick mixing of the dosed substrates, which reduces the intensity of primary nucleation. In addition, macromixing has a significant impact on the difference in the residence time of individual particles in the reactor. However, micromixing has a significant impact on the kinetics of nucleation and crystal growth. This happens when the induction time is greater than the micromixing time. In the opposite case, the effect of micromixing is negligible on the crystal size distribution.
Macromixing time ( t m a c ) is defined as [43]:
t m a c = 7.3   d 2 ε a v 3 .
And the micromixing time ( t m i c ) can be calculated using the formula [43]:
t m i c = 50   η ρ ε a v   l n ( S c ) ,
where: d —diameter of reactor ( m ) , S c —Schmidt number ( ) , ε a v —average unit power input ( W kg ) .
ε a v = Δ p · V s l u r r y m s l u r r y ,
where: m s l u r r y —mass of slurry in the reactor ( kg ).
One of the most important aspects of crystallization processes is crystal growth. According to Mersmann et al. [46] one may distinguish three phenomena that may control crystal growth, i.e., heat transfer, bulk diffusion, and/or surface integration. Heat transfer is a limiting step considering crystallization from melt, due to the fact that the bulk diffusion and surface integration are relatively rapid. However, considering precipitation, i.e., crystallization from solution, the crystal growth rate is limited by bulk diffusion. These limiting phenomena strongly depend on supersaturation values. Bulk diffusion controlling crystal growth is taken into account at high supersaturations, however at lower supersaturations it is determined by surface integration. Nevertheless, it is rather difficult to objectively decide what values of supersaturation are high and low. In order to prove which mechanism limits the crystal growth following Equations where introduced.
The bulk diffusion limits the crystal growth, when:
σ > 0.01 × ρ M · K s p 3 .
The surface integration limits the crystal growth, when:
σ < 2 × 10 4 × ρ M × K s p 3 .

3. Materials and Methods

3.1. Stock Solutions

Barium chloride and sodium sulfate solutions of 0.008 mol/dm3 were prepared by dissolving barium chloride dihydrate (VWR Int., Radnor, PA, USA) and anhydrous sodium sulfate (VWR Int., Radnor, PA, USA), respectively, in 30 L of demineralized water obtained by reverse osmosis. The solutions were prepared directly before experiments and mixed for at least 1 h.

3.2. Crystallization with Chemical Reaction

The scheme of the laboratory setup is shown in Figure 1. The stock solutions were stored in tanks 1 and 2. They were transferred to the reactor using two peristaltic pumps (Lead Fluid BT 301L) in a 1:1 ratio in such a way, that the summation of their flow rates resulted in the corresponding Reynolds number. The reaction took place in a multifunctional reactor—Kenics static mixer at temperature of 298 K, according to the following reaction scheme:
B a C l 2 + N a 2 S O 4 B a S O 4 + N a C l .
The basic parameters of the static mixer are presented in Table 1. The investigated range of Re was between 500 and 5000 which corresponds to the flow rate of each solution between 143 (mL/min) and 1428 (mL/min). In the range of 500 to 1000 step of change was set to 100, and above this value, the step was set to 250. The Reynolds number was calculated using the following Equation:
Re = 4 × V ˙ × ρ π × d × η
where: V ˙ —volumetric flow rate ( m 3 / s ) , ρ —density of water ( kg m 3 ) , d —diameter of reactor ( m ) , η —dynamic viscosity coefficient of water ( Pas ) .
In a multifunctional reactor, hydraulic conditions are represented by the Reynolds number. In this case, many authors [5,47] determined the limiting value of Re that separates laminar and turbulent flow as 1000. As investigated, Re range is from 500 to 5000, both laminar and turbulent regime are investigated.
When the process achieved a steady state, a 250 mL sample was taken in order to perform mass balance analysis. Then, 7 L of slurry were collected in order to perform analytical analysis as well as CSD measurements and microscopic photographs. The first (small volume) sample was filtered under vacuum on a sintered funnel. Then the funnel with solid product was dried for 24 h at 55 °C. The second sample (large volume) was also filtered under vacuum on a sintered funnel. Additionally, around 1000 mL of filtrate (post-reaction solution) was collected for further physicochemical analysis. After completed filtration, solid product was transferred into a crystallizing dish and dried for 24 h at 55 °C.

3.3. Physico-Chemical Properties of Stock and Post-Reaction Solutions

Concentration of stock solutions and post-reaction solutions was measured by indirect conductometric titration. A digital conductivity meter Elmetron CPC- 551 (Elmetron, Gliwice, Poland) and a conductivity cell EPS- 2ZE euroSENSOR (Elmetron, Gliwice, Poland) was applied for conductivity measurements. Barium and sulfate ion concentrations were determined by titration with sodium sulfate and barium chloride, respectively. Titrants’ concentration were 0.048 mol/dm3. The samples analyzed were 50 mL in volume and the titration step was 1 mL for stock solutions, whereas for post-reaction solutions the step was equaled to 0.1 mL. Because of very low concentrations used, the post-reaction solutions were also checked with a step of 0.01 mL and 0.001 mL. Density of stock and post-reaction solutions was measured with Anton Paar DMA 4500M (Anton Paar, Warsaw, Poland), pH with Elmetron CPC-551 with ELMETRON EPS-1 (Elmetron, Gliwice, Poland) electrode and dynamic viscosity coefficient with Cambridge Applied Systems VL-400.

3.4. Solid Product Analysis

Crystals were analyzed using Olympus CH30 microscope (Olympus Int., Shenzhen, China) and Analysette 22 (Fritsch GmbH, Idar-Oberstein, Germany) laser sizer for particle size analysis.
All experiments were repeated at least three times. Each time fresh solutions were prepared.

4. Results and Discussion

4.1. Relative Supersaturation Determination

The relative supersaturation was calculated using Equations (7)–(11). Results are presented in Table 2.
The calculated ionic strength indicate that the solution is diluted and the standard Debye-Hückel limiting law applies (Equation (10)). The relative supersaturation value was calculated to be equal to 205. According to the literature [44,48], sparingly soluble substances are characterized by high supersaturation value. This implicates crystallization with chemical reaction.

4.2. Efficiency and Conversion Degree

All initial solutions were carefully prepared since very low concentrations of reagents were used. According to the analysis performed after reaction, in all cases both efficiency and conversion were at a very high level: above 90%. The higher the value of Re is, the closer to 100% both the conversion and efficiency are. In the turbulent region they achieve the value of 100%. There are two reasons for such results. First, the turbulence is very high and together with mixing inserts gives almost perfect mixing of the substrates (despite very small reactor sizes). Second, the concentration of initial solutions is very low, which in combination with very good mixing gives the complete consumption of substrates. In the laminar region both the efficiency and conversion are lower than in turbulent region, but still very high (91% for efficiency and 94% for conversion) and increases with increasing Re. The results are consistent with those obtained from other authors [37] and are presented in Table 3.

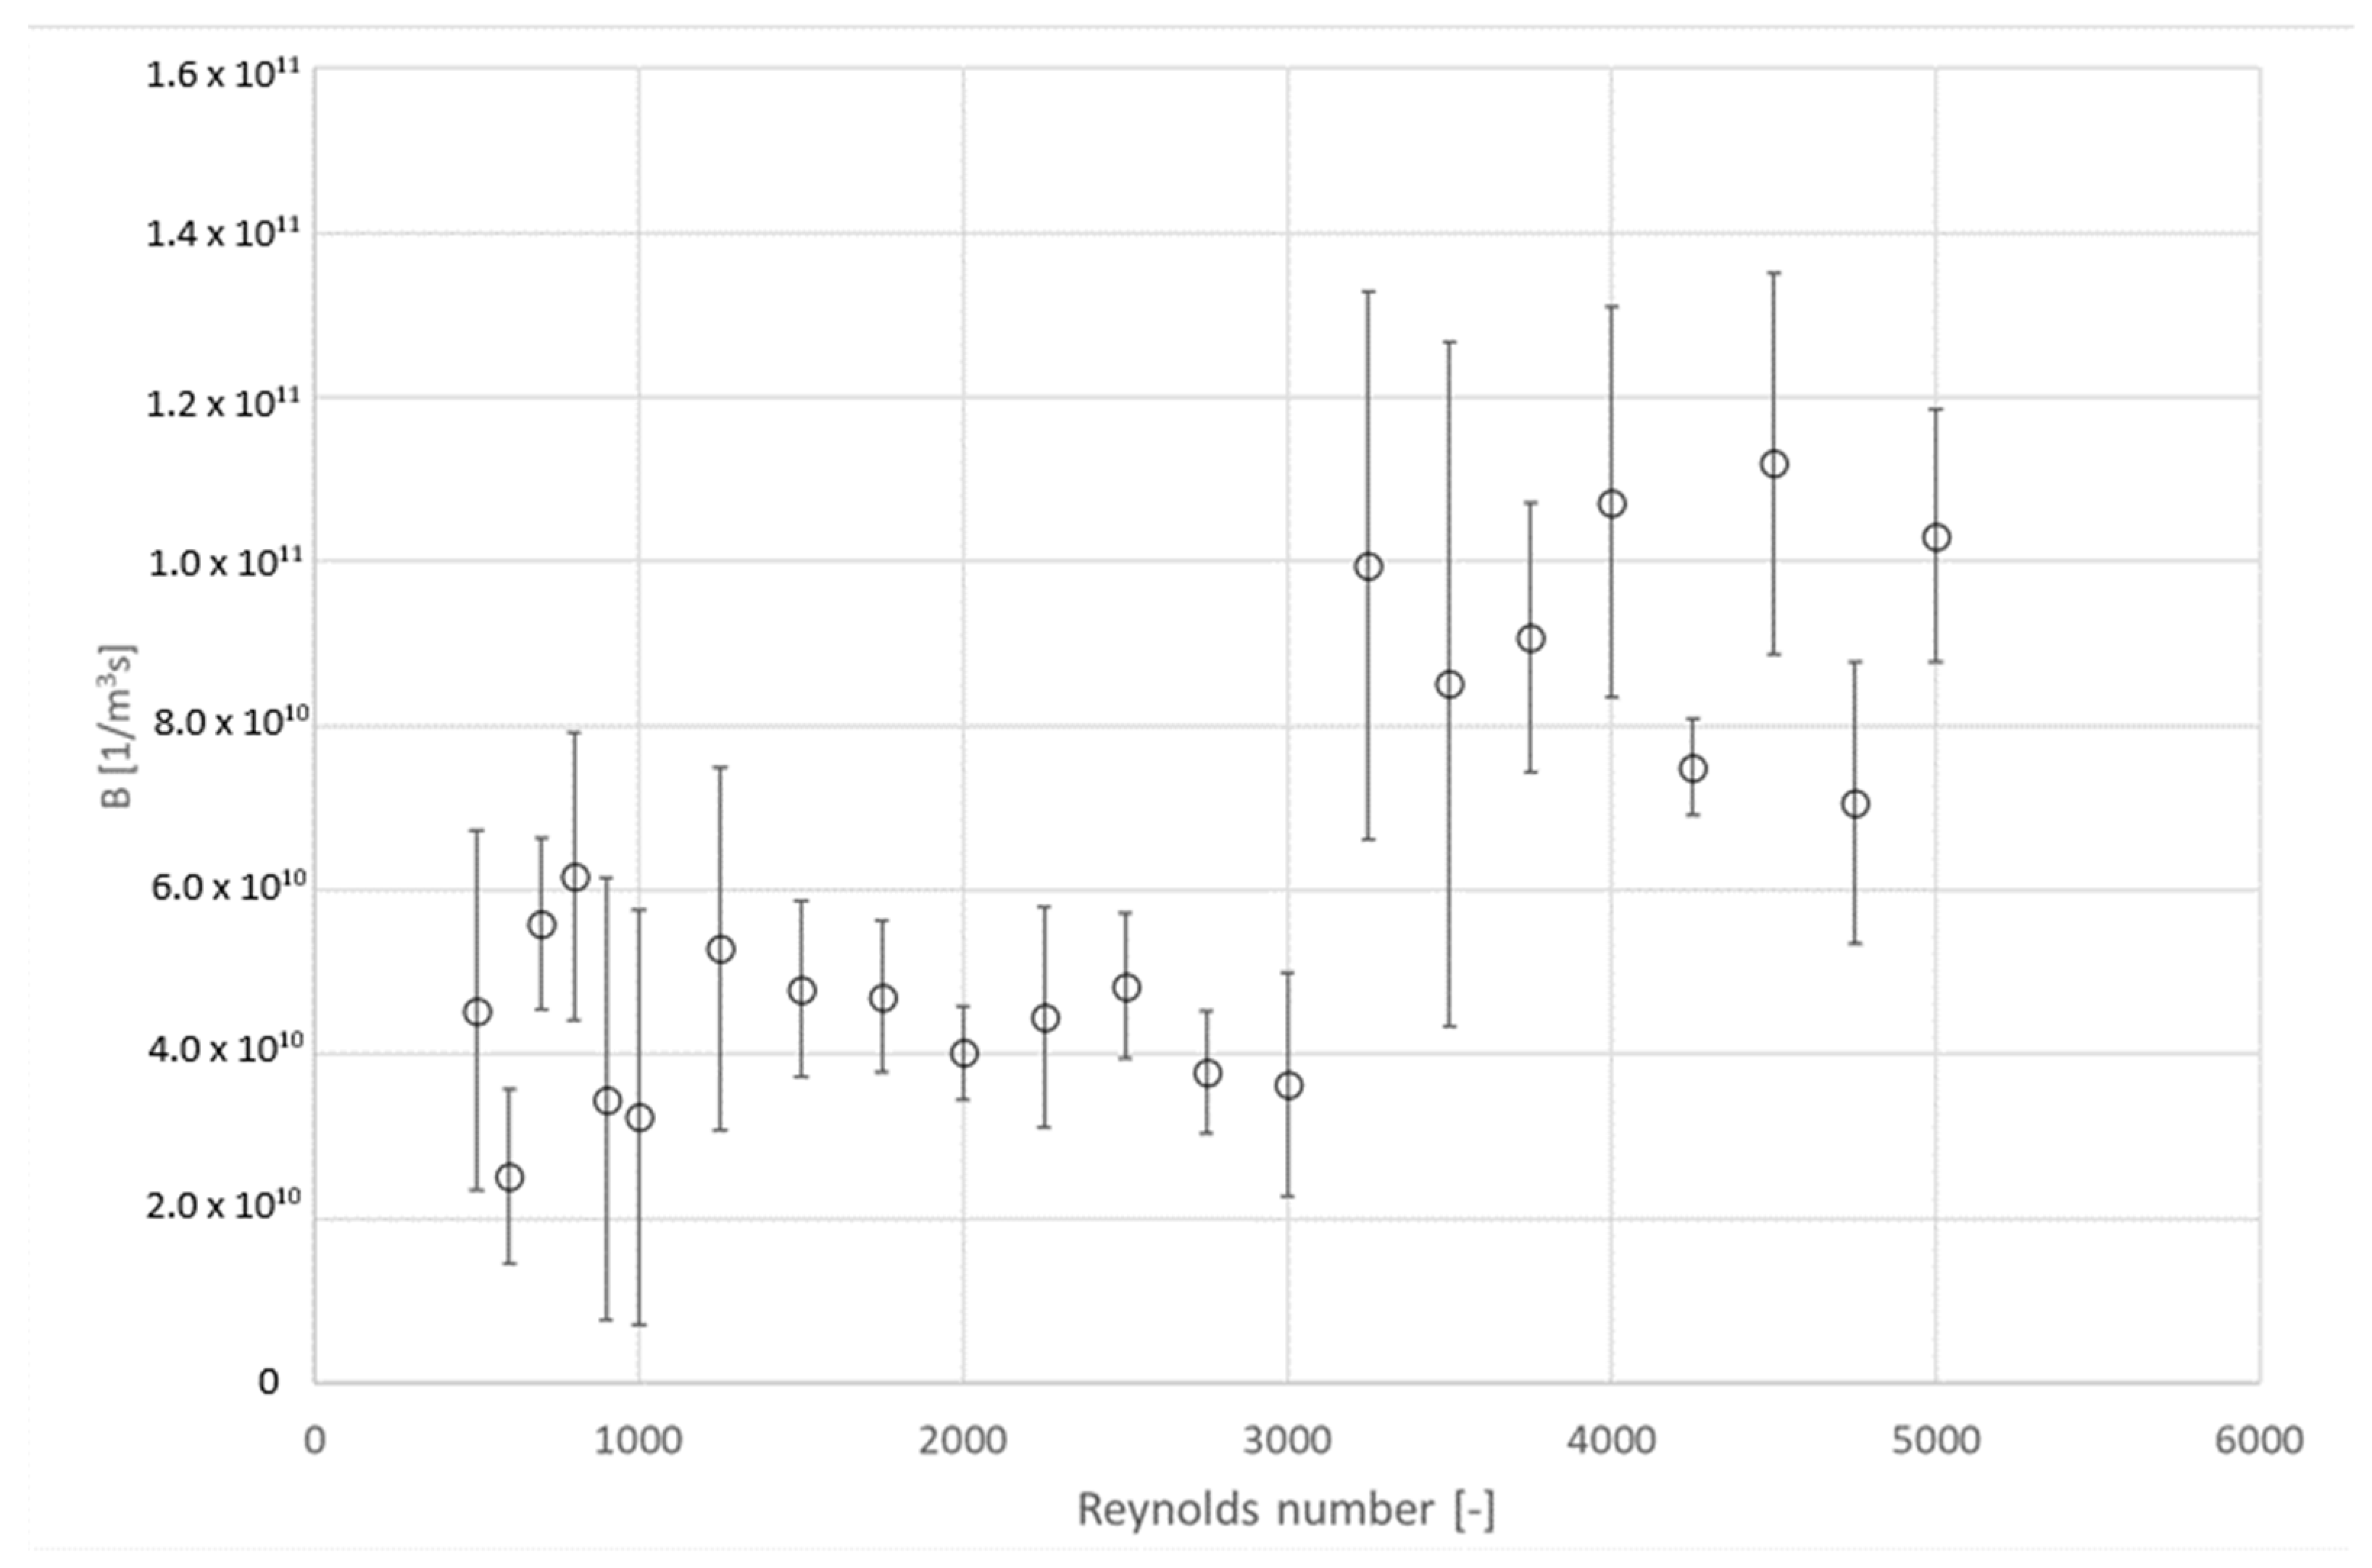
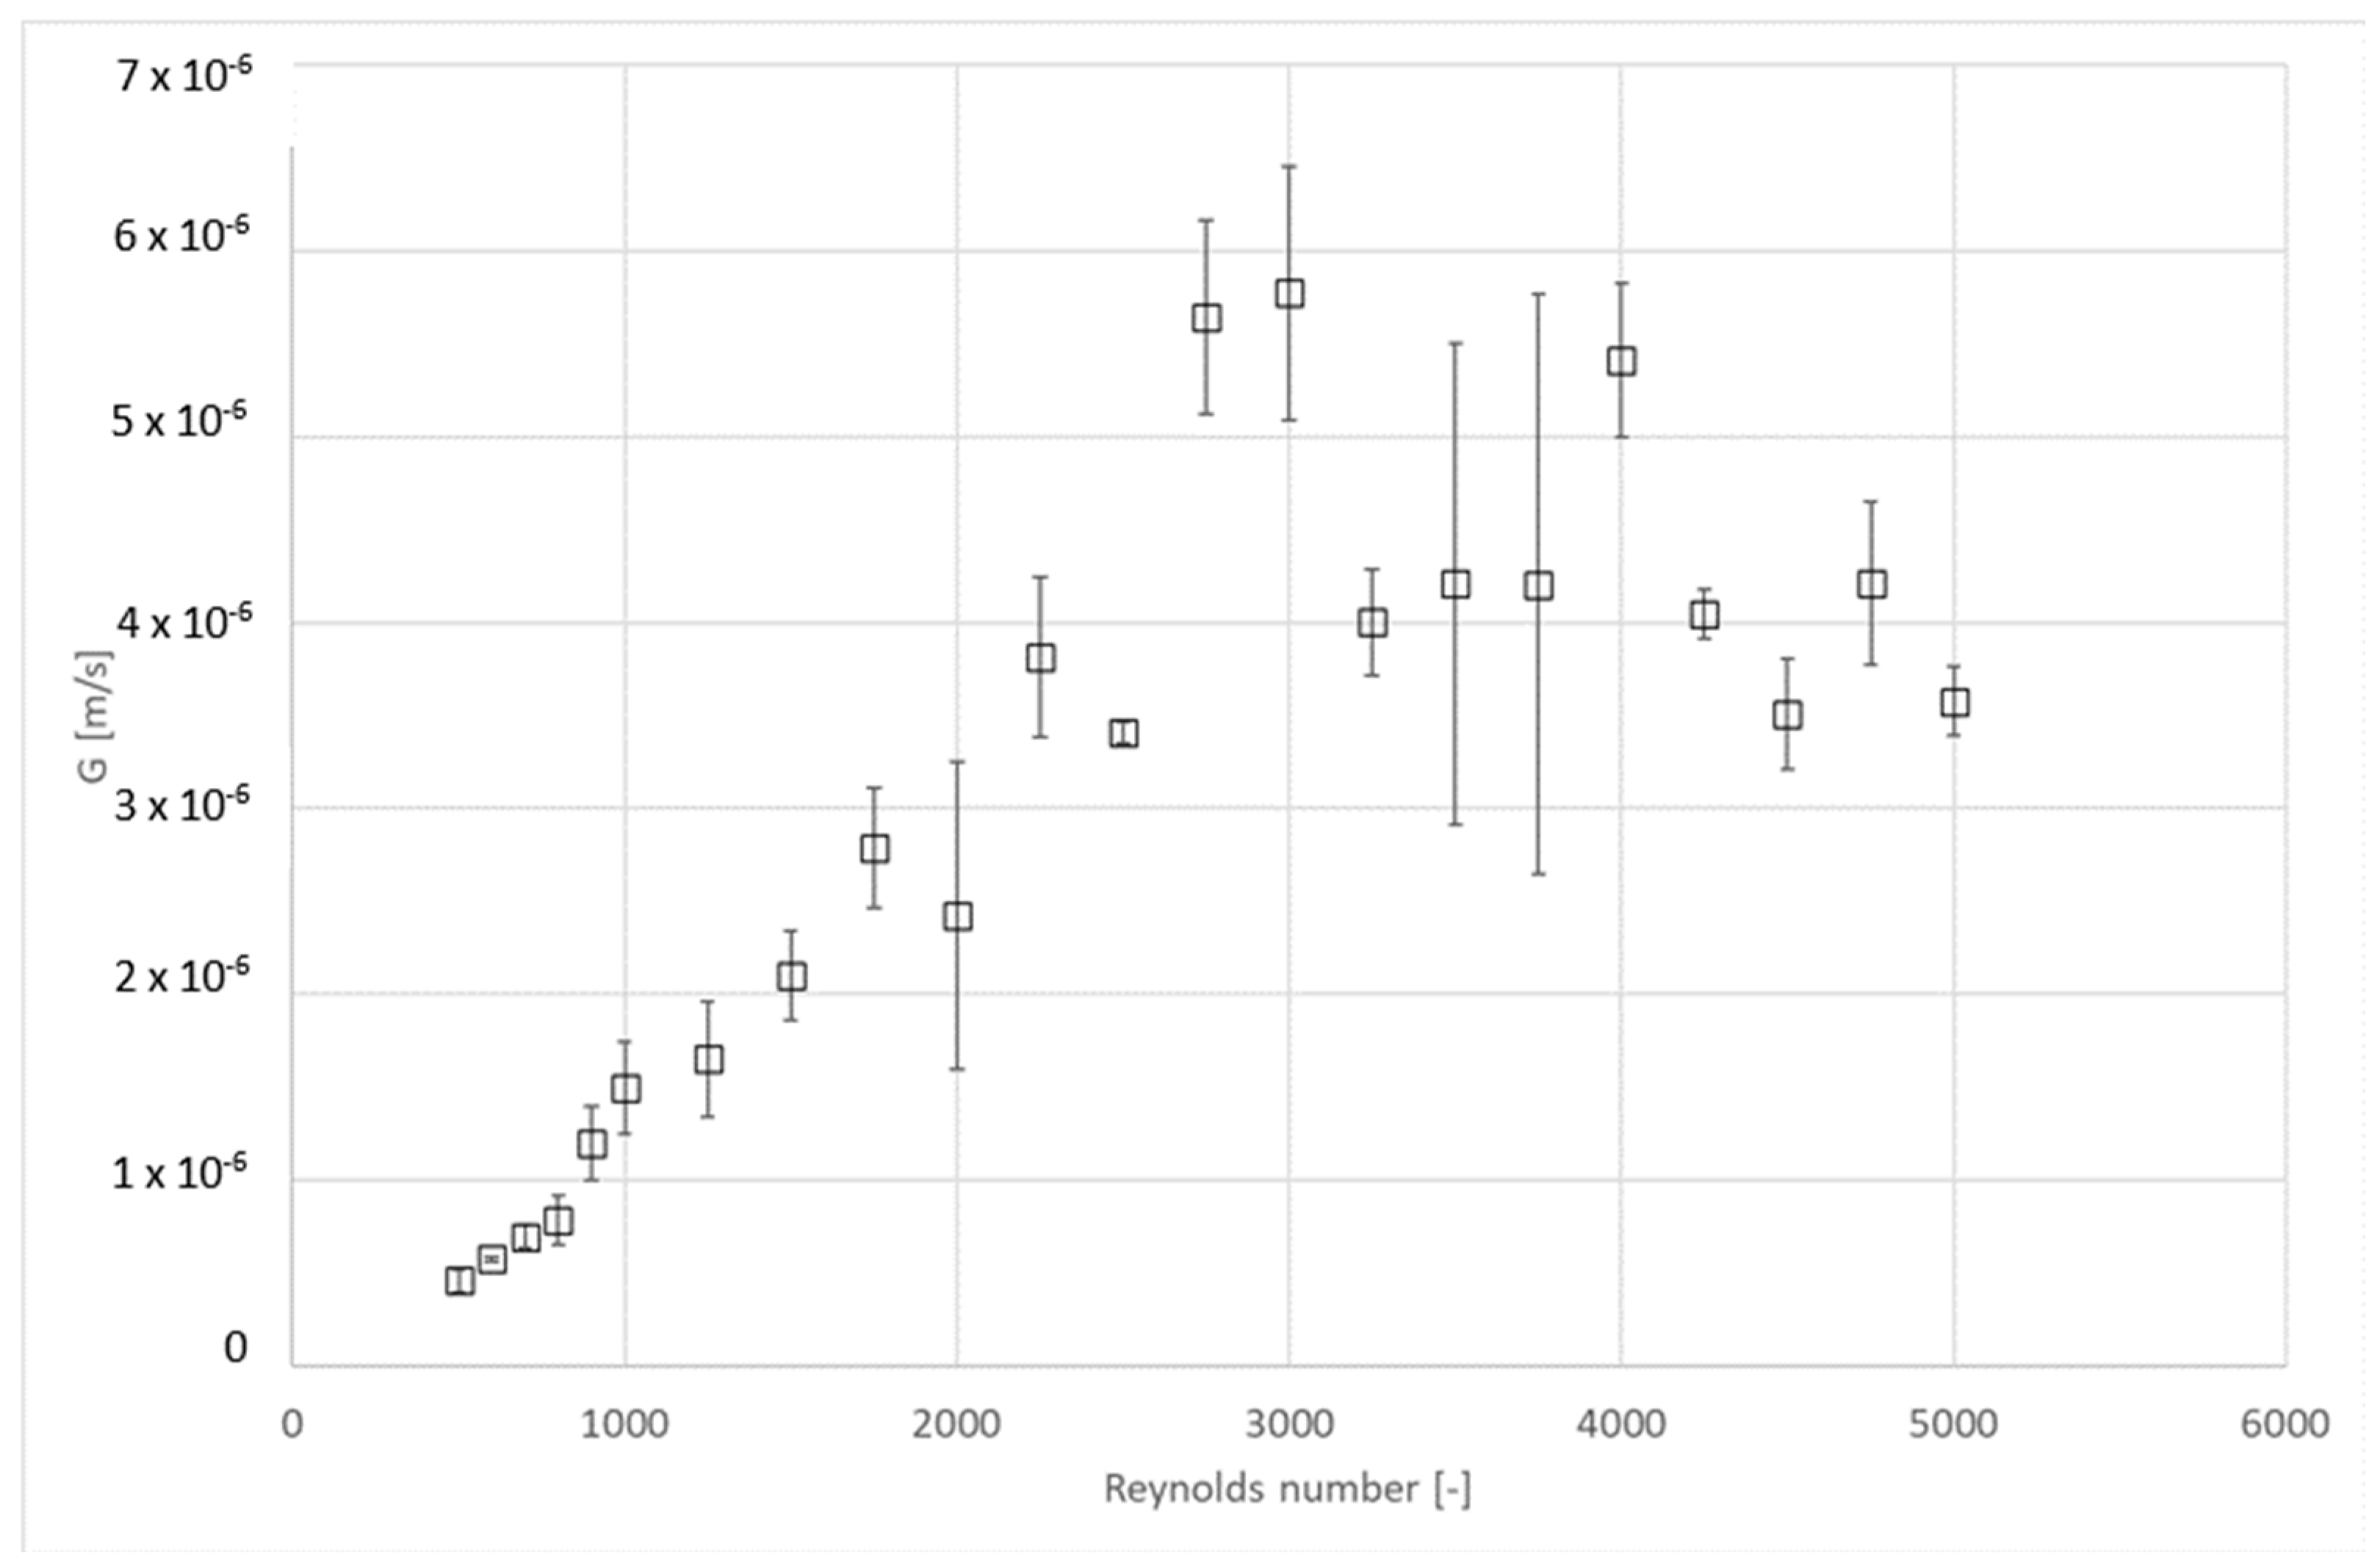
4.3. Influence of Hydrodynamic Conditions on Kinetics

In a multifunctional reactor, hydraulic conditions are represented by the Reynolds number. In this case, many authors [5,47] determined the limiting value of Re that separates laminar and turbulent flow as 1000. As investigated, Re range is from 500 to 5000, both laminar and turbulent regimes are investigated. Hydrodynamic conditions influence a variety of parameters important from the point of view of reaction kinetics.
The first important set of parameters depending on hydrodynamic conditions is micromixing, macromixing, and residence time presented in Figure 2. Residence time depends directly on the velocity of flow, which is confirmed by our results. The higher the Re is, the larger the flow velocity is and, in consequence, the shorter the residence time is. Residence time values varies from 2.75 s for Re = 500 to 0.29 s for Re = 5000. To assure good homogenization the macromixing time should be significantly lower than residence time. As one can notice from Figure 2, this is the case of our results. Values of macromixing time calculated using Equation (14) varies from 1.08 s for Re = 500 to 0.12 s for Re = 5000. The highest difference is for the lowest investigated Re, which was expected. On the other hand, the relation of micromixing time to induction time is a measure of the influence of micromixing on the nucleation phenomenon. If the tmic is larger than tind, then the micromixing affects primary nucleation to a large extent. In the opposite situation, one can assume the stable influence of micromixing on nucleation. In such cases the appearing changes in nucleation rate have different reasons. In our investigations micromixing time calculated according to Equation (15) varies from 0.16 s for Re = 500 to 0.006 s for Re = 5000. Induction time calculated with the use of Equation (13) is equal to 6.8 × 10⁻⁹ s, which is a much smaller value than the smallest one for micromixing time. The phenomenon of micromixing is thus irrelevant as the factor influencing primary nucleation rate.
In Figure 3 diameters d4,3 and d50 as a function of Reynolds number are presented. It can be noticed that in the laminar region of investigated velocities (Re = 500 ÷ 900) there is no visible trend in the described values. However, the values obtained appear to be a random oscillating around the value of 5.68 μm for d4,3 and 5.02 μm for d50. For the range of Re = 1000 ÷ 3000—i.e., the first part of turbulent flow regime—one can notice that the values for both mean diameters follow the trend of increasing their values with increasing the Reynolds number. This can be explained by better mixing and mass transfer present for such hydrodynamic conditions. Moreover, as further analysis of B and G suggests, the overall number of nuclei remains at the same level at each investigated Re but the linear growth rate increases, and thus the mean diameter also increases. The interesting situation can be observed for very high flow velocities (Re = 3000 ÷ 5000), where the decrease in values of both d4,3 and d50 occurs. A similar change in behavior can be observed for nucleation intensity and linear growth rate, which are also discussed.
The influence of hydrodynamic conditions on nucleation intensity is presented in Figure 4. For the lowest Reynolds numbers value of B is equal to 4.53 × 10¹⁰ (1/m3s) and there is no visible trend throughout the laminar range of flow (up to Re ≅ 1000). As the turbulent region begins (Re > 1000) the intensity of nucleation decreases with increasing flow rate, but the change is not very distinctive: from 5.29 × 10¹⁰ (1/m3s) to 3.82 × 10¹⁰ (1/m3s). Above Re = 3000 a rapid change in B value can be noticed. This change is also visible in the chart of mean diameters as a function of Re, presented in Figure 3. In this section of the diagram, the value of B is much higher than in the laminar and first part of investigated turbulent range. Simultaneously the scatter of results is visibly huge. Nevertheless, it stabilizes at the mean value of 1 × 10¹¹ (1/m3s). The observed behavior suggests that there is some specific value of Re above which B takes larger values. They are large enough to assure that at investigated supersaturation all substrates reacted to give nuclei and the growth phenomenon was small enough to be neglected.
The dependence of linear growth rate on fluid dynamic conditions is presented in Figure 5. In the laminar range, the values of G increased proportionally to the Reynolds number value. As the turbulent range began, the increase in G value continued up to the value of 5.72 × 10⁻⁶ (m/s) at Re = 3000. Then, the G took a lower value (4 × 10⁻⁶) (m/s) of stabilization. This is consistent with the observation of B and mean diameters. As the linear growth rate increases, the nucleation intensity decreases, and crystals are growing.
In Figure 3, Figure 4 and Figure 5 considering mean diameters, nucleation intensity and linear growth rate at Re = 3000, an abrupt change in behavior with increasing Reynolds number is observed. As there are no data on crystallization with reaction of barium sulfate in a reactor of Kenics geometry with such extensive number of calculations points, the conclusion can be made that at Re = 3000 there is a change in a flow pattern. This will influence the kinetics of crystallization and manifests itself in a way that can be noticed in Figure 3, Figure 4 and Figure 5. It can be assumed that there is a specific Re value for which the flow pattern will change. In general, it will still belong to the turbulent regime, but the geometry of inserts will influence flow pattern as it can be observed with flow patterns of various types of stirrers in tank reactors [49]. To confirm this hypothesis further investigations with various types of inserts will be conducted.
In Figure 6, the dependence of percentage of subgrain distribution (Q3) for chosen Re is presented. Presented curves are averaged for measurements at given value of Re. From this plot one can notice that the crystal size increases with Reynolds number up to the value of 2750 and then decreases. This confirms previously drawn conclusion that above this value the shear stresses in fluid are high enough to promote the destruction of crystals which in turns led to the secondary nucleation. In the laminar region (Re = 800 and Re = 1000 in Figure 6) the increase in subgrain distribution is small, despite the fact that mean diameter (Figure 3) varies by 3 μm. This points that in the laminar region the influence of hydrodynamic conditions is weak and despite the geometry of the reactor (mixing inserts) the mass transfer remains at almost the same level. However, in turbulent region the mass transfer is visibly enhanced up to the critical value where fluid dynamics starts to destroy the crystals.
The results from the crystal size distribution analysis and the MSMPR mathematical model calculations lead to a consistent description of the phenomena. Above the critical value of Reynolds number, the shear stresses generated within the reactor resulted in breakage of soft barium sulfate crystals. Since the linear growth rate remained at a constant level and the conversion reached 100% the secondary nucleation led to creation of small crystals. Moreover, the change of flow pattern can be assumed as the geometry of the reactor influences the changes in various presented parameters in the turbulent regime.

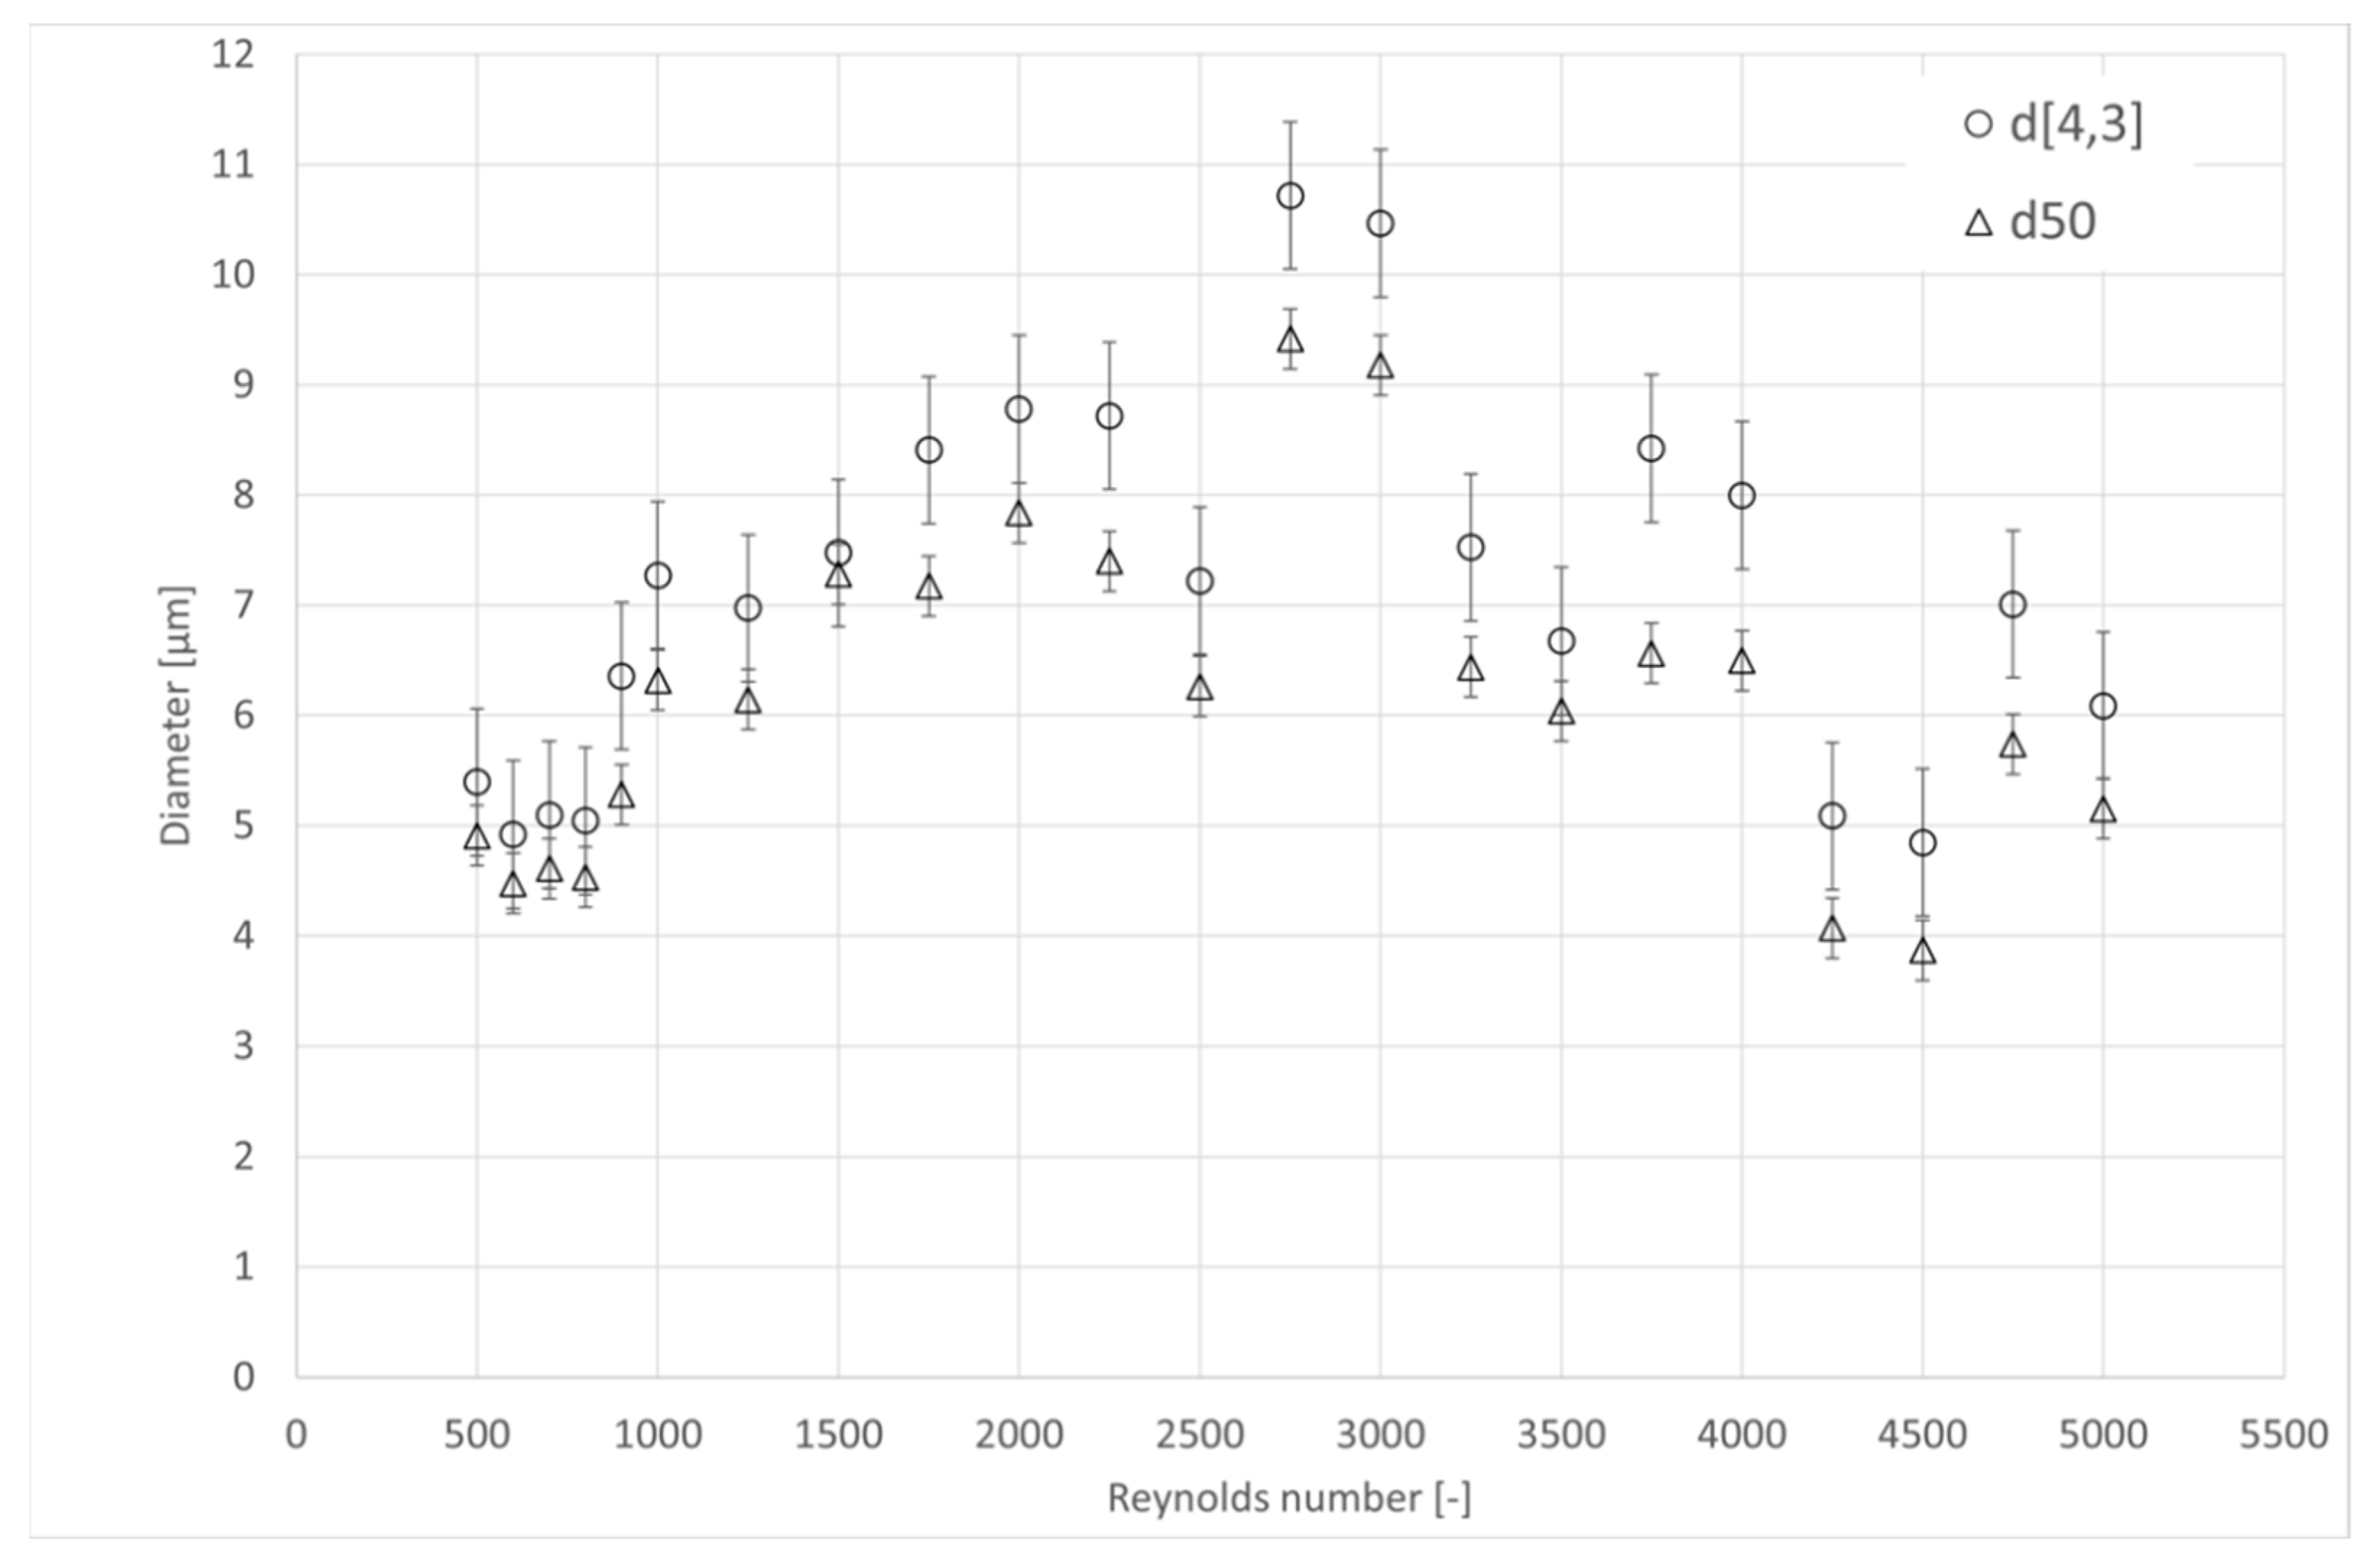
4.4. Microscope Analysis

In addition to the presented analysis and calculation, the microscopic images made using an optical microscope were also analyzed. From Figure 7, in which microscopic photographs taken at various Reynolds numbers are presented, one can notice a similar tendency to the observed in the case of previous data. Namely, the crystals are larger with increasing Re up to the critical value from which they start to decrease in size.

5. Conclusions

In this paper, the influence of hydrodynamic conditions on the precipitation of barium sulfate in a multifunctional reactor is presented. The conversion and efficiency are very high in the whole investigated a range of the Reynolds number: 92% and 94% respectively for Re = 500. Those values increase with increasing Re up to the point of Re = 2750, where both conversion and efficiency achieve the value of 100%. This suggests very good mixing conditions throughout the whole investigated the range of Re.
Good mixing conditions are also confirmed by the calculation of macromixing time. Its value is significantly lower than residence time, which is the condition to state a good homogenization. The geometrical configuration favors good mixing conditions.
The influence of fluid dynamic conditions on d4,3, d50, B, and G was investigated. In all those cases in the laminar region, no visible tendency was found. This suggests that there is no point in conducting the process within this region because there is no possibility of controlling the process. In the case of turbulent regimes, however, the interesting behavior of all the above mentioned parameters was observed. Namely, the existence of a specific, critical value of Re was noticed, above which, as we suppose, a rapid change of flow pattern takes place. This is caused by a geometrical configuration of the reactor’s inserts. In order to confirm this hypothesis, further analysis of the influence of the reactor’s geometry will be performed.

Author Contributions

Conceptualization, A.M.; methodology, A.M.; validation, A.M. and M.L.; investigation, A.M., T.W. and T.F.; resources, A.M.; writing—original draft preparation, A.M. and T.W.; writing—review and editing, A.M., T.W. and M.L.; visualization, A.M. and T.W.; supervision, A.M.; project administration, A.M.; funding acquisition, A.M. All authors have read and agreed to the published version of the manuscript.

Funding

This research was supported by the Polish National Science Centre (NCN) under Grant No. 2016/21/D/ST8/01714.

Institutional Review Board Statement

Not applicable.

Informed Consent Statement

Not applicable.

Data Availability Statement

Not applicable.

Conflicts of Interest

The authors declare no conflict of interest.

References

  1. Mullin, J.W. Crystallization, 4th ed.; Knovel; Butterworth Heinemann: Oxford, UK, 2001; ISBN 9780080530116. [Google Scholar]
  2. Kiss, N.; Brenn, G.; Pucher, H.; Wieser, J.; Scheler, S.; Jennewein, H.; Suzzi, D.; Khinast, J. Formation of O/W emulsions by static mixers for pharmaceuticalapplications. Chem. Eng. Sci. 2011, 66, 5084–5094. [Google Scholar] [CrossRef]
  3. Ghanem, A.; Lemenand, T.; Della Valle, D.; Peerhossaini, H. Static mixers: Mechanisms, applications, and characterization methods—A review. Chem. Eng. Res. Des. 2014, 92, 205–228. [Google Scholar] [CrossRef]
  4. Soman, S.S.; Madhuranthakam, C.M.R. Effects of internal geometry modifications on the dispersive anddistributive mixing in static mixers. Chem. Eng. Process. Intensif. 2017, 122, 31–43. [Google Scholar] [CrossRef]
  5. Thakur, R.K.; Vial, C.; Nigam, K.D.P.; Nauman, E.B.; Djelveh, G. Static Mixers in the Process Industries—A Review. Chem. Eng. Res. Des. 2003, 81, 787–826. [Google Scholar] [CrossRef]
  6. Laporte, M.; Loisel, C.; Della Valle, D.; Riaublanc, A.; Montillet, A. Flow process conditions to control the void fraction of food foams in static mixers. J. Food Eng. 2014, 128, 119–126. [Google Scholar] [CrossRef]
  7. Somnuk, K.; Prasit, T.; Prateepchaikul, G. Effects of mixing technologies on continuous methyl ester production: Comparison of using plug flow, static mixer, and ultrasound clamp. Energy Convers. Manag. 2017, 140, 91–97. [Google Scholar] [CrossRef]
  8. Walica, T.; Kotek, M.; Małysiak, A.; Lemanowicz, M. Static mixers as multifunctional reactors for wastewater treatment Autorzy: In Contemporary Problems of Power Engineering and Environmental Protection; Silesian University of Technology (PolSL): Gliwice, Poland, 2020; ISBN 9788395008795. [Google Scholar]
  9. Patnaik, P. Handbook of Inorganic Chemicals; McGraw-Hill Fandbooks, McGraw-Hill: New York, NY, USA, 2003; ISBN 9780070494398. [Google Scholar]
  10. Ekberg, O.; Bulow, M.; Ekman, S.; Hall, G.; Stading, M.; Wendin, K. Effect of barium sulfate contrast medium on rheology and sensory texture attributes in a model food. Acta Radiol. 2009, 50, 131–138. [Google Scholar] [CrossRef]
  11. Owen, M. Radiographic, Computed Tomography, and Magnetic Resonance Contrast Media. In Textbook of Veterinary Diagnostic Radiology, 7th ed.; Thrall, D.E., Ed.; W.B. Saunders Ltd.: Philadelphia, PA, USA, 2018; Chapter 6; pp. 96–109. ISBN 9780323482479. [Google Scholar]
  12. Litt, H.I.; Brody, A.S. BaSO4-Loaded Agarose: A Construction Material for Multimodality Imaging Phantoms. Acad. Radiol. 2001, 8, 377–383. [Google Scholar] [CrossRef]
  13. Liu, H.; Zhang, Z.; Gao, C.; Bai, Y.; Liu, B.; Wang, W.; Ma, Y.; Yang, H.; Li, Y. Enhancing effects of radiopaque agent BaSO4 on mechanical and biocompatibility properties of injectable calcium phosphate composite cement. Mater. Sci. Eng. C 2020, 116, 110904. [Google Scholar] [CrossRef] [PubMed]
  14. Knighton, N.; Bugbee, B. A Mixture of Barium Sulfate and White Paint Is a Low-Cost Substitute Reflectance Standard for Spectralon®; Utah State University: Logan, UT, USA, 2005. [Google Scholar]
  15. Li, X.; Peoples, J.; Yao, P.; Ruan, X. Ultrawhite BaSO4 Paints and Films for Remarkable Daytime Subambient Radiative Cooling. ACS Appl. Mater. Interfaces 2021, 13, 21733–21739. [Google Scholar] [CrossRef] [PubMed]
  16. Coelho, A.V.; de Souza, A.L.F.; de Lima, P.G.; Wardell, J.L.; Antunes, O.A.C. Stille cross-coupling reaction using Pd/BaSO4 as catalyst reservoir. Appl. Organomet. Chem. 2008, 22, 39–42. [Google Scholar] [CrossRef]
  17. Neff, J.M. Estimation of bioavailability of metals from drilling mud barite. Integr. Environ. Assess. Manag. 2008, 4, 184–193. [Google Scholar] [CrossRef] [PubMed]
  18. Gao, H.-W.; Lin, J.; Li, W.-Y.; Hu, Z.-J.; Zhang, Y.-L. Formation of shaped barium sulfate-dye hybrids: Waste dye utilization for eco-friendly treatment of wastewater. Environ. Sci. Pollut. Res. Int. 2010, 17, 78–83. [Google Scholar] [CrossRef]
  19. Kohandel, F.; Sararoudi, S.S.; Barangi, L. Rheological and mechanical properties of highly filled polyolefin based on PP/barium sulfate. AIP Conf. Proc. 2016, 1713, 120011. [Google Scholar] [CrossRef] [Green Version]
  20. Aninwene, G.E., II; Webster, T.J. Nano-BaSO4: A Novel Bacteriostatic Polymer Additive. In Proceedings of the 2013 39th Annual Northeast Bioengineering Conference, Syracuse, NY, USA, 5–7 April 2013; pp. 141–142. [Google Scholar]
  21. Tichapondwa, S.M.; Focke, W.W.; del Fabbro, O.; Gisby, J.; Kelly, C. A Comparative Study of Si-BaSO4 and Si-CaSO4 Pyrotechnic Time-Delay Compositions. J. Energ. Mater. 2016, 34, 342–356. [Google Scholar] [CrossRef] [Green Version]
  22. Mikhailov, M.; Neshchimenko, V.; Yuryev, S.; Grigorevsky, A.; Lovitskiy, A.; Vashchenkov, I. On the Radiation Stability of BaSO4 Pigment Modified with SiO2 Nanoparticles and Applied for Spacecraft Thermal Control Coatings. Defect Diffus. Forum 2018, 386, 277–282. [Google Scholar] [CrossRef]
  23. Mikhailov, M.M.; Yuryev, S.A.; Lapin, A.N. Prospects for applying BaSO4 powders as pigments for spacecraft thermal control coatings. Acta Astronaut. 2019, 165, 191–194. [Google Scholar] [CrossRef]
  24. Parvulescu, A.; De Vos, D.; Jacobs, P. Efficient dynamic kinetic resolution of secondary amines with Pd on alkaline earth salts and a lipase. Chem. Commun. 2005, 42, 5307–5309. [Google Scholar] [CrossRef]
  25. Andrade, L.H.; Silva, A.V.; Pedrozo, E.C. First dynamic kinetic resolution of selenium-containing chiral amines catalyzed by palladium (Pd/BaSO4) and Candida antartica lipase (CAL-B). Tetrahedron Lett. 2009, 50, 4331–4334. [Google Scholar] [CrossRef]
  26. Parvulescu, A.N.; Jacobs, P.A.; De Vos, D.E. Palladium Catalysts on Alkaline-Earth Supports for Racemization and Dynamic Kinetic Resolution of Benzylic Amines. Chem. A Eur. J. 2007, 13, 2034–2043. [Google Scholar] [CrossRef]
  27. Piotrowski, K.; Koralewska, J.; Wierzbowska, B.; Matynia, A. Kinetics of the continuous reaction crystallization of barium sulphate in BaCl2-(NH4)2 SO4-NaCl-H2O system—Neural network model. Pol. J. Chem. Technol. 2009, 11, 13–19. [Google Scholar] [CrossRef] [Green Version]
  28. Berenjian, A.; Ghasemi, M.R.; Zarghi, A. Preparation of Barium Sulfate Nanoparticles Using Semi-Batch Precipitation. Asian J. Chem. 2011, 23, 491–494. [Google Scholar]
  29. Fischer, R.B.; Rhinehammer, R.B. Rapid Precipitation of Barium Sulfate. Anal. Chem. 1953, 25, 1544–1548. [Google Scholar] [CrossRef]
  30. Wojtas, K.; Makowski, Ł.; Orciuch, W. Barium sulfate precipitation in jet reactors: Large eddy simulations, kinetics study and design considerations. Chem. Eng. Res. Des. 2020, 158, 64–76. [Google Scholar] [CrossRef]
  31. Ronquim, F.M.; Cotrim, M.E.B.; Guilhen, S.N.; Bernardo, A.; Seckler, M.M. Improved barium removal and supersaturation depletion in wastewater by precipitation with excess sulfate. J. Water Process Eng. 2018, 23, 265–276. [Google Scholar] [CrossRef]
  32. Kieffer, R.; Mangin, D.; Puel, F.; Charcosset, C. Precipitation of barium sulphate in a hollow fiber membrane contactor: Part II The influence of process parameters. Chem. Eng. Sci. 2009, 64, 1885–1891. [Google Scholar] [CrossRef]
  33. Symeopoulos, B.D.; Koutsoukos, P.G. Spontaneous precipitation of barium sulfate in aqueous solution. J. Chem. Soc. Faraday Trans. 1992, 88, 3063–3066. [Google Scholar] [CrossRef]
  34. Cafiero, L.M.; Baffi, G.; Chianese, A.; Jachuck, R.J.J. Process Intensification:  Precipitation of Barium Sulfate Using a Spinning Disk Reactor. Ind. Eng. Chem. Res. 2002, 41, 5240–5246. [Google Scholar] [CrossRef]
  35. McCarthy, E.D.; Dunk, W.A.E.; Boodhoo, K.V.K. Application of an intensified narrow channel reactor to the aqueous phase precipitation of barium sulphate. J. Colloid Interface Sci. 2007, 305, 72–87. [Google Scholar] [CrossRef] [Green Version]
  36. Rehage, H.; Kind, M. The first Damköhler number and its importance for characterizing the influence of mixing on competitive chemical reactions. Chem. Eng. Sci. 2021, 229, 116007. [Google Scholar] [CrossRef]
  37. Anabaraonye, B.U.; Bentzon, J.R.; Khaliqdad, I.; Feilberg, K.L.; Andersen, S.I.; Walther, J.H. The influence of turbulent transport in reactive processes: A combined numerical and experimental investigation in a Taylor-Couette reactor. Chem. Eng. J. 2021, 421, 129591. [Google Scholar] [CrossRef]
  38. Judat, B.; Racina, A.; Kind, M. Macro- and Micromixing in a Taylor-Couette Reactor with Axial Flow and Their Influence on the Precipitation of Barium Sulfate. Chem. Eng. Technol. 2004, 27, 287–292. [Google Scholar] [CrossRef]
  39. Judat, B.; Kind, M. Morphology and internal structure of barium sulfate-derivation of a new growth mechanism. J. Colloid Interface Sci. 2004, 269, 341–353. [Google Scholar] [CrossRef] [PubMed]
  40. Løge, I.A.; Bentzon, J.R.; Klingaa, C.G.; Walther, J.H.; Anabaraonye, B.U.; Fosbøl, P.L. Scale attachment and detachment: The role of hydrodynamics and surface morphology. Chem. Eng. J. 2022, 430, 132583. [Google Scholar] [CrossRef]
  41. Besenhard, M.O.; Hohl, R.; Hodzic, A.; Eder, R.J.P.; Khinast, J.G. Modeling a seeded continuous crystallizer for the production of active pharmaceutical ingredients. Cryst. Res. Technol. 2014, 49, 92–108. [Google Scholar] [CrossRef]
  42. Alvarez, A.J.; Myerson, A.S. Continuous Plug Flow Crystallization of Pharmaceutical Compounds. Cryst. Growth Des. 2010, 10, 2219–2228. [Google Scholar] [CrossRef]
  43. Synowiec, P.M. Krystalizacja Przemysłowa z Roztworu; WNT: Warsaw, Poland, 2008. [Google Scholar]
  44. Synowiec, P.M.; Stec, M. Analysis of CaF2 Precipitation Process in the Selected Static Mixers. J. Chem. 2019, 2019, 6728492. [Google Scholar] [CrossRef] [Green Version]
  45. Ropp, R.C. Group 16 (O, S, Se, Te) Alkaline Earth Compounds. In Encyclopedia of the Alkaline Earth Compounds; Ropp, R.C., Ed.; Elsevier: Amsterdam, The Netherlands, 2013; Chapter 3; pp. 105–197. ISBN 9780444595508. [Google Scholar]
  46. Mersmann, A.; Braun, B.; Löffelmann, M. Prediction of crystallization coefficients of the population balance. Chem. Eng. Sci. 2002, 57, 4267–4275. [Google Scholar] [CrossRef]
  47. Stec, M.; Synowiec, P.M. Study of fluid dynamic conditions in the selected static mixers part II-determination of the residence time distribution. Can. J. Chem. Eng. 2017, 95, 2410–2422. [Google Scholar] [CrossRef]
  48. Ulrich, J. The Crystallization Technology Handbook, 2nd ed.; Marsmann, A., Ed.; Marcel Dekker: New York, NY, USA, 2001; ISBN 0824705289. Cryst. Growth Des.2001, 1, 421. [Google Scholar] [CrossRef]
  49. Bates, R.L.; Fondy, P.L.; Corpstein, R.R. Examination of Some Geometric Parameters of Impeller Power. Ind. Eng. Chem. Process Des. Dev. 1963, 2, 310–314. [Google Scholar] [CrossRef]
Figure 1. Laboratory installation: 1—tank with barium chloride solution; 2—tank with sodium sulfate solution; 3—peristaltic pump; 4—check valve; 5—multifunctional reactor (static mixer Kenics); 6—valve.
Processes 10 00146 g001
Figure 2. Distribution of micromixing, macromixing and residence time in a function of Reynolds Number (Re).
Processes 10 00146 g002
Figure 3. Diameter d4,3 and d50 as a function of Re.
Processes 10 00146 g003
Figure 4. Intensity of nucleation as a function of Re.
Processes 10 00146 g004
Figure 5. Linear growth rate as function of Re.
Processes 10 00146 g005
Figure 6. Percentage of subgrain distribution for Re = 800, Re = 1000, Re = 2750 and Re = 4500.
Processes 10 00146 g006
Figure 7. Microscopic photographs of crystals for various Re: (a) Re = 800, (b) Re = 1000, (c) Re = 2750, (d) Re = 4500 (red circles mark broken crystals).
Processes 10 00146 g007
Table 1. Parameters of multifunctional reactor—static mixer Kenics.
ParameterSymbolValue
Number of mixing elements 6
Inner diameter d 0.0136   m
Device length L 0.0165   m
Device volume V 14.5   mL
Material PVC
Table 2. Relative supersaturation calculation results.
ParameterSymbolUnitValue
Ionic activity in solution I P ( mol dm 3 ) 3 4.68 × 10⁻⁶
Activity coefficient of Ba2+ γ B a 2 + 0.53
Activity coefficient of SO42− γ S O 4 2 0.53
Ionic strength I ( mol dm 3 ) 0.0245
Relative supersaturation σ 205
Table 3. Efficiency and conversion degree.
ReEfficiency (%)Conversion Degree (%)
5009194
60091.894.4
70092.495
80093.195.6
90093.996
100094.896.4
125095.297
150095.597
17509697.6
200096.898
225097.898.5
25009999.4
2750100100
3000100100
3250100100
3500100100
3750100100
4000100100
4250100100
4500100100
Publisher’s Note: MDPI stays neutral with regard to jurisdictional claims in published maps and institutional affiliations.

