Article

A Sustainable Process to Produce Manganese and Its Alloys through Hydrogen and Aluminothermic Reduction

Department of Materials Science and Engineering, Norwegian University of Science and Technology (NTNU), Alfred Getz Vei 2, NO-7491 Trondheim, Norway
Processes 2022, 10(1), 27; https://doi.org/10.3390/pr10010027
Submission received: 6 December 2021 / Revised: 15 December 2021 / Accepted: 21 December 2021 / Published: 24 December 2021

Abstract

:
Hydrogen and aluminum were used to produce manganese, aluminum–manganese (AlMn) and ferromanganese (FeMn) alloys through experimental work, and mass and energy balances. Oxide pellets were made from Mn oxide and CaO powder, followed by pre-reduction by hydrogen. The reduced MnO pellets were then smelted and reduced at elevated temperatures through CaO flux and Al reductant addition, yielding metallic Mn. Changing the amount of the added Al for the aluminothermic reduction, with or without iron addition led to the production of Mn metal, AlMn alloy and FeMn alloy. Mass and energy balances were carried out for three scenarios to produce these metal products with feasible material flows. An integrated process with three main steps is introduced; a pre-reduction unit to pre-reduce Mn ore, a smelting-aluminothermic reduction unit to produce metals from the pre-reduced ore, and a gas treatment unit to do heat recovery and hydrogen looping from the pre-reduction process gas. It is shown that the process is sustainable regarding the valorization of industrial waste and the energy consumptions for Mn and its alloys production via this process are lower than current commercial processes. Ferromanganese production by this process will prevent the emission of about 1.5 t CO2/t metal.

Graphical Abstract

1. Introduction

Manganese is little known to the public but is a very important metal to modern society. It is the fifth most used metal in terms of tonnage, being ranked behind iron, aluminum, copper, and magnesium. About 21.7 and 20.3 million tons of Mn ore being mined in 2019 and 2020, respectively [1]. Manganese has numerous applications that impact on our daily lives as consumers, whether it is of objects made of steel, batteries, aluminum beverage cans, etc. Manganese has played a key role in the development of various steelmaking processes and its continuing importance is indicated by the fact that about 90% of all manganese consumed annually goes into steelmaking. The massive production of manganese is via the carbothermic reduction of Mn ores in submerged arc furnace (SAF), which yields Mn ferroalloys such as high-carbon ferromanganese (HCFeMn) and silicomanganese (SiMn) [2]. About 3.7 Mt of HCFeMn, and about 16 Mt of SiMn were produced in 2020, respectively. Refined ferromanganese production from HCFeMn in the form of medium-carbon ferromanganese (MCFeMn) and low-carbon ferromanganese (LCFeMn) was about 1.2 Mt in 2020. Manganese metal production was about 1.4 Mt in 2020. The production of HCFeMn through a carbothermic process in SAF is accompanied with significant CO2 emission and 1–1.4 tCO2/t metal. On the other hand, SAF process is an energy intensive process, and 2000–3000 kWh energy is utilized per ton metal as presented previously [3]. Therefore, the development of new sustainable Mn production processes is important to reduce the greenhouse gases in the future.
Instead of carbothermic SAF process, the production of Mn and its alloys from Mn ores or secondary Mn sources is possible via a few approaches. It was shown previously that using methane instead of solid carbon via a potential technology is accompanied with less energy consumption and less CO2 emission, while it is also possible to produce valuable by-products [3]. The idea of using methane was based on the fact that the reduction of Mn oxides (MnO2, Mn2O3, Mn3O4) to MnO is possible by CO and H2 gases, while further MnO reduction to metallic Mn is not possible by these gases and carbon supply from methane is needed to reduce MnO [3,4]. It is worth mentioning that in SAF, MnO reduction occurred by C in a coke bed area and the generated CO reduces the higher Mn oxides in the furnace burden to MnO. The only alternative approach to reduced MnO via a complete C-free process is the metallothermic reduction of MnO. It was previously indicated that the aluminothermic reduction of MnO from MnO-containing slags is possible using metallic Al and Al dross materials [5]. Both methane-based process, and aluminothermic-based process are advantageous compared to the HCFeMn production in SAF. In addition to significantly less CO2 emission, Mn loss to slag by-product is lower in these processes.
The present work is based on the idea of using hydrogen to reduce Mn oxides to MnO in a pre-reduction step in which the chemical reactions (1) to (3) occur. Then, the aluminothermic reduction of the pre-reduced ore (or MnO-containing material) is done to produce Mn metal, aluminum-manganese alloys (AlMn) and ferromanganese alloys. The main chemical reaction (4) is occurred in this step.
2MnO2 + H2 (g) = Mn2O3 + H2O (g)         ΔH (25 °C) = −163.7 kJ/mol
3Mn2O3 + H2 (g) = 2 Mn3O4 + H2O (g)       ΔH (25 °C) = −135.1 kJ/mol
Mn3O4 + H2 (g) = 3 MnO + H2O (g)           ΔH (25 °C) = −16.6 kJ/mol
3MnO + 2Al = 3Mn + Al2O3                  ΔH (25°C) = −520 kJ/mol
The reduction of Mn ores/oxides has been studied in literature through several studies. In a pioneer work, Barner and Mantell studied the reduction of pellets of MnO2 by H2 gas at 275–400 °C and produced MnO [6]. De Bruijn et al. studied the reduction of Mn ore fine particles (MnO2, Mn2O3, Mn3O4) by hydrogen at 275–400 °C and observed the stepwise reduction of MnO2, Mn2O3 to Mn3O4 and complete reduction to MnO [7] Experimental studies on MnO2 particles reduction at higher temperatures of 400–1000 °C yielded also MnO formation by high rate [8,9]. The reduction of MnFe2O4 by hydrogen at 257–767 °C has shown that the product is a mixture of MnO and metallic Fe. Hydrogen reduction of low-grade Mn briquets by H2 at 750 to 950 °C indicated the production to MnO phases [10,11]. Hence, reactions (1) to (3) proceed in a wide temperature range and complete reduction to MnO is possible. Literature studies about chemical reaction (4) are limited as reviewed previously [5]. The research about the interaction of Al with MnO2 in a thermite-like process has shown that the aluminothermic reduction reactions start from above 550 °C to about 900 °C [12,13]. The aluminothermic reduction of Mn oxide particles by Al powder with the addition of lime and fluorspar was studied by Bhoi et al. at 650 C and 950 C, and they produced ferromanganese samples with 70–80 wt.% Mn and 12–16 wt.% Fe [14]. In the previous research, [5] the aluminothermic reduction of MnO-containing slags by Al metal and Al dross was studied and it was shown that AlMn alloys can be produced.
An overall schematic of the applied innovative process is shown in Figure 1. A typical case that the pre-reduction is done in a shaft furnace/reactor is shown; however, it can be done in any type of direct reduction reactor such as rotary furnace, fluid bed reactor, plasma furnace, etc. The smelting-reduction of the pre-reduced Mn ore can be done in an electric arc furnace (EAF) as shown schematically in Figure 1, or other furnace types such as induction furnace, ladle furnace, etc. In this step, a flux-aided smelting occurs, while an Al source (scrap, dross, etc.) is added to reduced MnO. As hydrogen and Al are used for manganese or its alloys production, for simplicity this process is called hereinafter HAlMan process. The importance of applying a pre-reduction step to MnO using H2 gas and then reduction of MnO to Mn by Al compared with a single aluminothermic reduction from higher Mn oxides to Mn is that the need for Al use is minimized. For instance, for pyrolusite (MnO2) reduction the total mass of required Al is half when pre-reduction to MnO is done. In this paper, experimental results for the proof-of-concept are presented. Moreover, the process evaluation regarding mass and energy balances is done to produce Mn, AlMn and FeMn alloys via designed potential integrated processes by the author. As these products are produced via a sustainable approach, for simplicity and not confusing with the well-known metals mentioned above they are called hereinafter Green-Mn, Green-AlMn and Green-FeMn alloys, respectively. Currently, Mn and FeMn alloys are well-known in the market, however, there is no massive production of high Mn-containing Al alloys in the market and HAlMan process introduces such type of alloy that can be utilized in aluminum industry to produce many Mn-containing commercial alloys. Green AlMn alloy may be a better feedstock candidate for the Al industry than Mn metal or LCFeMn.

2. Materials and Methods

The application of hydrogen gas for the pre-reduction of manganese oxides to MnO and further smelting-aluminothermic reduction was carried out to verify the process as described in the following.

2.1. Materials

Pure Mn oxide in the form of Mn3O4 and calcium oxide (CaO) were used. The Mn oxide powder had about 1 wt% SiO2, 0.9 wt% FeO, 0.3 wt% CaO and 0.6 wt% MgO as the main impurities. The two powders were mixed to gain 5 wt% CaO in the mixture. Green pellets were produced in a lab scale disc pelletizer via the addition of water. The produced green pellets were sized to the range of 3–15 mm and then dried in an oven at 80 °C overnight. The dried pellets were then heated and sintered in a muffle furnace in air in which the heating rate was 25 °C/min and the holding time at the target temperature of 1250 °C was 2 h, followed by slow cooling of the pellets in the furnace to the room temperature. It was observed that the color of the pellets was changed from brown to black in sintering as seen in Figure 2. This indicates the conversion of Mn3O4 to Mn2O3. The total mass changes observed revealed that it is due to the Mn2O3 formation, considering mass gain via oxidation and structural water removal from Ca(OH)2 that is formed through a pelletizing step. The sintered pellets were strong, a little clustering was observed, and the clusters were easily broken by hand.

2.2. Pre-Reduction by Hydrogen

The pre-reduction of sintered oxide pellets was done in a vertical tube resistance furnace in which the sample (about 800 g) was hold in an alumina crucible. The furnace was first evacuated and then cleaned under high purity Ar flow, followed by heating to the target temperature of 1000 ± 10 °C. Hydrogen was introduced to the sample with a flow of 4 slpm (standard liter per minute). Hydrogen purged to the bottom of sample bed and moved upwards through the sample and left the chamber to the gas outlet. The reduction was done for two hours, and about four times of the stoichiometric hydrogen that is needed to convert Mn2O3 to MnO was introduced to the sample. The reduced sample was cooled down to the room temperature under Ar flow. The mass changes evaluation indicated about 8.9% mass lost that is close to the maximum theoretical mass loss of 9.6% for complete reduction to MnO. The color of pre-reduced pellets became completely green as seen in Figure 2c. It is worth to note that the green color was also observed in the whole cross section of the individual pellets, indicating proper reduction extent to MnO.

2.3. Smelting-Aluminothermic Reduction

The pre-reduced pellets were first crushed and milled to fine powder in a steel ball mill. About 100 g of the powder was then mixed with the CaO powder for each experiment. The required CaO in the mixture was calculated considering the mass of Al2O3 that is formed via chemical reaction (4) so that the CaO/Al2O3 mass ratio be about 1 in slag product. The required mass of metallic Al (99.9% purity) was calculated to be 0.8 and 1.2 of the Al required for the total MnO reduction from the mixture, they are called hereinafter Test 1 and Test 2, respectively. In an additional Test 3, metallic iron was added into the mixture and its mass was 20% of the Mn mass in the pre-reduced pellets to yield Green-FeMn, while other conditions were as Test 1. The MnO + CaO mixtures and Al chunks (5–15 mm) were heated up and smelted in alumina crucibles (that were put in graphite holders) under continuous Ar flow in an induction furnace. When the mixture was semi-molten as observed from the furnace window, the aluminothermic reduction reactions were initiated and the chemical reaction (4) occurred in the crucible with a significantly high rate. A thermocouple type C (protected by an alumina insulating tube) measured the temperature changes as illustrated in Figure 3. It was found that temperature is increased with a slow rate, the rate increases a bit slower within 1270–1530 °C and may be due to the fusion or partial smelting of the oxide mixture as Al was melted at temperatures below 700 °C. It is worth mentioning that not significant difference in the heating profile was observed for Tests 2 and 3 compared to Test 1.
The rapid temperature rises from about 1570 °C to 1970 °C is due to the significant heat generation via the highly exothermic reaction (4), indicating very high reaction rate. The maximum measured temperature for Tests 2 and 3 were about 1990 °C and 1950 °C, respectively. The power was turned off when temperature dropped rapidly down to about 1600 °C as not more reduction reactions expected to occur. The obtained slag was fully molten over a molten metal phase after the experiments.

2.4. Mass and Energy Balance

The mass and energy balances calculations were done using HSC Chemistry software, version 9. For the calculations, the unit mass of the metal product was considered as reference, and correspondingly the masses for the material flows in the HAlMan process were calculated and energy balance calculations were carried out. The results are given and discussed in Section 4

3. Experimental Results

The produced metal and slag samples in the smelting-aluminothermic reduction trials were separated easily as the metal was mostly in a large piece under the slag phase and with no significant sticking into the crucible and the slag. The collected metal and slag phases were characterized by Scanning Electron Microscope (SEM) equipped by Energy Dispersive Spectrometer (EDS). Figure 4a shows a typical SEM image from the produced slag in Test 1 (secondary electron image) with the X-Ray mapping of Mn, Al and Ca in the images (b), (c) and (d) for the shown rectangle in image (a). As we see, the formed slag contains Al, Ca and Mn as the main elements (plus oxygen). Obviously, the amount of Mn is less than Al and Ca and is distributed in the brighter phase in the grey matrix. Moreover, although most produced metal (Mn) has been separated, the slag has still some tiny metallic particles, which are mostly smaller than 50 microns. A few surface holes are the removed metal particles from the surface in the SEM sample preparation. The existence of minor small metal particles (not complete separation) may be related to the short duration of the experiments at high temperatures after the Mn metal formation, about 20 min as observed in Figure 3.
The measured overall chemical compositions of the slags and metal products are summarized in Table 1. It is worth mentioning that the presented composition are the averages of more than six large areas that were normalized based on the measured compositions of the elements. For the oxides, the more stable form of the oxides was considered in conversion from elemental compositions.
The presented results in Table 1 show that in Test 1 metallic Mn has been produced, Fe and Si impurities in the metal are from the utilized Mn oxide powder that was impure. However, the other impurities of the Mn oxide powder (Ca and Mg) were mostly distributed into the slag phase (Figure 4). The results of Test 2 indicate that the produced metal contains some Al and minor elements of Fe, Si and Ca. The existence of Al in this metallic product is due to the use of more Al than the stoichiometric of chemical reaction (4) as planned to make AlMn alloy, while the existence of small amount of Ca is attributed to the reduction of small amount of CaO by Al in the system due to the high chemical activity of CaO in the slag and low chemical activity of Ca in the metal phase as described previously [5]. Compared to Test 1, more SiO2 has been reduced in Test 2 as more Al has been used. The produced metal in Test 3 has higher concentration of Fe compared to the metal of Test 1 under the same conditions with Fe addition. The chemical composition of the Green FeMn in Test 3 is like low carbon ferromanganese (LC FeMn), however, with no carbon impurity.
The produced slags in all experiments are calcium aluminate slags. The MnO content in slags 1 and 3 is about 20% as the added Al to the system was lower than the stoichiometric of reaction (4). This lower Al addition prevents the complete reduction of MnO from the slag and the partial reduction of the more stable oxides of CaO, SiO2 and MgO. Moreover, under this condition the added Al metal has been completely oxidized and transferred into the slag phase. The produced CaO-MnO-Al2O3 and CaO-Al2O3 slags have a relatively low melting point, and hence they are completely molten after the aluminothermic reduction. FactSage calculations indicated a melting point of 1260 °C for slags 1 and 3, and 1350 °C for slag 2. Hence, the process can be run at temperatures slightly below or the same as the applied temperature in SAF for HCFeMn production.

4. Discussion

The above results indicated that the HAlMan process is feasible to produce Green Mn, AlMn and FeMn alloys from primary raw materials. It is evaluated in more details as follows.

4.1. Material Flow and Process Thermochemistry

4.1.1. Production of Green Mn and Green AlMn Alloys

Figure 5a shows material flow and process steps to produce Green Mn metal from Mn oxide as experimentally carried out in Section 2 via pelletizing, pre-reduction by H2 and smelting-reduction by Al in Test 1. Mn oxides of MnO2, Mn2O3, Mn3O4 or their mixtures can be utilized and agglomeration can be done by CaO addition as the binder. In principle, other types of binders such as Ca(OH)2, dolomite and even bentonite can be used for agglomeration. The agglomeration can be via pelletizing (as tested above), briquetting, granulation, and so forth and it is beneficial if the hydrogen reduction reactor is a shaft furnace or rotary furnace. Lime addition can be partially in the agglomeration step (in up to a few mass percentages), and mainly later in the smelting-reduction step. It is worth noting that high CaO addition (or any other binder) in the agglomeration step may negatively affect the reducibility of agglomerate through the evolution of complex Mn-containing oxide phases with lower reducibility compared to MnO2, Mn2O3, and Mn3O4 [15,16]. The process thermochemistry must be fixed to obtain target metal and calcium–aluminate slag compositions with proper melting point and viscosity. In general, higher MnO in the slag is accompanied with higher Mn metal purity when metal is separated from the slag at molten state. When AlMn alloy is produced, the Al content of the produced metal depends on the added Al into the aluminothermic step and as observed above the Ca impurity may be higher when Al content in the produced alloy is higher as also observed previously. In practice, the process shown in Figure 4 can be run as a continuous process with high Mn yield such as 95% and above to produce both Mn metal and Mn-Al alloys. The illustrated material flow in Figure 5b is for the case that the agglomeration is not carried out. For instance, if the pre-reduction of Mn oxides to MnO is occurred in a fluid bed reactor or rotary furnace, agglomeration is not needed. Therefore, all the required lime is added in the smelting/reduction reactor.
The used H2 for the process can be produced by different techniques such as electrolysis, methane pyrolysis, etc. Obviously in a large perspective, the processes with no CO2 emission for H2 production are more sustainable to use. The Al source for the process can be primary Al that is produced by the commercial Hall-Heroult process, Al scrap from the Al production plant, Al scrap from other industries, etc. Alternative source of Al can be Al dross (white or black) and the dross types that have Mn are more favorable. Obviously, the Al supply for the process requires precautions regarding the introduction of impurities to the final products.

4.1.2. Production of Green FeMn

A schematic of the material flow and the process steps for the Green FeMn production is given in Figure 6. Compared to the feed material to produce Green Mn or AlMn alloys that more pure Mn oxides can be used, the raw materials to produce Green FeMn can be Mn ores, iron ore, their concentrates and also iron scrap. Test 3 above was via the shown flowsheet in Figure 6a. Currently, high grade Mn ores are used to produce HCFeMn in SAF, and these types of ores always have some iron oxides. Concentrates of Mn ores can be future raw materials as many low-grade ores can be dressed to increase Mn content. As Mn oxides are reduced to MnO via the chemical reactions (1) to (3) in the pre-reduction step, the iron oxides in the Mn lump ore or concentrates are simultaneously reduced to metallic iron, these types of ores have always some iron oxides [4]. Any needed additional iron is then added into the smelting-reduction furnace to produce Green FeMn. This iron can be in the form of direct reduced iron (DRI), iron scrap, pig iron, grey cast iron, etc. In another approach (Figure 6b) the required iron is supplied through charging iron ore, its concentrate or agglomerate into the pre-reduction reactor. In this case, the Mn and Fe sources can be mixed and charged into the pre-reduction reactor, or their concentrate mixtures undergo an agglomeration step, or separate agglomeration steps and then mixed. Obviously, agglomeration step is not necessary if high grade Mn and Fe lump ores are used.

4.2. Mass and Energy Balances

Mass and energy balances for the different scenarios of HAlMan process are presented and discussed as follows.

4.2.1. Green Mn Metal Production

Mass and energy balances were carried out by HSC Chemistry software to produce one metric ton Mn metal as the reference. For simplicity and considering a real-life scenario it was assumed that the process has three steps: pre-reduction of Mn2O3 to MnO in a pre-reduction reactor (PRR), the reduction of MnO by Al and flux use is a smelting-reduction furnace (SRF), and a heat recovery unit for the pre-heating of utilized hydrogen. For the heat recovery unit, it is assumed in this section that the PRR process gas is burned by air. The case to produce Mn metal via the illustrated flowsheet in Figure 5b is considered, and in principle it may not be significantly different with the scenario illustrate in Figure 5a as the agglomeration is not an energy intensive step. In the direct reduction processes of iron ores, a hot reducing gas is introduced into a reactor and the solid material charge exchanges heat with the gas, and some heat is generated/consumed via the chemical reactions. Therefore, to do a reasonable energy balance it is assumed here that a hot hydrogen gas at 700 °C is introduced into the PRR and a cold charge of Mn2O3 is heated and reduced to hot MnO with 600 °C temperature (Figure 7). It is assumed that the PRR process gas leaves the reactor at 400 °C and it is further burned by air, while the partial heat recovery is done to pre-heat hydrogen from the room temperature to 700 °C. Figure 7 shows the calculated mass and energy balances for the three steps of the process and as observed the process does not need any power supply from theoretical point of view. In practice, however, the smelting-reduction furnace may need some power, if it is not well automated and does not work continuously.
The mass and energy balances for the process steps in Figure 7 were to produce 1000 kg Mn metal assuming 98% Mn recovery. This is a fair approximation as some Mn is lost via fine/dust formation or not proper metal and slag separation in tapping. Figure 7 shows that the mass of utilized Al is about 33% of the mass of the produced Mn metal and obviously the process is economical if any kind of Al source (primary, scrap or dross) is utilized. If Al dross is used, the mass of lime in the smelting-reduction furnace will be slightly higher and the slag chemistry must be fixed.

4.2.2. Green AlMn Alloys Production

The energy consumption of HAlMAn process for AlMn alloys production is different compared to when Mn metal is produced, considering a unit mass of the metal product. When Al content of the metal product is increased the introduced Al into the smelting-reduction step is increased compared to Mn metal production as illustrated in Figure 8 for Mn−10 wt% Al alloy production. The energy consumption for this step is obviously higher compared to Mn metal production, although less MnO and CaO are charged to the SRF. This is due to the less exothermic reactions in the system (less MnO introduction) in this step and hence less heat generation through the exothermic reaction (4). It is worth to note that the production of AlMn alloys has a high yield for MnO reduction and for the energy consumption calculations in Figure 8 a complete Mn recovery was considered as been observed experimentally above, and in the previous study [5].
To obtain a proper overview about the effect of metal product composition on the energy consumption of the SRF, energy balances were carried out and the results are given in Figure 9. This figure shows that the energy consumption in SRF is increased with increasing the Al content of the metal product and for the Al contents more than 22% the process enthalpy change is positive. Therefore, SRF requires power consumption for high Al-containing alloys. Figure 9 shows that the masses of both MnO and Al reactants in reaction (4) are decreased per unit mass of the metal product and therefore less heat is generated via this reaction. The role of the lower heat generation in aluminothermic reduction is easily evaluated considering the lower slag formation for higher Al-containing metal products. As seen the decrease of slag mass does not have specific effect on the energy consumption.
The energy consumptions for the PRR and heat recovery unit for the production of AlMn alloys is less than those for the production of Mn metal as observed in Figure 7 and Figure 8. Obviously, the heat generation via chemical reactions (1) to (3) in PRR is decreased with increasing the Al content of the final AlMn alloy product due to the lower mass of Mn oxide charge. Energy balance calculations indicated that the enthalpy change for the PRR is −26, −25 and −22 kWh/kg metal for the alloys with 10%, 20% and 30% Al, respectively. These indicate that PRR does not need any external heat supply even for the case of production of high Al-containing alloys.

4.2.3. Green FeMn Production

Mass and energy balances to produce one-ton green FeMn were carried out, considering the above mentioned three steps of HAlMan process. For the calculations, it was assumed that the product is a FeMn with 80 wt% Mn and 20 wt% Fe, which is a close composition to refined FeMn (LCFeMn). Figure 10 shows the results for the case with no agglomeration unit and the iron addition is via its charge to SRF (Figure 6a). Like Mn and AlMn production, the presented results in Figure 10 show that the process steps have no theoretical power consumptions, and the exothermic reactions are providing the required energy to heat and melt the materials.
The comparison of green FeMn production with green AlMn production shows that the heat generation in the SRF (−68 kWh/kg metal in Figure 10) is higher than that to produce Mn−20%Al, which is 13 kWh/kg metal (Figure 9). As the mass of the slag for both alloys production is the same (960 kg), the difference is related to heat consumed for the heating and melting of Al and Fe, which is 107 and 52 kWh for 200 kg of Al and Fe, respectively. The enthalpy changes in the PRR for Mn−20%Fe production is the same as that for Mn−20%Al alloy, since the same mass of MnO is reduced by hot hydrogen. However, different enthalpy change in PRR is expected if the iron for the process is supplied via iron ore charge use. To evaluate this case, energy balance for PRR for the scenario shown in Figure 6b via the charge of hematite (Fe2O3) into the reactor was performed. As Fe2O3 is reduced to Fe in PRR via endothermic reduction reactions, an enthalpy change of −22 kWh/kg FeMn was obtained as shown in Figure 11. However, this enthalpy change is accompanied with a lower temperature for the process gas (200 °C), as it was assumed that the PRR process gas has the same composition as the scenario shown in Figure 10. This lower temperature for the process gas is not a problem to preheat high amount of hydrogen gas and as seen there is still high enthalpy change (−128 kWh/kg FeMn), assuming 40% heat recovery.
The above mass and energy balances show that the presented HAlMan process for the production of Green Mn, AlMn and FeMn metals via different scenarios are not energy intensive.

4.3. Process Sustainability

The sustainability of the HAlMan process is evaluated regarding materials and by-products, energy consumption, CO2 emission as follows.

4.3.1. Materials and By-Products

The HAlMan process is quite flexible regarding the raw materials consumption, and as mentioned, a variety of manganese and iron ores or their concentrates can be used. Recently, it was shown that the aluminothermic reduction of HCFeMn slag can be done to produce AlMn alloys [5]. Hence, in one approach, the slag by-product from the ferromanganese production plants that has usually above 20 wt% MnO can be added directly into the SRF. The valorization of HCFeMn slag is a sustainable approach, as it reduces the Mn oxide charge to the PRR, and the lime flux use in SRF. Mn ores and HCFeMn slags contain usually other components such as CaO, Al2O3, SiO2, and MgO. The partial reduction of SiO2 occurs in SRF and the metal product may contain levels of Si as observed in Tests 1–3. The more stable oxides of CaO, Al2O3 and MgO end up in the slag phase and yield calcium–aluminate slag that contain small amount of MgO, SiO2, etc. If the process chemistry is controlled well, the produced slag mostly consists of 12CaO.7Al2O3, 5CaO.3Al2O3, CaO.Al2O3, and 3CaO.Al2O3 and they can be utilized for alumina extraction, as has been studied [17,18]. The production of metallurgical grade alumina from the main slag by-product is very advantageous, as it provides a feedstock for the Al production. It is emphasized here that the production of alumina from the calcium–aluminate slag is quite sustainable with no waste generation and CO2 emission. On the other hand, calcium–aluminate slags are consumable and can be used in secondary steelmaking or in cement industry. The lime flux for SRF can be supplied in a sustainable approach as the separated fine particles from the product of limestone calcination processes.

4.3.2. Hydrogen Looping

The cleaning of PRR process gas, hydrogen separation and recycling to the PRR is important from economics and sustainable point of views. In Section 3 and Section 4, a scenario was considered for all the illustrated processes in which the H2-H2O process gas mixture that leaves the PRR was burned by air and a part of the thermal heat was recovered, about 40%. In a more advanced approach, the hot PRR process gas can be used to heat hydrogen to the required temperature for the reactor, and in addition a portion of hydrogen of the gas is recycled. Hence, it is important to determine the amount of hydrogen that can be looped via a feasible approach as illustrated in Figure 12 for the case of Mn metal production. In this case, the process gas of the PRR is first used to pre-heat hydrogen to about 340 °C via using heat exchangers. Then, this gas is dehumidified, yielding a H2- rich gas and water. A large portion of separated H2 gas can be added into the fresh H2 gas for the PRR process and the rest is enough to further heat up the PRR feed gas to 700 °C, using hot air. The heat recovery in this step can be via burning hydrogen and applying heat exchanges. The mass and energy balance calculations revealed that the target feed gas temperature is possible to obtain considering 40% heat recovery for this step. Figure 12 indicates that the process off-gas consists of N2 and H2O gases and it is possible to produced N2 gas via using a dehumidifier, if it is of interest. If oxygen is used in the heat recovery unit instead of air, the process off-gas will be obviously only be water vapor. Considering H2 looping and the illustrated mass balances in Figure 12, the total H2 gas use to produce Mn metal is about 11.3 kmol/kg Mn.
Mass and energy balances to include hydrogen looping to produce Green AlMn and FeMn alloys were carried out like the calculations for the Mn metal production. Table 2 gives the obtained results and provides an overview about the H2 use and looping to produce different metal products.
The data in Table 2 show that about 78% of the hydrogen that leaves the PRR can be separated and looped and added to the introduced hydrogen to the process. Compared to the scenarios illustrated in Section 4 (Figure 7, Figure 8, Figure 9, Figure 10 and Figure 11), the net hydrogen that is introduced per unit mass of the metal product is lower when hydrogen looping is applied, while the total that is introduced into the PRR reactor is the same. For all the metals production processes, about 40% of the hydrogen that is fed into the PRR is the recovered hydrogen from the PRR process gas and it shows the importance of hydrogen looping. If the second step of H2 gas heating to 700 °C is done via another approach, the use of a portion of recovered hydrogen for this step is not needed and hence more hydrogen (to about 50%) can be looped.

4.3.3. Energy Consumption

It was observed above that the PRR and its process gas treatment unit do not need energy supply. It is worth to note that currently huge direct reduction reactors are run to produce DRI without any energy consumption in the reactor, and hence the PRR in HAlMan process can be run with negligible energy consumption. It was indicated above that the SRF does not need energy supply from theoretical point of view and the generated heat via reaction (4) is sufficient for heating the materials to 1400–1500 °C. In practice, however, industrial furnaces have significant heat losses via different mechanisms. Moreover, smelting-reduction process must be run under controlled and stable conditions and keeping the furnace temperature in an optimum range is important. Assuming here that the generated heat by the aluminothermic reduction reaction is 50% or 100% lost in the process, the power consumption for a smooth process can be estimated regarding the extra energy that is needed to heat up the charge to the process temperature of 1400 °C. The energy consumptions therefore were calculated for the two scenarios in which 50% and 100% of the released heat from the reaction (4) are lost. Hence, the illustrated energy consumptions for heating up the materials to the reaction temperature to produce Mn, AlMn and FeMn alloys were calculated as presented in Figure 13.
To evaluate the HAlMAn process, it is important to determine the energy consumption for hydrogen production. In the process, almost pure hydrogen gas can be utilized, and this hydrogen is currently produced by electrolysis technique commercially. The energy consumption to produce hydrogen is in the range of 39–65 kWh/kg H2, depending on the technology and there is currently significant research on developing less energy intensive hydrogen production processes [19,20]. Assuming the energy consumption of 39.4 kWh/kg H2, [19] and the data in Table 2, the energy consumptions to produce hydrogen and correspondingly different metal products were calculated, and the results are shown in Figure 13. For all the metal products, the energy consumptions for the smelting-reduction step are close, and hence the overall difference is related to the energy that is used for hydrogen production. For instance, the energy consumption is the highest when FeMn is produced via the use of iron oxide in the charge of the PRR, and this is obvious as more hydrogen is needed compared to the other metal products according to Table 2. To evaluate the obtained energy consumption values, theoretical and industrial energy consumptions for HCFeMn production from high grade Mn ores in SAF [3,21] are also given in Figure 13. It is observed that the production of Green FeMn via HAlMan process is advantageous than the current SAF technology considering both theoretical and industrial cases. On the other hand, in HAlMAn process a C-free FeMn product is produced that is comparable to LCFeMn. As the conversion of HCFeMn to MCFeMn, LCFeMn requires energy consumption (for instance for oxygen production and use), the energy consumptions for making these refined alloys are more than HCFeMn cases shown in Figure 13. It is worth to note that about 10–15% Mn loss happens in the conversion of HCFeMn to LCFeMn in the manganese oxygen refining (MOR) process, and consequently the energy consumptions to produce LCFeMn is 10–15% higher than that for HCFeMn.

4.3.4. CO2 Emission

The CO2 emission for the HAlMan process is negligible, as there is no CO2 formation in the main process steps. In a larger perspective, if the power for the SRF is supplied from renewable energies such as wind and solar, the CO2 emission is insignificant, including the power production. It must be mentioned that no CO2 emission is considered to produce Al that is used in the process as Al scrap/dross are the main Al sources and there is insignificant CO2 emission for their collection and transport. However, if the process is applied to produce highly pure Mn metal and there is need for primary Al or high purity Al use, the CO2 emissions to produce Al is necessary to consider and Life Cycle Assessment (LCA) analysis must be done. Another important case that may affect the overall CO2 emission is the agglomeration step (Figure 5a and Figure 6). If the agglomeration step is not a high temperature process or if hydrogen is used as a fuel for sintering the agglomerates, the CO2 emission is negligible. However, if fossil fuels are used in agglomeration, they can contribute to some CO2 emission. Overall, the CO2 emission in the introduced process depends on a variety of parameters and is insignificant compared to the Mn metal and alloys production via the current commercial technologies. For instance, for the Green FeMn production there is no CO2 emission (using secondary Al sources and renewable energy), while for HCFeMn production using renewable energy 1–1.4 t CO2/t metal is produced [3]. The production of refined FeMn requires the removal of carbon (in the form of CO2) from HCFeMn via carbon oxidation by oxygen purging in MOR process [22,23]. Considering almost complete C removal from HCFeMn and 10% Mn loss in MOR process, the CO2 emission related to the production of LCFeMn is in the range of 1.3–1.7 t CO2/t metal. Therefore, the application of the introduced process instead of the commercial refined FeMn production process is quite sustainable with preventing the emission of about 1.5 t CO2/t metal. Considering the production of HCFeMn and refined FeMn alloys in 2020 by the current commercial processes (see Section 1), it will be possible to eliminate at least 6.24 Mt CO2 annually if the HAlMAn process is applied to produce Green FeMn.

5. Conclusions

A sustainable integrated process (HAlMan process) to produce Mn metal and its alloys was presented based on experimental work, and it was evaluated by mass and energy balance calculations. The main conclusions can be summarized as:
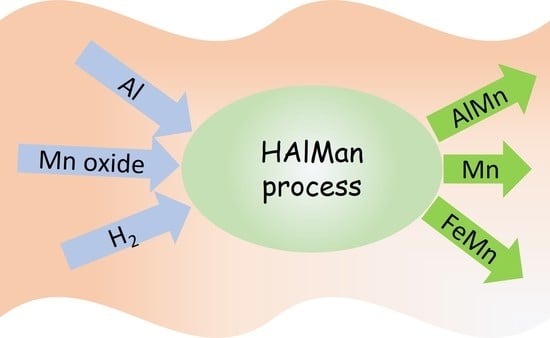
  • The HAlMan process is flexible and can be implemented to produce Mn metal, a variety of AlMn alloys with different Al contents, and carbon-free FeMn alloys.
  • The HAlMan process has three main steps for the pre-reduction of Mn ore/oxides to MnO, smelting-aluminothermic reduction of the pre-reduced ore, and a gas treatment unit to do hydrogen looping and hydrogen heating for the pre-reduction reactor.
  • The process is quite flexible to use different raw materials such as manganese and iron ores, iron scrap, Al scrap, Al dross, HCFeMn slag, etc.
  • Hydrogen recovery from the pre-reduction reactor process gas is very important and about 78% of the hydrogen in this gas can be looped and it can supply 40–50% of the reactor feed gas.
  • Total energy consumption in the HAlMan process is low; below 1500 kWh/t Mn metal, and below 1400 kWh/t AlMn alloys. Energy consumption is decreased with increasing Al content of the alloy.
  • Energy consumption to produce Green FeMn is in the range 1000–1700 kWh/t, depending on iron source, which is significantly lower than current commercial processes for FeMn alloys production.
  • CO2 emission from the HAlMan process is insignificant; Green FeMn production by this process instead of the current commercial technologies will prevent the emission of about 1.5 t CO2/t FeMn.

Funding

This research received no external funding.

Institutional Review Board Statement

Not applicable.

Informed Consent Statement

Not applicable.

Data Availability Statement

Not applicable.

Conflicts of Interest

The author declares no conflict of interest.

References

  1. International Manganese Institute. IMNI Statistics Report 2020. Available online: https://www.manganese.org/ (accessed on 10 November 2021).
  2. Olsen, S.E.; Tangstad, M.; Lindstad, T. Production of Manganese Ferroalloys; Tapir Academic Press: Trondheim, Norway, 2007. [Google Scholar]
  3. Safarian, J. Duplex Process to Produce Ferromanganese and Direct Reduced Iron by Natural Gas. ACS Sustain. Chem. Eng. 2021, 9, 5010–5026. [Google Scholar] [CrossRef]
  4. Cheraghi, A.; Yoozbashizadeh, H.; Safarian, J. Gaseous Reduction of Manganese Ores: A Review and Theoretical Insight. Miner. Process. Extr. Met. Rev. 2020, 41, 198–215. [Google Scholar] [CrossRef]
  5. Kudyba, A.; Aktar, S.; Johansen, I.; Safarian, J. Aluminothermic Reduction of Manganese Oxide from Selected MnO-Containing Slags. Materials 2021, 14, 356. [Google Scholar] [CrossRef] [PubMed]
  6. Barner, H.E.; Mantell, C.L. Kinetics of Hydrogen Reduction of Manganese Dioxide. Ind. Eng. Chem. Process. Des. Dev. 1968, 7, 285–294. [Google Scholar] [CrossRef]
  7. De Bruijn, T.; Soerawidjaja, T.; De Jongt, W.; Van Den Berg, P. Modelling of the reduction of manganese oxides with hydrogen. Chem. Eng. Sci. 1980, 35, 1591–1599. [Google Scholar] [CrossRef]
  8. Zaki, M.; Hasan, M.; Pasupulety, L.; Kumari, K. Thermochemistry of manganese oxides in reactive gas atmospheres: Probing redox compositions in the decomposition course MnO2 → MnO. Thermochim. Acta 1997, 303, 171–181. [Google Scholar] [CrossRef]
  9. Terayama, K.; Shimazaki, T. Effect of hydrogen on the reduction kinetics of manganese oxide at high temperatures by new EGA method. Netsu Sokutei 2000, 27, 13–18. [Google Scholar]
  10. El-Gawad, H.H.A.; Ahmed, M.; El-Hussiny, N.; Shalabi, M. Reduction of low grade Egyptian manganese ore via hydrogen at 800 C–950 C. Open Access Libr. J. 2014, 1, e427. [Google Scholar] [CrossRef]
  11. El-Hussiny, N.; El-Gawad, H.H.A.; Mohamed, F.; Shalabi, M. Pelletization and reduction of Egyptian low grade manganese ore pellets via hydrogen at 750–950 °C. Int. J. Sci. Eng. Res. 2015, 6, 339–346. [Google Scholar]
  12. Jiaxing, S.; Tao, G.; Wen, D.; Yiming, M.; Xiang, F.; Hao, W. Study on Thermal Chemical Reaction of Al/MnO2 Thermite. IOP Conf. Ser. Earth Environ. Sci. 2018, 186, 012046. [Google Scholar] [CrossRef] [Green Version]
  13. Sarangi, B.; Ray, H.S. Kinetics of Aluminothermic Reduction of MnO2 and Fe2O3: A Thermoanalytical Investigation. ISIJ Int. 1996, 36, 1135–1141. [Google Scholar] [CrossRef]
  14. Bhoi, B.; Murthy, B.V.R.; Datta, P.; Jouhari, A.K. Studies on Aluminothermic Reduction of Manganese ore for Ferro-Manganese Making. In Ferro Alloy Industries in the Liberalised Economy; Vatsh, A.K., Singh, S.D., Gas, N.G., Ramachandrarao, P., Eds.; NML: Jainshedpur, India, 1997; pp. 66–70. [Google Scholar]
  15. Sorensen, B.; Gaal, S.; Ringdalen, E.; Tangstad, M.; Kononov, R.; Ostrovski, O. Phase compositions of manganese ores and their change in the process of calcination. Int. J. Miner. Process. 2010, 94, 101–110. [Google Scholar] [CrossRef]
  16. Cheraghi, A.; Becker, H.; Eftekhari, H.; Yoozbashizadeh, H.; Safarian, J. Characterization and calcination behavior of a low-grade manganese ore. Mater. Today Commun. 2020, 25, 101382. [Google Scholar] [CrossRef]
  17. Azof, F.I.; Safarian, J. Leaching kinetics and mechanism of slag produced from smelting-reduction of bauxite for alumina recovery. Hydrometall. 2020, 195, 105388. [Google Scholar] [CrossRef]
  18. Azof, F.I.; Yang, Y.; Panias, D.; Kolbeinsen, L.; Safarian, J. Leaching characteristics and mechanism of the synthetic calcium-aluminate slags for alumina recovery. Hydrometallurgy 2019, 185, 273–290. [Google Scholar] [CrossRef]
  19. Bertuccioli, L.; Chan, A.; Hart, D.; Lehner, F.; Madden, B.; Standen, E. Study on Development of Water Electrolysis in the EU, E4tech Sàrl with Element Energy Ltd., for the Fuel Cells and Hydrogen Joint Undertaking. 2014. Available online: https://www.scirp.org/(S(i43dyn45teexjx455qlt3d2q))/reference/referencespapers.aspx?referenceid=2141466 (accessed on 15 November 2021).
  20. Stafekk, I.; Scammen, D.; Abad, A.V.; Balcombe, P.; Dodds, P.E.; Ekins, P.; Shah, N.; Ward, K.R. The role of hydrogen and fuel cells in the globalenergy system. Energy Environ. Sci. 2019, 12, 463–491. [Google Scholar]
  21. Ahmed, A.; Haifa, H.; El-Fawakhry, M.K.; El-Faramawy, H.; Eissa, M. Parameters Affecting Energy Consumption for Producing High Carbon Ferromanganese in a Closed Submerged Arc Furnace. J. Iron Steel Res. Int. 2014, 21, 666–672. [Google Scholar] [CrossRef]
  22. Lee, Y.E.; Kolbeinsen, L. Kinetics of oxygen rfining process for ferromanganese alloys. ISIJ Int. 2005, 45, 1282–1290. [Google Scholar] [CrossRef] [Green Version]
  23. You, B.-D.; Lee, B.-W.; Pak, J.-J. Manganese loss during the oxygen refining of high-carbon ferromanganese melts. Met. Mater. 1999, 5, 497–502. [Google Scholar] [CrossRef]
Figure 1. Schematic of the HAlMan process for sustainable production of metals using hydrogen and Al sources.
Processes 10 00027 g001
Figure 2. Dried Mn oxide pellets (a), sintered Mn Oxide pellets (b), and pellets reduced by hydrogen (c).
Processes 10 00027 g002
Figure 3. Typical temperature changes in the smelting-aluminothermic reduction of MnO + CaO mixture with Al metal.
Processes 10 00027 g003
Figure 4. Secondary electron image from the slag (a), and the X-Ray mapping of Mn (b), Al (c), and Ca (d) in the selected area in image (a).
Processes 10 00027 g004
Figure 5. Material flow to produce Green Mn and AlMn alloys via HAlMan process; (a) with agglomeration step, and (b) without agglomeration step.
Processes 10 00027 g005
Figure 6. Material flow sketch to produce Green FeMn via the use of iron (a) or iron ore/concentrate (b).
Processes 10 00027 g006
Figure 7. Mass and energy balances for the different units of HAlMan process for Mn metal production.
Processes 10 00027 g007
Figure 8. Mass and energy balances for the different units of HAlMan process for Mn−10%Al production.
Processes 10 00027 g008
Figure 9. Masses of reduced MnO in PRR, produced slag in SRF, and consumed Al in SRF, and the energy consumption of SRF.
Processes 10 00027 g009
Figure 10. Mass and energy balances for the different units of HAlMan process for Green FeMn production via process illustrated in Figure 6a.
Processes 10 00027 g010
Figure 11. Mass and energy balances for the different units of HAlMan process for Green FeMn production via process illustrated in Figure 6a.
Processes 10 00027 g011
Figure 12. Material flow between units for treating PRR process gas with heat recovery to heat H2 feed gas including H2 looping (Case: Mn metal production).
Processes 10 00027 g012
Figure 13. Energy consumption to produce metals by HAlMan process for the case of 50% (a) and 100% (b) loss of the released heat from the aluminothermic reduction, and comparison with SAF for HCFeMn production.
Processes 10 00027 g013
Table 1. The average compositions of metal and slag products in tests 1–3 (in wt%).
Metal
Component:MnAlFeSiCaMg
Test 198.6-1.20.2-0.01
Test 292.16.00.90.60.5-
Test 379.0-20.70.3--
Slag
Component:MnOAl2O3FeOSiO2CaOMgO
Test 120.338.9-0.939.20.7
Test 20.0249.2-0.549.50.5
Test 320.138.50.030.840.00.6
Table 2. The amount of H2 that is used, looped, or burned in the HalMan process (kmol/kg metal).
Metal ProductH2 Reactor Feed GasH2 LoopedH2 Burned for Heat RecoveryNet H2 Input of HAlMan Process
Mn metal18.57.3211.2
Mn−10%Al16.46.41.810
Mn−20%Al14.65.71.68.9
Mn−30%Al12.75.01.47.7
Mn−20%Fe, iron scrap use14.65.71.68.9
Mn−20%Fe, Fe2O3 use25.39.92.815.4
Publisher’s Note: MDPI stays neutral with regard to jurisdictional claims in published maps and institutional affiliations.

