Article

RUL Prediction of Switched Mode Power Supply Using a Kalman Filter Assisted Deep Neural Network

Department of Mechanical Engineering, Kumoh National Institute of Technology, Gumi-si 39177, Korea
*
Author to whom correspondence should be addressed.
Processes 2022, 10(1), 55; https://doi.org/10.3390/pr10010055
Submission received: 29 November 2021 / Revised: 20 December 2021 / Accepted: 22 December 2021 / Published: 28 December 2021

Abstract

:
Switched-mode power supply (SMPS) has been of vital importance majorly in power management of industrial equipment with much-improved efficiency and reliability. Given the diverse range on loading and operating conditions of SMPS, several anomalies can occur in the device resulting to over-voltage, overloading, erratic atmospheric conditions, etc. Electrical over-stress (EOS) is one of the commonly used causes of failure among power electronic devices. Since there is a limitation for the SMPS in terms of input voltage and current (two methods of controlling an SMPS), the device has been subjected to an accelerated aging test using EOS. This study presents a two-fold approach to evaluate the overall state of health of SMPS using an integration of extended Kalman filter (EKF) and deep neural network. Firstly, the EKF algorithm would assist in fusing fault features to acquire an comprehensive degradation trend. Secondly, the degradation pattern of the SMPS has been monitored for four different electrical loadings, and a bi-directional long short-term memory (BiLSTM) deep neural network is trained for future predictions. The proposed model provides a unique approach and accuracy in SMPS fault indication with the aid of electrical parameters.

1. Introduction

Prognostics and health management (PHM) is the assessment that facilitates condition-based maintenance (CBM) by predicting future operating conditions based on a component’s historical data. The concept of PHM can be categorized into two, namely: fault diagnosis and prognosis. Fault diagnosis is a process of tracing for faults, checking for root causes, troubleshooting failures in engineering systems. The aftermath of diagnosis leads to prognosis. Prognostics is an engineering process that employs synthesis observations, calibrated mathematical models, and simulation to evaluate the future state or behavior of a system. It is the science of anticipating/foreseeing when a system will stop functioning as intended. At present, PHM technology has been introduced to many engineering fields by real-time data monitoring, diagnosis, predicting future failures, and allowing engineers to perform exhaustive predictive maintenance. The PHM approaches can be categorized into three: data-driven, model-based, and hybrid (fusion). A total mathematical model is required to perform model-based PHM, which is often unavailable to many systems. On the other hand, due to the advancement of resource availability, the data-driven PHM approach is widely used nowadays [1,2,3,4,5,6].
The mandate for high levels of reliability for power electronic devices against their maintenance capabilities has been a common factor in recent years. A better knowledge of power electronic devices failure mechanism, reliability, robustness, and impact under diverse environmental conditions cannot be overemphasized, and as such, there is a need for more design enhancement, fault detection, and isolation (FDI), better condition monitoring approach and remaining useful life predictions (RUL) of power electronic devices. Power electronics devices such as SMPS has their application cut across different engineering field, which is subject to faults that can degrade the quality of power supply during usage. Considering system health monitoring is one major foundation for PHM as it aims to achieve various contributions (anomaly detection, fault detection, and identification (FDI), degradation trends). Be as it may, there have been several FDI techniques, diagnostic and prognostic for power electronic devices with the sole aim of reducing failure by addressing the cause of faults in a bid to provide longer usage [7,8].
For most power electronics maintenance operations in the industry, it is evident to consider the maintenance costs and the RUL prediction combined with recently developed condition monitoring approaches. A fault in SMPS can cause an irregular power flow in machinery components and damage them permanently. A proper condition monitoring framework of the power supply improves the safety, productivity, and maintenance costs of industrial assets. Due to the complexity of data-driven approaches to power electronics, as the data acquisition process can be complicated, it is of greater opportunity to the field of power electronics as the engineering world moves to artificial intelligence (AI). With the support and improvement of AI, there has been room for easy exploitation of data which would help to boost product competitiveness by improving on the design capabilities, reliability, and the optimal state of health (SOH) of the power electronic devices [9,10,11]. Advancement for PHM has received much attention with the deployment of deep neural networks. However, there are some deficiencies attributed to the deployment of deep neural networks owing to a lack of interpretability, even though the predictability accuracy of the models is always high. This limitation has called for more inclusion for it to be addressed. A technique for feature selection for training a deep neural network in PHM considering only the importance value was proposed to address these deficiencies [12,13].
The goal of a power supply is to provide the right voltage and current to the load. The current must be delivered to a wide range of loads in a regulated manner and at an accurate voltage—at times concurrently, without allowing changes in the input voltage or other connected devices to alter the output. Inside an SMPS circuit, many electronic devices are incorporated, from tiny power factor correction (PFC) filters to power transformers. These are intricately located in positions suitable for their roles. SMPS is sometimes used simply for home computers or street LED lamps, but it is more complex in large-scale electronic control systems such as power generation facilities and weapon systems, so it can be used according to various operating environments rather than a constant load. In a dynamic operating condition, the load will also change [14]. Therefore, it is very important to study the life-cycle predictions of SMPS for predicting defects and making health decisions. Various factors damage the health of the electronic system, such as temperature, humidity, overvoltage, and short-circuit current [15,16]. If the health condition of SMPS is deteriorating due to the electrical load, the temperature of the internal elements of the system rises, resulting in deterioration of performance and eventually failure. Therefore, performance degradation and remaining life can be predicted usefully through the output power data of SMPS. In the case of a data-driven approach to electronic systems, it is possible to analyze performance degradation trends and RUL from sensor data of a single load.
Therefore, in this study, we introduce a structure for predicting RUL centered on integrated sensor data fusion (current and voltage signals) for multiple power loads combined with an extended Kalman filter (EKF) to better adapt to the SMPS signals. Consequently, this study makes the following contributions:
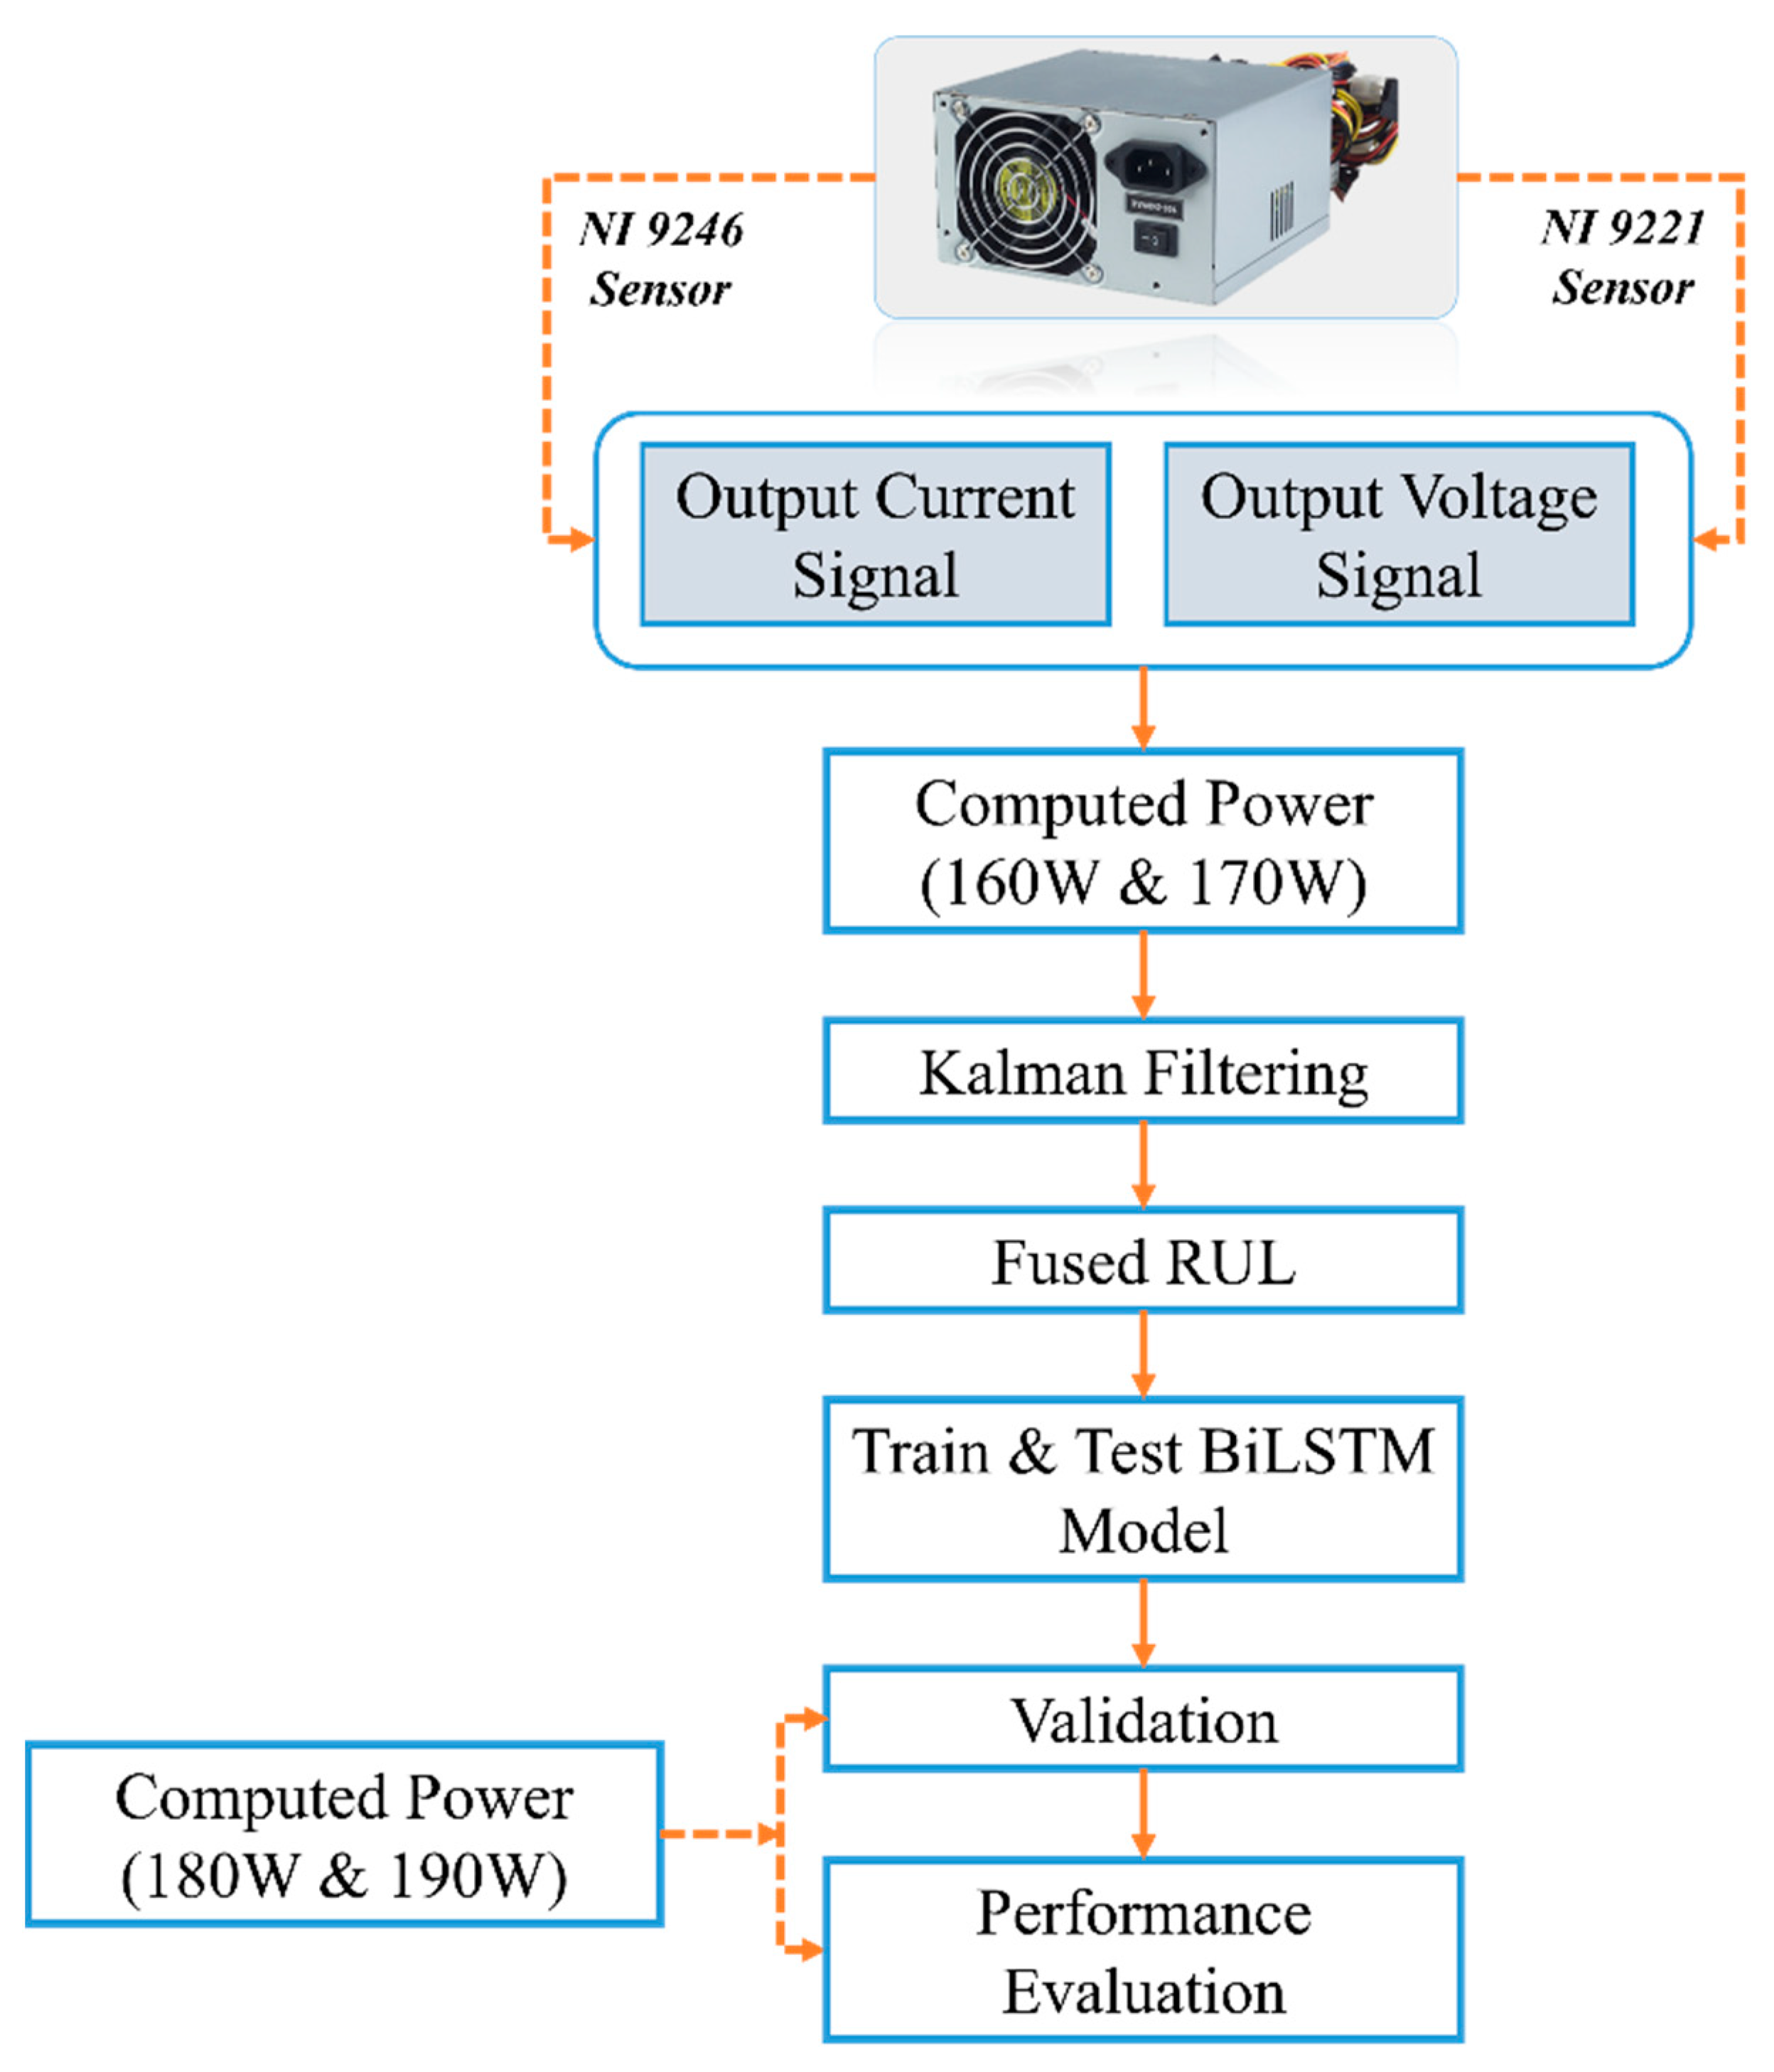
  • Proposal of an integrated sensor condition monitoring framework that consists of voltage and current signals for a proper SMPS RUL prediction. An accelerated aging test was designed for the SMPS to analyze the degradation at various electrical loading;
  • Proposal of EKF based filtering for RUL prediction. Compared with other statistical tools, EKF can effectively describe the random structure of experimental measurements, with its selection coming from the ability to solve nonlinear estimation and its low computational cost;
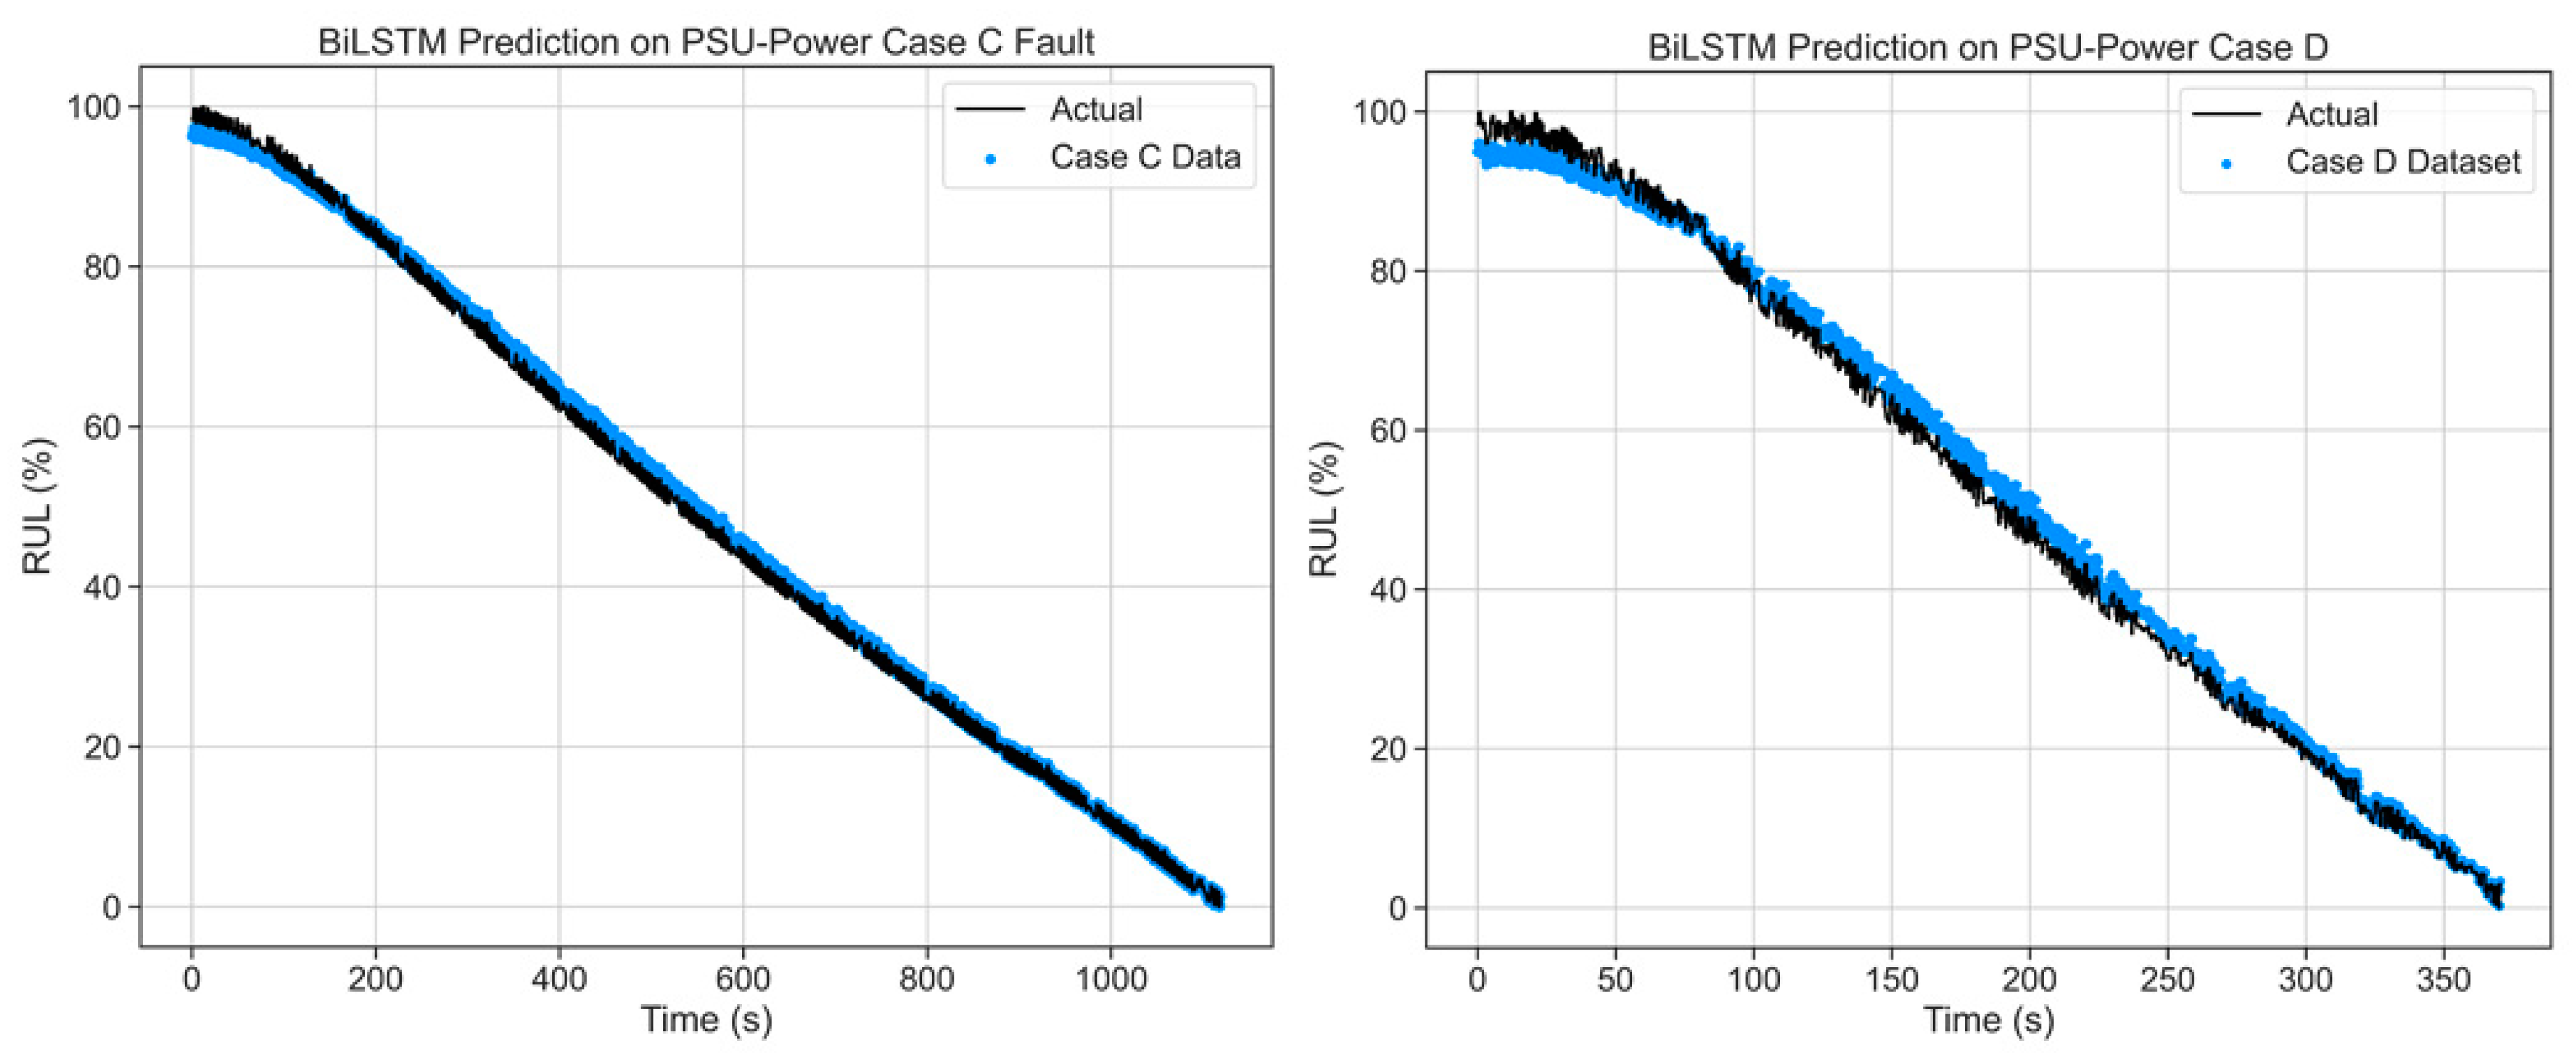
  • Validation of the EKF-BiLSTM model which shows the accurate RUL prediction.
We have sectioned this study as follows. Section 2 covers the motivation and literature review, as it helps to give detailed insights into the various prognostics approaches towards power electronics. Section 3 explains the theoretical overview of the extended Kalman filter (EKF), long short-term memory (LSTM), and the proposed bi-directional long-short--term memory (BI-LSTM). Section 4 showcases the experimental test bench, while Section 5 gives a better understanding of the result achieved during the prognostics process. Lastly, conclusions and insight on future works are given in Section 6.

2. Motivation and Literature Review

With the improvements of existing products and development of new products, the power supply industry is striving for smart design and robust performance. This entails designing the power supply with customer-specified characteristics in a shorter time and at a lower cost. Electronic devices such as SMPS failure under usage portrays time to failure, which in the long run ensure end-users have the affordability of reusing their various component under normal conditions for useful lifespan. SMPS are widely used where the required voltage and current are lesser than available raw energy levels from the mains. It helps to convert any type of required voltage for the end-user. Recent research has shown various failures of SMPS during their usage, which cut across damages to the semiconductor devices, transformer, and electrolytic capacitor with fault causes from over-voltage, high temperature, energy surge, etc. Although there have been numerous reliability improvements on SMPS, the fault is still unavoidable.
Therefore, fault diagnosis and prognosis of SMPS would exhibit a critical role in enhancing the reliability of the system and ensuring its useful lifespan. Figure 1 shows a typical overview of the SMPS functional blocks. The input ac supply is fed into the power supply, after which filtration occurs inside the input capacitor. The input capacitor must be large to withstand/holdup the mains in case of fluctuation. The unregulated dc pass through the high-frequency power switching stage such as MOSFET, IGBT, etc., which performs switching operation for the voltage before the primary transformer. The voltage is then stepped down and smoothed with the output filter depending on the arrangement of the components. During all this process, there must be minimal losses to maintain the efficiency of the system. Research using Kalman filters (KF) for defect diagnosis and prediction has been actively conducted. Adaptive joint extended Kalman filter (AJEKF) was used to estimate the performance degradation before applying it to the RUL prediction at the system level of DC-DC converters [17]. The AJEKF was introduced and combined with an adaptive dual-based Kalman filter to capture the degradation of DC-DC converters [18]. Y Zhang et al. also used the feature-aided Kalman filter (FAKF) to evaluate the degradation of electromechanical actuators (EMA) [19]. The industries that use the KF for sensor data fusion are diverse, such as aviation, robots, drones, and autonomous vehicles, so research is active. A comparison of fuzzy adaptive-based, extended, unscented, and iterated Kalman filters was carried to evaluate their suitability for the multi-sensor fusion process [20]. Akbar Assa et al. propose an enhanced Kalman filtering framework for sensor fusion that provides robustness against uncertainty in system parameters [21]. Ehab I. Al-Khatib et al. applied an EKF to the fusion of multi-sensor data for robot localization [22].
In a complex electrical system, mathematical modeling is a time-consuming task, and a proper physical model is not always available. However, when faced with huge volumes of industrial data, some machine learning models computing power and accuracy fall short of industry standards. Hence, the current diversification to deep learning—a subfield of machine learning. A deep neural model was developed to explore the correlation between each input signal and forecast the RUL of roto blades meant for aero engines accurately and stably [23]. The frequency-domain features were extracted from the signals; a health index was first extracted using the ordered neurons, then the proposed ON-LSTM system model was constructed to produce the RUL prediction value [24]. Data set size was one of the limitations in [25], with further works making emphasis on the need for more data to classify the performance degradation characteristics of SMPS. Several studies have been conducted on various reliability analyzes and RUL estimation of SMPS. Mohammed Khorshed Alam et al. proposed a reliability analysis method for power converters considering the cumulative effect of performance degradation [26]. Zhang et al. proposed a four-step PHM approach of SMPS, which are precursor parameter identification, baseline establishment, baseline verification, and testing [27]. Xuerong Ye et al. used a simulation-based health assessment methodology for SMPS [28]. Min Zhao et al. made a proposal for failure prediction methodology for SMPS power MOSFET using an equivalent circuit model [29]. A major part of SMPS studies is based on a simulated model of the equivalent SMPS circuit, which requires a physics-of-failure modeling and mathematical knowledge of the SMPS. A model-based diagnostics and prognostic approach considering a methodology that employs the knowledge of the component and degradation. An assessment involving the health status, fault diagnosis, and RUL predictions was achieved [30].
More recent data-driven machine learning models and RUL predictions are proposed in the literature for many electrical systems [31,32,33]. However, PHM study on SMPS using the fusion of electrical signature data has been very limited. This encourages authors of this paper for such an investigation.

3. Theoretical Overview

Typical deep learning sequence models that process sequence data include recurrent neural networks (RNN), gated recurrent unit (GRU), and LSTM. These models solve and predict various problems by sequentially reflecting historical information and extracting features from ordered sequence data. RNN is a method of calculation by continuously passing information from the preceding time-step to the next time-step. However, in RNN, hidden nodes are connected by oriented edges to form a circular structure have difficulty in long-term dependency learning. When back-propagating, the gradient gradually decreases, and the learning ability greatly decreases, named vanishing gradient difficulty. To overcome this, a memory cell named LSTM is extended by adding cell-state to the hidden state of the RNN [34].

3.1. Extended Kalman Filter

The KF is an algorithm widely applied in modern control and signal processing to estimate the state of a linear dynamical system [35]. The basic concept of the KF is to estimate the optimal value through a recursive operation using the old and new measurement data, and it can be used when the motion model and the measurement model are linear and follow a normal distribution.
However, in practical applications, the use of KF is limited because the system is often a nonlinear model. Therefore, many models such as the EKF and the UKF have been developed so that the KF can be applied to various cases. EKF solved the problem of KF by repeatedly performing state prediction and measurement updates. Therefore, we used the EKF model to update future predictions in this study. EKF can be expressed as Equation (1) [36,37]:
x k = f ( x ( k 1 ) , u ( k 1 ) ) + w ( k 1 )  
where x k   is the state to be estimated, f is the nonlinear function of the state, and w ( k 1 ) is Gaussian white noise. To fuse the RUL of the two power ranges, the state matrix, X; Covariance matrix, C; System noise, N; Transition matrix, T; observation matrix, O; A matrix such as the fused output RUL matrix, FRUL, is constructed. Individual RUL tensors are computed by combining the actual RUL and the variance matrix of RUL for each power degradation data (S1, S2). In addition, three local functions are used: EKF, pred, and update. The detailed configuration of the EKF algorithm produced for this study is shown in Figure 2.

3.2. Short-Time Fourier Transform (STFT)

STFT is a signal processing technique that showcases a sequence of Fourier transforms with the help of a windowing function. When the frequency components of the signal change over time, the STFT gives time localized frequency domain data, whereas the normal Fourier transform provides frequency domain data at a rate averaged the whole signal at a time interval. The calculation can be denoted as follows:
S T F T x h   ( t , f ) = x ( t ) h * ( t t ) e j 2 π f t   d t
where x = random signal as a function of time (t),   S T F T x h = Fourier transform function of time (t) and frequency (f). The spectrogram of STFT, which is an intensity plot of STFT magnitude over time, is frequently used to visualize it [38].

3.3. Explanation of LSTM and BiLSTM

LSTM has continuing dependencies that can consider past information. It consists of a cell state that stores information as well as a hidden state. A typical LSTM model consists of three gates. The three gates serve to mediate the addition and removal of information. The gate used in the first step is denoted as “forget gate layer f t ”, and the sigmoid function determines the information that needs to be removed. This is expressed as Equation (3). Afterward, in the “input gate layer i t ”, it is decided to store in the cell state among new information, and it can be expressed as Equation (4). Finally, the value to be exported from the “output gate layer σ t ” is determined, as shown in Equation (5).
The BiLSTM Neural Network is an updated form of LSTM, a structure that uses two independent LSTM architectures together. It has a structure in which a reverse LSTM layer is added to the existing forward LSTM layer. Because LSTMs are entered in chronological order, there is a limit to the tendency of the results to converge based on the previous pattern. BiLSTM is a model that improves accuracy by solving this problem through bidirectional information transmission by applying LSTM twice and shows good performance even with long data lengths [39]. The generalized composition of the BiLSTM model is shown in Figure 3.
f t = σ ( W t [ h t 1 ,   X t ] ) + b f
i t = σ ( W i [ h t 1 ,   X t ] ) + b i
σ t = σ ( W o [ h t 1 ,   X t ] ) + b o
where   W * : weight vectors of each gate (*: forget, input, and output), h ( t 1 ) : hidden previous cell output, X t : input vector, and b * : bias of each gate.

3.4. Proposed BiLSTM Model

In this study, we propose a data-driven electrical feature fusion technique for RUL prediction of SMPS. The proposed prognostics algorithm consists of two parts. The first is the degradation feature fusion using the Kalman filter, and the second is the pattern recognition and RUL prediction using the BiLSTM model. A step-by-step flow diagram of the proposed framework is shown in Figure 4. The output current sensor data and voltage sensor data of the SMPS acquired during the experiment were used. SMPS can check the trend of output DC electric power deterioration over time when the load is applied. Sensor data collected from two power load ranges of 160 W (Case A) and 170 W (Case B) were then calculated for output power, filtered, and normalized using a moving average technique, and then fused using an extended Kalman filter (EKF). BiLSTM neural networks are used to train RUL models for future predictions. RUL was predicted using a variety of training, testing, and validation data sets. We trained a BiLSTM model to predict sequence-specific RUL for different periods. BiLSTM is an excellent and proven tool for predicting sequential data with high prediction accuracy. Sharing information in both directions is important in predicting RUL because models can learn patterns from historical data and future trends. Power data calculated from sensor data collected over two power load ranges of 180 W and 190 W were subjected to moving average filtering and normalization and then tested on the previously trained BiLSTM model. Table 1 showcases the model parameters used during testing.

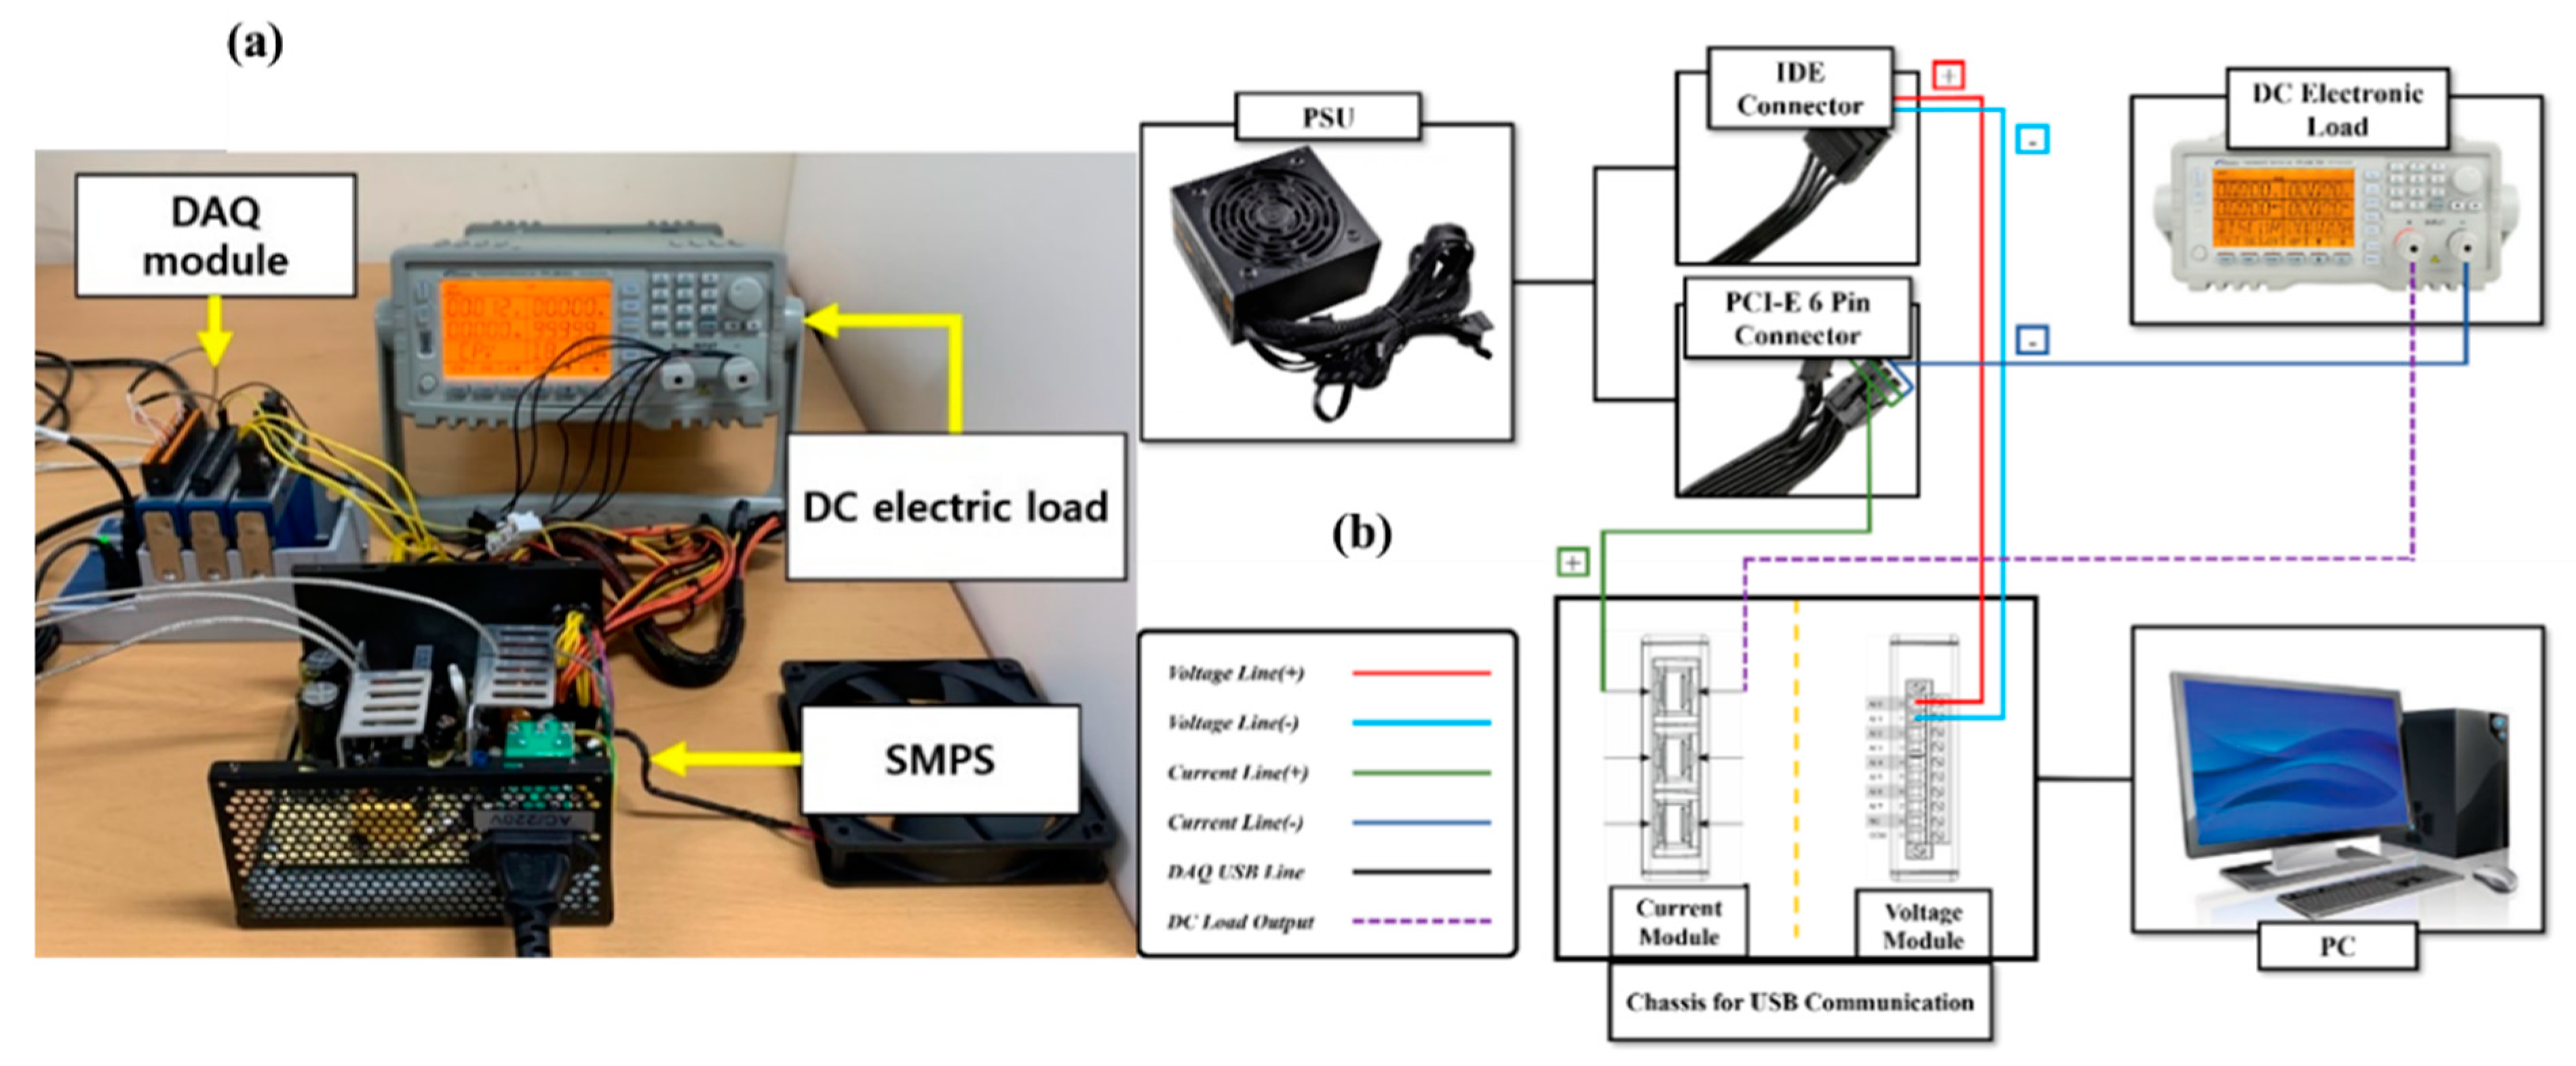
4. Experimental Test Bench

Data Acquisition and Fault Classification

The component arrangements, connection, and test bench setup for accelerated life tests (ALTs) are shown in Figure 5. The SMPS used in the research was a 500 W maximum output power manufactured by AEGIS. We removed the SMPS cooler under laboratory conditions and monitored the deterioration trend using Twintex’s DC Electric load (PPL-8612C3). The maximum output voltage and current of the SMPS output terminal to which DC power load was applied were 12 V and 15 A, respectively. The data acquisition bed with model number NI cDAQ-9174 was used as a medium of connection for NI-9246 for current and NI-9228 for voltage to acquire the sensor data. The sampling rate for both NI modules was set to 1.0 kHz, and the DAQ parameters were updated and configured using LabVIEW software from the same manufacturer as the DAQ bed. The DC load acting as the mode of failure mechanism to subject the SMPS to electrical stress provided a degradation parameter at intervals of 10-Watt difference. The fault classification is described in Table 2, while the parameter for the SMPS life prediction test is shown in Table 3. Two sets of electrical data were acquired from the electronic load and SMPS setup labeled output current and output voltage, respectively. The output signal acquired is shown in Figure 6, along with power spectral density and spectrogram.

5. Results and Discussion

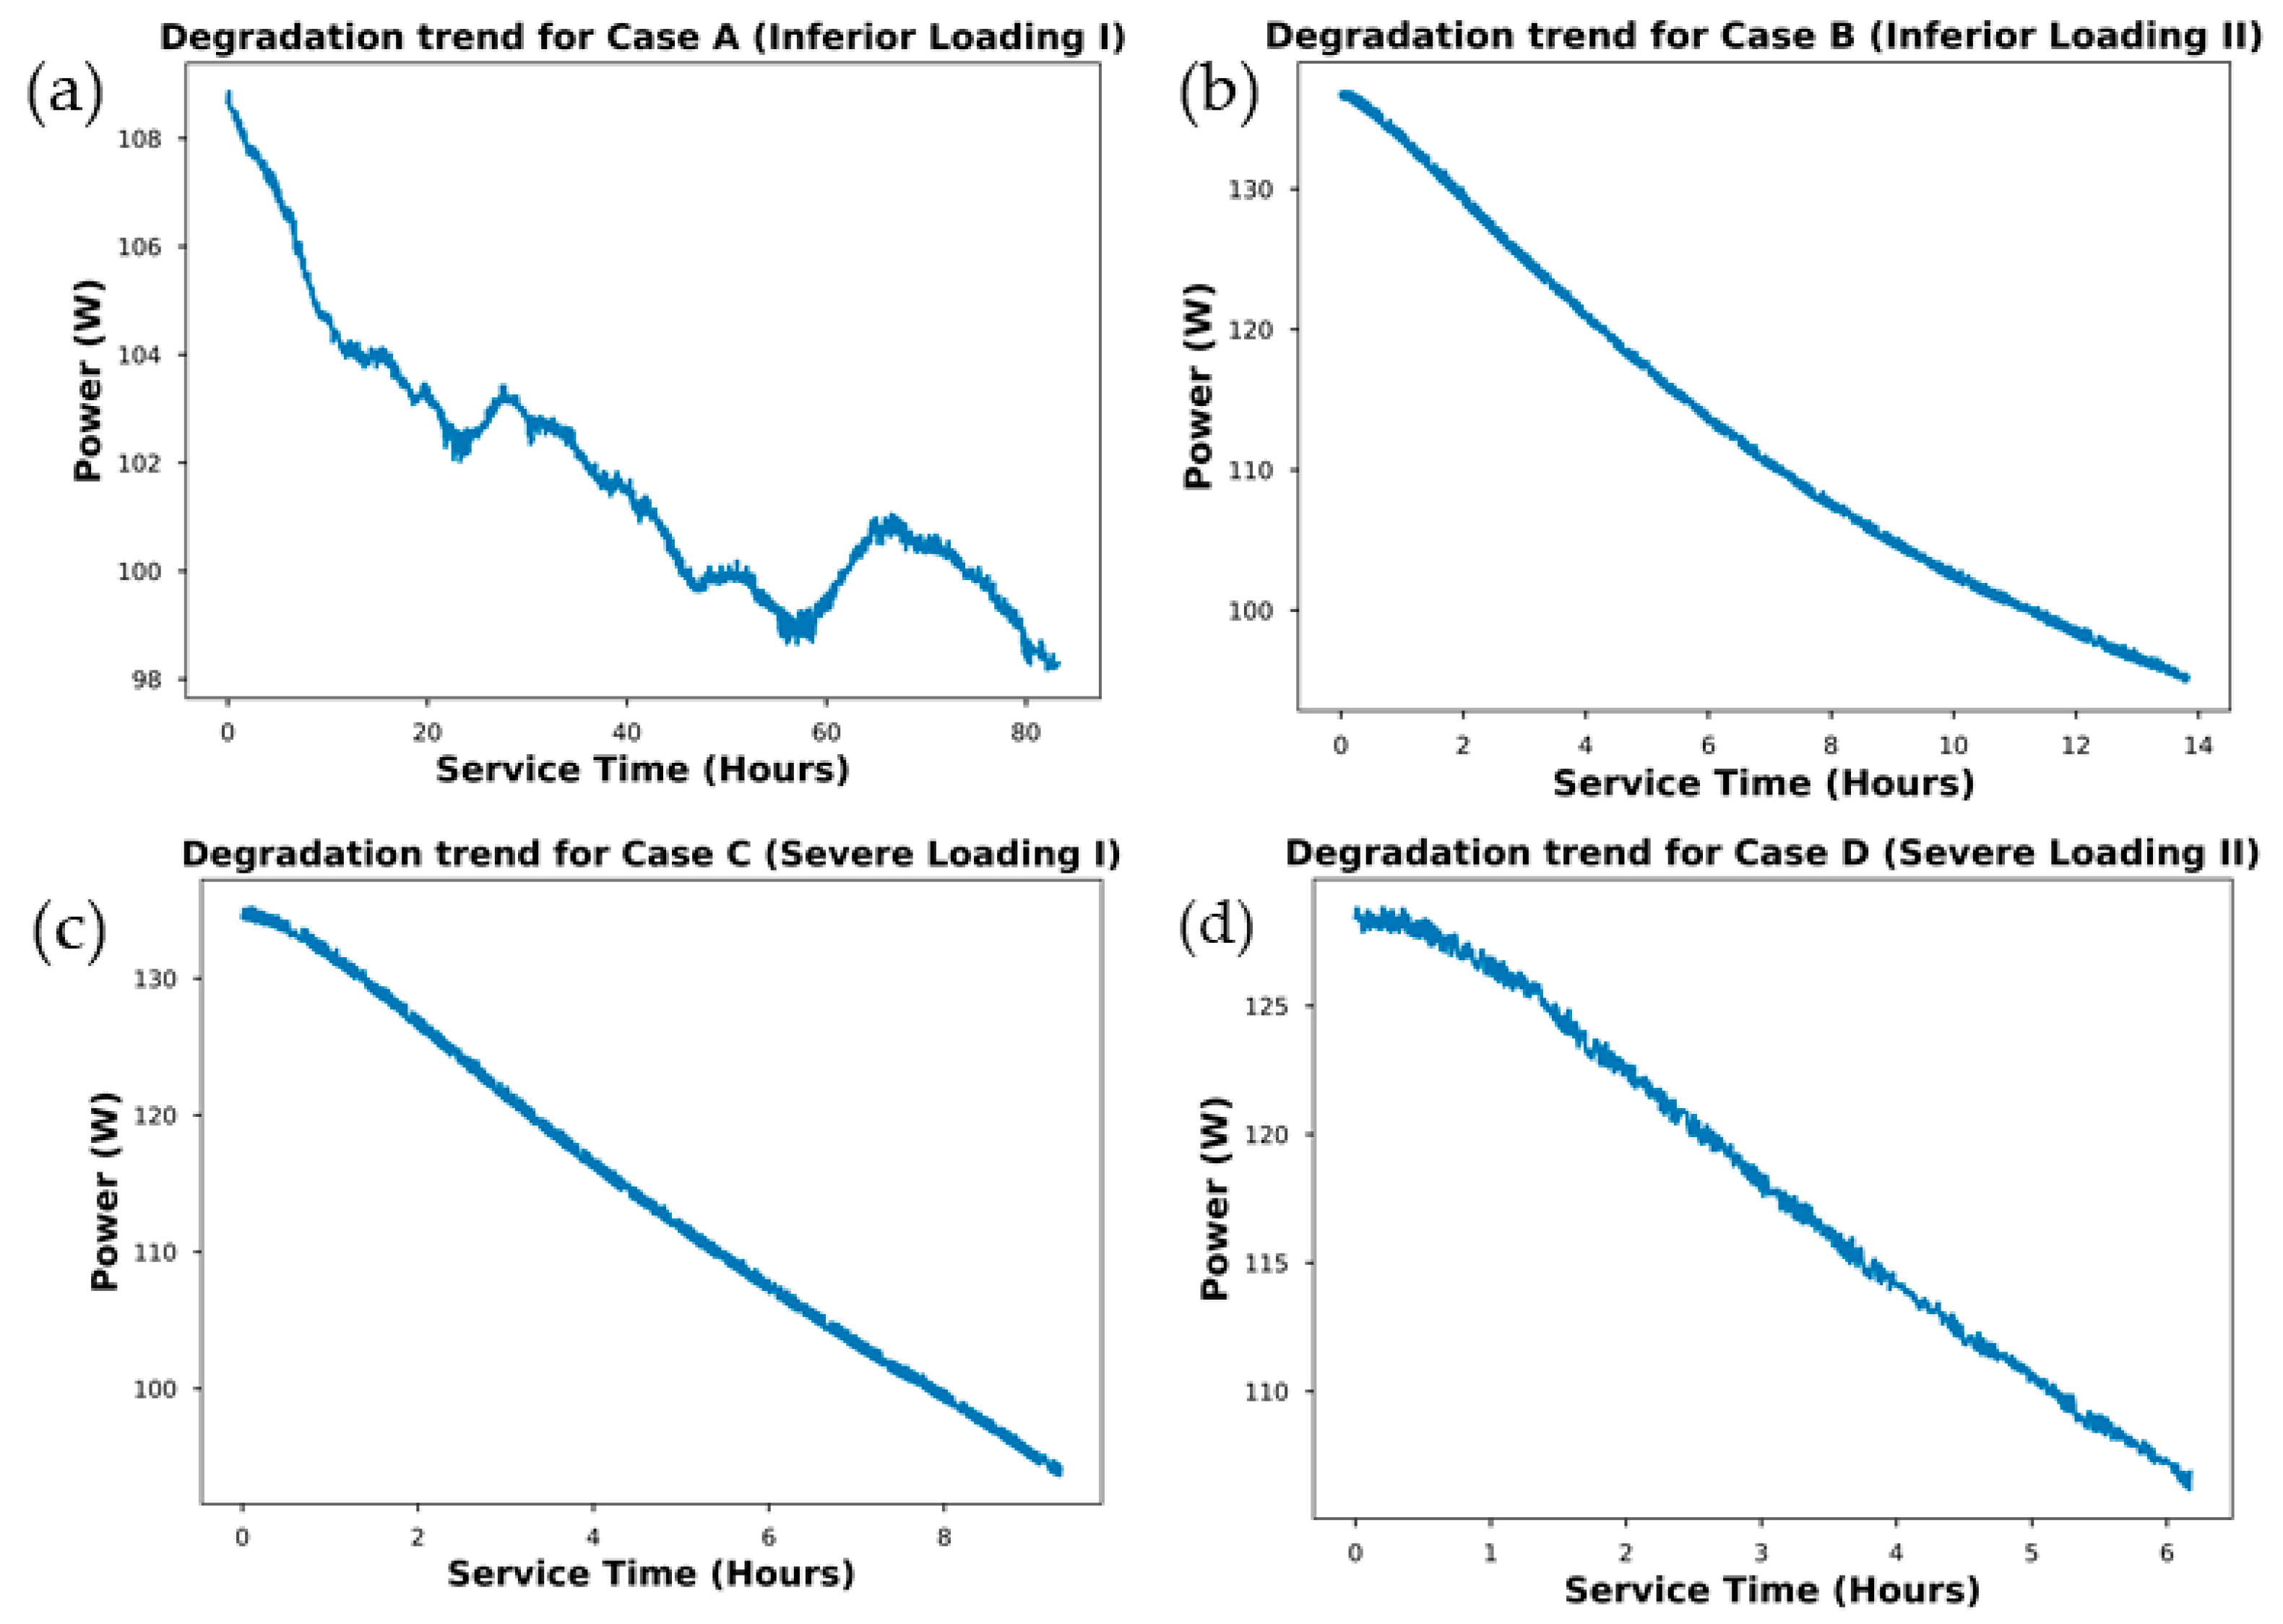
5.1. Degradation Data
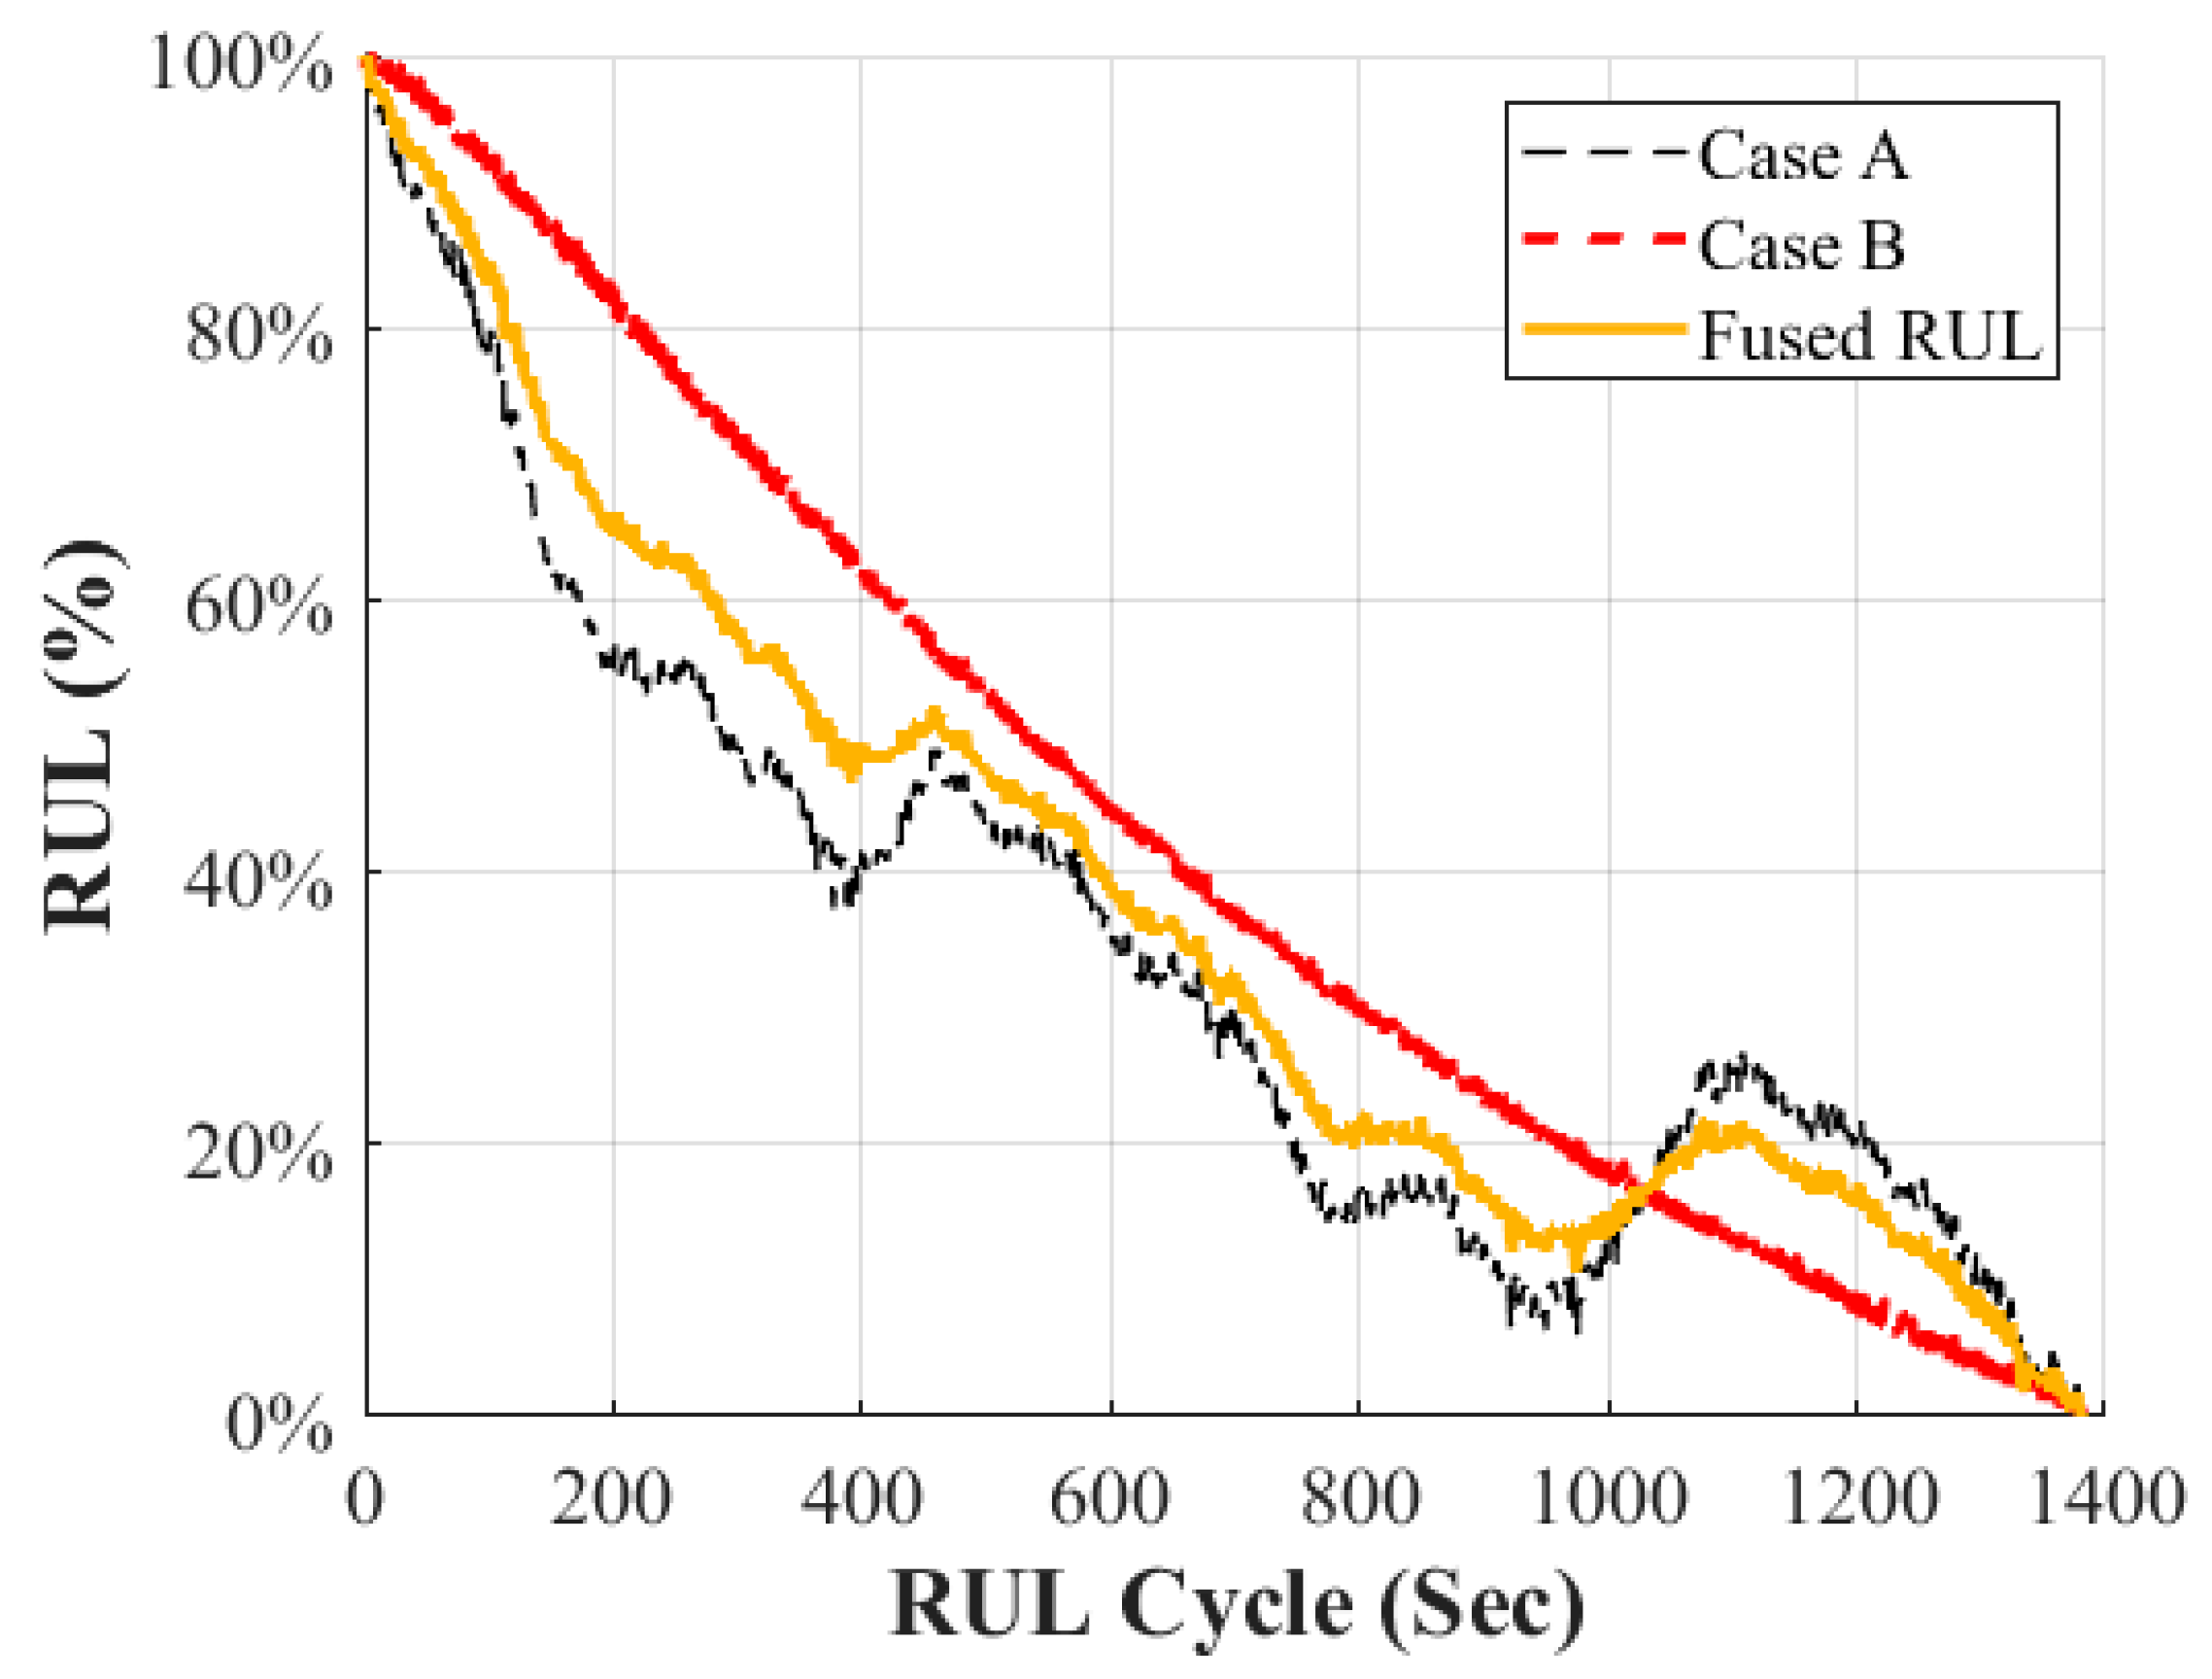
To achieve condition monitoring for electronics, most researchers subject the equipment to accelerated aging tests to achieve a degradation trend for most power electronics devices. Electrical stress can be attained with components in the PCB board during the testing stage and assembly. However, some faults could occur due to external occurrences like the reverse voltage, current overload, transient voltages, etc. Destruction is meant to occur for most semiconductor devices in the reverse direction if not limited as no current would flow until the breakdown voltage is surpassed, while occurrence in forwarding voltage is insignificant. There is an exception based on the type of diode present in the circuit. During the ALT setup, there was a significant increase in the output current and a decrease in the output voltage. The SMPS in use is meant to have a limitation for all the components and, with the removal of the cooling fan, abounds an uneven heat distribution across the SMPS. These would give room for failure in some component that exceeds their limitation hence the failure of the SMPS. An electrical stress mode of failure was used to achieve a degradation failure for the SMPS used in this study; for the acquired output signals, as shown in Figure 6, we have computed the power using the output voltage and current dataset. The degradation curve for the different fault states is shown in Figure 7, and it can be denoted that there was a drop in the power against the service hours (time). In addition, the trend curve for each case fault of the SMPS showcased an unequal degradation. Case A provided a fluctuating trend during the testing, while Case D had the highest amount of degradation for the SMPS due to severe loading.

5.2. RUL Estimation

Degradation data calculated from current and voltage signals collected in Case A and Case B load tests were filtered and used to compute real power. The EKF model was used to fuse the trend of degradation of the power signal through the simultaneous update and prediction modes. The fused data preserves the temporal sequence important for RUL prediction and the tendency to degrade existing signals. Figure 8 shows the trend of the combined output power after EKF fusion. Later, fused degradation data were trained on a BiLSTM model. In the training phase, the drop-out ratio was set to 0.2 [40]. This means that 80% of neurons were activated, and 20% were randomly deactivated during the training phase. Drop-out is a technique to stop the activation of neurons by putting a probability for each layer. This can prevent overfitting, a problem that occurs in deep learning algorithms. Other parameters used to build and train the model are shown in Table 1. This model was trained on a PC with 64 Gb RAM and a CPU with i9-9940X 14 cores. Deep learning architecture was supported on TensorFlow-GPU installed on a Radeon RX 570 with 4 GB VRAM. The RUL data fused to the two signals were then tested to verify that it could effectively achieve a prediction of the RUL for different outputs. RUL calculated from data collected in two different power ranges, Cases C and D, were tested on a trained BiLSTM model.
The proposed BiLSTM model showcases a similar identical trend with power degradation. To compare the loss value of the BiLSTM model, a developed algorithm with the most appropriate values of epoch and batch size as visualized in Figure 9. With a range between 1000 to 5000, the BiLSTM model split the integrated RUL data from EKF into batches. Interestingly, most LSTM-based models have hindrances in remembering long sequences, despite their ability to “remember” sequences of data. Because the input data is traversed only once from left to right in a standard LSTM model, a limited number of input items can be provided into the training model. However, in a BiLSTM model, the input data must be trained not only from left to right but also from right to left. As a result, each batch can handle approximately half the amount of training data that a regular LSTM can learn in a single batch. The prediction results of the BiLSTM model are shown in Figure 10.

5.3. Performance Evaluation

Performance evaluation can help establish the ideal configuration for a specific scenario, allowing for a comparison of which is more efficient in solving a problem and how much better it is compared to other possibilities. The goal of this study’s evaluation was to examine the performance of EKF-BiLSTM implementations under various scenarios (Case C and Case D).
Two regression metrics were used to assess the accuracy of the training model used to predict RUL. MAE (Mean Squared Error) is a commonly used error index and is characterized by robustness by taking an absolute value from the difference between the actual and the estimated valueas expressed in Equation (6). Root mean squared error (RMSE) represents the difference between the actual and the estimated value. If the difference between the error is large, a penalty is given to improve the distortion of the value which is expressed in Equation (7). This gives you information about the accuracy of your predictions using the model presented in your study.
M A E = 1 N i = 1 N | x i x ^ i |
R M S E = 1 N i = 1 N ( x i x ^ i ) 2
E R i = RUL true ( i ) RUL predicted ( i ) RUL true ( i )
where x i = real power data,   x ^ i   = predicted electric power data by the models, N = number of data points. E R i , shown in Equation (8) was additionally calculated to identify the RUL prediction error more intuitively. The standard deviation of the E R i   allows the assessment of the stability of the prediction results [41,42]. By evaluating the model’s performance at different data sizes, the model’s performance at different RUL cycles can be seen. Table 4 shows the standard deviations of MAE, RMSE and E R i   for four different data sizes.

6. Conclusions

Fault diagnostics and prognostics of power electronics have received much attention due to their complex nature of predicting the RUL and understanding the lifespan for cost-aware processes. In this study, we proposed a data fusion-based RUL prediction framework applied to SMPS. Analyzing the output signal of the SMPS in the time and frequency domain is difficult for the identification and classification of an incipient fault and a severe fault. An integrated current and voltage sensor data has given a better intuition about the degradation and lifetime estimation as power was computed from the dataset. The extended KF model was used to efficiently predict the remaining useful life of SMPS. The EKF-based data model is used for the fusion of different ranges of load-specific features through prediction and update algorithms. This filter has proven to be suitable for RUL prediction by preserving the time sequence and degradation characteristics of SMPS in the presence of different loads. To determine the RUL, the fused degradation data were trained on a BiLSTM model and tested using current and voltage data from another load range collected on an SMPS test bench to evaluate the performance of the trained model.
EKF assisted BiLSTM model shows excellent RUL prediction output on the test set. This work can be further extended by incorporating the EKF model with the weights of the LSTM layer to enable the real-time or online updating mode of the neural network model. More work on this subject with other failure scenarios is needed for a more comprehensive prognostics study for SMPS, with a focus on computation costs and interpretability.

Author Contributions

Conceptualization, J.E.K. and T.A.S.; methodology, J.E.K., T.A.S. and A.B.K.; software, J.E.K., T.A.S. and A.B.K.; validation, T.A.S. and A.B.K.; formal analysis, T.A.S. and A.B.K.; investigation, T.A.S., A.B.K. and J.-W.H.; resources, J.-W.H.; data curation, J.E.K. and T.A.S., writing—original draft preparation, J.E.K., T.A.S. and A.B.K.; writing—review and editing, T.A.S. and A.B.K.; visualization, T.A.S. and A.B.K.; supervision, J.-W.H.; project administration, J.-W.H.; funding acquisition, J.-W.H. All authors have read and agreed to the published version of the manuscript.

Funding

This work was supported by the National Research Foundation of Korea (NRF) grant funded by the Korea government (MIST) (No. 2019R1/1A3A01063935).

Institutional Review Board Statement

Not applicable.

Informed Consent Statement

Not applicable.

Data Availability Statement

The data presented in this study are available on request from the corresponding author. The data are not publicly available due to laboratory regulations.

Conflicts of Interest

The authors declare no conflict of interest.

References

  1. Kareem, A.B.; Akpudo, U.E.; Hur, J.-W. An Integrated Cost-Aware Dual Monitoring Framework for SMPS Switching Device Diagnosis. Electronics 2021, 10, 2487. [Google Scholar] [CrossRef]
  2. Wang, C.; Ji, T.; Mao, F.; Wang, Z.; Li, Z. Prognostics and Health Management System for Electric Vehicles with a Hierarchy Fusion Framework: Concepts, Architectures, and Methods. Adv. Civ. Eng. 2021, 2021, 6685900. [Google Scholar] [CrossRef]
  3. Jigyasu, R.; Shrivastava, V.; Singh, S. Smart classifier based prognostics and health management of induction motor. Mater. Today Proc. 2021, 43, 355–361. [Google Scholar] [CrossRef]
  4. Alam Shifat, T.; Jang-Wook, H. Remaining Useful Life Estimation of BLDC Motor Considering Voltage Degradation and Attention-Based Neural Network. IEEE Access 2020, 8, 168414–168428. [Google Scholar] [CrossRef]
  5. Zhong, J.; Wang, D.; Guo, J.; Cabrera, D.; Li, C. Theoretical Investigations on Kurtosis and Entropy and Their Improvements for System Health Monitoring. IEEE Trans. Instrum. Meas. 2021, 70, 3503710. [Google Scholar] [CrossRef]
  6. Long, J.; Sun, Z.; Li, C.; Hong, Y.; Bai, Y.; Zhang, S. A Novel Sparse Echo Autoencoder Network for Data-Driven Fault Diagnosis of Delta 3-D Printers. IEEE Trans. Instrum. Meas. 2019, 69, 683–692. [Google Scholar] [CrossRef]
  7. Zhao, X.; Kim, J.; Warns, K.; Wang, X.; Ramuhalli, P.; Cetiner, S.; Kang, H.G.; Golay, M. Prognostics and Health Management in Nuclear Power Plants: An Updated Method-Centric Review with Special Focus on Data-Driven Methods. Front. Energy Res. 2021, 9, 696785. [Google Scholar] [CrossRef]
  8. Prisacaru, A.; Gromala, P.J.; Han, B.; Zhang, G. Degradation Estimation and Prediction of Electronic Packages using Data Driven Approach. IEEE Trans. Ind. Electron. 2021, 69, 2996–3006. [Google Scholar] [CrossRef]
  9. Abuelnaga, A.; Narimani, M.; Bahman, A.S. Power electronic converter reliability and prognosis review focusing on power switch module failures. J. Power Electron. 2021, 21, 865–880. [Google Scholar] [CrossRef]
  10. Meng, L.; Pecht, M.; Liu, J.; Wang, Y.; Cheng, K. Health Monitoring of IGBTs with a Rule-Based Sub-safety Recognition Model Using Neural Networks. J. Progn. Health Manag. 2020, 1, 64–85. [Google Scholar] [CrossRef]
  11. Li, D.; Li, X. Study of Degradation in Switching Mode Power Supply Based on the Theory of PoF. In Proceedings of the 2012 International Conference on Computer Science and Service System, Nanjing, China, 11–13 August 2012; pp. 1976–1980. [Google Scholar]
  12. Xiaozhi, L.; Peihong, L.; Yinghua, Y. Remaining Useful Life Prognostics Based on Deep Combined Temporal Bidirectional Convolutional Network. In Proceedings of the 2021 33rd Chinese Control and Decision Conference (CCDC), Kunming, China, 22–24 May 2021; pp. 4604–4609. [Google Scholar] [CrossRef]
  13. Barraza, J.F.; Droguett, E.L.; Martins, M.R. Towards Interpretable Deep Learning: A Feature Selection Framework for Prognostics and Health Management Using Deep Neural Networks. Sensors 2021, 21, 5888. [Google Scholar] [CrossRef] [PubMed]
  14. Huang, W.; Khorasgani, H.; Gupta, C.; Farahat, A.; Zheng, S. Remaining Useful Life Estimation for Systems with Abrupt Failures. In Proceedings of the PHM Society Conference, Utrecht, The Netherlands, 3–6 July 2018; Volume 10. [Google Scholar] [CrossRef]
  15. Orsagh, R.; Brown, D.; Roemer, M.; Dabnev, T.; Hess, A. Prognostic health management for avionics system power supplies. In Proceedings of the 2005 IEEE Aerospace Conference, Big Sky, MT, USA, 5–12 March 2005; pp. 3585–3591. [Google Scholar] [CrossRef] [Green Version]
  16. Kwon, W.S.; Choi, S.K.; Ban, C.H.; Bang, S.B.; Kim, C.M.; Choe, G.H. A study on the effect of arc fault on switched-mode power supply. In Proceedings of the 8th International Conference on Power Electronics-ECCE Asia, Jeju, Korea, 30 May–3 June 2011. [Google Scholar]
  17. Al Mohamad, A.; Ghaleb, H.; Vicenç, P. A hybrid system-level prognostics approach with online RUL forecasting for electronics-rich systems with unknown degradation behaviours. Microelectron. Reliab. 2020, 111, 113676. [Google Scholar] [CrossRef]
  18. Al Mohamad, A.; Ghaleb, H.; Vicenç, P. A Model-Based Prognostics Approach for RUL Forecasting of a Degraded DC-DC Converter. In Proceedings of the 2019 4th Conference on Control and Fault Tolerant Systems (SysTol), Casablanca, Morocco, 18–20 September 2019; pp. 312–318. [Google Scholar] [CrossRef]
  19. Zhang, Y.; Liu, L.; Peng, Y.; Liu, D. An Electro-Mechanical Actuator Motor Voltage Estimation Method with a Feature-Aided Kalman Filter. Sensors 2018, 18, 4190. [Google Scholar] [CrossRef] [Green Version]
  20. Yazdkhasti, S.; Sasiadek, J. Multi-Sensor Fusion Based on Adaptive Kalman Filtering. In Advances in Aerospace Guidance, Navigation and Control; Springer: Berlin/Heidelberg, Germany, 2018. [Google Scholar] [CrossRef]
  21. Assa, A.; Janabi-Sharifi, F. A Kalman Filter-Based Framework for Enhanced Sensor Fusion. IEEE Sens. J. 2015, 15, 3281–3292. [Google Scholar] [CrossRef]
  22. Al-Khatib, E.; Jaradat, M.; Abdel-Hafez, M.; Roigari, M. Multiple sensor fusion for mobile robot localization and navigation using the Extended Kalman Filter. In Proceedings of the 2015 10th International Symposium on Mechatronics and its Applications (ISMA), Sharjah, United Arab Emirates, 8–10 December 2015. [Google Scholar] [CrossRef]
  23. Singleton, R.K.; Strangas, E.G.; Aviyente, S. Extended Kalman Filtering for Remaining-Useful-Life Estimation of Bearings. IEEE Trans. Ind. Electron. 2015, 62, 1781–1790. [Google Scholar] [CrossRef]
  24. Yan, H.; Qin, Y.; Xiang, S.; Wang, Y.; Chen, H. Long-term gear life prediction based on ordered neurons LSTM neural networks. Measurement 2020, 165, 108205. [Google Scholar] [CrossRef]
  25. Guo, Q.; Shi, J.; Wang, S.; Zhang, C. Deep Degradation Feature Extraction and RUL Estimation for Switching Power Unit. In Proceedings of the Prognostics and System Health Management Conference (PHM-Qingdao), Qingdao, China, 25–27 October 2019; pp. 1–5. [Google Scholar] [CrossRef]
  26. Mohammed, A.; Faisal, K. Reliability Analysis and Performance Degradation of a Boost Converter. IEEE Trans. Ind. Appl. 2013, 50, 5592–5597. [Google Scholar] [CrossRef]
  27. Zhang, H.; Kang, R.; Luo, M.; Pecht, M. Precursor parameter identification for power supply prognostics and health management. In Proceedings of the 8th International Conference on Reliability, Maintainability and Safety, Chengdu, China, 20–24 July 2009; pp. 883–887. [Google Scholar] [CrossRef]
  28. Ye, X.; Chen, C.; Wang, Y.; Zhou, Y.; Vachtsevanos, G. Health-assessment methodology research for SMPS based on simulation. In Proceedings of the 2015 Annual Reliability and Maintainability Symposium (RAMS), Palm Harbor, FL, USA, 26–29 January 2015; pp. 1–7. [Google Scholar] [CrossRef]
  29. Zhao, M.; Zhang, D.; Zhou, Z.; Li, T.; Wang, Z. Novel method for failure prognostics of power MOSFET. In Proceedings of the IEEE International Conference on Computational Intelligence and Virtual Environments for Measurement Systems and Applications (CIVEMSA), Shenzhen, China, 12–14 June 2015; pp. 1–4. [Google Scholar] [CrossRef]
  30. Li, H.; Ye, X.; Chen, C.; Vachtsevanos, G. A Framework for Model-Based Diagnostics and Prognostics of Switched-Mode Power Supplies. In Proceedings of the Annual Conference of the PHM Society, Fort Worth, TX, USA, 29 September–2 October 2014; Volume 6. [Google Scholar] [CrossRef]
  31. Mancuso, A.; Compare, M.; Salo, A.; Zio, E. Optimal Prognostics and Health Management-driven inspection and maintenance strategies for industrial systems. Reliab. Eng. Syst. Saf. 2021, 210, 107536. [Google Scholar] [CrossRef]
  32. Shifat, T.A.; Hur, J.W. ANN assisted multi sensor information fusion for BLDC motor fault diagnosis. IEEE Access 2021, 9, 9429–9441. [Google Scholar] [CrossRef]
  33. Wu, J.; Cui, X.; Zhang, H.; Lin, M. Health Prognosis with Optimized Feature Selection for Lithium-Ion Battery in Electric Vehicle Applications. IEEE Trans. Power Electron. 2021, 36, 12646–12655. [Google Scholar] [CrossRef]
  34. Manaswi, N.K. RNN and LSTM. In Deep Learning with Applications Using Python; Apress: Berkeley, CA, USA, 2018. [Google Scholar] [CrossRef]
  35. Foo, G.H.B.; Zhang, X.; Vilathgamuwa, D.M. A Sensor Fault Detection and Isolation Method in Interior Permanent-Magnet Synchronous Motor Drives Based on an Extended Kalman Filter. IEEE Trans. Ind. Electron. 2013, 60, 3485–3495. [Google Scholar] [CrossRef]
  36. Li, Q.; Li, R.; Ji, K.; Dai, W. Kalman Filter, and Its Application. In Proceedings of the 8th International Conference on Intelligent Networks and Intelligent Systems (ICINIS), Tianjin, China, 1–3 November 2015; pp. 74–77. [Google Scholar] [CrossRef]
  37. Ma, R.; Xie, R.; Xu, L.; Huangfu, Y.; Li, Y. A Hybrid Prognostic Method for PEMFC with Aging Parameter Prediction. IEEE Trans. Transp. Electrif. 2021, 7, 2318–2331. [Google Scholar] [CrossRef]
  38. Ojeda-Aguirre, N.A.; Garcia-Perez, A.; Romero-Troncoso, R.J.; Morinigo-Sotelo, D.; Duque-Perez, O.; Camarena-Martinez, D. Reassigned Short Time Fourier Transform and K-means Method for Diagnosis of Broken Rotor Bar Detection in VSD-fed Induction Motors. Adv. Electr. Comput. Eng. 2019, 19, 61–68. [Google Scholar] [CrossRef]
  39. Siami-Namini, S.; Tavakoli, N.; Namin, A.S. The Performance of LSTM and BiLSTM in Forecasting Time Series. In Proceedings of the 2019 IEEE International Conference on Big Data (Big Data), Los Angeles, CA, USA, 9–12 December 2019; pp. 3285–3292. [Google Scholar] [CrossRef]
  40. Nitish, S. Dropout: A simple way to prevent neural networks from overfitting. J. Mach. Learn. Res. 2014, 15, 1929–1958. [Google Scholar]
  41. Shifat, T.A.; Yasmin, R.; Hur, J.-W. A Data Driven RUL Estimation Framework of Electric Motor Using Deep Electrical Feature Learning from Current Harmonics and Apparent Power. Energies 2021, 14, 3156. [Google Scholar] [CrossRef]
  42. Deng, Y.; Du, S.; Jia, S.; Zhao, C.; Xie, Z. Prognostic study of ball screws by ensemble data-driven particle filters. J. Manuf. Syst. 2020, 56, 359–372. [Google Scholar] [CrossRef]
Figure 1. SMPS operation function blocks.
Processes 10 00055 g001
Figure 2. EKF Algorithm for RUL Fusion.
Processes 10 00055 g002
Figure 3. Bidirectional LSTM Network Information Sharing.
Processes 10 00055 g003
Figure 4. Proposed Prognostic Model.
Processes 10 00055 g004
Figure 5. Experimental Test Bench (a) Actual view of Test Bench (b) Test Bench Component Connection.
Processes 10 00055 g005
Figure 6. Raw Output Signal, PSD, and Spectrogram of the SMPS for different faults. (a) Output Voltage Signal. (b) Output Current Signal.
Processes 10 00055 g006
Figure 7. Degradation trend. (a) Case A. (b) Case B. (c) Case C. (d) Case D.
Processes 10 00055 g007
Figure 8. Fused RUL using the Proposed Extended Kalman Filter.
Processes 10 00055 g008
Figure 9. Model loss for the training process.
Processes 10 00055 g009
Figure 10. RUL prediction using the BiLSTM Model.
Processes 10 00055 g010
Table 1. BiLSTM Model Parameters.
ParameterValues
OptimizerAdam
Loss functionRMSE
Hidden layer Neurons100
Drop out0.2
Epochs100
ActivationReLU
Batch Size1000
Learning rate0.001
Table 2. Experimental Loading Conditions.
LabelElectric Loading (Watt)
Case A (inferior Loading I)160
Case B (Inferior Loading II)170
Case C (Severe Loading I)180
Case D (Severe Loading II)190
Table 3. Parameters for SMPS RUL Test.
ParameterMeasurement
SMPS modelAEGIS 500
DC electric load modelPPL-8612C3
DAQ module (Current)NI 9246
DAQ module (Voltage)NI 9228
Sampling rate (Current)1 kHZ
Sampling rate (Voltage)1 kHZ
Table 4. Performance Metrics for the BiLSTM Model.
Data SizePerformance Metrics
MAERMSE SD   of   E R i
Case CCase DCase CCase DCase CCase D
25%0.020.030.030.030.010.01
50%0.020.020.020.030.010.01
70%0.020.030.020.030.010.02
100%0.020.020.020.020.060.03
Publisher’s Note: MDPI stays neutral with regard to jurisdictional claims in published maps and institutional affiliations.

