Article

Reactive PLIF Method for Characterisation of Micromixing in Continuous High-Throughput Chemical Reactors

by
João Peres Ribeiro
1,
Margarida S. C. A. Brito
2,3,
Ricardo Jorge Santos
2,3 and
Maria Isabel Nunes
1,*
1
CESAM—Centre for Environmental and Marine Studies-Associated Laboratory, Department of Environment and Planning, University of Aveiro, Campus Universitário de Santiago, 3810-193 Aveiro, Portugal
2
LSRE-LCM—Laboratory of Separation and Reaction Engineering—Laboratory of Catalysis and Materials, Faculty of Engineering, University of Porto, Rua Dr. Roberto Frias, 4200-465 Porto, Portugal
3
ALiCE—Associate Laboratory in Chemical Engineering, Faculty of Engineering, University of Porto, Rua Dr. Roberto Frias, 4200-465 Porto, Portugal
*
Author to whom correspondence should be addressed.
Processes 2022, 10(10), 1916; https://doi.org/10.3390/pr10101916
Submission received: 29 June 2022 / Revised: 4 August 2022 / Accepted: 29 August 2022 / Published: 22 September 2022
(This article belongs to the Special Issue Recent Development of Mixing in Chemical Processes)

Abstract

:
This work aimed to test and optimise reactive Planar Laser-Induced Fluorescence (PLIF) methods for the visualisation of the micromixing regions in chemical reactors using standard PLIF and Particle Image Velocimetry (PIV) equipment with the laser source 512 nm. Two methods were tested: (i) an acid–base reaction with fluorescein as the reaction-sensitive tracer and (ii) Fenton’s reaction, with Rhodamine B as the reaction tracer. Both test-reactions were studied in stopped-flow equipment to define suitable operational conditions, namely the chemical composition of the inflow streams, the concentration of reagents and fluorophore, and suitable excitation light wavelength. The visualisation of the micromixing regions was tested in a continuous flow reactor with a T-jet geometry. A laser light sheet emitted from an Nd:YAG laser illuminated the axial section of the demonstration reactor. The mixing dynamics and the reaction course were visualised with the acid–base reactive PLIF images. Fenton’s reactive PLIF method showed the overall distribution of mixing and reaction regions. The main contribution of this work is benchmarking two methods with costs that enable the visualisation of micromixing regions in continuous high-throughput reactors.

1. Introduction

Mixing significantly impacts the performance of chemical reactors because reactions occur from the contact between reagents [1]. Mixing can be the limiting factor for industrial processes such as combustion reactions or biological initiation processes [2]. Its effect is especially evident in the scaling-up equipment that involves chemical reactions [1,2,3].
Micromixing can be assessed using physical and chemical methods. Physical methods are based on the incorporation of a non-reactive tracer in the fluid streams and either: (a) measurement of its concentration at different locations, including reactor outlet, as a function of time (e.g., Nadeau, et al. [4]) or (b) visualisation of pathlines inside the reactor by optical methods (e.g., Buchmann and Mewes [5], Buchmann and Mewes [6]). Thus, while the physical methods are related to the degree of the homogeneity of the fluid, chemical methods are based on test-reactions, where product yield or reagent consumption are used to infer the micromixing degree. Test-reactions with specific characteristics are used as chemical probes [7,8], enabling qualities such as the selectivity of a competitive reaction or a micromixing time, which are related to the degree of micromixing but give no information on its relation to the flow structure.
Table 1 and Table 2 summarise the methods published in the last 30 years for quantitatively studying micromixing based on competitive-consecutive and competitive-parallel reactions, respectively. All test-reactions have strong and weak points, as thoroughly discussed in the references cited in Table 1 and Table 2.
In recent years, another family of chemical methods for assessing micromixing has gained importance in the literature. These methods are based on the optical visualisation of the mixing process, allowing the quantitative measurement or assessment of mixing. Amongst them are two main types of optical methods suitable for this purpose: fluorescence-based techniques, particularly LIF (Laser-Induced Fluorescence), and chemiluminescence-based techniques. A list of chemiluminescence-based techniques is given in Table 3.
LIF experiments were introduced as a flow visualisation technique in the 1970s by Dewey [9], Owen [10] and Liu, et al. [11]. This technique consists of injecting a fluorescent tracer into the flow, which will be excited by a laser. The dye absorbs the energy emitted by the laser and then re-emits a portion of that energy as fluorescence. Fluorescence can be optically measured and used to determine mixing in a flow section [1].
A tracer is typically an organic fluorescent dye soluble in water. Fluorescein and rhodamine (Rhodamine 6G and Rhodamine B) are the most common LIF dyes. Fluorescein (also known as uranine or disodium acid) is particularly sensitive to pH [12]. Rhodamine B (also known as Rhodamine 610) [13,14], Rhodamine 6G (also known as Rhodamine 590) [15,16] and Rhodamine-WT [17] are relatively insensitive to pH, whereas the temperature sensibility was reported by Sakakibara et al. [18] and Kuzkova et al. [19]. Using non-reactive tracers, PLIF has different applications, such as:
  • Measurement of temperature fields in a gas-stirred ladle [20];
  • Study of the coolant mixing in reactor vessel down-comer [21];
  • Characterisation of interphase mass transfer of immiscible liquid–liquid system in a stirred tank [22];
  • Measurement of solute-induced Marangoni effect of a growing drop [23];
  • Characterisation of mixing efficiency in particle-laden Taylor–Couette flows [24].
In this work, fluorescein and Rhodamine B (RhB) are the two selected tracers in reactive LIF experiments. RhB is one of the commonly used tracers in PLIF experiments. Fluorescein was chosen as a marker because its fluorescence is sensitive to the pH of the reaction medium. Therefore, it can be used to visualise flow regions where a chemical reaction occurs. Variations in fluorescence will identify the pH changes in the reaction course. Differences in the fluorescence emission enable the tracking of the reactive fronts, which correspond to the regions controlled by the small-scale mixing, mainly at the molecular scale (micromixing). This method is named in this work AB-RPLIF. Although AB-RPLIF is best with 488 nm laser equipment, here, the method is tuned for the widespread Nd:YAG laser @532 nm that ships with most PIV/PLIF commercial equipment but is better adjusted for the RhB methods.
A second reaction using RhB is also tested in this work. A redox reaction system promotes the oxidation of the RhB organic tracer and the variation in emission wavelength. This reaction enables the visualisation of micromixing by the disappearance of the tracer in the reaction zones. This method is referred to hereafter as Oxi-RPLIF.
Tests on the performance of these two tracers contribute to implementing the reactive LIF technique in micromixing visualisation studies in continuous reactors with industrial applications, such as in opposed-jet mixers. The performance of the two techniques is benchmarked in T-jet mixers. The literature also reports other works for other reactors using AB-RPLIF [25,26,27] and Oxi-RPLIF [28,29,30].
This work aims to test and optimise two luminescence methods to characterise the space–time dynamics of micromixing in chemical reactors visually. The replacement of one of the reagents to improve reaction usability and the validation of these methods in T-jet micromixing assessment are novel features of this work. The principle of both methods is similar and based on the emission intensity measurement of a fluorescent marker included in the reactional medium. The methods addressed in this work have been previously discussed in the literature as LIF methods to replace more established procedures.

2. Experimental Section

2.1. Test-Reactions

For the AB-RPLIF method, the hypothesis of a reaction between a strong acid and a strong base was first considered. The first preliminary test was conducted for a reaction between hydrochloric acid, HCl, and sodium hydroxide, NaOH [2,54,55]. The extreme sensibility of pH to the smallest variation in the acid and base concentrations hinders the results’ reproducibility.
Therefore, the AB-RPLIF method was implemented with a reaction between a weak acid (phosphoric acid) and a strong base (NaOH). The titration curve of a weak acid and a strong base is smoother than the curve using HCl. This fact enables easy detection of the increase in pH and the respective change in fluorescence emission. The acid–base test-reaction system used is
H 3 PO 4 + NaOH NaH 2 PO 4 + H 2 O
NaH 2 PO 4 + NaOH Na 2 HPO 4 + H 2 O
Na 2 HPO 4 + NaOH Na 3 PO 4 + H 2 O ¯
H 3 PO 4 + 3 NaOH Na 3 PO 4 + 3 H 2 O
As with most acid–base reactions, the reaction scheme in Equations (1)–(3) is quasi-instantaneous, and thus the kinetic rate constant is κ . This is necessary for visualising the micromixing regions without any delay that would shift the location of the micromixing.
Fluorescein is the tracer used in this test-reaction (Equation (4)). When fluorescein is excited by a laser, the emission intensity of fluorescein depends on the local pH. When an acid stream containing fluorescein is mixed with a base stream, the local pH modification and respective changes in the mixture’s emission intensity can be used to monitor the neutralisation reaction kinetics. The variations in the emission intensity enable the visualisation of micromixing dynamics in the reaction system.
The second test-reaction studied in this work uses Fenton’s reaction to quench the fluorescence signal so that the reactive mixing process can be recorded quantitatively [1]. Fenton’s reaction is a redox reaction that is induced by the coupling of iron, Fe2+, and hydrogen peroxide, H2O2,
Fe 2 + + H 2 O 2 Fe 3 + + HO + OH
HO + RhB RhB oxi
In this approach, the fluorescence tracer RhB is dissolved in one or both streams to be mixed, being oxidised with the hydroxyl radical (HO•) (Equation (6)). The vanishing of RhB enables the reaction kinetics based on the relationship between emission and fluorophore concentration.

2.2. Experimental Procedure—Study of the Test-Reactions

In the acid–base reaction, the concentration of H3PO4 (Fisher, >97% purity) was determined according to the best balance between operational costs and the pH values for fluorescence detection. Based on that, the H3PO4 concentration of 0.100 M was prepared, and the concentration of NaOH (Fisher, 99.3% purity) was defined from the H3PO4:NaOH titration curve, [NaOH] = 0.165 M, for pH = 7 .
For Fenton’s reaction, different concentrations of H2O2 (Fisher, >97% purity) and Fe (FeSO4 · 7H2O, Fisher, >97% purity) were tested according to the vanishing rate of RhB. For higher concentrations of Fe and H2O2, the oxidation rate is higher, and simultaneously, the formation of iron sludge is observed as the result of the conversion of Fe2+ to Fe3+. For lower concentrations, the reaction course is slower, and there is a decrease in the production of iron sludge. From those results, the concentrations used were 2% H2O2 (wt./v) and 0.010 M Fe2+.
The suitable operating conditions to quantify mixing from these two test-reactions were tested in an SX.18MV Reaction Analyzer Stopped-Flow (SF) apparatus from Applied Photophysics. An ozone-free xenon lamp (cut off at 250 nm) was used as a light source. A monochromator connected to the sample handling unit optical cell controlled the excitation wavelength with a light guide. The sample handling unit consisted of two drive syringes with plungers moved by a pneumatic ram. Downstream of the driving syringes, the reagents are set in contact in the 10 µL mixing chamber and flow down through a 20 µL optical cell, which consists of a silica square tube of 10 mm in length. A Photomultiplier Tube (PMT) is installed in a normal position to the optical cell (optical path length is 2 mm) to detect the absorbance or the emission intensity according to the chosen operating mode. The PMT converts the light into an electrical signal to determine the absorbance or the fluorescence (emission intensity).
The absorption spectra of fluorescein (Panreac, 99% purity) and RhB (Acros, 98% purity) were determined using the PMT in a wavelength range from 250 to 700 nm. However, the equipment layout did not enable the assessment of tracers’ emission wavelength, and therefore, the emission peak was not estimated in this work. The excitation peak was predicted from the absorption spectrum. This value was compared to the one in the literature. The comparison of both values validates the method.
The set of experimental conditions was designed aiming to assess the conditions under which these reactions could be efficiently used as test-reactions for mixing studies. The experimental conditions are summarised in Table 4.
Solutions with different concentrations of RhB and fluorescein were prepared, and the absorption spectrum (from 250 to 700 nm) was determined in SF for each concentration (assays F1 and RhB1 in Table 4). The excitation peak was determined from the absorption spectrum.
Karasso and Mungal [60] tested the relationship between the emission intensity and the fluorescein concentration for an excitation wavelength of 532 nm. The limit of linearity concentration is 10 mg·L−1 for fluorescein. However, Karasso and Mungal [60] reported that the fluorescence intensities at this concentration range are too low for imaging. Therefore, the response of fluorescein was tested for higher concentrations in F2 (Table 3).
The concentration range was defined based on the operation restrictions of the measurement equipment: high enough to minimise equipment noise but within the maximum limit of detection. Linearity range was also considered while defining the studied range. Regarding pH (in AB-RPLIF), assays F1 and F2 were performed aiming at pH = 7 upon mixing/reaction to ensure the highest emission intensity by fluorescein. It also corresponds to a smoother zone of the H3PO4 + NaOH titration curve, which minimises variation in the observations due merely to the dosing of chemicals to the mixing chamber. Assay F3 was performed in a wide pH range to explore the effect of this parameter on fluorescein’s emission intensity. Assay F4 was performed at pH = 2, since fluorescein was to be supplied with the acid (H3PO4) stream to ensure minimal emission under those conditions.
For RhB, the linearity range for an excitation wavelength of 532 nm was already reported by Mortensen et al. [61]. Thus, the dependence between the concentration of RhB and its fluorescence was not determined experimentally.
The readings were repeated after 24 h to assess the impact of ageing on the spectra, which could limit the method’s usability within that period. This period represents the preparation of the reagents from one workday to the following (assays F4 and RhB2, Table 3).
An additional parameter for the acid–base reaction was studied: the relationship between pH and fluorescence. Fluorescein solutions were prepared at different pHs, and the emission spectra were determined (assay F3, Table 3).

2.3. Experimental Procedure—Validation of Test-Reaction in a T-Jet Mixer

The RPLIF methods were tested in a T-jet reactor, which consists of two opposite feeding channels connected to a mixing chamber making up an angle of 90°. A schematic drawing of the T-jet geometry used in this work is shown in Figure 1.
When two liquid streams are fed through the opposed jets, the reaction occurs in the mixing chamber promoted by the mixing of the two streams. The mixture leaves the mixing chamber through an open outlet. The characteristic dimensions of T-jets are also illustrated in Figure 1: the width of the mixing chamber, W , the width of injectors, w , and the depth of the mixing chamber, d .
Many studies on T-jets show that the mixing and flow dynamics in the mixing chamber depend on the operating conditions, primarily associated with the Reynolds number. However, Sultan et al. [62] reported from PLIF images and Computational Fluid Dynamics (CFD) simulations that the geometric parameters also affect the flow dynamics. Thus, the flow regime in T-jets depends on the momentum ratio of the jets, the chamber-to-injector width or chamber width-to-depth ratios and the jet’s Reynolds number, which is defined as [62]
Re = ρ v inj w μ
where ρ and μ are the density and the viscosity, respectively, and v inj is the injector fluid velocity.
Different combinations of operational and geometrical parameters result in four flow regimes in T-jets:
Segregated or stratified flow regime—a steady flow regime where each side of the mixing chamber contains mainly one of the fluids. The fluid stream flows from the jets to the outlet delimited by the segregation plane that coincides with the mixing chamber axis and is normal to the inlet’s axes [62,63,64].
Vortex flow regime—steady flow regime characterised by the formation of Dean vortices on each side of the mixing chamber. These vortices are characterised by a helicoidal movement inside of each liquid stream, and their rotation axis is aligned with the mixing chamber axis [62,63,64,65,66];
Engulfment flow regime—the symmetry is broken, and the fluid streams injected by each injector rotate over the chamber axis, creating a single vortex that engulfs both streams. This promotes the transport of fluid from one half of the chamber to the other [62,63,64,67];
Chaotic flow regime—this flow regime is characterised by the formation of a vortex street, resembling a von Karman vortex street, consisting of the shedding of vortices from the opposed jet impingement point, which evolves throughout the mixing chamber, promoting the fast mixing of the fluid streams (Sultan et al., 2012) [62].
Sultan et al. [62] and Sultan et al. [68] defined the transition regime as the onset of a chaotic flow regime, which is characterised by the formation of mixing structures, i.e., vortex streets. The critical working conditions for the onset of self-sustainable chaotic flow regimes are W / w = 6 , W / d 2 and Re above 300.
The reactive PLIF (RPLIF) methods were implemented in a T-jet reactor with a typical geometry shown in Figure 1. In this work, only one geometry was tested with a height of H = 50   mm , a mixing chamber width of 6 mm, a width of injectors of 1 mm and a depth of 4 mm (W6w1d4). This geometry was selected based on previous studies, where it was observed that this is the best combination for the onset of the self-sustainable flow regime [62].
In the AB-RPLIF method, the acid stream, phosphoric acid (H3PO4), and fluorescein were stored in one of the tanks, and the base stream, sodium hydroxide (NaOH), was stored in the other one. Three different flow regimes were tested: Re = 50 , Re = 150 and Re = 200 , where Re is defined from the width of injectors (Equation (3)). The operating conditions were symmetric, i.e., the acid and liquid base streams have the same viscosity, density and flow rate, i.e., Re acid = Re base . Experiments were conducted by injecting the acid fluid stream through the left-side injector and the base fluid stream through the right-side injector.
In the Oxi-RPLIF method, the iron (Fe2+, as FeSO4) was stored in one of the tanks, and the hydroxide peroxide (H2O2) was stored in the other one. Both streams were doped with Rhodamine B (RhB). Oxi-RPLIF was tested in T-jet mixers for two different flow regimes: Re = 50 and Re = 150 . The operation conditions are symmetric, i.e., solutions delivered from both injectors have the same viscosity, density and flow rate, i.e., equal Reynolds number, Re iron = Re H 2 O 2 .
The RPLIF methods require using a laser sheet that will illuminate the plane within the flow of the acid stream doped with fluorescein (in AB-RPLIF) or the hydrogen peroxide and iron dyed with RhB (in Oxi-RPLIF). Fluorescein and RhB will emit fluorescence enabling the visualisation of the reactive regions. UV light contributes to the degradation of RhB, and this is associated with an increase in absorbance below 300 nm. Due to this fact, light emission at <300 nm should be avoided because it can induce RhB degradation in regions without being associated with the Fenton reaction.

3. Results

3.1. AB-RPLIF Method

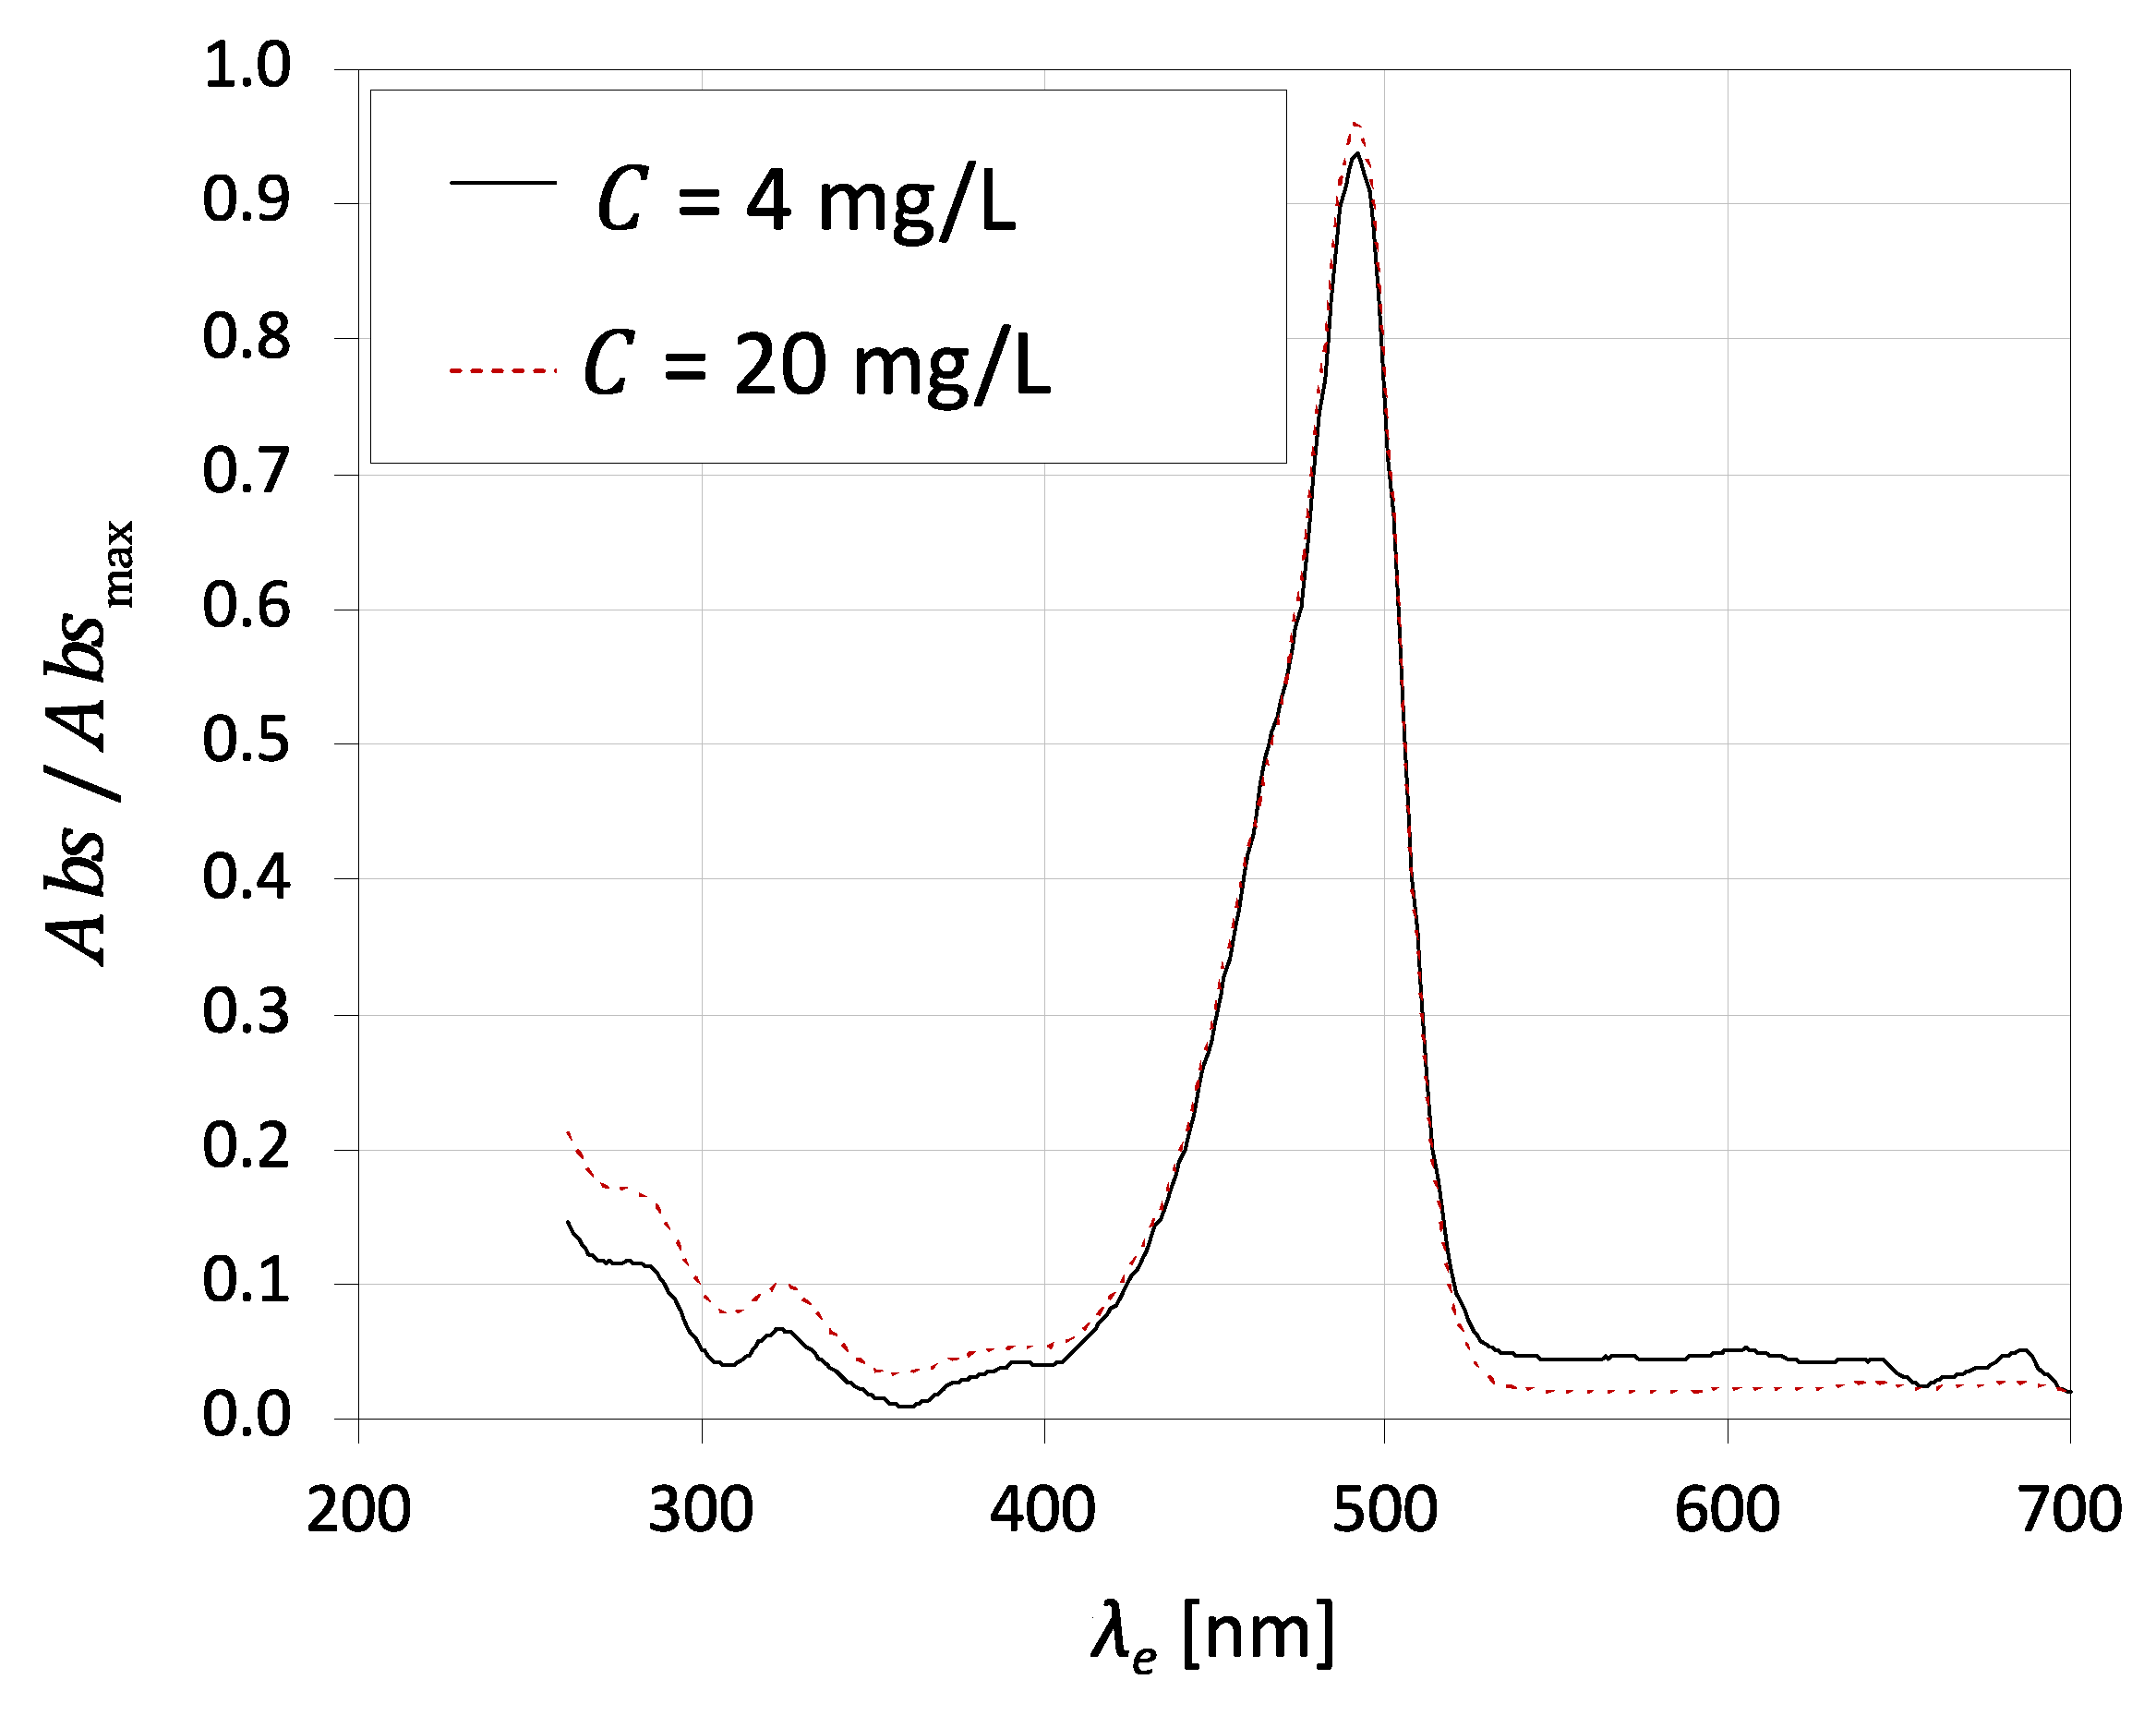
The absorption spectrum relates the excitation wavelength and the absorbance of the molecules of the fluorescent tracer. Figure 2 shows the absorption spectra of fluorescein for an excitation wavelength from 200 to 700 nm for two distinct concentrations of 4 mg·L−1 and 20 mg·L−1. The excitation peak of this dye is near 490 nm for both concentrations, which agrees with the value in the literature [69]. On the other hand, the literature points to an emission peak of 514 nm and a red tail that continues to 640 nm [69].
The successful implementation of this technique in flow phenomena studies requires selecting suitable working conditions. The laser should have an emission peak near the fluorescein’s excitation peak, approximately 490 nm.
Fluorescein is frequently combined with an Ar-ion laser for quantitative LIF imaging experiments in flow phenomena studies [70,71]. The efficient excitation of fluorescein molecules occurs at the 488 nm line of an argon-ion laser. Calibration curves showed a linear relationship between the fluorescence and the dye concentration, which is the desired behaviour. This result agrees with the Beer–Lambert law, which relates the absorbance and the properties of the absorbing species, such as the concentration of species.
Karasso and Mungal [60] tested the combination of fluorescein with a pulsed Nd:YAG laser. Nd:YAG lasers enable a significant temporal resolution and are easily implemented and widespread in performing 2D images. The Nd:YAG laser used by Karasso and Mungal [59] and most PIF/PLIF setups operate at 532 nm. The absorption spectrum of fluorescein (Figure 2) shows a deficient value for an excitation wavelength of 532 nm. Karasso and Mungal [60] tested the fluorescence and dye concentration linearity for an Nd:YAG laser. The results show a linear region up to 10 mg·L−1. Then, higher fluorescein concentrations were tested to achieve the same signal level obtained with an Ar-ion laser. Results show that the signal calibrations violate the Beer–Lambert law, and a non-linearity of fluorescence versus local excitation intensity is detected likewise. Therefore, the combination of fluorescein and an Nd-YAG laser will bring problems in the image post-processing and the respective quantification from the relationship between the concentration and fluorescence. However, this combination could naturally be used for qualitative imaging or flow visualisation.
Since the Nd:YAG laser is widely used in experimental fluid mechanics setups, further studies on emission intensity for higher concentrations of fluorescein are addressed in this work. The fluorescence of fluorescein was measured for a concentration range between 4 and 30 mg·L−1. Figure 3 shows the electric potential difference detected versus the concentration of fluorescein at four excitation wavelengths: Figure 3a for 350, 488 and 500 and Figure 3b for 532 nm. The data were split into two plots because for 532 nm, the values are orders of magnitude below the ones obtained for other wavelengths.
The emission intensity displays a linear trend (R2 > 0.97) with fluorescein concentration up to at least 30 mg·L−1 for all tested excitation wavelengths, as shown in Figure 3. The large values of emission intensity are detected at λ e = 488   nm , which corresponds to the peak in absorption spectra (Figure 2). For λ e = 532   nm , the electric potential is low, and therefore, weak fluorescence will be emitted in a range up to 30 mg L−1. Despite this quantitative analysis, the fluorescein with the Nd-YAG laser is only demonstrated for qualitative imaging of micromixing.
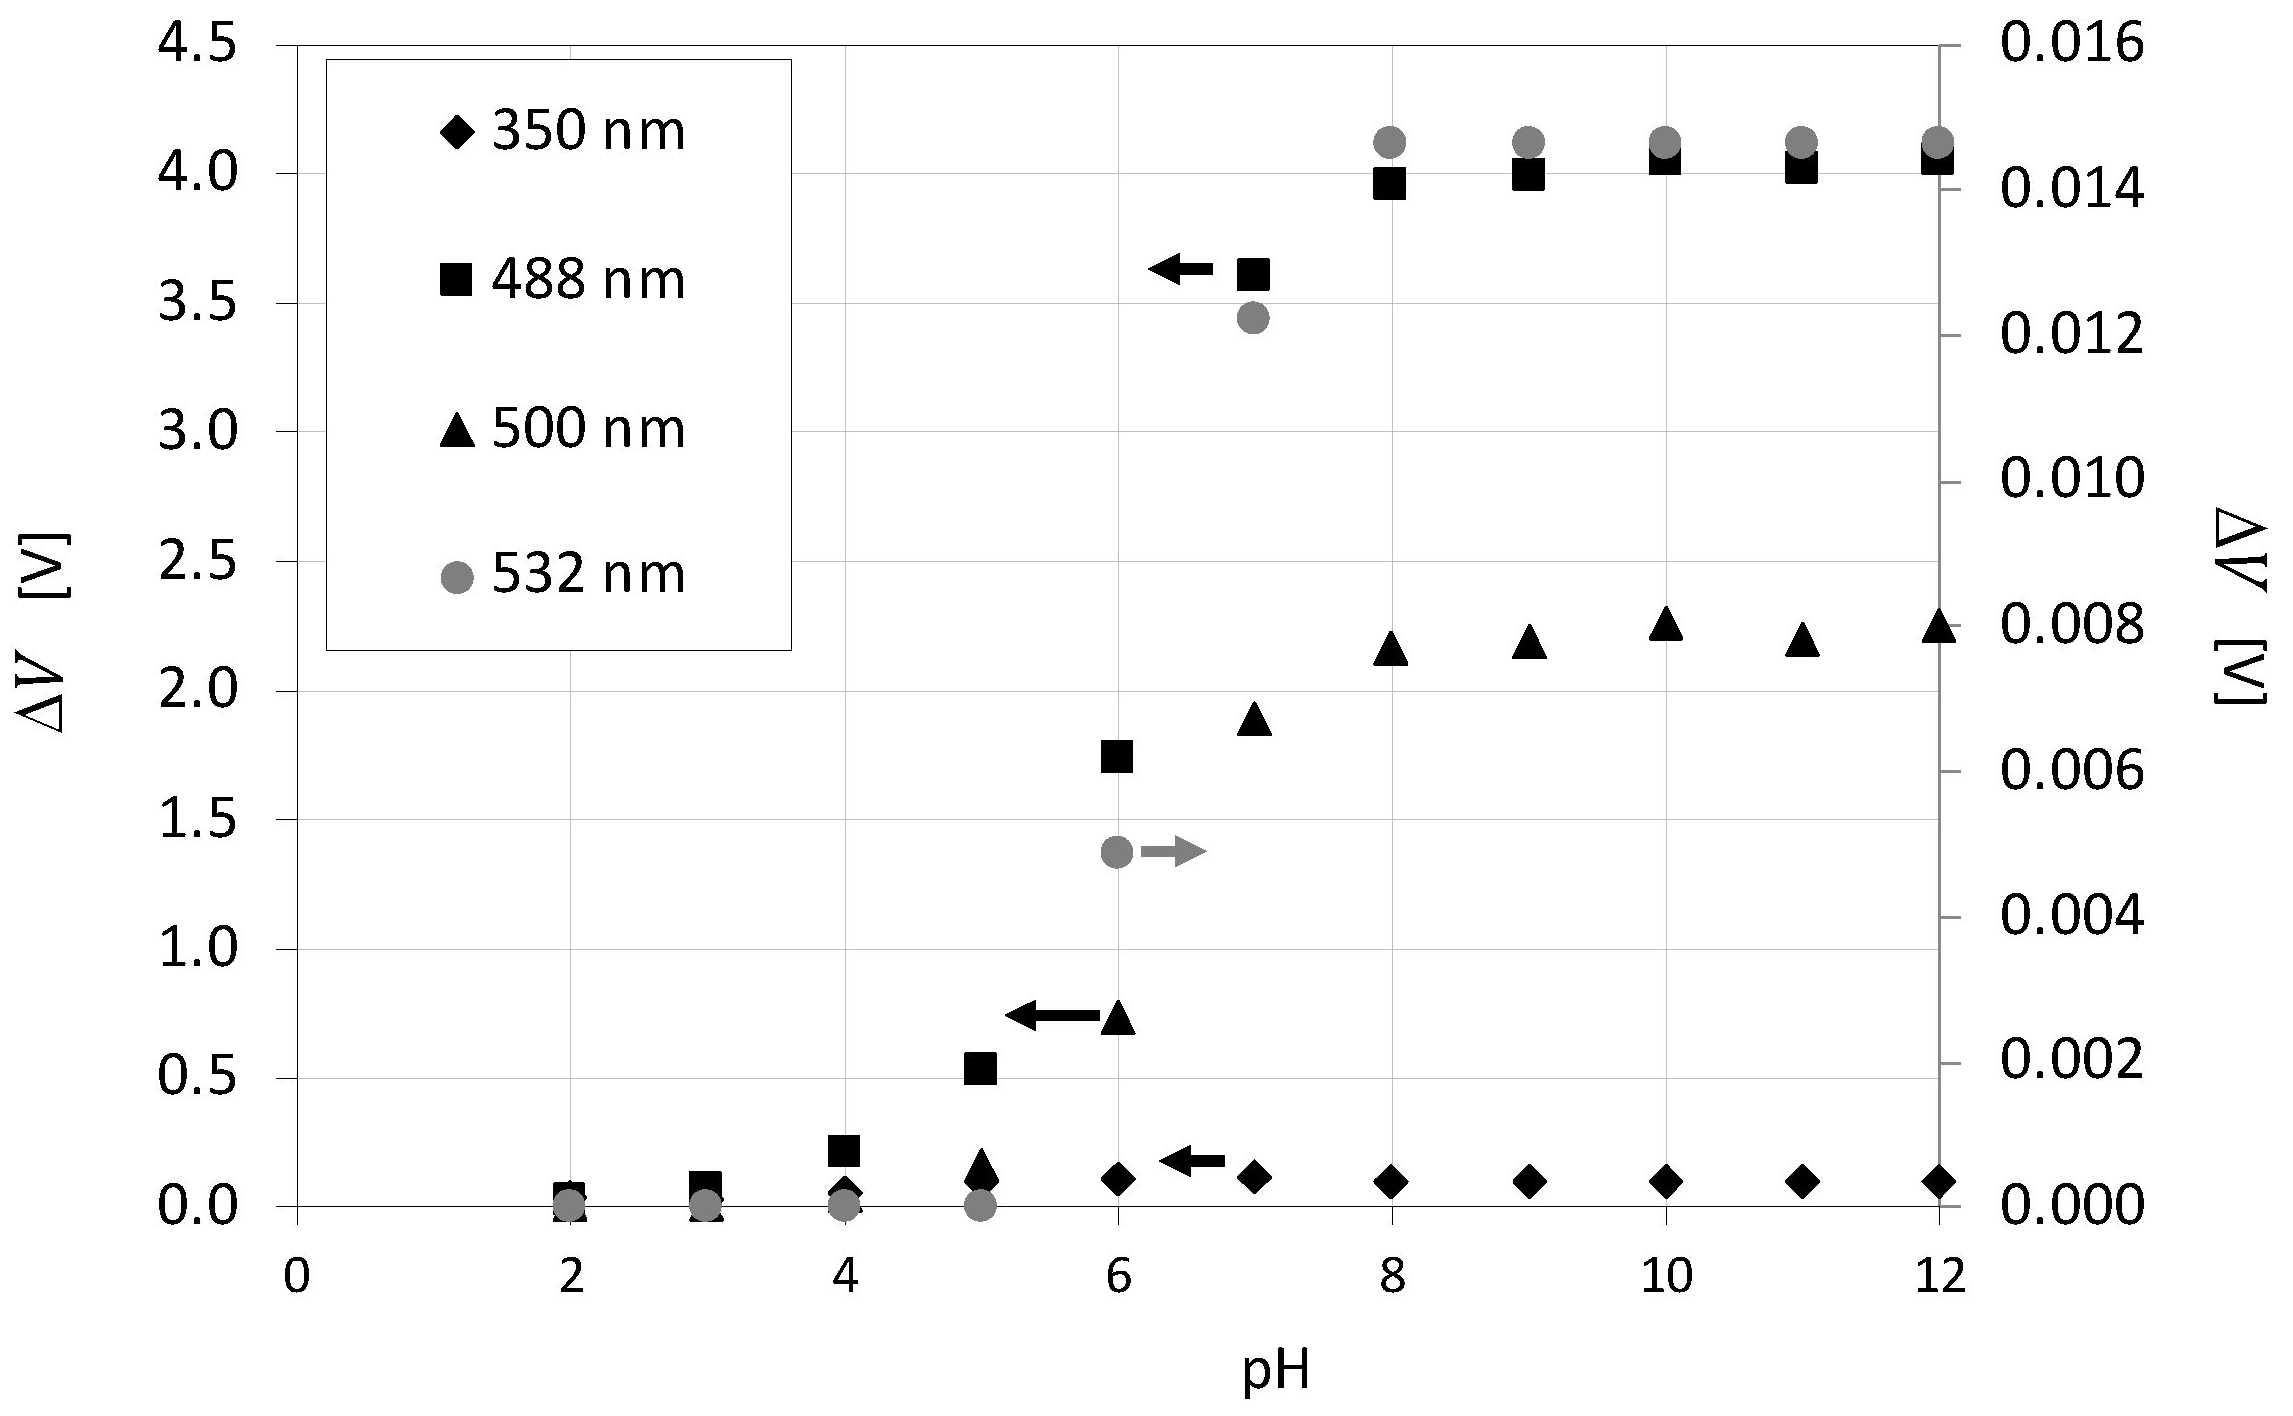
The influence of pH on the emission intensity of fluorescein is also determined by adding NaOH solution to H3PO4. Figure 4 shows the electric potential difference detected for fluorescein versus pH at four excitation wavelengths: 350, 488, 500 and 532 in Figure 4. Likewise, in Figure 3, the wavelengths for 350, 488 and 500 nm are in a separate plot than those for 532 nm due to the large difference in values between data series. As observed in Figure 4, the fluorescein emits for pH above 3 and sharply increases in the pH range from 5 to 8. Above pH = 8, there is no influence of pH on emission. These results corroborate the findings of Kola and Amataj [72] and Lehwald et al. [2]. The curves displayed in Figure 4 overlap the pH range where the H3PO4:NaOH titration curve is smooth, enabling the detection of minor differences in mixing degree at the local scale.
These results show that qualitative mixing measurements employing this test-reaction could be conducted for concentrations of fluorescein up to 30 mg·L−1 with an Nd:YAG laser, under excitation wavelengths from 475 to 532 nm.
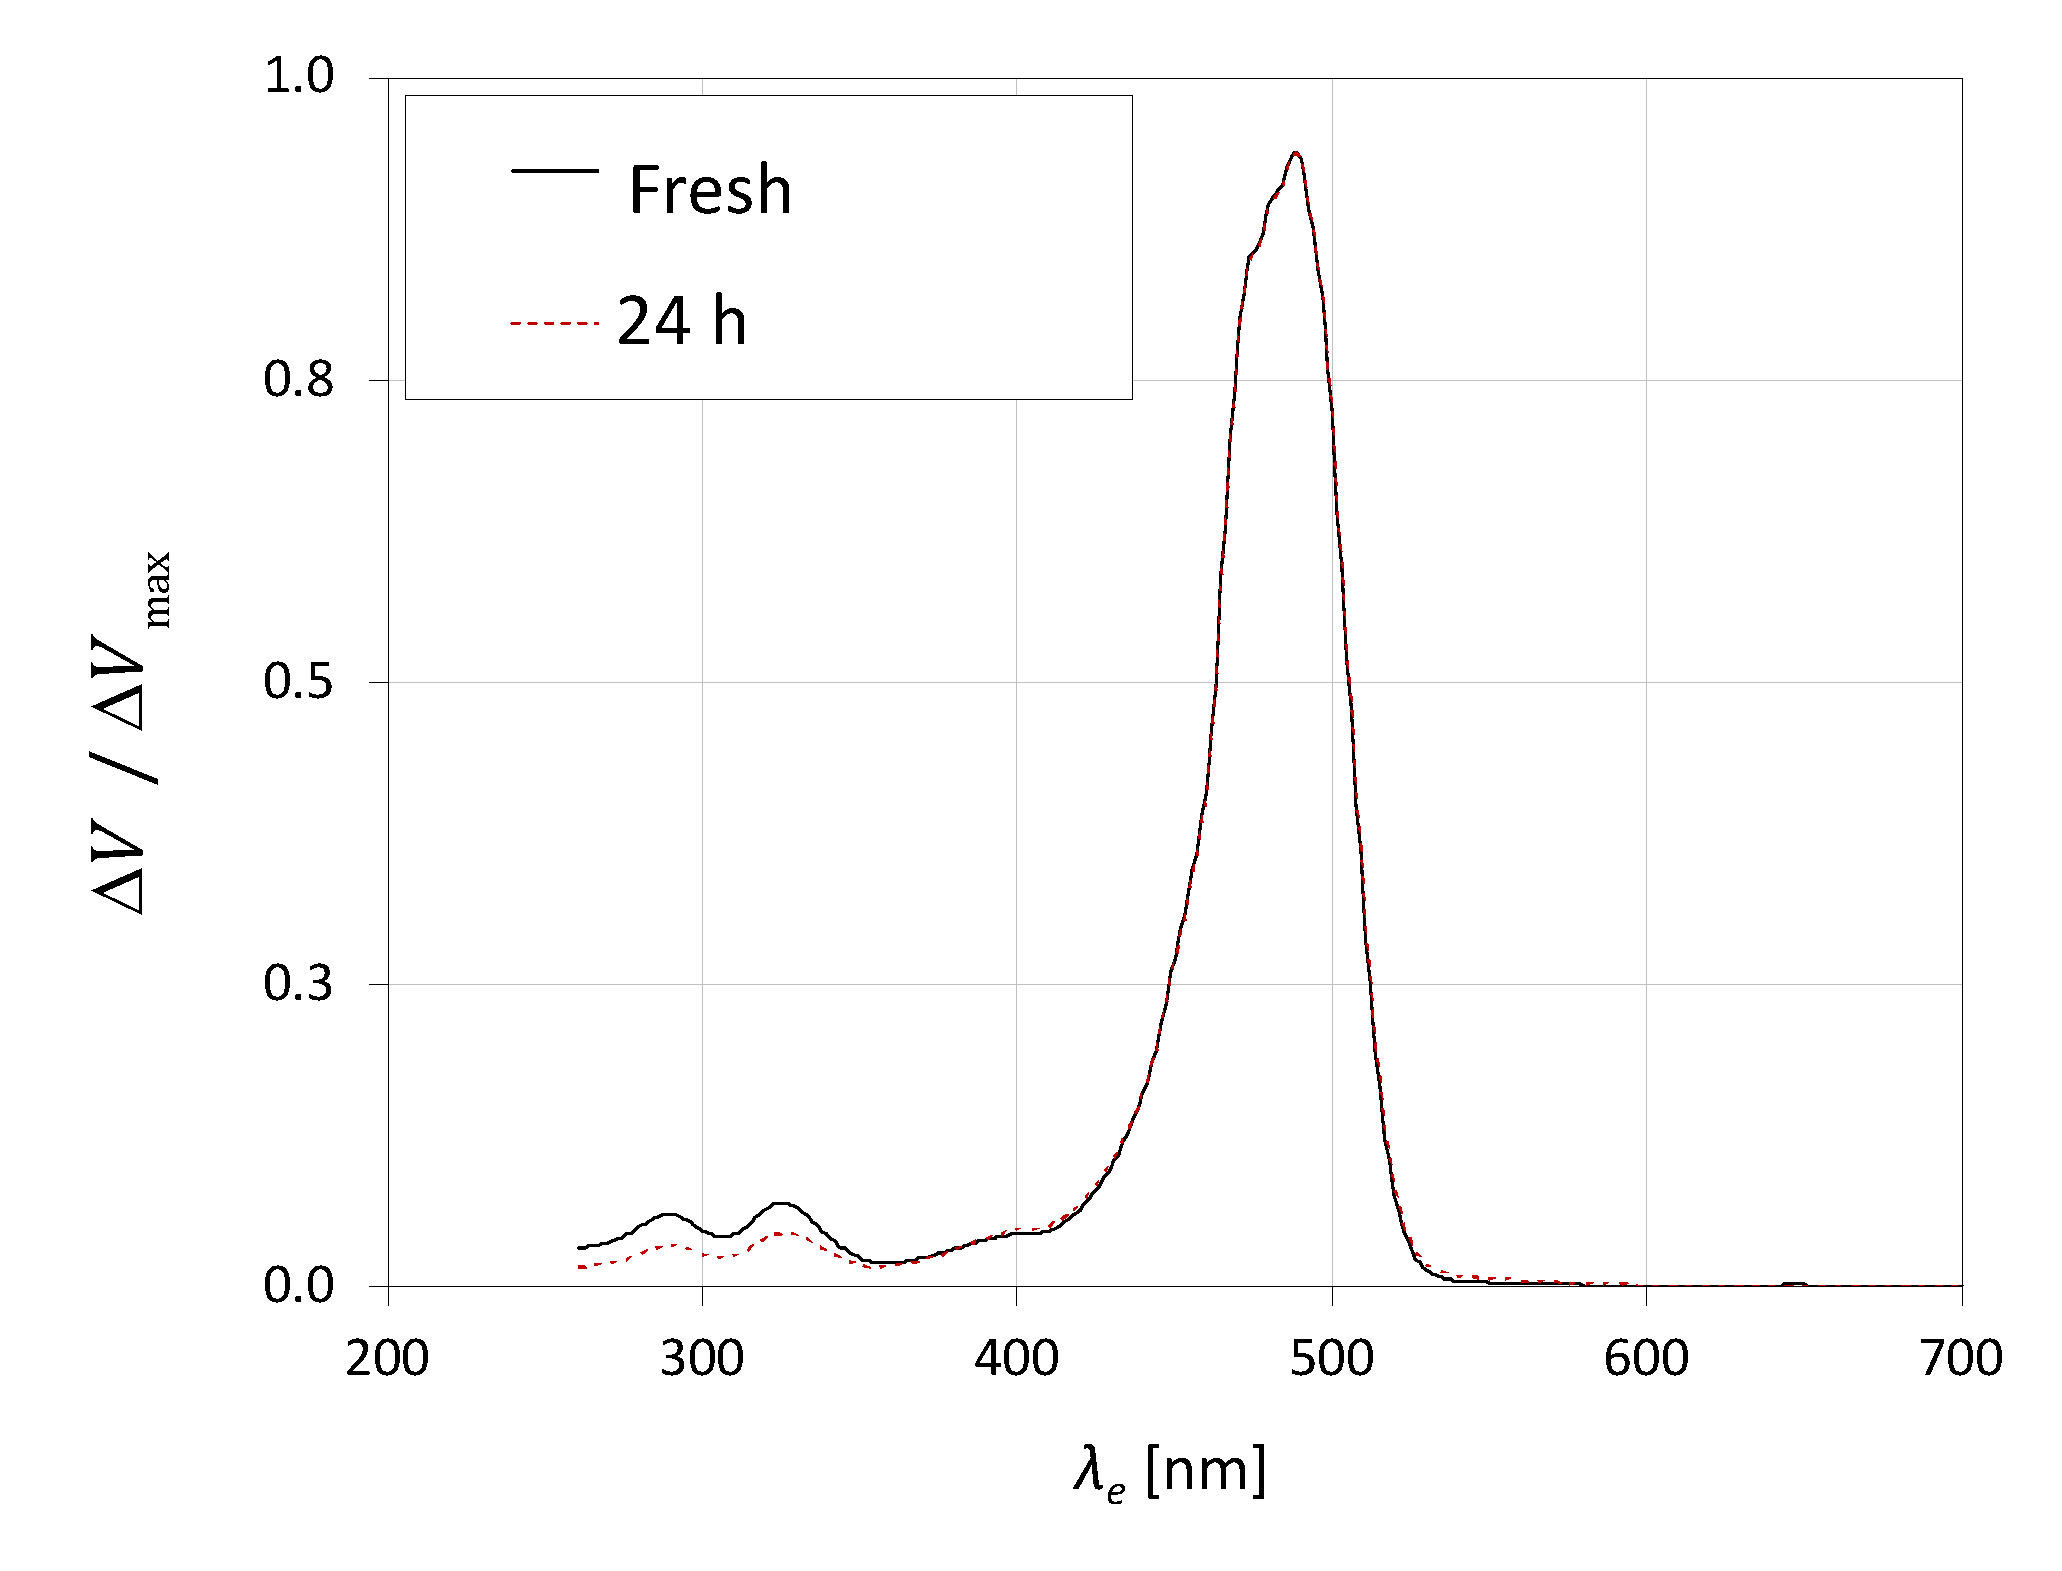
Figure 5 shows the electrical potential difference versus the excitation wavelength for fresh fluorescein and the repetition of this test one day later. Ageing of reagents did not impact the intensity emission in any way that would prevent the use of this test-reaction within a 24 h period. This is another encouraging feature of this method. Nevertheless, in the demonstration case, the reagents were always fresh.
The implementation of this reaction scheme coupled with the imaging of fluorescence emission in a plane illuminated by a laser shows the reactive fronts in a flow. This method would show the structure of interfacial area generation between two reactants being mixed.
A narrow-band filter is usually placed in front of the camera lens to only capture the fluorescence wavelengths in the performance of the AB-RPLIF method in T-jet mixers. As the emission peak of fluorescein is approximately 510 nm, the narrow-band filter used in this method may filter the wavelengths in a range > 500 nm empowering the capture of the emission wavelengths of fluorescein and filtering the light of the laser. The fluorescein concentration in the RPLIF experiments for the characterisation of mixing in the T-jets was 22 mg·L−1, which is in the linear region for this tracer. These results are shown in Figure 6, Figure 7 and Figure 8.
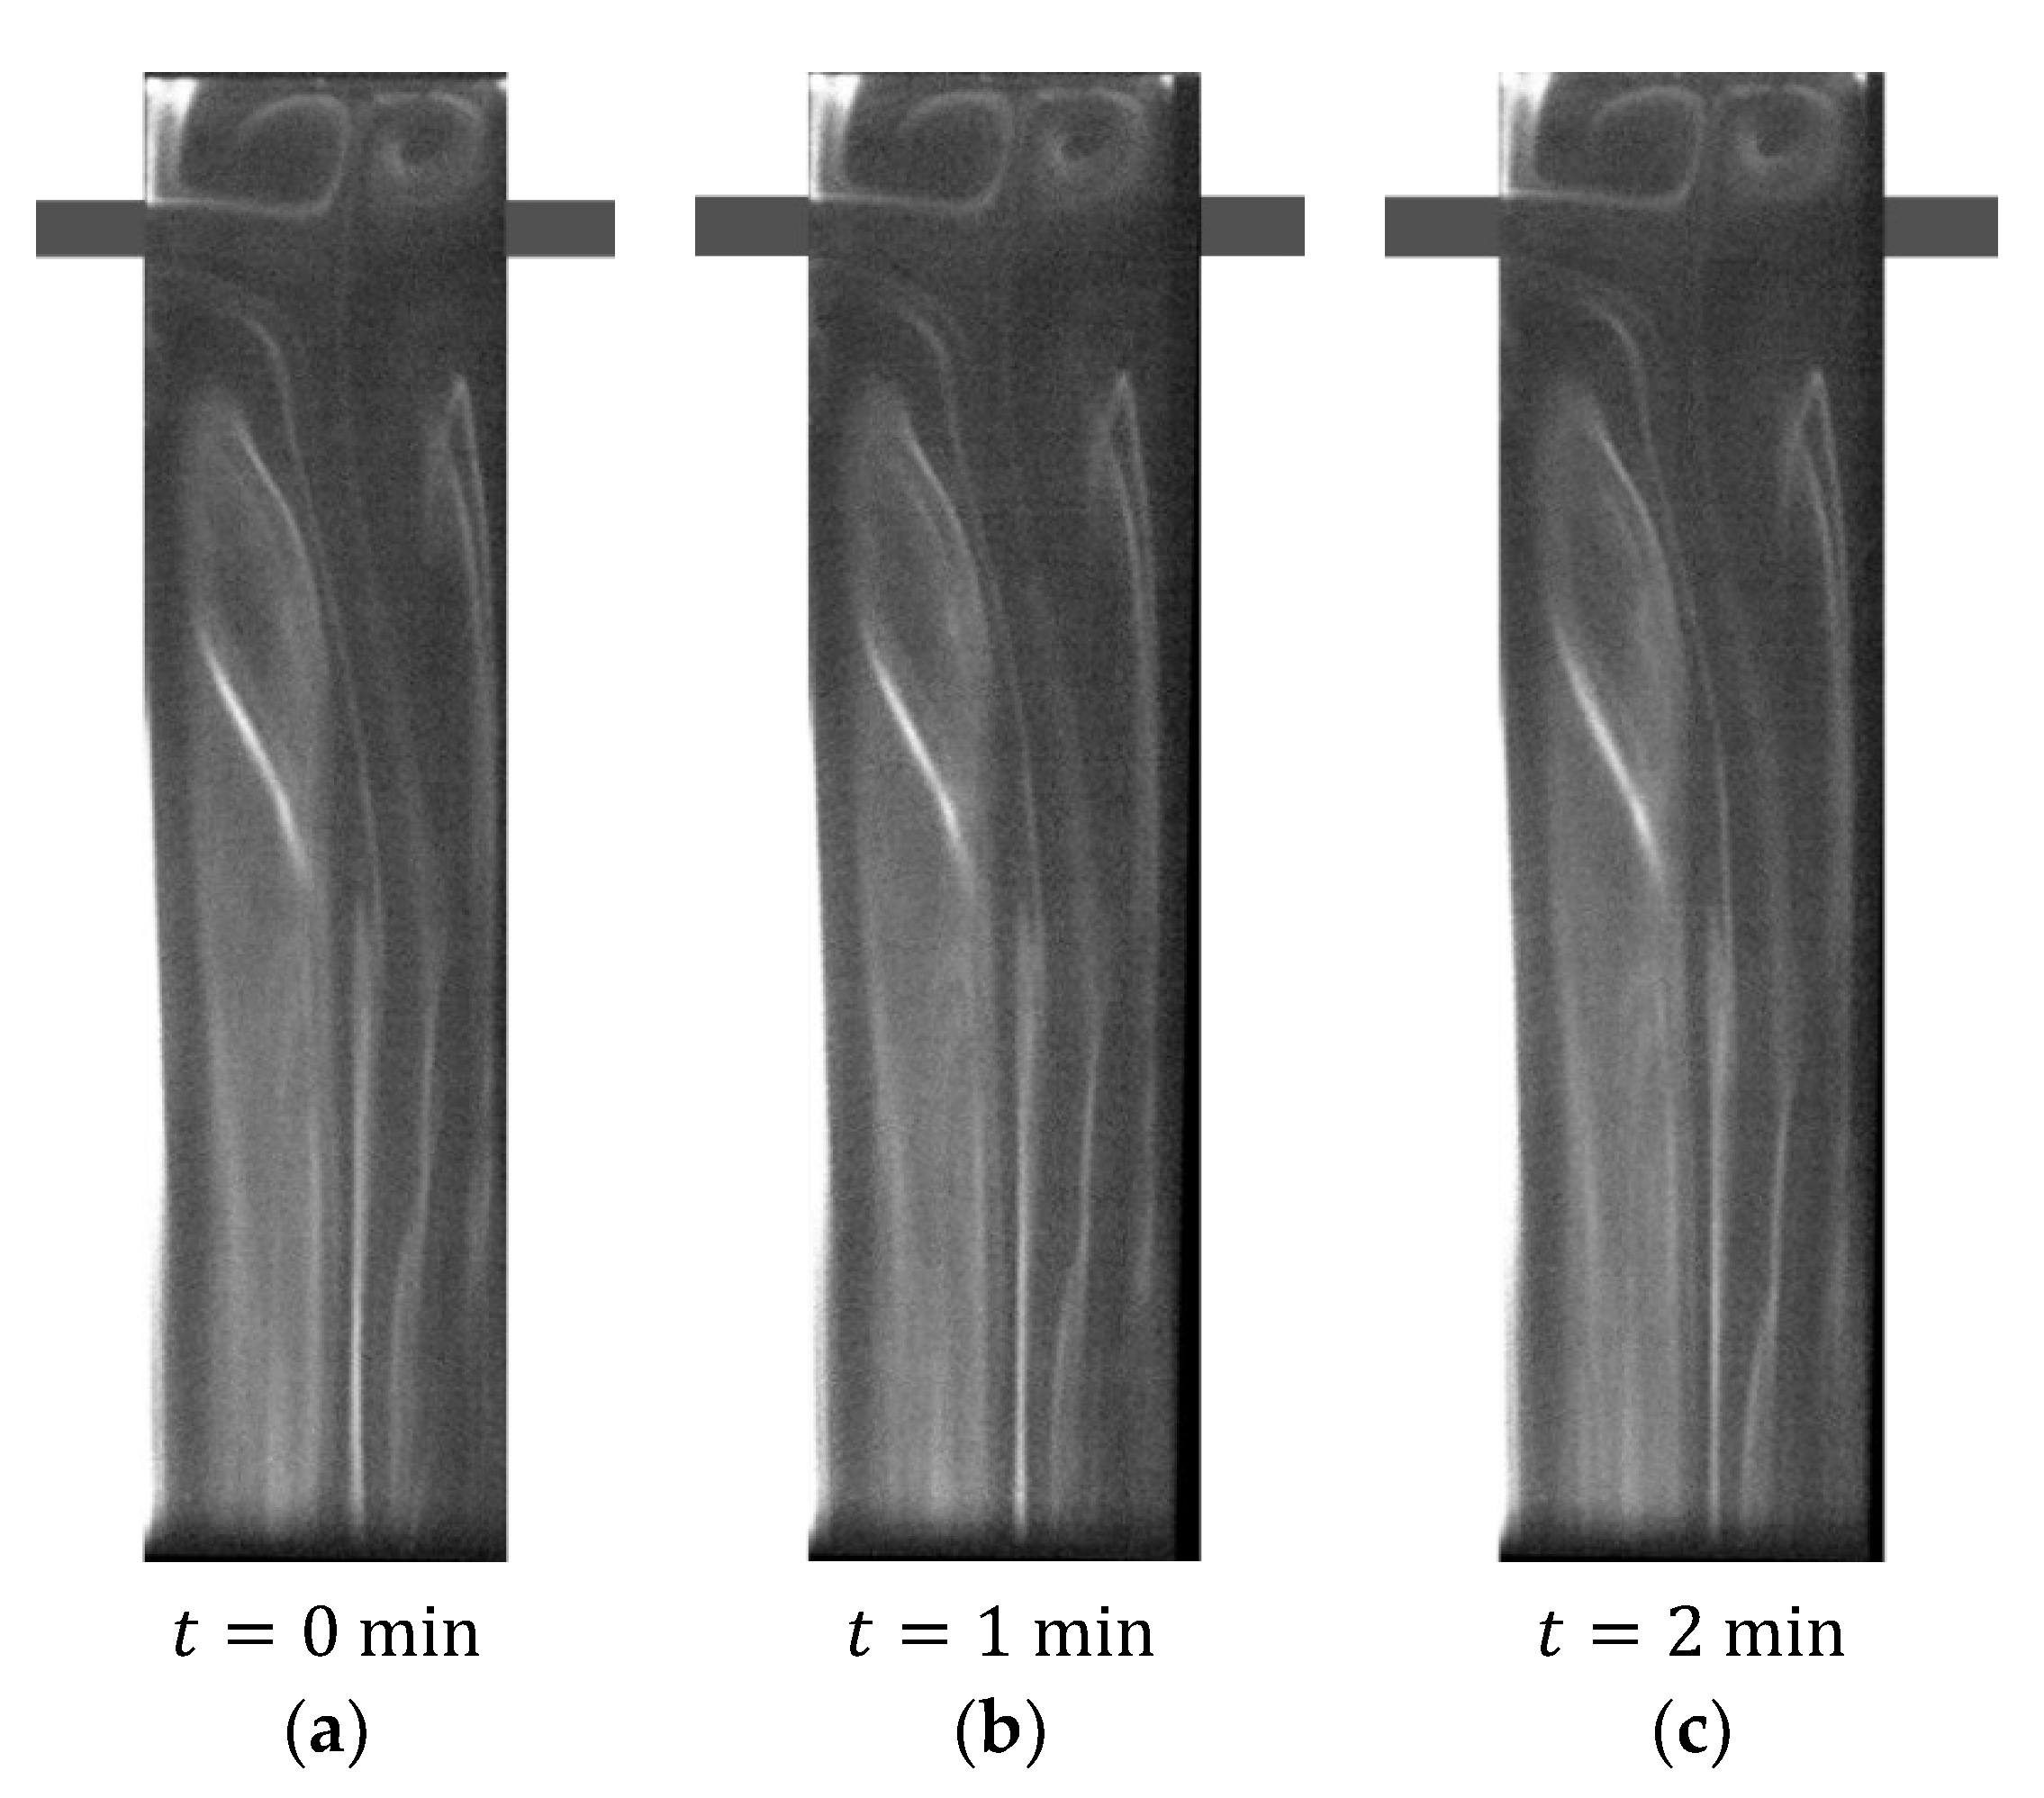
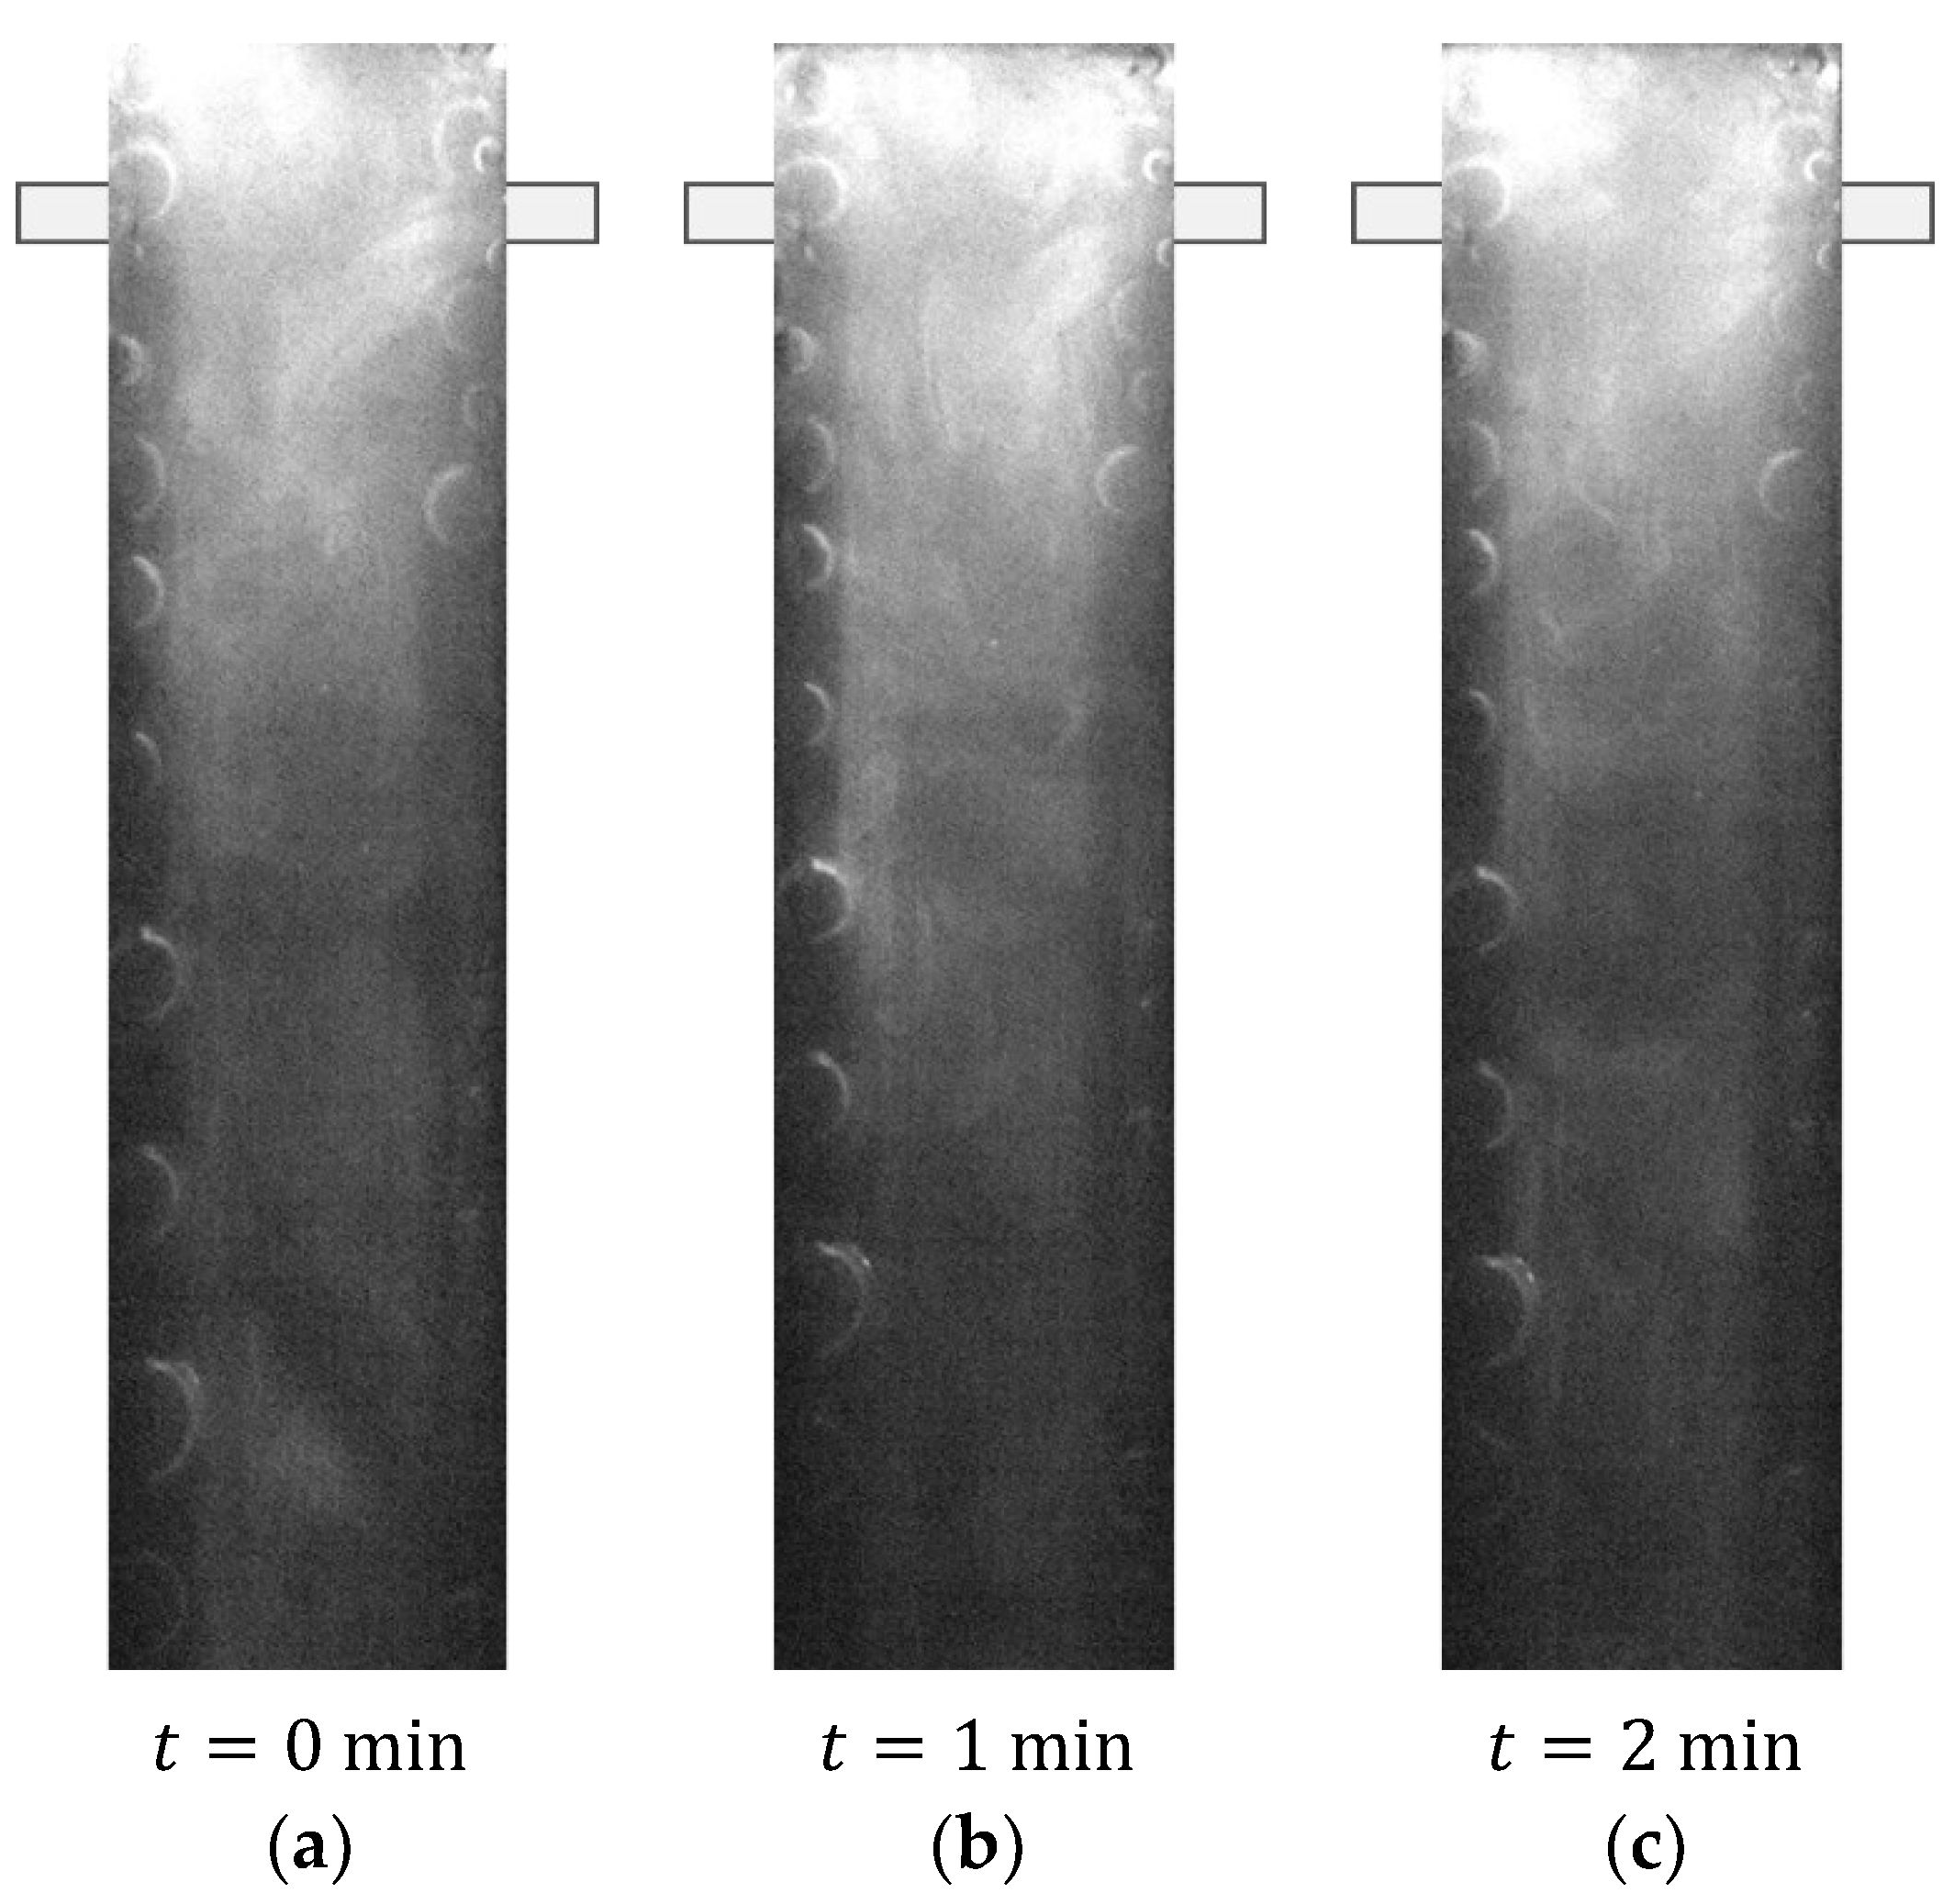
Figure 6 shows RPLIF images obtained at the plane defined by the mixing chamber and injector axis for the AB-RPLIF method at Re acid = Re base = 50 . The three images in Figure 6 are obtained at three different time instants during the same experimental run extending over more than a minute. This time window covers several passage times in the T-jets that are of the order of 10 1   s . The experiments were run for more than five minutes prior to image acquisition. This initial time is disregarded, and the time of the first acquisition in the reactive PLIF is set to t = 0   min . At the inlet, the acid fluid stream has p H 2 , and thus the emission intensity of fluorescein was approximately 0, as observed in Figure 4. Therefore, the fluid issuing from the jets shows a dark colour in PLIF images. These PLIF images show that the fluorescein concentration is enough for imaging, even for λ e = 532   nm .
PLIF images in Figure 6 show that for Re = 50 the flow dynamics are too weak to cause any evolution in the patterns of the reacting front, even over a large period well above the fluid passage time in the mixing chamber. Figure 6 also shows the appearance of white flow patterns in the mixing chamber, which results from increasing the pH of the acid stream that is associated with an increase in the emission intensity of fluorescein. These visualisations show that the acid–base reaction of H3PO4 and NaOH occurs in the T-jet mixing chamber, and the flow regime is commonly named the vortex flow regime [73].
These results agree with Bothe et al. [63] and Hoffmann et al. [74], who reported that, in this flow regime, one fluid is transported from one side to the other due to convective mechanisms. Although these convective mechanisms are not visualised using non-reactive PLIF methods, the appearance of a white colour fluid in the AB-RPLIF method enables us to conclude that the convective mixing phenomena promote the reaction of H3PO4 and NaOH. These convective mechanisms consist of two parallel Dean vortices, particularly visible from the pathlines of the segregated regime, which is generally referred to in T-jet literature as a vortex flow regime, reported by Soleymani et al. [64] and Soleymani et al. [66].
In Figure 6, the formation of a vortex is also observed on each side of the mixing chamber head. Sultan et al. [62] already reported the formation of two upper vortices from the intrusion of fluid having a different colour in one of the jet streams. The two upper vortices are symmetric and roundish. These vortices are only observed in T-jet geometries with a headspace above the inlets, which is the least used configuration in the literature. The residence time in these vortices is generally large, compared with the flow passage time in the mixing chamber; therefore, there is a local accumulation of reaction product in this region.
Figure 7 and Figure 8 also show AB-RPLIF images obtained at the plane defined by the mixing chamber and injector axis at Re acid = Re base = 125 and 200, respectively. For these cases, the flow is no longer in a steady state (segregated or vortex flow). In Figure 7 and Figure 8, the time instants identified with letters a, b and c are separated by more than 10 passage times. Therefore, the flow patterns in different images are uncorrelated.
In Figure 7, the opposite jets are impinged at the mixing chamber axis and directed towards the outlet, forming vortices on both sides of the jets. These vortices evolve throughout the mixing chamber towards the outlet: vortex street. Mixing two streams promotes the acid–base reaction; thus, the pH increases throughout the mixing chamber. This results in an increase in the intensity of emission of fluorescein and the appearance of white colour. Figure 8 shows the same overall formation of vortices promoting interfacial area generation between the two inlet streams observed at Re = 125 in Figure 7.
The experimental conditions ( Re = 50 , Re = 125 and Re = 200 ) tested using RPLIF were also simulated in Sultan et al. [68] and Sultan et al. [75]. Simulation results also show that the self-sustainable chaotic mixing is onset for Re > 125 , as observed in Figure 7.
Nevertheless, the AB-RPLIF method enabled the visualisation of the reactive regions in T-jet mixers at chaotic flow regimes. The regions where the reaction already took place are marked by a high emission intensity, enabling the reactive regions’ identification. This method assesses the spatial structure micromixing in a chemical reactor. This could be useful in detecting design problems on continuous flow reactors regarding the contacting of reacting streams. Another field of application is the validation of CFD simulations with chemical reactions, which will provide enough data for a thorough characterisation of mixing. It does not give a micromixing time, such as the consecutive-competitive reaction schemes referred to in the introduction, or measurement of mixing quality as the intensity of segregation measured in tracer experiments.

3.2. Oxi-RPLIF Method

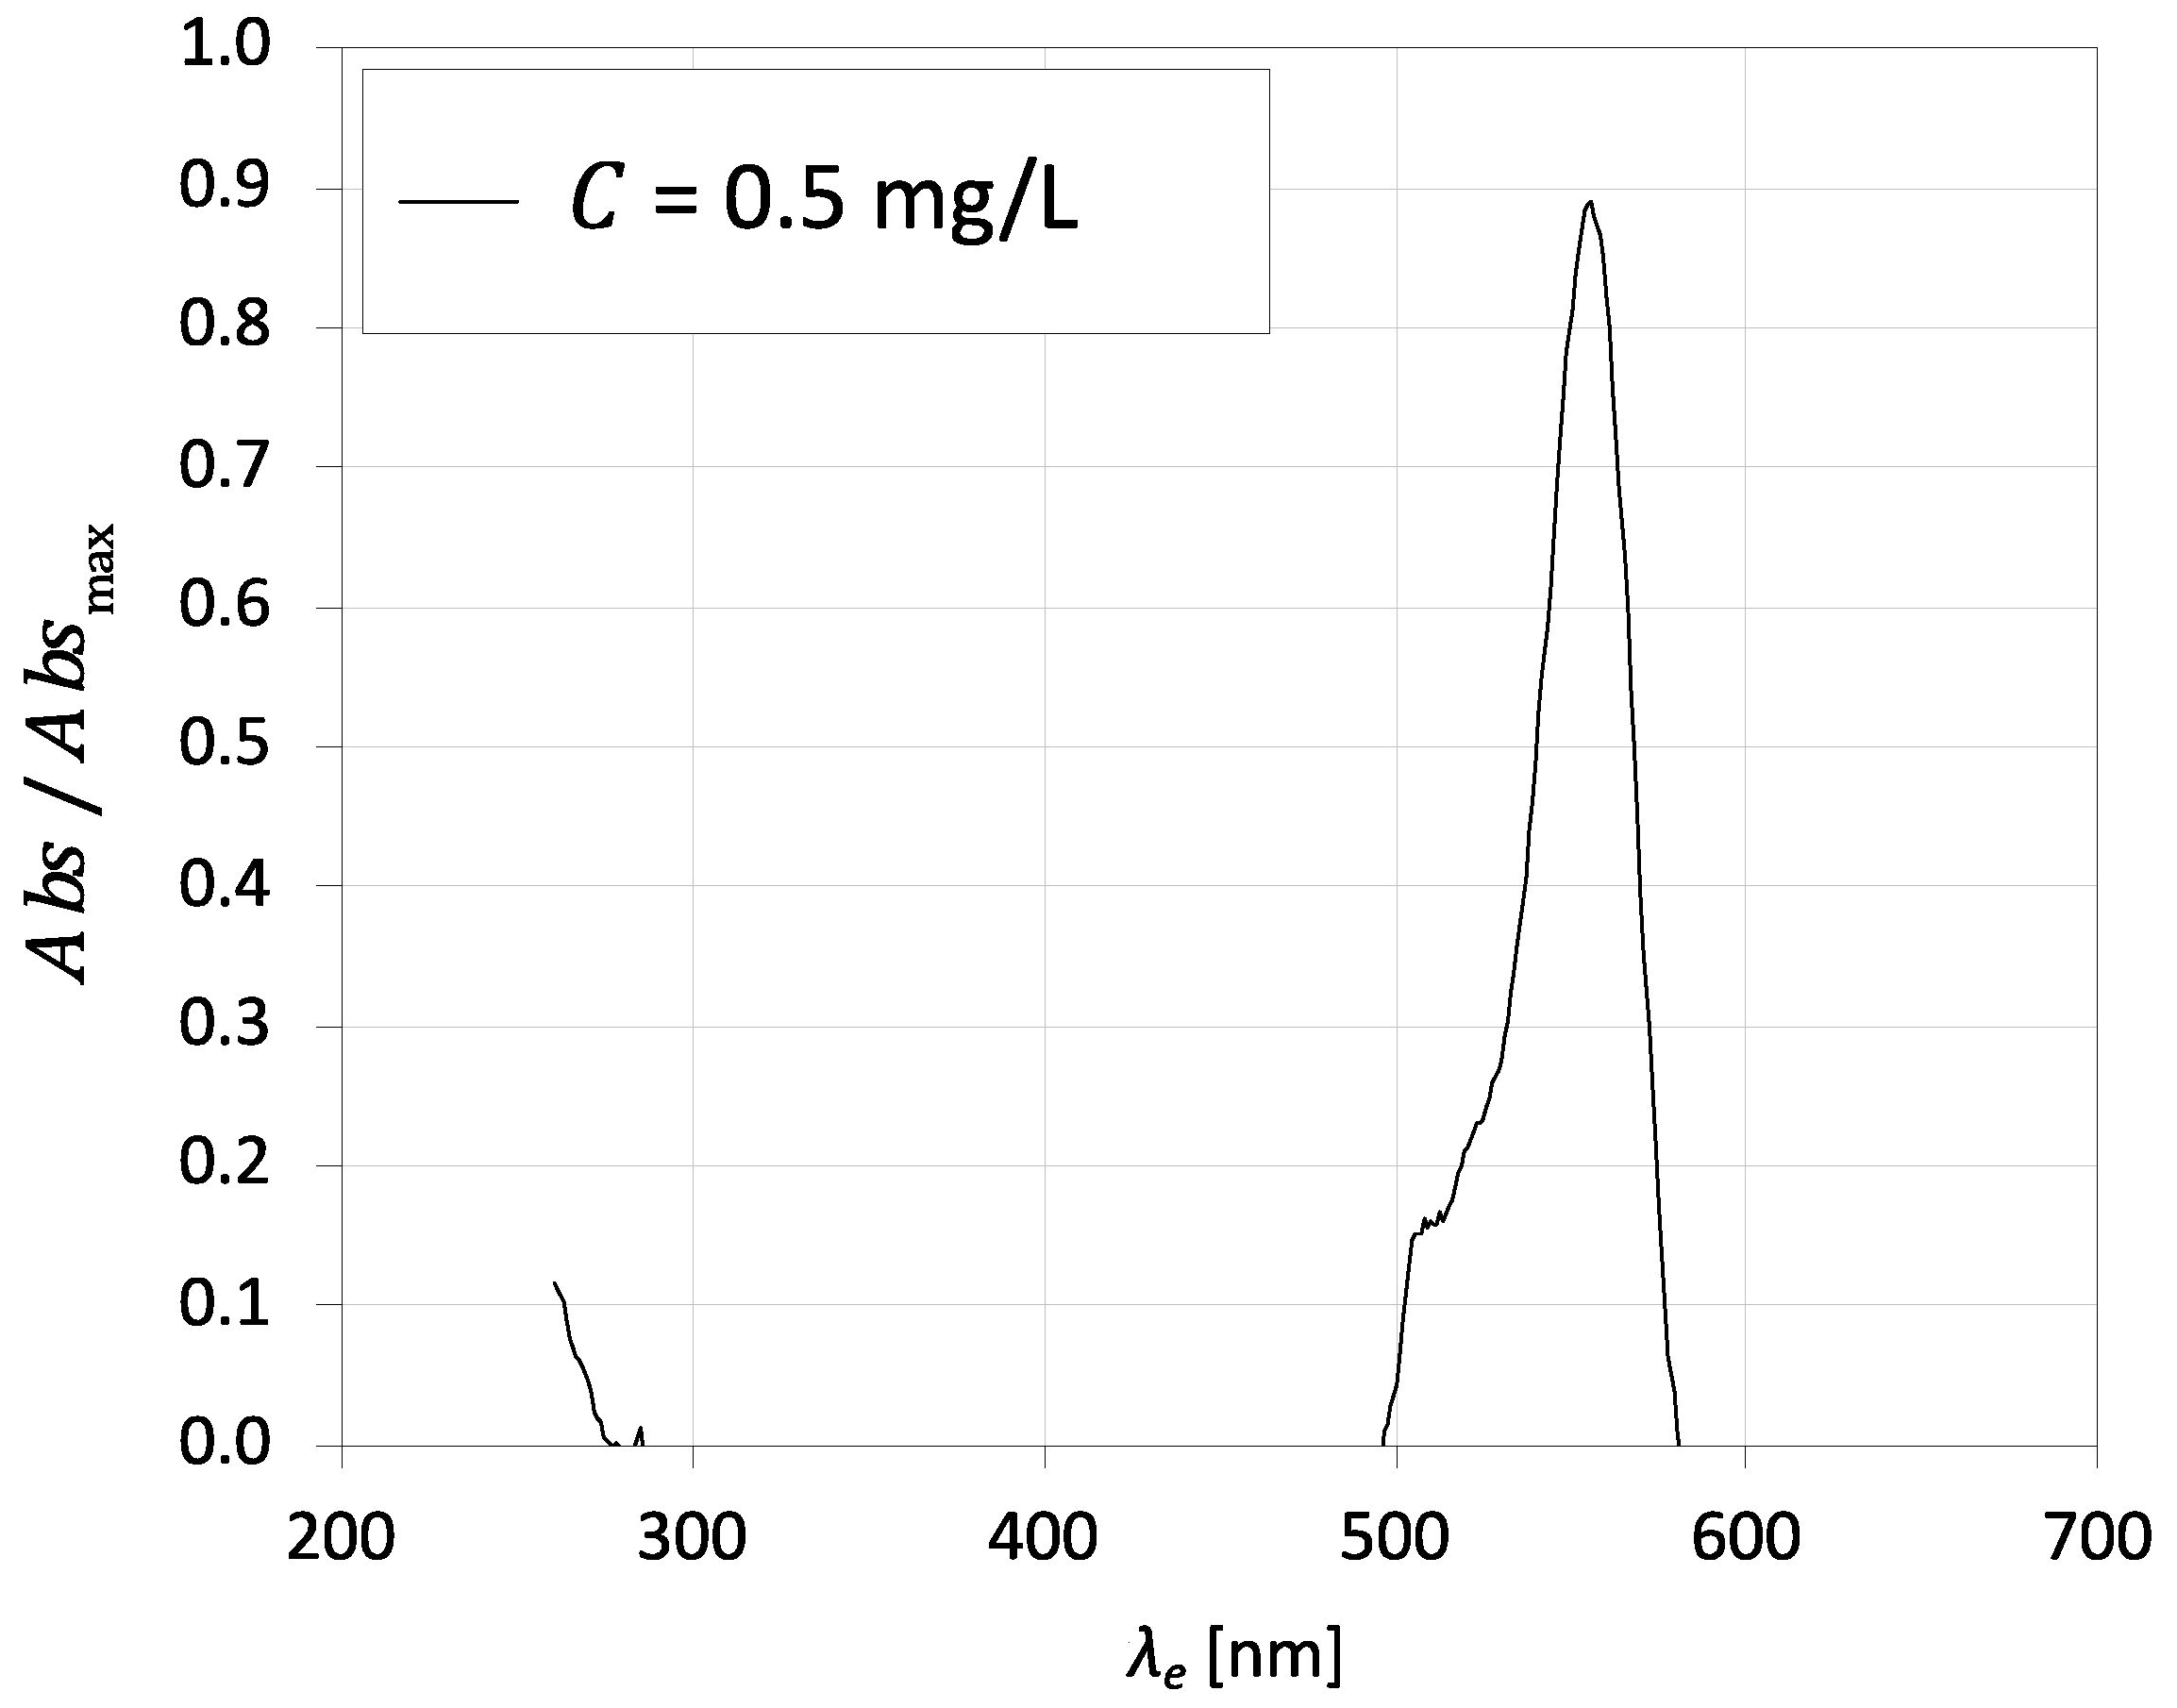
RhB was used as a fluorescent tracer for Fenton’s reaction. The absorption spectrum shows the relation between the excitation wavelength and the absorbance of RhB molecules. Figure 9 shows the absorption spectrum of RhB for an excitation wavelength from 200 to 700 nm for a concentration of 0.5 mg·L−1 at 20 °C. The excitation peak of this dye is near 550 nm for both concentrations, which agrees with the value in the literature [62]. According to Crimaldi [76], the absorption spectrum is broad enough to be excited from 514.5 to 532 nm.
Coppeta and Rogers [69] detected the emission spectrum of RhB and the respective emission peak, which occurs at 580 nm.
The absorption spectrum shows that RhB molecules absorb strongly at 532 nm; thus, the Nd:YAG laser is suitable for this method. Mortensen et al. [61] determined the calibration curve for RhB concentration and fluorescence intensity using an Nd:YAG laser. Results identify a linear region for the local fluorescence and the local emission intensity up to 0.6 mg·L−1. As expected, the local fluorescence decreases with the concentration of RhB; therefore, the oxidation of RhB during the reaction course promotes the absence of fluorescence. The implementation of Fenton’s reaction permits the flow visualisation and the identification of reaction regions, which are detected from the vanishing of the RhB fluorescence. The linearity between the RhB concentration and the fluorescence observed with the Nd:YAG laser makes this method suitable for quantitative imaging.
When a pulsed Nd:YAG laser is combined with RhB and Fenton’s reactions, a narrow-band filter should be placed in front of the camera lens to only capture the wavelength emitted by RhB. The emission peak of RhB is 580 nm, and therefore, the narrow-band filter used in this method cuts the wavelengths below 540 nm, empowering the capture of the emission wavelengths of RhB and filtering the green light of the laser (~526 nm).
Considering 2% H2O2 (wt./v) and 0.010 M Fe2+ concentrations (less than half the concentrations reported in the cited works), and using RhB in both streams, the ageing of reagents did not cause changes in the emission spectrum that would prevent the handling of this test-reaction within a 24 h period. The non-ageing for 24 h is an encouraging feature of this method.
In implementing this method to assess micromixing, the temperature should be controlled since the fluorescence of RhB is very sensitive to temperature [18].
This method converts Fe2+ to Fe3+ during Fenton’s reaction course, producing an iron sludge that may settle and could cause negative impacts on the mixing equipment used. Furthermore, in Fenton’s reaction, there is the formation of oxygen that results from the dissociation of H2O2 into oxygen and water,
2 H 2 O 2 2 H 2 O + O 2
The generation of oxygen in the reaction course leads to bubbles in the flow, making it difficult to visualise in a closed geometry from where gas can get stuck. For stirred tanks, the formation of small gas bubbles should not be a problem.
All the Oxi-RPLIF experiments were conducted at 23 °C setting the same Reynolds number for both sides, i.e., the Reynolds number of the inlet jet from where Fe2+ enters, Re iron , is matched to the inlet jet for the peroxide, Re H 2 O 2 , and therefore, Re iron = Re H 2 O 2 . The Oxi-RPLIF results in Figure 10 and Figure 11 report a single Reynolds number that applies to both inlets.
Experiments were conducted at 23 °C. Figure 10 shows Oxi-RPLIF images obtained at the plane defined by the mixing chamber and injector axis at Re iron = Re H 2 O 2 = 50 . The two liquid streams injected in the mixing chamber are white because both were dyed with RhB, which emits fluorescence when illuminated by a laser light sheet. Oxi-RPLIF images show that no dynamic structures are formed in the defined plane at that Re. The disappearance of the tracer, associated with changes in liquid streams’ colours, from white to black, is shown in Figure 10. This is related to the RhB oxidation by hydroxyl radical (HO•) (Equation (6)).
Figure 10 also shows a darker central region on the contact of both reactant streams, where the reaction takes place. This is associated with two Dean vortices formed on each side of the mixing chamber (vortex flow regime) which promotes the reaction between Fe2+ and H2O2. These results agree with Bothe et al. [63] and Hoffmann et al. [74] and even with the AB-RPLIF images shown in Figure 6.
Figure 11 shows Oxi-RPLIF images of the plane defined by the mixing chamber and injectors axis at Re iron = Re H 2 O 2 = 150 . In these working conditions, the flow is no longer steady and stratified. Dynamic mixing structures are formed, promoting the engulfment of the two liquid streams. Therefore, under these flow conditions, the disappearance of the tracer is more generalised at downstream positions of the mixing chamber. Therefore, the use of Fenton’s reaction as an RPLIF method enables the assessment of the chemical reaction rate throughout the reactor. The primary mechanism in this method is the saturation of the inlet streams with a tracer and the respective disappearance of the tracer, which can be used as an indicator of the chemical reaction.
Figure 10 and Figure 11 show the formation of gas bubbles during the experiments, which makes the visualisation of mixing even more difficult. The release of oxygen in Fenton’s reaction, described by Equation (4), does not enable quantification of the mixing degree, such as from the intensity of segregation.
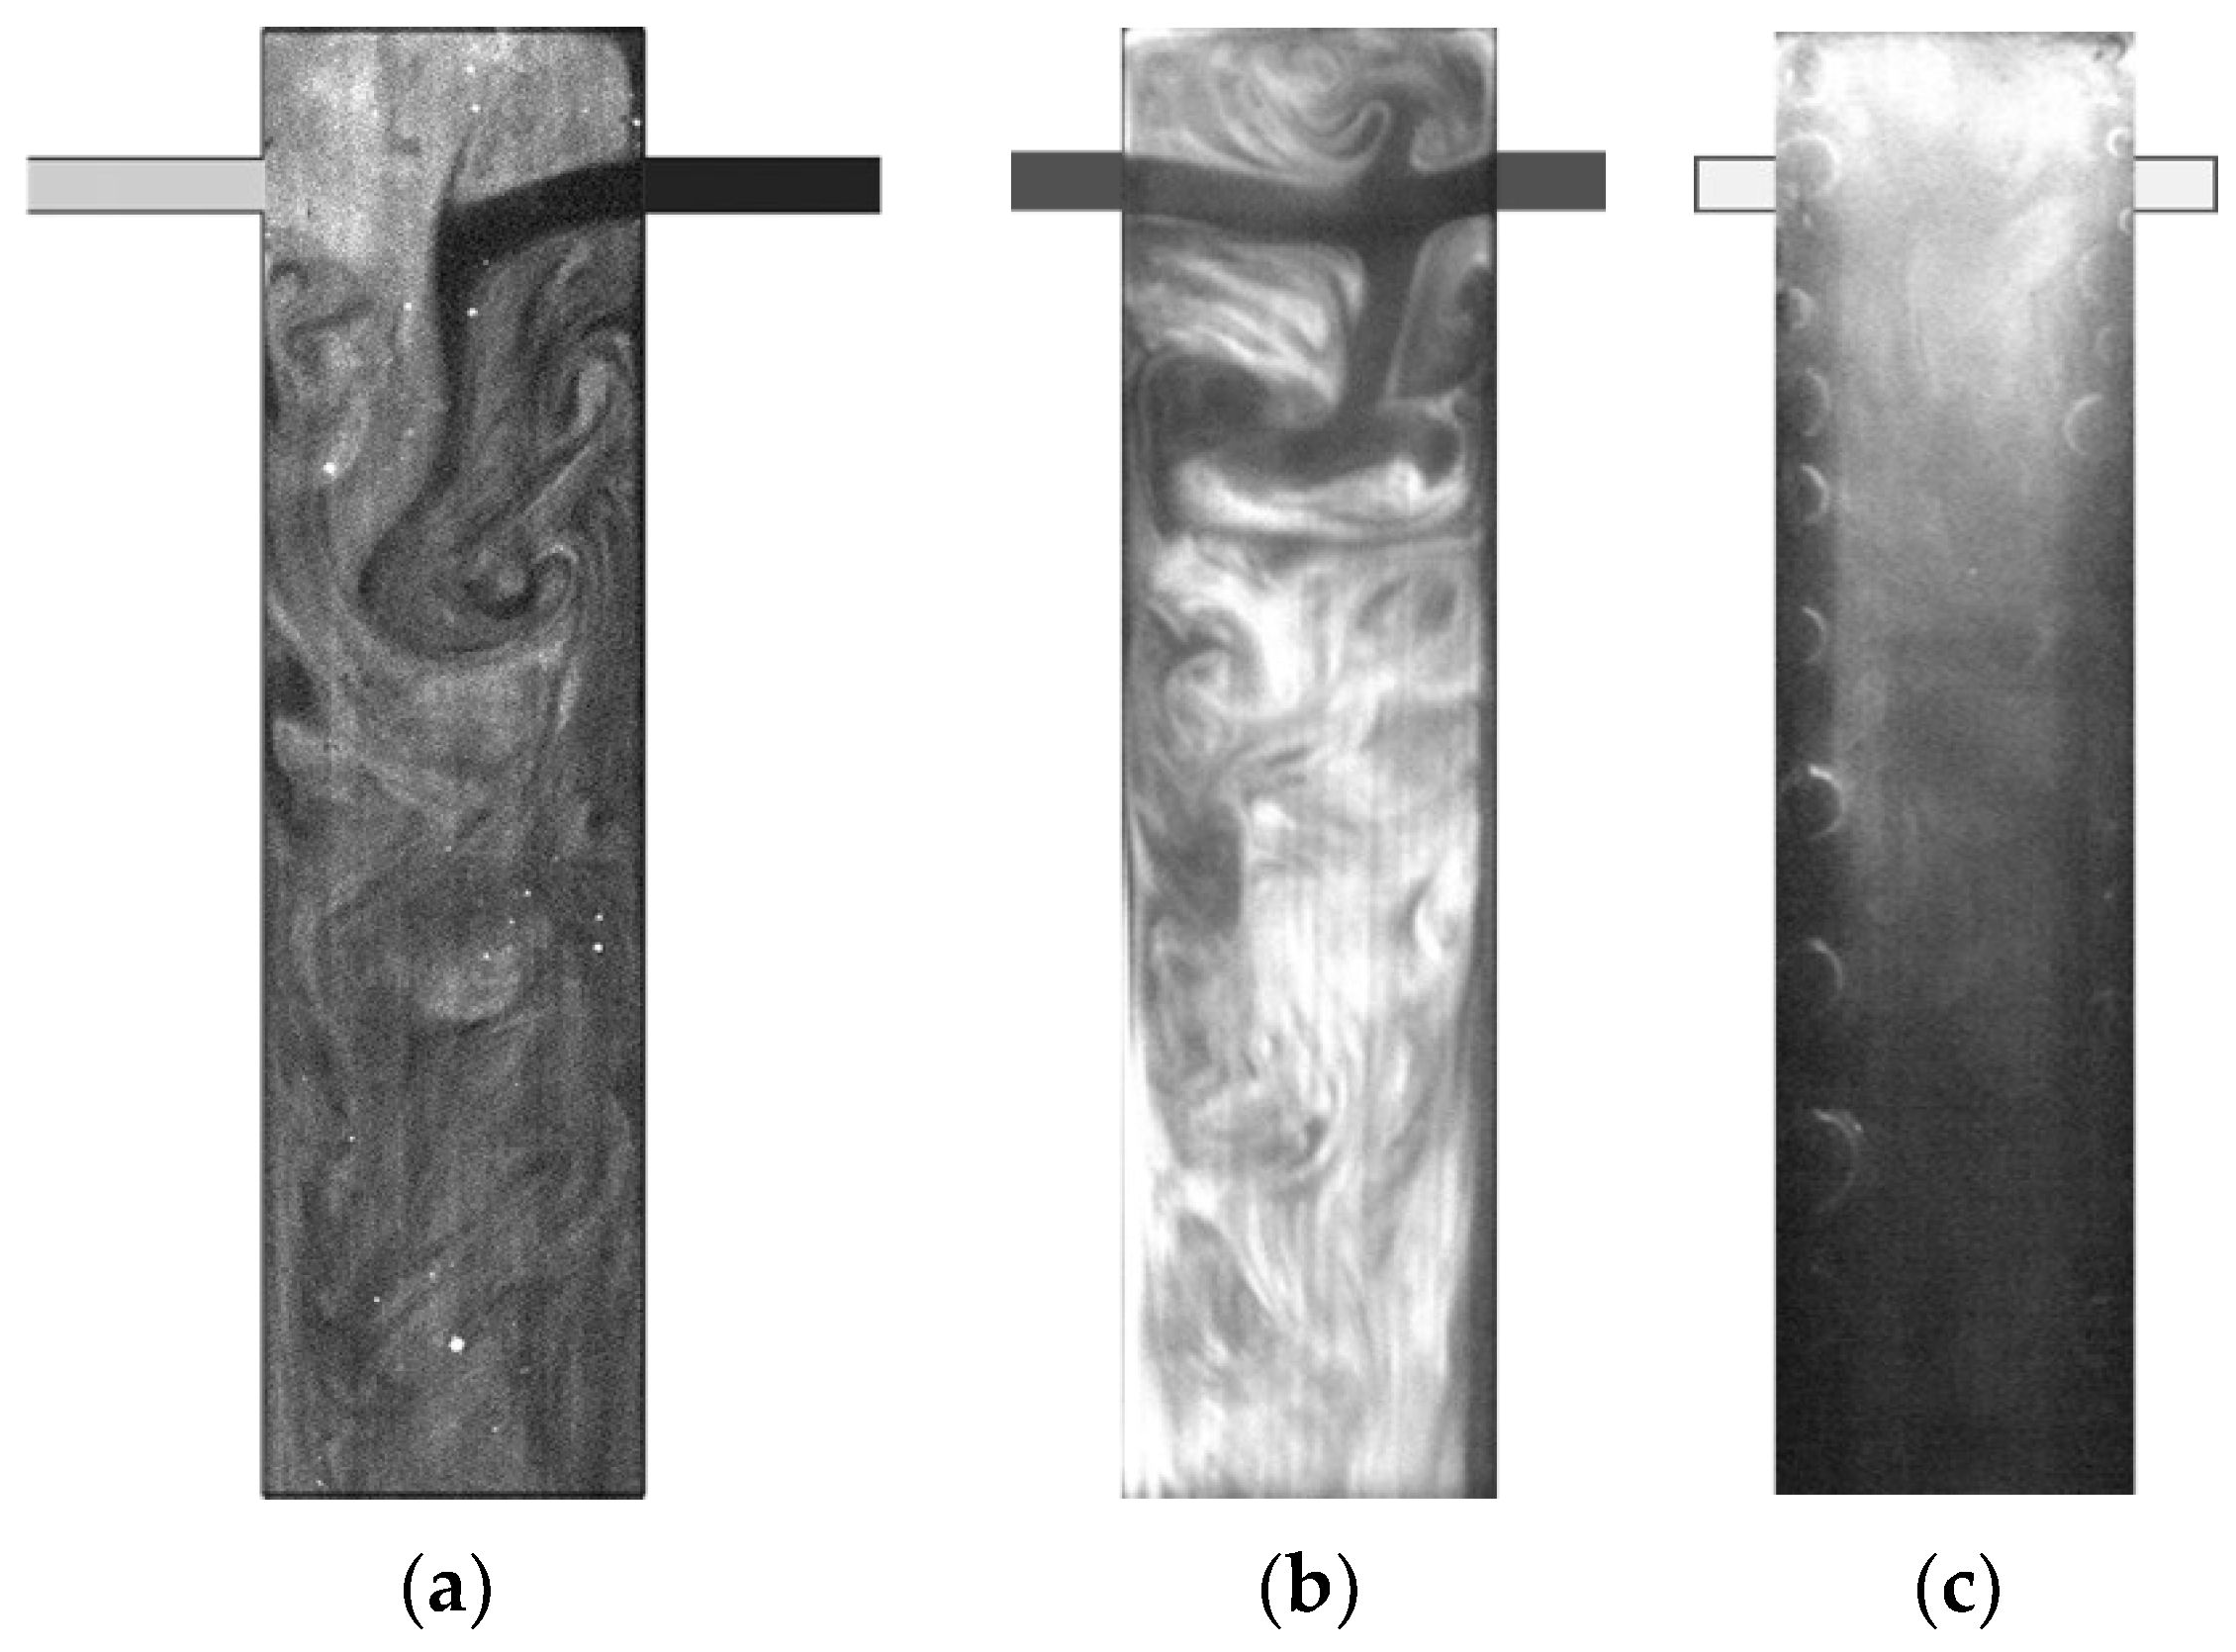
Figure 12 shows three RPLIF images using three different systems. In Figure 12a, one liquid stream was dyed with rhodamine, and the micromixing was assessed from the field of emission intensity of rhodamine, which is associated with its concentration. Figure 12b,c enable the flow characterisation from the reactive tracer in two test-reaction systems, AB-RPLIF and Oxi-PLIF. These images show that the mixing and flow regimes are more clearly observed with AB-RPLIF using fluorescein.

4. Techno-Economic Analysis of AB-RPLIF and Oxi-RPLIF Methods

The two RPLIF methods studied have associated costs that must be considered in the decision-making process. In this work, operating costs were determined based on lab-scale average market prices of each chemical used, considering 1 m3 of fluid flowing through the mixing chamber and knowing that half of that volume is attributed to each stream.
Therefore, in the AB-RPLIF method, in which the acid stream comprises 0.100 M H3PO4 and a maximum of 20 mgfluorescein·L−1, and the base streams consist of 0.165 M NaOH (for pH = 7 ), the operating cost of this method would be around 78 EUR·m−3. This is a maximum value because the AB-RPLIF method works well at smaller concentrations, which would enable cutting this cost. The neutralisation inside the mixing chamber decreases the risk of accidents, which makes this method more promising. For the Oxi-RPLIF method, the implementation cost in the studied conditions (2% H2O2 (wt./v) and 0.010 M Fe2+, with 4 mgRhB·L−1 in both streams) would be 405 EUR·m−3.
This cost estimation considers the use of analytical-grade chemicals, which are associated with higher purchase costs than industrial-grade reagents, which would also serve the purpose of visualisation. Reagents at industrial quantities and grades, particularly H2O2, will enable the reduction of costs by 90%.
There are several limitations to this method. First, it does not provide a micromixing time, such as the consecutive-competitive reaction schemes referred to in the introduction. Second, it does not give a measurement of mixing quality such as the intensity of segregation obtained from tracer experiments. It is more complex to obtain the overall mixing patterns with reactive than passive tracers. This method was not tested for turbulent flow regimes, and therefore, the information that could be obtained when the reacting front is a dispersion cloud between two fluids is not clear. Although the fact that the tracer appears from the reaction may give more information about the mixing structures than a cloud of the tracer being dispersed, this remains to be studied.
Nevertheless, the AB-RPLIF method enables the visualisation of the reactive regions in T-jet mixers at chaotic flow regimes. The regions where the reaction already took place are marked by a high emission intensity, which clearly identifies the reactive regions. Thus, this method is useful for assessing the spatial structure of micromixing in a chemical reactor. This could be useful in detecting design problems on continuous flow reactors regarding the contacting of reacting streams. Another field of application is the validation of CFD simulations with chemical reactions, which will provide enough data for a thorough characterisation of mixing.

5. Conclusions

This work studied and compared two test-reactions, acid–base reactive PLIF (AB-RPLIF) and Fenton’s reaction (Oxi-RPLIF), suitable for mixing assessment/quantification. After adapting some of the operating conditions originally suggested in the literature, the test-reactions became easier and more suitable for use in micromixing studies. Suitable conditions to adopt AB-RPLIF would be 20 mguranine·L−1 concentration in the acid stream; acid and base concentration in the streams enabling pH = 7 after reaction in the mixing chamber, such as 0.100 M H3PO4 and 0.165 M NaOH. Regarding Oxi-RPLIF, suitable conditions to employ this test-reaction would be an RhB concentration of up to 4 mg·L−1, 2% H2O2 (wt./v) and 0.010 M aqueous solution of Fe2+ (as FeSO4, for economic benefit).
In the AB-RPLIF method conducted in T-jet mixers, the streams are initially clear fluids, and the reaction is assessed from the appearance of the tracer. This is associated with the increase in its intensity of emission, giving a clear visualisation of the chemical reaction and the generation of the interfacial area between the two fluid streams. This feature is particularly useful in chaotic flow regimes where mixing occurs by interfacial area generation [77]. On the other hand, in the Oxi-RPLIF method, the streams are initially dyed with a tracer, and the reaction is assessed from the vanishing of the tracer and then the decrease in its emission intensity. Therefore, this method also enables the assessment of the chemical reaction rate throughout the mixing chamber. However, this method has the disadvantage of forming an undesirable iron sludge and more frequent gas bubbles during the experiments. Moreover, the Oxi-RPLIF method is fivefold more expensive than AB-RPLIF when using analytical-grade reagents.
This work adapted and improved two reactive methods for visualising micromixing in large-throughput continuous reactors. The two methods were demonstrated as efficient, safe and cost-effective for mixing visualisation.

Author Contributions

Conceptualization and validation, R.J.S. and M.I.N.; methodology, experiments and data analysis, J.P.R. and M.S.C.A.B. All authors have read and agreed to the published version of the manuscript.

Funding

FCT/MCTES provided financial support to CESAM (UIDP/50017/2020 + UIDB/50017/2020 + LA/P/0094/2020) through national funds. This work was also financially supported by: LA/P/0045/2020 (ALiCE); UIDB/50020/2020 and UIDP/50020/2020 (LSRE-LCM), funded by national funds through FCT/MCTES (PIDDAC); POCI-01-0145-FEDER-016851 and PO-CI-01-0145-FEDER-030445, funded by FEDER funds, Programa Operacional Competitividade e Internacionalização (POCI), and by national funds through FCT—Fundação para a Ciência e a Tecnologia IP; MSCA Brito acknowledges her FCT scholarship PD/BD/135060/2017.

Informed Consent Statement

Not applicable.

Data Availability Statement

Data to support the findings of this study are available from the authors upon request.

Conflicts of Interest

The authors declare no conflict of interest.

References

  1. Liu, Z.; Cheng, Y.; Jin, Y. Experimental study of reactive mixing in a mini-scale mixer by laser-induced fluorescence technique. Chem. Eng. J. 2009, 150, 536–543. [Google Scholar] [CrossRef]
  2. Lehwald, A.; Thévenin, D.; Zähringer, K. Quantifying macro-mixing and micro-mixing in a static mixer using two-tracer laser-induced fluorescence. Exp. Fluids 2010, 48, 823–836. [Google Scholar] [CrossRef]
  3. Cheng, J.; Feng, X.; Cheng, D.; Yang, C. Retrospect and Perspective of Micro-mixing Studies in Stirred Tanks. Chin. J. Chem. Eng. 2012, 20, 178–190. [Google Scholar] [CrossRef]
  4. Nadeau, P.; Berk, D.; Munz, R.J. Measurement of residence time distribution by laser absorption spectroscopy. Chem. Eng. Sci. 1996, 51, 2607–2612. [Google Scholar] [CrossRef]
  5. Buchmann, M.; Mewes, D. Measurement of the local intensities of segregation with the tomographical dual wavelength photometry. Can. J. Chem. Eng. 1998, 76, 626–630. [Google Scholar] [CrossRef]
  6. Buchmann, M.; Mewes, D. Tomographic Measurements of Micro-and Macromixing using the Dual Wavelength Photometry. Chem. Eng. J. 2000, 77, 3–9. [Google Scholar] [CrossRef]
  7. Baldyga, J.; Bourne, J.R. Turbulent Mixing and Chemical Reactions, 1st ed.; John Wiley and Sons: Hoboken, NJ, USA, 1999. [Google Scholar]
  8. Jasińska, M. Test Reactions to Study Efficiency of Mixing. Chem. Process Eng. 2015, 36, 171–208. [Google Scholar] [CrossRef]
  9. Dewey, C.F., Jr. Qualitative and quantitative flow field visualization utilizing laser-induced fluorescence. In Proceedings of the Applications of Non-Intrusive Instrumentation in Fluid Flow Research, Saint-Louis, France, 1 May 1976. [Google Scholar]
  10. Owen, K. Simultaneous laser measurements of instantaneous velocity and concentration in turbulent mixing flows. In Proceedings of the Applications of Non-Intrusive Instrumentation in Fluid Flow Research, Saint-Louis, France, 30 April 1976. [Google Scholar]
  11. Liu, H.T.; Lin, J.T.; Delisi, D.P.; Robben, F.A. Application of a fluorescence technique to dye-concentration measurements in a turbulent jet. In Proceedings of the Symposium on Flow Measurement in Open Channels and Closed Conduits, Gaithersburg, MA, USA, 23–25 February 1977; pp. 423–446. [Google Scholar]
  12. Walker, D.A. A fluorescence technique for measurement of concentration in mixing liquids. J. Phys. E Sci. Instrum. 1987, 20, 217–224. [Google Scholar] [CrossRef]
  13. Bruchhausen, M.; Guillard, F.; Lemoine, F. Instantaneous measurement of two-dimensional temperature distributions by means of two-color planar laser induced fluorescence (PLIF). Exp. Fluids 2005, 38, 123–131. [Google Scholar] [CrossRef]
  14. Hu, Y.; Liu, Z.; Yang, J.; Jin, Y.; Cheng, Y. Study on the reactive mixing process in an unbaffled stirred tank using planar laser-induced fluorescence (PLIF) technique. Chem. Eng. Sci. 2010, 65, 4511–4518. [Google Scholar] [CrossRef]
  15. Webster, D.R.; Roberts, P.J.W.; Ra’ad, L. Simultaneous DPTV/PLIF measurements of a turbulent jet. Exp. Fluids 2001, 30, 65–72. [Google Scholar] [CrossRef]
  16. Milton-McGurk, L.; Williamson, N.; Armfield, S.W.; Kirkpatrick, M.P. Experimental investigation into turbulent negatively buoyant jets using combined PIV and PLIF measurements. Int. J. Heat Fluid Flow 2020, 82, 108561. [Google Scholar] [CrossRef]
  17. Melton, L.A.; Lipp, C.W. Criteria for quantitative PLIF experiments using high-power lasers. Exp. Fluids 2003, 35, 310–316. [Google Scholar] [CrossRef]
  18. Sakakibara, J.; Hishida, K.; Maeda, M. Measurements of thermally stratified pipe flow using image-processing techniques. Exp. Fluids 1993, 16, 82–96. [Google Scholar] [CrossRef]
  19. Kuzkova, N.; Popenko, O.; Yakunov, A. Application of Temperature-Dependent Fluorescent Dyes to the Measurement of Millimeter Wave Absorption in Water Applied to Biomedical Experiments. Int. J. Biomed. Imaging 2014, 2014, 243564. [Google Scholar] [CrossRef] [PubMed]
  20. Jardón-Pérez, L.E.; Amaro-Villeda, A.M.; Trápaga-Martínez, G.; González-Rivera, C.; Ramírez-Argáez, M.A. Utilization of the Planar Laser-Induced Fluorescence Technique (PLIF) to Measure Temperature Fields in a Gas-Stirred Ladle. Metall. Mater. Trans. A 2020, 51, 2510–2521. [Google Scholar] [CrossRef]
  21. Eltayeb, A.; Tan, S.; Qi, Z.; Ala, A.A.; Ahmed, N.M. PLIF experimental validation of a FLUENT CFD model of a coolant mixing in reactor vessel down-comer. Ann. Nucl. Energy 2019, 128, 190–202. [Google Scholar] [CrossRef]
  22. Du, X.; Duan, X.; Yang, C. Visual Study on the Interphase Mass Transfer of Immiscible Liquid–Liquid System in a Stirred Tank. Ind. Eng. Chem. Res. 2019, 58, 21785–21796. [Google Scholar] [CrossRef]
  23. Wang, Z.; Chen, J.; Feng, X.; Mao, Z.-S.; Yang, C. Visual dynamical measurement of the solute-induced Marangoni effect of a growing drop with a PLIF method. Chem. Eng. Sci. 2021, 233, 116401. [Google Scholar] [CrossRef]
  24. Rida, Z.; Cazin, S.; Lamadie, F.; Dherbécourt, D.; Charton, S.; Climent, E. Experimental investigation of mixing efficiency in particle-laden Taylor–Couette flows. Exp. Fluids 2019, 60, 61. [Google Scholar] [CrossRef] [Green Version]
  25. Fitschen, J.; Hofmann, S.; Wutz, J.; Kameke, A.v.; Hoffmann, M.; Wucherpfennig, T.; Schlüter, M. Novel evaluation method to determine the local mixing time distribution in stirred tank reactors. Chem. Eng. Sci. X 2021, 10, 100098. [Google Scholar] [CrossRef]
  26. Rodriguez, G.; Micheletti, M.; Ducci, A. Macro- and micro-scale mixing in a shaken bioreactor for fluids of high viscosity. Chem. Eng. Res. Des. 2018, 132, 890–901. [Google Scholar] [CrossRef]
  27. Eltayeb, A.; Tan, S.; Ala, A.A.; Zhang, Q. The study of the influence of slug density on the mixing performance in the reactor vessel, using PLIF experiment and FLUENT simulation. Prog. Nucl. Energy 2021, 131, 103558. [Google Scholar] [CrossRef]
  28. Duan, X.; Feng, X.; Mao, Z.-S.; Yang, C. Numerical simulation of reactive mixing process in a stirred reactor with the DQMOM-IEM model. Chem. Eng. J. 2019, 360, 1177–1187. [Google Scholar] [CrossRef]
  29. Taghavi, M.; Moghaddas, J. Using PLIF/PIV techniques to investigate the reactive mixing in stirred tank reactors with Rushton and pitched blade turbines. Chem. Eng. Res. Des. 2019, 151, 190–206. [Google Scholar] [CrossRef]
  30. Hu, Y.; Wang, W.; Shao, T.; Yang, J.; Cheng, Y. Visualization of reactive and non-reactive mixing processes in a stirred tank using planar laser induced fluorescence (PLIF) technique. Chem. Eng. Res. Des. 2012, 90, 524–533. [Google Scholar] [CrossRef]
  31. Bourne, J.R. Mixing and the Selectivity of Chemical Reactions. Process Res. Dev. 2003, 7, 471–508. [Google Scholar] [CrossRef]
  32. Bourne, J.R.; Kut, O.M.; Lenzner, J.; Maire, H. Kinetics of the diazo coupling between 1-naphthol and diazotized sulfanilic acid. Ind. Eng. Chem. Res. 1990, 29, 1761–1765. [Google Scholar] [CrossRef]
  33. Nunes, M.; Santos, R.; Dias, M.; Lopes, J.C. Micromixing assessment of confined impinging jet mixers used in RIM. Chem. Eng. Sci. 2012, 74, 276–286. [Google Scholar] [CrossRef]
  34. Meyer, T.; Fleury, P.A.; Renken, A.; Darbellay, J.; Larpin, P. Barium sulfate precipitation as model reaction for segregation studies at pilot scale. Chem. Eng. Process. 1992, 31, 307–310. [Google Scholar] [CrossRef] [Green Version]
  35. Barthole, J.P.; David, R.; Molleyre, J.F.; Bourrret, P.; Villermaux, J.J.J.C.P. Cinétique macroscopique de la précipitation du sulfate de baryum en présence d’EDTA. J. Chim. Phys. 1982, 79, 719–724. [Google Scholar] [CrossRef]
  36. Bourne, J.R.; Kozicki, F. Mixing Effects During the Bromination of 1,3,5-trimethoxybenzene. Chem. Eng. Sci. 1977, 32, 1538–1539. [Google Scholar] [CrossRef]
  37. Hecht, K.; Koelbl, A.; Kraut, M.; Schubert, K. Micromixer Characterization with Competitive-Consecutive Bromination of 1,3,5-Trimethoxybenzene. Chem. Eng. Technol. 2008, 31, 1176–1181. [Google Scholar] [CrossRef]
  38. Oates, P.M.; Harvey, C.F. A colorimetric reaction to quantify fluid mixing. Exp. Fluids 2006, 41, 673–683. [Google Scholar] [CrossRef]
  39. Zhang, P.; DeVries, S.L.; Dathe, A.; Bagtzoglou, A.C. Enhanced Mixing and Plume Containment in Porous Media under Time-Dependent Oscillatory Flow. Environ. Sci. Technol. 2009, 43, 6283–6288. [Google Scholar] [CrossRef] [PubMed]
  40. Akiti, O. Turbulent Mixing and Chemical Reaction in Baffled Stirred Tank Reactors: A Comparison between Experiments and a Novel Micromixing-Based Computational Fluid Dynamics Model; New Jersey Institute of Technology: Newark, NJ, USA, 2000. [Google Scholar]
  41. Baldyga, J.; Henczka, M.; Makowski, L. Effects of Mixing on Parallel Chemical Reactions in a Continuous-Flow Stirred-Tank Reactor. Chem. Eng. Res. Des. 2001, 79, 895–900. [Google Scholar] [CrossRef]
  42. Bałdyga, J.; Bourne, J.R.; Hearn, S.J. Interaction between chemical reactions and mixing on various scales. Chem. Eng. Sci. 1997, 52, 457–466. [Google Scholar] [CrossRef]
  43. Bourne, J.R.; Yu, S. Investigation of micromixing in stirred tank reactors using parallel reactions. Ind. Eng. Chem. Res. 1994, 33, 41–55. [Google Scholar] [CrossRef]
  44. Baldyga, J.; Bourne, J.R. The effect of micromixing on parallel reactions. Chem. Eng. Sci. 1990, 45, 907–916. [Google Scholar] [CrossRef]
  45. Tolgyesi, W.S. Relative reactivity of toluene-benzene in nitronium tetrafluoroborate nitration—Limitation of the competitive method of rate determination in fast reactions. Can. J. Chem. 1964, 43, 343–355. [Google Scholar] [CrossRef]
  46. Baldyga, J.; Jasinska, M.; Trendowska, J.; Tadeusiak, W.; Cooke, M.; Kowalski, A. Application of Test Reactions to Study Micromixing and Mass Transfer in Chemical Apparatus. 2012. Available online: https://suw.biblos.pk.edu.pl/resourceDetailsBPP&rId=14358 (accessed on 28 June 2022).
  47. Fournier, M.C.; Falk, L.; Villermaux, J. A new parallel competing reaction system for assessing micromixing efficiency—Experimental approach. Chem. Eng. Sci. 1996, 51, 5053–5064. [Google Scholar] [CrossRef]
  48. Guichardon, P.; Falk, L. Characterisation of micromixing efficiency by the iodide–iodate reaction system. Part I: Experimental procedure. Chem. Eng. Sci. 2000, 55, 4233–4243. [Google Scholar] [CrossRef]
  49. Ghanem, A.; Lemenand, T.; Della Valle, D.; Peerhossaini, H. Static mixers: Mechanisms, applications, and characterization methods—A review. Chem. Eng. Res. Des. 2014, 92, 205–228. [Google Scholar] [CrossRef]
  50. Baldyga, J.; Bourne, J.R.; Walker, B. Non-isothermal micromixing in turbulent liquids: Theory and experiment. Can. J. Chem. Eng. 1998, 76, 641–649. [Google Scholar] [CrossRef]
  51. Faes, M.; Glasmacher, B. Measurements of micro- and macromixing in liquid mixtures of reacting components using two-colour laser induced fluorescence. Chem. Eng. Sci. 2008, 63, 4649–4655. [Google Scholar] [CrossRef]
  52. Kling, K.; Mewes, D. Two-colour laser induced fluorescence for the quantification of micro- and macromixing in stirred vessels. Chem. Eng. Sci. 2004, 59, 1523–1528. [Google Scholar] [CrossRef]
  53. Wheat, P.M.; Posner, J.D. Quantifying mixing using equilibrium reactions. Phys. Fluids 2009, 21, 037101. [Google Scholar] [CrossRef]
  54. Lehwald, A.; Jenrich, S.; Thévenin, D.; Zahrinque, K. Experimental investigation of macro- and micro-mixing in a reactive turbulent channel flow. In Proceedings of the 16th International Symposium on Applications of Laser Techniques to Fluid Mechanics, Lisbon, Portugal, 20–23 July 1992; pp. 1–10. [Google Scholar]
  55. Lehwald, A.; Thévenin, D.; Zähringer, K. Simultaneous two-tracer-Laser-induced fluorescence and particle image velocimetry for the investigation of macro-and micro-mixing in a static mixer. In Proceedings of the 15th International Symposium on Applications of Laser Techniques to Fluid Mechanics, Lisbon, Portugal, 5–8 July 2010. [Google Scholar]
  56. Fall, A.; Lecoq, O.; David, R. Characterization of Mixing in a Stirred Tank by Planar Laser Induced Fluorescence (P.L.I.F.). Chem. Eng. Res. Des. 2001, 79, 876–882. [Google Scholar] [CrossRef]
  57. Rule, G.; Seitz, W.R. Flow-injection analysis with chemiluminescence detection. Clin. Chem. 1979, 25, 1635–1638. [Google Scholar] [CrossRef]
  58. Shamsipur, M.; Chaichi, M.J.; Karami, A.R. A study of peroxyoxalate-chemiluminescence of acriflavine. Spectrochim. Acta A Mol. Biomol. Spectrosc. Spectrochim. Acta A 2003, 59, 511–517. [Google Scholar] [CrossRef]
  59. Jonsson, T.; Irgum, K. Very fast peroxyoxalate chemiluminescence. Anal. Chim. Acta 1999, 400, 257–264. [Google Scholar] [CrossRef]
  60. Karasso, P.S.; Mungal, M.G. PLIF measurements in aqueous flows using the Nd:YAG laser. Exp. Fluids 1997, 23, 382–387. [Google Scholar] [CrossRef]
  61. Mortensen, M.; Orciuch, W.; Bouaifi, M.; Andersson, B. Mixing of a Jet in a Pipe. Chem. Eng. Res. Des. 2004, 82, 357–363. [Google Scholar] [CrossRef]
  62. Sultan, M.A.; Fonte, C.P.; Dias, M.M.; Lopes, J.C.B.; Santos, R.J. Experimental study of flow regime and mixing in T-jets mixers. Chem. Eng. Sci. 2012, 73, 388–399. [Google Scholar] [CrossRef]
  63. Bothe, D.; Stemich, C.; Warnecke, H.-J. Computation of scales and quality of mixing in a T-shaped microreactor. Comput. Chem. Eng. 2008, 32, 108–114. [Google Scholar] [CrossRef]
  64. Soleymani, A.; Kolehmainen, E.; Turunen, I. Numerical and experimental investigations of liquid mixing in T-type micromixers. Chem. Eng. J. 2008, 135, S219–S228. [Google Scholar] [CrossRef]
  65. Mariotti, A.; Galletti, C.; Mauri, R.; Salvetti, M.V.; Brunazzi, E. Steady and unsteady regimes in a T-shaped micro-mixer: Synergic experimental and numerical investigation. Chem. Eng. J. 2018, 341, 414–431. [Google Scholar] [CrossRef]
  66. Soleymani, A.; Yousefi, H.; Turunen, I. Dimensionless number for identification of flow patterns inside a T-micromixer. Chem. Eng. Sci. 2008, 63, 5291–5297. [Google Scholar] [CrossRef]
  67. Zhang, J.-W.; Liu, S.-F.; Cheng, C.; Li, W.-F.; Xu, X.-L.; Liu, H.-F.; Wang, F.-C. Investigation of three-dimensional flow regime and mixing characteristic in T-jet reactor. Chem. Eng. J. 2019, 358, 1561–1573. [Google Scholar] [CrossRef]
  68. Sultan, M.A.; Krupa, K.; Fonte, C.P.; Nunes, M.I.; Dias, M.M.; Lopes, J.C.B.; Santos, R.J. High-Throughput T-Jets Mixers: An Innovative Scale-Up Concept. Chem. Eng. Technol. 2013, 36, 323–331. [Google Scholar] [CrossRef]
  69. Coppeta, J.; Rogers, C. Dual emission laser induced fluorescence for direct planar scalar behavior measurements. Exp. Fluids 1998, 25, 1–15. [Google Scholar] [CrossRef]
  70. Koochesfahani, M.M. Experiments on Turbulent Mixing and Chemical Reactions in a Liquid Mixing Layer; California Institute of Technology: Pasadena, CA, USA, 1984. [Google Scholar]
  71. Koochesfahani, M.M.; Dimotakis, P.E. Mixing and chemical reactions in a turbulent liquid mixing layer. J. Fluid Mech. 1986, 170, 83–112. [Google Scholar] [CrossRef]
  72. Kola, L.; Amataj, S. The influence of some chemical and physical parameters of water samples on spectral determinations of fluorescent dyes. Maced. J. Chem. Chem. Eng. 2006, 25, 107–112. [Google Scholar]
  73. Santos, R.J.; Sultan, M.A. State of the Art of Mini/Micro Jet Reactors. Chem. Eng. Technol. 2013, 36, 937–949. [Google Scholar] [CrossRef]
  74. Hoffmann, M.; Schlüter, M.; Räbiger, N. Experimental investigation of liquid–liquid mixing in T-shaped micro-mixers using μ-LIF and μ-PIV. Chem. Eng. Sci. 2006, 61, 2968–2976. [Google Scholar] [CrossRef]
  75. Sultan, M.A.; Pardilhó, S.L.; Brito, M.S.C.A.; Fonte, C.P.; Dias, M.M.; Lopes, J.C.B.; Santos, R.J. 3D Mixing Dynamics in T-Jet Mixers. Chem. Eng. Technol. 2019, 42, 119–128. [Google Scholar] [CrossRef]
  76. Crimaldi, J.P. Planar laser induced fluorescence in aqueous flows. Exp. Fluids 2008, 44, 851–863. [Google Scholar] [CrossRef]
  77. Ottino, J.M.; Ranz, W.E.; Macosko, C.W. A lamellar model for analysis of liquid-liquid mixing. Chem. Eng. Sci. 1979, 34, 877–890. [Google Scholar] [CrossRef]
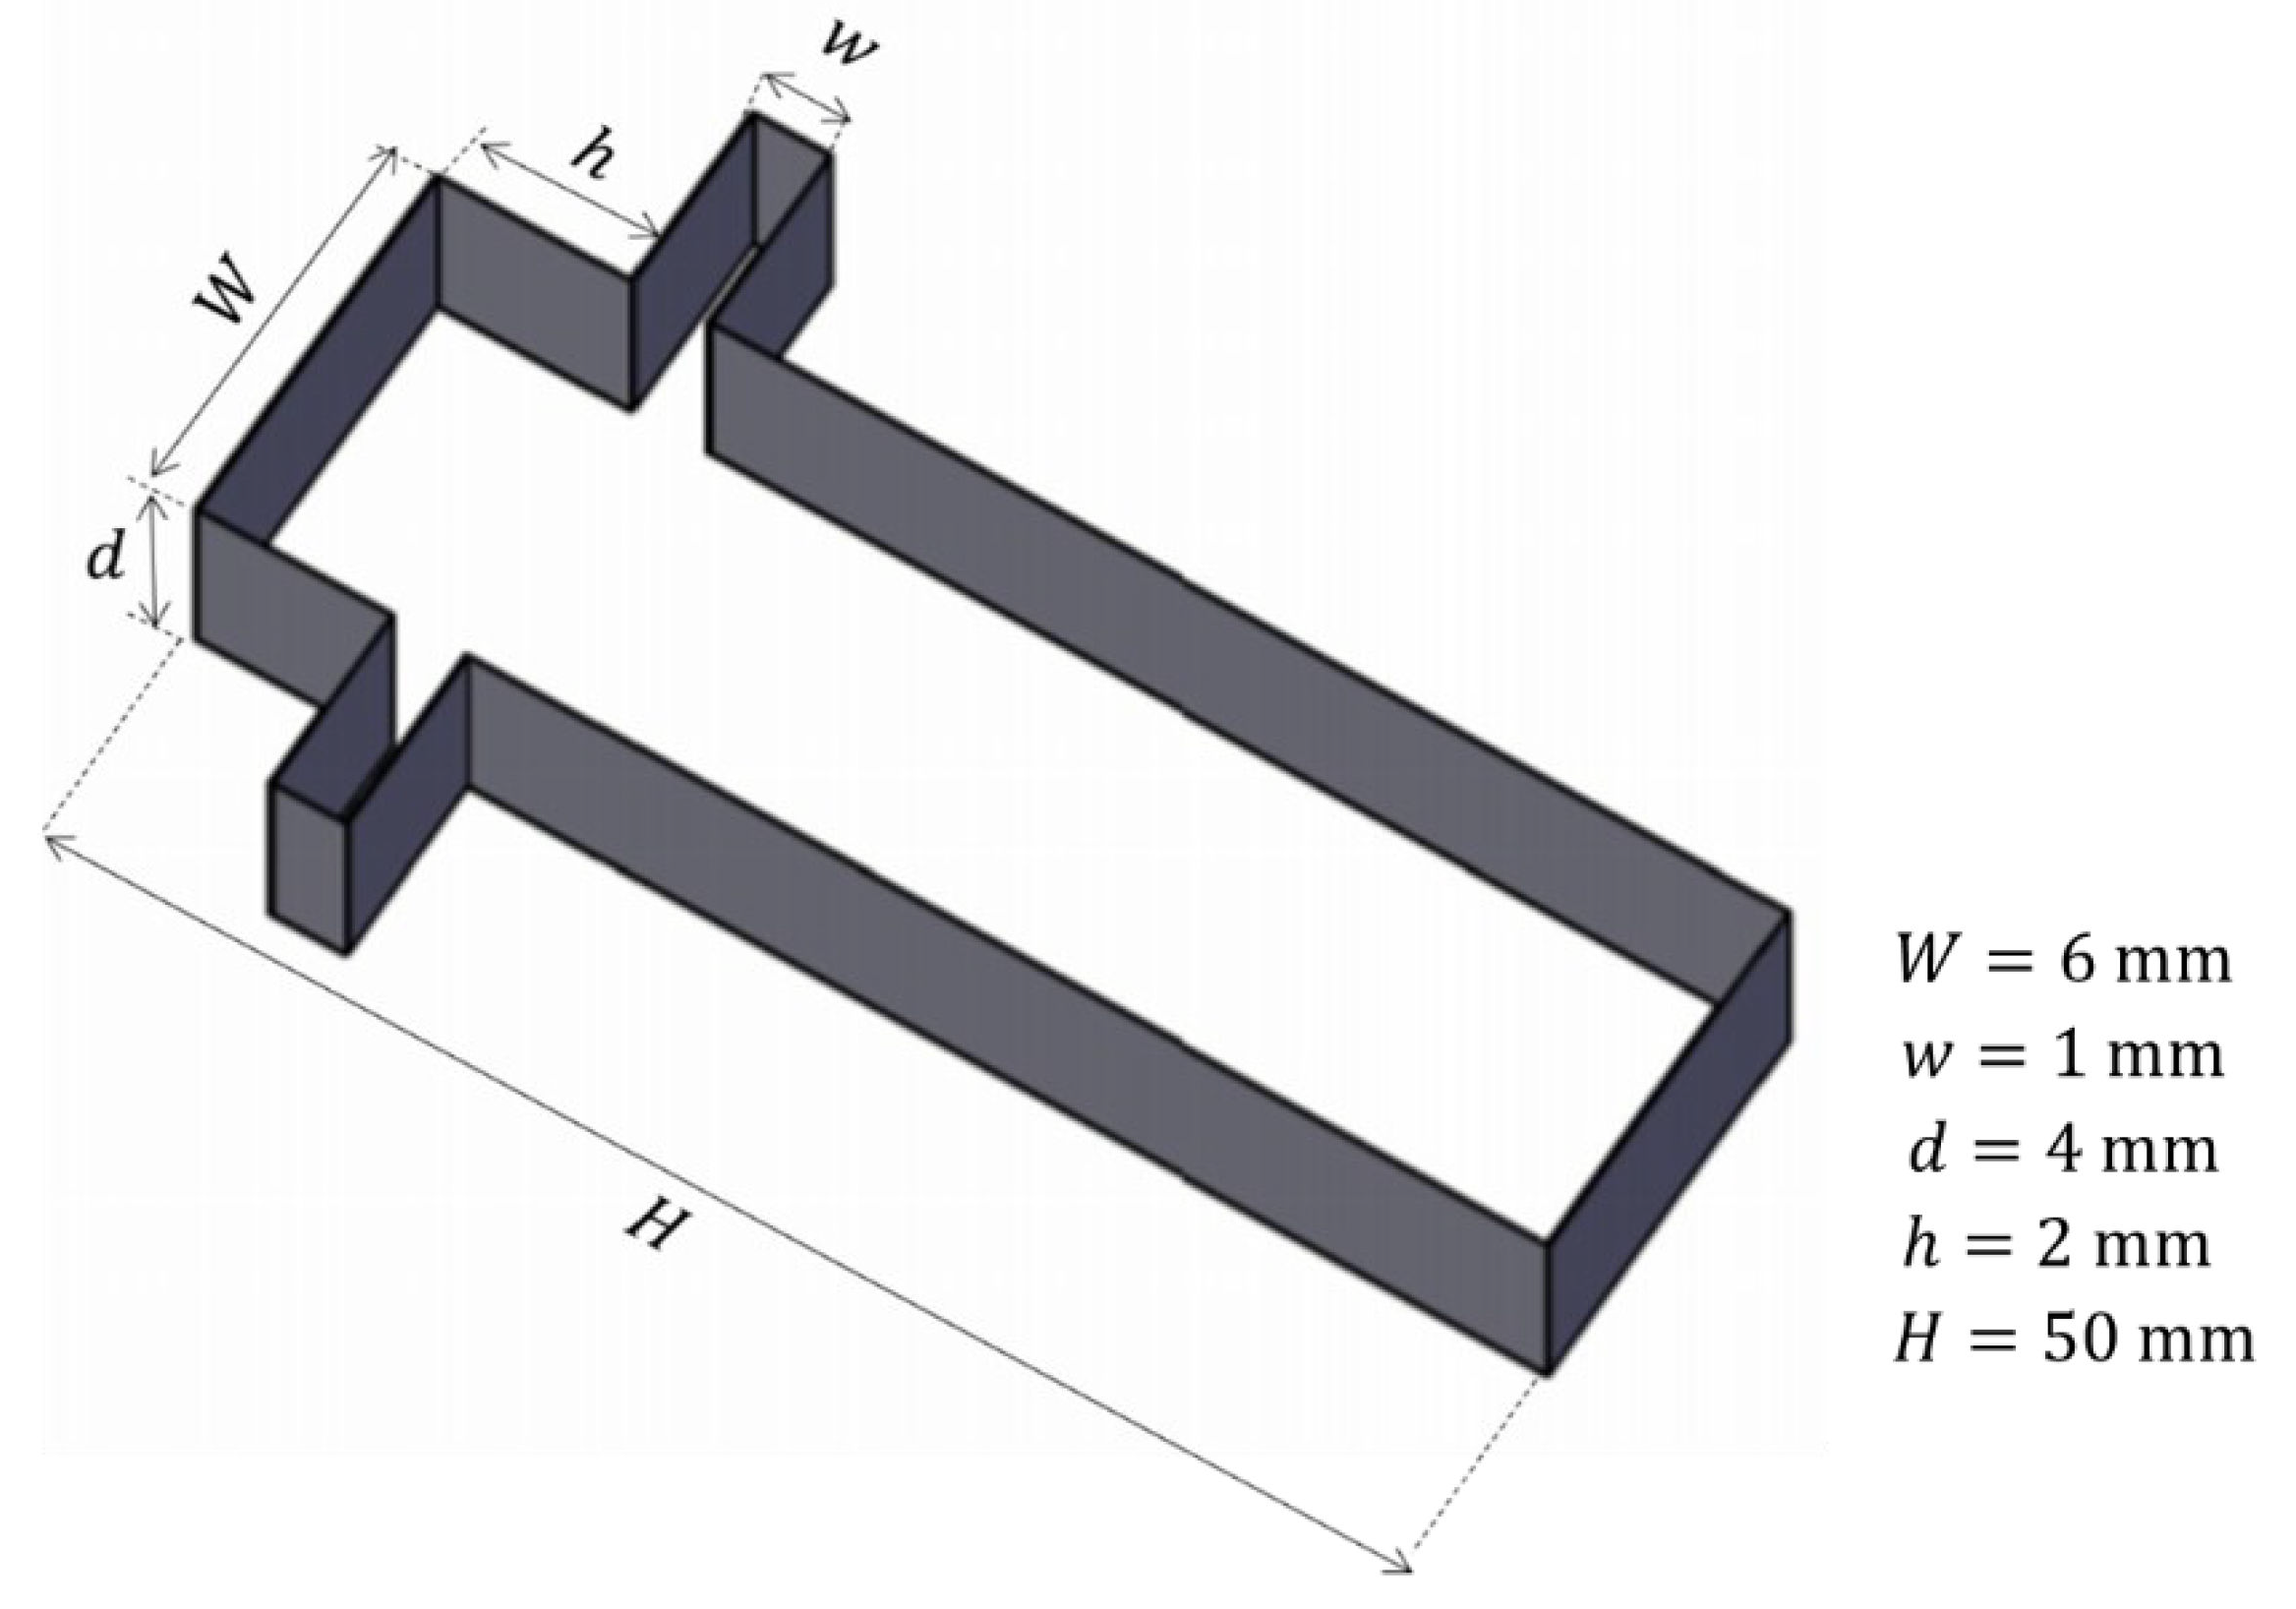
Figure 1. Sketch of T-jet geometry.
Processes 10 01916 g001
Figure 2. Absorption spectra of fluorescein for an excitation wavelength from 200 to 700 nm for 4 mg·L−1 and 20 mg·L−1 in H3PO4 0.100 M + NaOH 0.165 M medium, pH = 7.
Processes 10 01916 g002
Figure 3. Electric potential difference for fluorescein versus concentration at different excitation light wavelengths in H3PO4 0.100 M + NaOH 0.165 M medium, pH = 7 @25 °C for (a) 350 and 488 nm and (b) 500 and 532 nm.
Processes 10 01916 g003
Figure 4. Influence of pH on electric potential difference measured for 20 mg·L−1 fluorescein solution at 25 °C, for 350, 488 nm, 500 nm and 532 nm.
Processes 10 01916 g004
Figure 5. Electric potential difference associated with fluorescein versus the excitation wavelength for 20 mg·L−1 solution in H3PO4 0.100 M + NaOH 0.165 M medium, immediately after preparation and 24 h later.
Processes 10 01916 g005
Figure 6. Three images obtained at different time instants with the AB-RPLIF method at Re = 50 .
Processes 10 01916 g006
Figure 7. PLIF image obtained with AB-RPLIF method for Re = 125 .
Processes 10 01916 g007
Figure 8. PLIF image obtained with AB-RPLIF at Re = 200 .
Processes 10 01916 g008
Figure 9. Absorption spectra of RhB for an excitation wavelength from 200 to 700 nm for 0.5 mg·L−1 at 20 °C.
Processes 10 01916 g009
Figure 10. PLIF image from Oxi-RPLIF method at Re = 50 .
Processes 10 01916 g010
Figure 11. PLIF image obtained with Oxi-RPLIF method at Re = 150 .
Processes 10 01916 g011
Figure 12. PLIF images obtained from (a) non-reactive rhodamine tracer; (b) AB-RPLIF method; (c) Oxi-RPLIF method.
Processes 10 01916 g012
Table 1. Operational parameters for several chemical methods for assessing micromixing, based on competitive-consecutive reactions A + B → R; R + B → S.
Reagent AReagent BKinetic Rate Constant
(25 °C)
ReferenceAnalytical Method
(m3·mol−1·s−1)
1- and 2-naphtol
(A1 and A2)
Diazotised sulphanilic acidk1 = 1.3 × 10⁴; k2 = 2.7Bourne [31], Bourne, et al. [32]
Nunes, et al. [33]
A1 + B → R
B + R → S
A2 + B → Q

B is the limiting reagent, and A is buffered to pH = 9.9 (usually Na2CO3/NaHCO3); absorption spectrophotometry technique used for measurement of the products over time, at λmax, which are 510 nm for R, 560 nm for S and 480 nm for Q.
Alkaline solution of BaCI2, NaOH,
Na2SO4 and EDTA
HClk1 = 1.8 × 10⁸
k2 = not reported
Meyer, et al. [34], Barthole, et al. [35]Absorption spectrophotometry technique. Mixing of the reagents takes place in stirred tanks. After the injection of B into A, a representative sample is taken, and absorbance of precipitate product BaSO4 is measured at 650 nm.
1,3,5-Trimetoxybenzene (TMB)Brominek1/k2 ≈ 27Bourne and Kozicki [36]
Bourne [31] and Hecht, et al. [37]
High-performance liquid chromatography technique. TMB and bromine flow from different streams and downstream from the mixer (different types of mixers tested); an HPLC device is used to analyse the products, separating TMB, product R and product S.
Mo as (NH4)2MoO4Ti2+ (tiron as disodium salt) Oates and Harvey [38], Zhang, et al. [39]Absorption spectrophotometry and absorbance imaging techniques. Absorbance at 580 nm was measured in samples taken downstream from the mixer. Additionally, polychromatic absorbance was measured in a glass mixing chamber by means of a CCD camera. Then, the absorbance over the visual spectrum, which is what the digital camera observes, was compared to the absorbance at 580 nm.
Table 2. Operational parameters for several chemical methods for assessing micromixing based on competitive-parallel reactions: A + B → R; C + B → S.
Reagent AReagent BReagent CKinetic Rate Constant
(25 °C)
ReferenceAnalytical Method
(m3·mol−1·s−1)
Hydrochloric acidSodium hydroxideEthyl mono-chloro-acetatek1 = 1.3–1.4 × 10⁸;
k2 = 0.023–0.031
Akiti [40], Bourne [31]
Baldyga, et al. [41], Bałdyga, et al. [42], Bourne and Yu [43]
Chromatographic analysis. Reagents A and C are pre-mixed in a mixing vessel, and then B is added. Samples are taken from the stirred tank and analysed for product distribution by either gas chromatography [40] or HPLC [41]. Test-reaction reported for low turbulence in the tank, with dissipation rate as low as 0.018 W·kg−1 [42].
Iron sulphateSodium hydroxideEthyl mono-chloro-acetatek1 = 107;
k2 = 0.023
Baldyga and Bourne [44]Titration. Limiting reagent B is added to a tank containing reagents A and C. The concentration of ferric ions still present in solution after reaction (not precipitated as ferric hydroxide) is found by titration with EDTA in the presence of salicylic acid at pH ≈ 3.
BenzeneNO2+ (as NO2BF4)Toluenek1/k2 = 27Baldyga and Bourne [44], Tolgyesi [45]Gas chromatography technique. B is added to an equimolar mixture of A and C in a stirred tank. After reaction is complete, samples are taken from the batch reactor, and the distribution of products between nitrobenzene and nitrotoluene is measured by gas chromatography.
Benzoic acidSodium hydroxideEthyl chloro-acetatek1 → ∞;
k2 = 0.023
Jasińska [8], Baldyga, et al. [46]Chromatographic analysis by one of two methodologies: (a) B is added to a mixture of A and C in a batch mixer. After reaction is complete, samples are taken, and concentration of ester and/or by-product ethanol is measured by either GC or HPLC [46]. (b) A solution of A and C in toluene is added to B in a batch mixer. After reaction is complete, concentrations of ethanol and ethyl chloroacetate are measured by gas chromatography [8,46].
Borate ion (boric acid)Sulphuric acidIodide and iodatek1 = 108;
k2 = f (I), I = ionic strength
Hecht, et al. [37], Fournier, et al. [47], Guichardon and Falk [48],
Ghanem, et al. [49]
H2BO3 + H+ ⇔ H3BO3
5I + IO3 + 6H+ ⇔ 3I2 + 3H2O
I2 + I ⇔ I3

Absorption spectrophotometry technique. Iodate and iodide are added into a stirred tank. Sodium hydroxide is
added before boric acid to prevent the formation
of iodine in acid medium. When the reagents are
supposed to be mixed, sulphuric acid is added into the
stirred tank. The analysis of the solution is performed by spectrophotometry at 353 nm within a minute after the end of reaction: samples taken two minutes after the acid injection [48].
Sodium hydroxideHCl2,2-dimethoxy-propanek1 = 1.3–1.4 × 10⁸;
k2 = 0.6
Bourne [31], Baldyga, et al. [50]Chromatographic analysis. HCl is added to a solution of alkali and acetal in a 1:10 ratio (v/v). According to Baldyga et al. [46], equal molar quantities of acid and acetal should be used with a 5% excess of alkali to ensure the stability of the unreacted acetal when all the acid has been neutralised. Mixing performed in a stirred tank, with analysis of product mixtures performed by gas chromatography.
Table 3. Operational parameters for several luminescence methods for assessing micromixing.
Reagent AReagent BReagent CKinetic Rate Constant
(25 °C)
ReferenceAnalytical Method
(m3·mol−1·s−1)
Ca2+ ions (CaCl2)Fluo-4—reactive dyeCarboxy-SNARF-inert dyek = 106Faes and Glasmacher [51], Kling and Mewes [52], Wheat and Posner [53]Fluo-4 + CaCl2 → Fluo-4.Ca (with emission increase)

LIF technique. A mix of the two dyes is injected into the mixing vessel containing CaCl2, which turns on the Fluo-4 fluorescence; excitation light source: pulsed laser with λ = 495 nm; emitted light detected with a CCD camera at 516 nm for Fluo-4 and 645 nm for Carboxy-SNARF.
Acid–base (HCl + NaOH)Uranine (reactive dye)Pyridine-2 (inert dye)Quasi-instantaneous, k → ∞Lehwald, et al. [2], Lehwald, et al. [54], Lehwald, et al. [55]HCl + NaOH ⇔ NaCl + H2O @ pH = 7
Uranine’s emission E = f(pH)

LIF technique. Mixtures of water + acid + uranine + pyridine 2 (Flow 1) and water+base+uranine (Flow 2) flow to a mixer where they are illuminated at 532 nm; emitted light detected by means of CCD cameras, at 550 nm for uranine and 705 nm for pyridine-2. Reported results refer to laminar regime.
Fe2+ ions –
as (NH4)2Fe(SO4)2
Rhodamine B, RhBHydrogen peroxide, H2O2k1 = 0.1;
k2 = 104–107
Liu, et al. [1], Hu, et al. [14], Hu, et al. [30].Fe2+ + H2O2 ⇔ OH
OH + RhB → M (quenching of the fluorescence)

LIF technique. The fluorescent dye is dissolved in one of the reagent streams so that when they mix, the reaction quenches the fluorescent signal; light source wavelength: 532 nm; emitted light detected at 590 nm by means of CCD camera; reported measurements performed online in mini-scale Y-jet mixers [1] or in unbaffled stirred tanks [14,30].
WaterWater + Rhodamine BNANAFall, et al. [56]LIF technique. The fluorescent dye is dissolved in one of the two water flows that will be illuminated; light source wavelength: 520 nm. Emitted light detected at 590 nm by means of a CCD camera; measurements reported performed online in a cylindrical stirred tank.
Cu (II) in NH3-NH4+ buffer (pH = 11)LuminolHydrogen peroxide, H2O2 Rule and Seitz [57]C8H7O3N3 + Cu(II) + H2O2 → 3-aminophtalate + hν

Chemiluminescence detection. The reagent flows are injected into the detection cell. No light source is needed; emitted light detected with a photomultiplier tube at 420–450 nm; measurements reported were performed online in a coil of Teflon tube that is pressed against the PMT detector; laminar regime.
bis-(2,4,6-trichlorophenyl)oxalate TCPOAcriflavineHydrogen peroxide, H2O2 Shamsipur, et al. [58]TCPO + H2O2 → C2O4 + 2 [C6HOCl3]
C2O4 + acriflavine → 2CO2 + acriflavine → 2CO2 + acriflvine + hν

Chemiluminescence detection; reagents are mixed in a stirred glass mixer; no light source needed; emitted light detected online by means of a photocell at 510–540 nm.
bis-(2,4,6-trichlorophenyl)oxalate TCPO3-aminofluoranthene (3-AFA)Hydrogen peroxide, H2O2 + base catalyst Jonsson and Irgum [59]TCPO + H2O2 → C2O4 + 2 [C6HOCl3]
C2O4 + 3-AFA → 2CO2 + 3-AFA * → 2CO2 + 3-AFA + hν

Chemiluminescence detection; no light source needed; emitted light detected with a photomultiplier tube at 518 nm; measurements reported were performed online in stopped-flow equipment.
Table 4. Experimental conditions of AB-RPLIF and Oxi-RPLIF methods.
AssayObjectiveC (mg·L−1) pHTime of Measurements
F1Absorption spectrum4; 207Immediately after preparation
F2Linearity dynamic range of fluorescence4–307Immediately after preparation
F3pH effect on emission202–12Immediately after preparation
F4Fluorophore stability202Immediately after preparation and 24 h after preparation
RhB1Absorption spectrum0.5 Immediately after preparation
RhB2Fluorophore stability0.5 Immediately after preparation and 24 h after preparation
Publisher’s Note: MDPI stays neutral with regard to jurisdictional claims in published maps and institutional affiliations.