Article

Social Media Strategy Processes for Centralized Payment Network Firms after a War Crisis Outset

by
Damianos P. Sakas
,
Nikolaos T. Giannakopoulos
*,
Marina C. Terzi
,
Ioannis Dimitrios G. Kamperos
,
Dimitrios K. Nasiopoulos
,
Dimitrios P. Reklitis
* and
Nikos Kanellos
BICTEVAC LABORATORY—Business Information and Communication Technologies in Value Chains Laboratory, Department of Agribusiness and Supply Chain Management, School of Applied Economics and Social Sciences, Agricultural University of Athens, 118 55 Athens, Greece
*
Authors to whom correspondence should be addressed.
Processes 2022, 10(10), 1995; https://doi.org/10.3390/pr10101995
Submission received: 19 August 2022 / Revised: 12 September 2022 / Accepted: 28 September 2022 / Published: 2 October 2022

Abstract

:
From the outset of the war in Ukraine, extensive crises in many sectors of the world economy have occurred, with firms offering services and products both online and through physical stores facing serious problems. These problems are mainly related to higher operational costs and the lack of website visibility. For this research study, centralized payment network organizations (CPNs), firms providing online payment services through their networks, were selected and analytical data from their websites were collected for a period of 6 months. The main focus of this research study is to evaluate benefits and the role of social media strategies for CPNs’ digital marketing performance during crisis events and to also assess their utility as a risk-management tool. Following data collection, the authors performed statistical processes (regression and correlation analysis) and stationary modeling with Fuzzy Cognitive Mapping (FCM) tools; finally, dynamic simulations were performed by utilizing Agent-Based Models (ABM). The authors suggest that various variables of CPNs’ social media platforms can aid in improving their digital marketing performance and, using proper analysis, can lead to higher user social engagement, thus rendering social media strategy a useful risk-management tool.

1. Introduction

1.1. War Crisis Management

In February 2022, the world witnessed the beginning of a very intense crisis between Russia and Ukraine that caused significant instability to the world economy. The EU has already adopted six packages of sanctions, such as the closure of EU airspace to all Russian aircraft and prohibitions on transactions, exports, and new investments, among others, in an attempt to weaken the Russian economy and, thus, its ability to wage war [1]. Those actions revived some of the main concerns of the EU regarding safety and security, creating a sense of jeopardy and resulting in a humanitarian crisis [2].
Unfortunately, crises do occur, and they can either be natural, technological, health, or financial crises, producing alarming cascading effects on the world’s economy. War crises are among the worst ones due to the human contribution, as they are man-made disasters that are able to create geopolitical emergencies [3]. According to UNCTAD (2022), the war in Ukraine provokes a multidimensional crisis in trade, complicating global supply-chain reconfigurations and leading to social unrest [4]. During war periods, the supply chain that supports industrial and agricultural sectors is either stressed or broken, causing severe declines in economic activity [5].
To prevent disruptive and unexpected events and provide security at all levels, crisis management has to be a priority on every country’s agenda as an opportunity to organize both national and local organizations [6,7]. At the time of a war crisis, diplomacy is seen as an alternative for avoiding conflicts and for preparing the ground for risk reduction and for sustaining peace [8]. The Russian invasion of Ukraine will definitely change the approach to risk reduction, not only at a national level with regards to geopolitical disruptions but also at a local level and particularly for businesses by creating a global risk superstorm. Even if the Sendai Framework 2015–2030 provides actions to prevent disaster risk reduction [9], the current conflict highlights the urgent need for a reassessment of worst-case scenarios.
Just as the impact of the pandemic has started to soften, the war in Ukraine has delivered another shock: that of financial services. Crises push companies over the technology tipping point and tend to accelerate technology development [10]. The Russian invasion of Ukraine influenced fintech companies, for which their rapid development was observed after the pandemic [11,12,13]. Since military operations are still occurring and the entire financial sector has plunged into a new reality, innovation activities will be the key to mitigating risks and unlocking undiscovered directions that will lead payment centralized network firms to move to the top [14,15].
An extensive examination of five centralized payment network firms’ (CPNs), or fintech firms, websites was conducted to obtain relevant behavioral data that will be useful throughout this study. Web analytics is connected with the gathering and assessment of both structured and unstructured information from a webpage for improving digital marketing efficiency. The authors aim to analyze the efficiency of social media analytics during the war crisis in Ukraine from the five most-known CPN firms and to model them to assess their digital marketing performance.
As a result, the present study is organized as follows: the introduction to the existing literature on the relevant topic; Section 2 examines the sample collection of the required analytic data and metrics and presents the paper’s research hypotheses; Section 3 presents the findings of the statistical evaluation, such as the regression analysis, fuzzy cognitive mapping, and the agent-based modeling development, depending on the coefficients of the statistical analysis; Section 4 explains the main results of the study, and Section 5 analyzes the study’s recommended implications and presents current limitations and future studies.

1.2. Crisis Management and Innovation as a Risk Mitigation Tool

Looking back on the current pandemic, it is apparent that innovations are at the heart of every crisis [16]. When crises occur, organizations seize the opportunity to create new products, new services, and new markets so as to cope with the new reality. Vulnerabilities that are completely ignored or to which firms are unaware of are seen as chances to experiment with new technologies in an attempt to overcome existing obstacles and to return to a normal state. Glodzinski and Marciniak [17] state that innovations play a significant role in developing crisis-response strategies. In line with that statement, the project Driver [18], developed and supported by the European Commission, identifies that “neither successful R&D nor strong end-user demand always leads to innovations.” This observation verifies that innovations could also flourish during crisis situations by creating services/products that meet shifting customer needs.
Innovative choices such as social media have been reported to serve as risk mitigation tools for businesses during crises. In particular, the utilization of social media platforms as a dynamic communication tool is a well-established strategy for either spreading the desired message or disseminating rumors [19,20]. Risk management during disaster-related crises by using social media as a crowdsourced data collection platform has also been indicated by studies [21,22,23], especially in the context of GeoSocial Intelligence. Alexander [24] identifies seven different ways social media is used during crises, including listening to public debates and creating social cohesion, tools that can be highly effective for a crisis risk-management strategy.
During the pandemic, several pivotal stages were observed, especially in organizations’ go-to-market models, with the majority of them adapting to new digital methods [25]. Customers’ rapid change in shopping preferences serves as a driving force for organizations’ tendency to pivot. Although the world was completely unprepared to deal with such a crisis, many organizations employed innovative behavior to succeed in the digital sphere [26].
Organizations need to maintain stability, build resilience, and return to growth, when crises such as war are occurring, by embracing the challenge and turning problems into opportunities [27]. However, effective response strategies based on innovation require organizational culture. Even in fast-growing industries, such as the banking sector with massive investments in start-ups, innovations can only occur when companies employ a clear innovation strategy [28]. Dobni’s study [29] introduces a seven-factor model to measure an organization’s innovation culture. This study, as well as the following ones in different sectors [30,31], sets innovation as a metric of future success. Establishing and cultivating an environment that supports new ideas and out-of-the-box thinking should core elements in every organization that wishes to outperform other organizations during and after the crisis.

1.3. Fintech Revolution during the War Crisis

Being digital in the finance sphere during war tragedies is a challenging topic for fintech companies since financial accessibility and convenience are under threat [32]. According to the Office of Foreign Assets Control [33], fintech companies are recommended to be banned by the Russian government. This initiative to isolate the Russian market creates a tremendous cost to fintech companies worldwide. However, it also develops opportunities for innovations, galvanizing crypto and NFT spaces [34]. For example, according to Statista, Ukraine is among the first nations to accept cryptocurrency donations following Russia’s invasion [35]. Therefore, while centralized payment firms continue to grow and work across the globe, even during wartime, it is important to build alternative solutions to reduce risk perceptions and achieve financial stability.
The pandemic has induced dramatic market shifts and consumers’ behavioral changes [36,37,38]. The financial sector managed to respond quickly and become war resilient due to all these COVID-19 adaptations regarding digitalization. Considering the circumstances, the financial industry has received excellent training during the pandemic, accelerating the adaptation to more digital strategies [39,40,41]. Centralized payment firms continue to offer innovations in order to develop customized financial solutions. In an attempt to overcome conventional financial services, fintech companies use blockchain and cryptocurrency to offer a plethora of alternatives and options. This profound transformation causes major problems for traditional financial institutions, regarding security and transparency, as they see themselves as lagging behind [42].
Due to the fact that the fintech sector does not require a physical presence in banks and employs an automated process, reducing errors in this manner, centralized payment firms are largely sustainable. According to Statista (b), by 2026, the number of Fintech users is expected to reach a thrilling amount of 5211.27 m [43]. This new pattern of human behavior, the new digital persona, allows personalization to take place in an attempt to enhance customers’ experience [44]. New hyper-personalized financial services are offered so as to capture the full picture of online users, from traditional demographics to transactional behaviors and purchasing preferences. In a nutshell, when financial technology is combined with the latest technological developments, companies are able to provide innovative financial services, especially during crisis periods.
Fintech startups are now booming: With the technological innovations they offer, the financial sector is able to deliver a high level of digital services over the course of a crisis. CBI (2021) states that there are more than 800 unicorns in 2021, topping USD 1 B each, of which 162 are involved in fintech activities, making the industry very attractive and raising the competition bar extremely high [45]. However, even if fintech companies are leading other sectors, it is obvious that they face numerous challenges regarding trust and credibility [46], regulations [47], and data privacy risks [48] among others. Given that crises, such as the war, create a massive fintech boom, only companies that manage to cut through the noise by using unconventional marketing strategies will lead the way and become the industry norm.

1.4. Ukrainian War Crisis and Centralized Payment Networks’ Usage

Integrating new technologies into the international business network offers new challenges and new opportunities to global platforms and ecosystems [49]. Historically, crises come along with technological booms, in which reshaping mindsets and behaviors provides outstanding opportunities for businesses not only in providing relief in times of crisis but also outperforming competition during the recovery period [50]. The financial crisis in 2008 led to important innovations in the financial ecosystem, with e-payments, e-trading, and cryptocurrencies being some of the main advances of fintech companies [51]. The recent pandemic has altered how consumers and firms engage with financial service providers, causing tremendous growth in the use of digital financial services [52]. The fintech sector could not stop from being constantly developed, with rapid advances within the sector over the past few years to operate as an antidote to financial instability [53].
It is apparent that during crises, consumers change their behavior, moving to new digital habits and trends and accelerating digital adoption through digital channels [54]. This profound inclination toward digitalization set the ground for well-established digital companies to flourish since consumers tend to use trusted resources during crisis periods [55]. Indeed, trust is one of the most valued aspects of banking [56]. Although trust in banks tends to be lower in countries with financial instability [57], the evolution of technology enhances trust relationships [58]. According to Statista, fintech companies are considered as being more highly trusted financial institutions as opposed to traditional financial institutions, as mentioned by respondents aged between 18 and 24, with older age groups placing a gradual decrease in their levels of trust toward fintech companies; however, it is still higher than those of traditional institutions [59]. This fact demonstrates that centralized payment networks receive the attention and respect of consumers as being a more favorable means of conducting financial activities. To add to this, if it is considered that fintech companies surpass traditional banks in terms of convenience and ease of use due to their digital nature [60], it is likely that the latter will lose their previous popularity.
The war in Ukraine had a global ripple effect on the banking system and financial flow, especially since seven major Russian banks were disconnected from the SWIFT network on 12 March 2022 [61]. Despite the shift in sanctions and the new “isolation” culture that the Russian market and economy is facing during the war, the fintech sector still thrives in multiple ways. For instance, the SWIFT ban imposed on Russian and Belarusian banks [1] forced fintech companies to take actions to suspend or restrict transactions so as to remain compliant with the international sanctions imposed. As such, Fintech companies contribute to the enforcement of the financial aspect of the current conflict. In addition, the alternatives to SWIFT, the System for Transfer of Financial Messages system developed by Russia (SPFS) and China’s Cross-Border Interbank Payment System (CIPS), demand the development of new financial companies so as to connect the Russian economy with international businesses. Moreover, the war shakes the foundations of the economy [62] since all parties of cross-border transactions demand stable financial trade, without concerns about respective exchange rates and conversions to third-party currencies caused by the war. This will set the ground for technological advances in digital money, rendering the fintech ecosystem essential. On the other side of the spectrum, this humanitarian crisis has led millions of people to immigrate, having little or no credit history at all. Fintech companies should work in this direction with the intention to release innovative products so that this population, or any facing the same difficulties, even people in Russia, would benefit from access to fair and transparent financial services.
Since the Ukrainian war has continued to disturb human normalcy and the financial realm globally, the entire fintech ecosystem has practically been affected in some manner. To overcome future difficulties, the fintech sector has a potential to establish alternative payment rails and financial infrastructures. A crisis will almost certainly occur again; nevertheless, nations must guarantee that the financial effects are as modest as possible and work toward a more peaceful future.

1.5. Centralized Payment Network Firms (CPNs) Social Media Marketing

In 2021, centralized payment network firms (CPNs) ecosystem raised USD 210.1 B in investments, making the industry one of the fastest-growing sectors [63]. Therefore, the fintech industry has become the norm. As consumers shift to managing their finances digitally, increasing the potential user base, the competition with centralized payment network systems results in looking for ways to achieve a competitive advantage in the digital arena [64]. To continuously grow, expand, and vary among the competition, fintech companies should develop a customer-centric marketing strategy. However, running their marketing activities on digital rails becomes a daunting task for both fintech newbies and veterans since they operate in an increasingly saturated market.
According to the Digital 2022 Global Overview report, nearly 60% of the world’s population are active social media users using 7.5 platforms each month [65]. Hammerschlag et al. (2020) highlight the importance of social media as an effective marketing strategy for fintech companies to gain market traction [66]. This multi-channel marketing approach should be seen as an opportunity for fintech companies to establish their social presence and build brand awareness.
While brand awareness and lead generation are the main benefits of employing a solid social media strategy [67,68], customer engagement is crucial for organic traffic [69], customer advocacy [70], and relationship building [71]. One way to ensure customer engagement is the development of strong brand communities [72]. When it comes to customers’ interaction with brands, community marketing is a crucial component of digital marketing strategies. The roles are discrete: While the brand community develops a sense of connection among like-minded people, social media marketing ensures digital ways to connect with the audience, reaching larger numbers of potential customers. In essence, it is all about where companies can find their prospective clients and deliver the most well thought-out experience. Poorly feeding social media platforms proves to be insufficient as opposed to the employment of personalized marketing activities that will ensure customer engagement [73]. By asking questions, providing incentives, developing user engagement content, and making offers, all those actions can lead to improved engagements with followers and, thus, optimize digital branding.
Connecting and engaging with members of a brand community are now gold stands, and these methods not only build long-term relationships with existing clients but will further advance e-WOM with the intention of attracting new followers and converting them to brand advocates [74,75]. This is not to say that a social media strategy based on brand community is a fix-all solution. However, during crisis periods, the fundamental need of humans to belong somewhere and to have a voice will turn a company’s social media presence into an empowered contributor since it engages in public discourse.

1.6. Social Media and Customer Website Analytics

The proliferation of social media has metamorphosed social media platforms into viable communication channels that are able to synthesize a strong communication strategy that will increase online users’ engagement, brand awareness, and overall business performance. According to Statista [76], online users spend an average of 147 min per day on social media platforms, creating an unintentionally large amount of data. Social media analytics provides access to this enormous amount of data collected from social media platforms in order to give organizations useful information regarding online users’ behavior and facilitate the decision-making process of organizations [77]. In particular, during crisis periods, spotting trends in consumers’ behavior can provide an in-depth understanding of customers’ online journey process, which will in turn guide business decisions and influence digital marketing activities.
The results of the recent coronavirus crisis demonstrate that during novel crises, the rapid shift in digitalization affects customers’ preferences, making mapping a digital customer’s journey a challenging topic for businesses that do not want to fall behind [78]. Without measuring and analyzing social media efficiencies, businesses struggle to maintain a sustainable way to improve their performance. Social media analytics transforms the analysis of customers’ sentiments and their behavioral patterns into a simple process with data that, when leveraged efficiently, can be a powerful tool for business development in the long run.
Lately, the CPN industry has received great attention due to its ever-growing spur to continuously provide innovative, customized financial software solutions. The Russian invasion of Ukraine has had an impact on the world’s economy, but there is little information on how the fintech sector has been affected by this crisis. Given that crisis communication and the impact of social media receive great attention at a European level with the development of the RISE-SMA Project [79], the current paper addresses several emerging issues:
  • What is the impact of war on centralized payment network services?
  • How can social media behavioral KPIs enlighten customers’ online behavior during a war crisis?
  • How does social media analytics influence SEO tracking metrics?
  • What is the contribution of social media platforms with regard to centralized payment networks’ digital branding?
  • What are the recommended recovery actions that should be taken to diminish risk perceptions, improve digital marketing efforts, and enhance business visibility?
Multiple researchers have been devoted to social media analytics [80,81,82]. Within the crisis management field, numerous studies have been conducted with regard to social media analytics in Information Technology [83], the tourism industry [84], and political communication [85], among others. However, less attention has been placed on social media analytics within the ecosystem of centralized payment networks during crises. An interesting study has been carried out by Franco-Riquelme and Rubalcaba [86], using Twitter to analyze innovation and sustainable development goals for Fintech firms. However, the research has not been developed under the scope of a war crisis. In line with this research, the current study focused on analyzing and interpreting the data shared on different social media platforms to understand customers’ behavior and predict future purchasing attitudes during the course of a war. Specifically, the present study analyzes social media behavioral KPIs, setting the ground for the development of an effective digital marketing strategy. It is a novel topic that will elucidate users’ online behavior toward digital financial services during a wartime crisis escalation and evaluate the impact of developing innovative services as a crisis-management tool.
Proving CPNs’ innovation impact, constantly improving performance, and forming genuine customer relationships through every touchpoint on the way to making purchases are fundamental for the proper delivery of seamless customer expectations during crisis situations. When it is impossible to predict what lies around the corner, being agile and flexible in capitalizing on shifting market demands is of the essence. The new digital era demands the continuous deliver of digital financial services, regardless of the arising crisis: even if the global economy may collapse, financial activities will never end.

2. Materials and Methods

2.1. Research Hypotheses

Global supply networks have been significantly impacted by the conflict in Ukraine. Many of these changes are yet unknown since customer behavior is constantly changing in response to the dynamic nature of this novel situation. Global energy and food supply chain imbalances have caused financial uncertainty, affecting customer behavior on a global scale. Customers’ reactions to this highly volatile environment are a matter of great interest, especially taking into account the very significant dynamic of social media. An improved understanding of this complex network of variables that affects the relationship between customers and CPN organizations is of significant importance since it can provide organizations with valuable options for effective strategic planning during a war crisis. Providing answers to CPN companies regarding resource allocation and risk-mitigation strategy development during a war crisis can demonstrate the effectiveness of using passive crowdsourcing data as a risk-management tool for supply-chain companies.
The following five research hypotheses were created in order to address the problems raised above.
Hypothesis 1 (H1).
The outset of the Ukrainian war crisis caused significant variations in CPN websites’ organic visits.
War crises can be the source of great uncertainty. In particular, the Ukrainian war is able to trigger a global financial unbalance. The impact of this effect on the CPNs has not been thoroughly studied due to the nature and rarity of the crisis. The outcomes of this research question will assist CPN organizations in planning effective risk-management strategies by utilizing the dynamics of their digital branding.
Hypothesis 2 (H2).
Social media analytics can explain adequately the amount of traffic and keywords leading to CPN websites.
Social media’s influence on websites’ traffic during a war crisis is valuable information regarding customer behavior. Establishing a correlation between these variables can lead to useful outcomes that can help CPN organizations plan effective marketing plans during a war crisis using efficient resource allocation.
Hypothesis 3 (H3).
Social media analytics can affect the cost of CPN websites’ organic campaigns.
Investing resources to increase organic traffic is a well-established marketing strategy. The unstable environment, however, during a war crisis could alter aspects of customer behavior that were taken for granted. Details regarding the effect of social media analytics on this marketing strategy will allow CPN organizations to choose the most efficient option to invest financial resources.
Hypothesis 4 (H4).
The amount of social traffic that CPN websites attract is related to their social media analytic metrics.
War is a crisis that rarely arises in western societies. This “novelty” aspect of the risks involved is expected to increase the customers’ risk-involved perception [87]. The financial environment created by these circumstances could change usual customer behaviors [88]. The correlation between social media metrics and CPN websites’ social traffic during a war crisis will provide CPN companies with a powerful tool for risk-mitigation strategies within this volatile environment.
Hypothesis 5 (H5).
The percentage of visitors abandoning CPNs’ websites can be affected by its social media analytics.
The “Bounce Rate” is only one of website metric that demonstrates the tendency of visitors to abandon a website once they visit it. The elements that affect this tendency may be influenced by the dynamic environment created by a war crisis. This research question attempts to clarify the correlation between social media analytics and the percentage of visitors abandoning CPNs’ websites. Results will provide a clearer view of CPN organizations so that they will be able to plan more efficient business strategies by adapting their risk-management plans to dominant tendencies.

2.2. Sample and Data Retrieval

To support the aim of this study, the authors first discerned the 5 most known firms in the centralized payment sector and then proceeded to extract the valuable data from their websites. Starting with the firms’ selection, the criteria of customers’ evaluation, the amount of data transactions, and the number of benefits for users, such as utilitarianism and a low difficulty level of use [89]. Sample firms of interest are as follows: Authorizenet [90], Braintree [91] Paypal [92], Square [93], and Stripe [94]. After spotting the CPN firms’ websites of study, the next phase concerns webpage’ metric extraction. In order to collect the required website metrics, known as web analytics, we utilized a platform-based decision support system (DSS) that grants website data via payment. The DSS platforms that were utilized in our research are Semrush [95] and Fanpage Karma [96], with daily observations and the collection of the required web metrics taking place. The authors gathered website data for a period of 180 days, starting from 1 December 2021 to 30 June 2022. During this period, daily data were collected and processed, as observed in the following sections of the paper.

3. Results

3.1. Exploratory Model

Through the analysis of the FCM concept map, it is understood that the importance of CPN web pages is constantly changing as the impact of the war crisis escalates and affects consumer behavior, a fact that will enhance strategic decision-making skills [97]. It also increases the impact of the social media analytics effect on search engine rankings on the payment system.
Various organizations, guided by key interactions that crisis variables bring to e-branding rankings, will succeed in designing effective marketing processes in times of crisis. In the midst of the crisis of war, indicators of user loyalty show increased loyalty as users search the Internet for more information regarding the problems inflicted on electronic payments due to the war.
FCM is a parametric form of concept mapping, in which static models representing knowledge can be developed by defining basic properties of the system, such as system variables, positive or negative correlations between variables, and the correlation of one variable to another variable to a certain degree [98]. The FCM analysis mechanism is based on the structure of the concept map and is performed using graph-based analysis between the graph and the variables contained in the model. A system affected by many variables can be modeled with these models, attempting to describe the relationship between the variables and the system [99]. Big data mining provides massive amounts of data that need to be analyzed in order to turn them into information for businesses and organizations.
Using FCM, data can be turned into information by making complete inferences about the data received from the web. Misunderstandings about network data can lead to incorrect conclusions about information analysis, which can negatively impact an organization or company’s development strategy. For proper data analysis, the researchers recommend the use of FCM-based network analysis data. An analysis of the FCM concept map in question makes it evident that user engagement and organic traffic KPIs on the central payment system sites are increasing; consequently, more cost-effective e-branding strategies are emerging.
A well-known and branded company is more likely to attract visitors to its website compared to a company that does not have the corresponding recognition. However, crisis situations lead users to adopt new consumption habits [100]. An analysis of the FCM concept map shows that branding influences the organic traffic of central payment network websites.
Additionally, although the behavior of “Central Payment Networks” fluctuates at stable levels, variables “organic traffic,” “organic keywords,” and bounce rate show positive fluctuations compared to the traffic of “social traffic” and “organic traffic costs”, which are found in the negative axis for all tested values beyond that which CPN evaluates as “1”.
In this case, the inverse of the above finding is diverted. Organic traffic, organic keywords, and bounce rate show negative fluctuations as opposed to social traffic and organic traffic costs, which are on the positive axis, as shown in Figure 1. In Table 1, the correlations of the sample’s variables are shown. Those regression coefficients are the main base for deploying variables’ interconnections on the model of Figure 1. In Figure 2 the socioeconomic impacts of the War in Ukraine in the biggest countries can be seen.

FCM Analysis with Factors from the Model

By conducting the analysis of the FCM concept map, it is understandable that CPN is shaping up for the better as the crisis of war escalates and affects consumer behaviors accordingly. In addition, it increases the impact of the social media analytics effect on the search engine’s ranking on the payment system.
An analysis of the FCM concept map makes it evident that user engagement and organic traffic KPIs on central payment system sites are increasing, leading to more cost-effective e-branding strategies.
A branded company is more likely to attract visitors to its website than an unbranded company. However, wartime crisis situations lead users to adopt new consumption habits. An analysis of the FCM concept map reveals that social traffic influences the organic traffic of the central payment network websites. SMA stands for social media analytics, for which its level varies accordingly (Figure 3a–f):

3.2. Statistical Analysis

Moving to the statistical elaboration of data, the authors deployed statistical tools for extracting coefficients of the performed linear regressions. In this manner, the topical and stationary relevance of the FCM analysis’ variables can be validated by using regression analysis. For this purpose, we started the analysis by presenting four main descriptive statistics in Table 2 for all involved variables (both dependent and independent) so as to get a first idea of their characteristics. Most used variables are easy to interpret with respect to their meaning and metrics’ measurement. For instance, the social engagement metric is the percentage of interactions a social media profile has divided by the number of its followers [96].
Next, in Table 3, the Levene’s test for equality of variances is performed at the organic traffic variable, which is divided into two groups. The first group contains values before the beginning of the Ukrainian war crisis, and the second group contains values after its outset. The variable was selected due to its ability to show the number of visitors a website receives during an organic search. The p-value of Levene’s test is above the a = 0.05 significance level, meaning that the hypothesis of equal variances is not assumed. Regarding Hypothesis 1, no regression model was used due to the nature of the dependent variables. The authors cannot disguise the impact of the war’s timing relative to the organic traffic of CPNs; instead, they utilized Levene’s t-test for the same sample’s population to observe whether the variance of CPNs’ combined organic traffic before the outset of the war was similar to the one after the war’s outset [78]. Thus, the two groups of organic traffic values have different variances, and the paper’s first research hypothesis is verified, namely that the outset of the Ukrainian war crisis caused significant variations in CPN websites’ organic visits.
In Table 4 and Table 5 we obtain regression results of organic traffic and keywords as dependent variables for a total of nine independent social media analytic variables. As can be discerned, none of the linear regressions were verified in total since their p-values were above the a = 0.05 level of significance (0.163 and 0.191), despite high R2 = 0.914 and 0.903. Apart from that, no social media analytic variables significantly impacts the dependent variables of organic traffic and keywords, with p-values above the 0.05 significance level. Thus, our second research hypothesis is rejected, and social media analytics cannot adequately explain the number of traffic and keywords that lead to CPN websites.
Table 6 and Table 7 present linear regressions of CPNs’ organic traffic costs and social traffic as dependent variables. Again, as independent variables are used, nine social media analytic variables are used, but this time with both of regressions being verified in total with p-values = 0.000 < a = 0.01 and R2 = 0.999 and 1.000. Most independent variables significantly impact organic traffic costs and social traffic variables, with social media engagement and the number of fans affecting only social traffic. Given the above, research hypotheses 3 and 4 are verified, meaning that social media analytics affect the costs of CPN websites’ organic campaigns and are related to the amount of social traffic that CPN websites attract.
Finally, the regression of CPN websites’ bounce rate is provided in Table 8, which is overall verified with p-value = 0.000, <a = 0.01 level of significance, and R2 = 1.000. Each social media analytic variable significantly impacts the bounce-rate-dependent variable with all p-values = 0.000 and <a = 0.01 significance level. This means that our last research hypothesis is verified; thus, the percentage of visitors abandoning CPNs’ websites is affected by its social media analytic metrics.

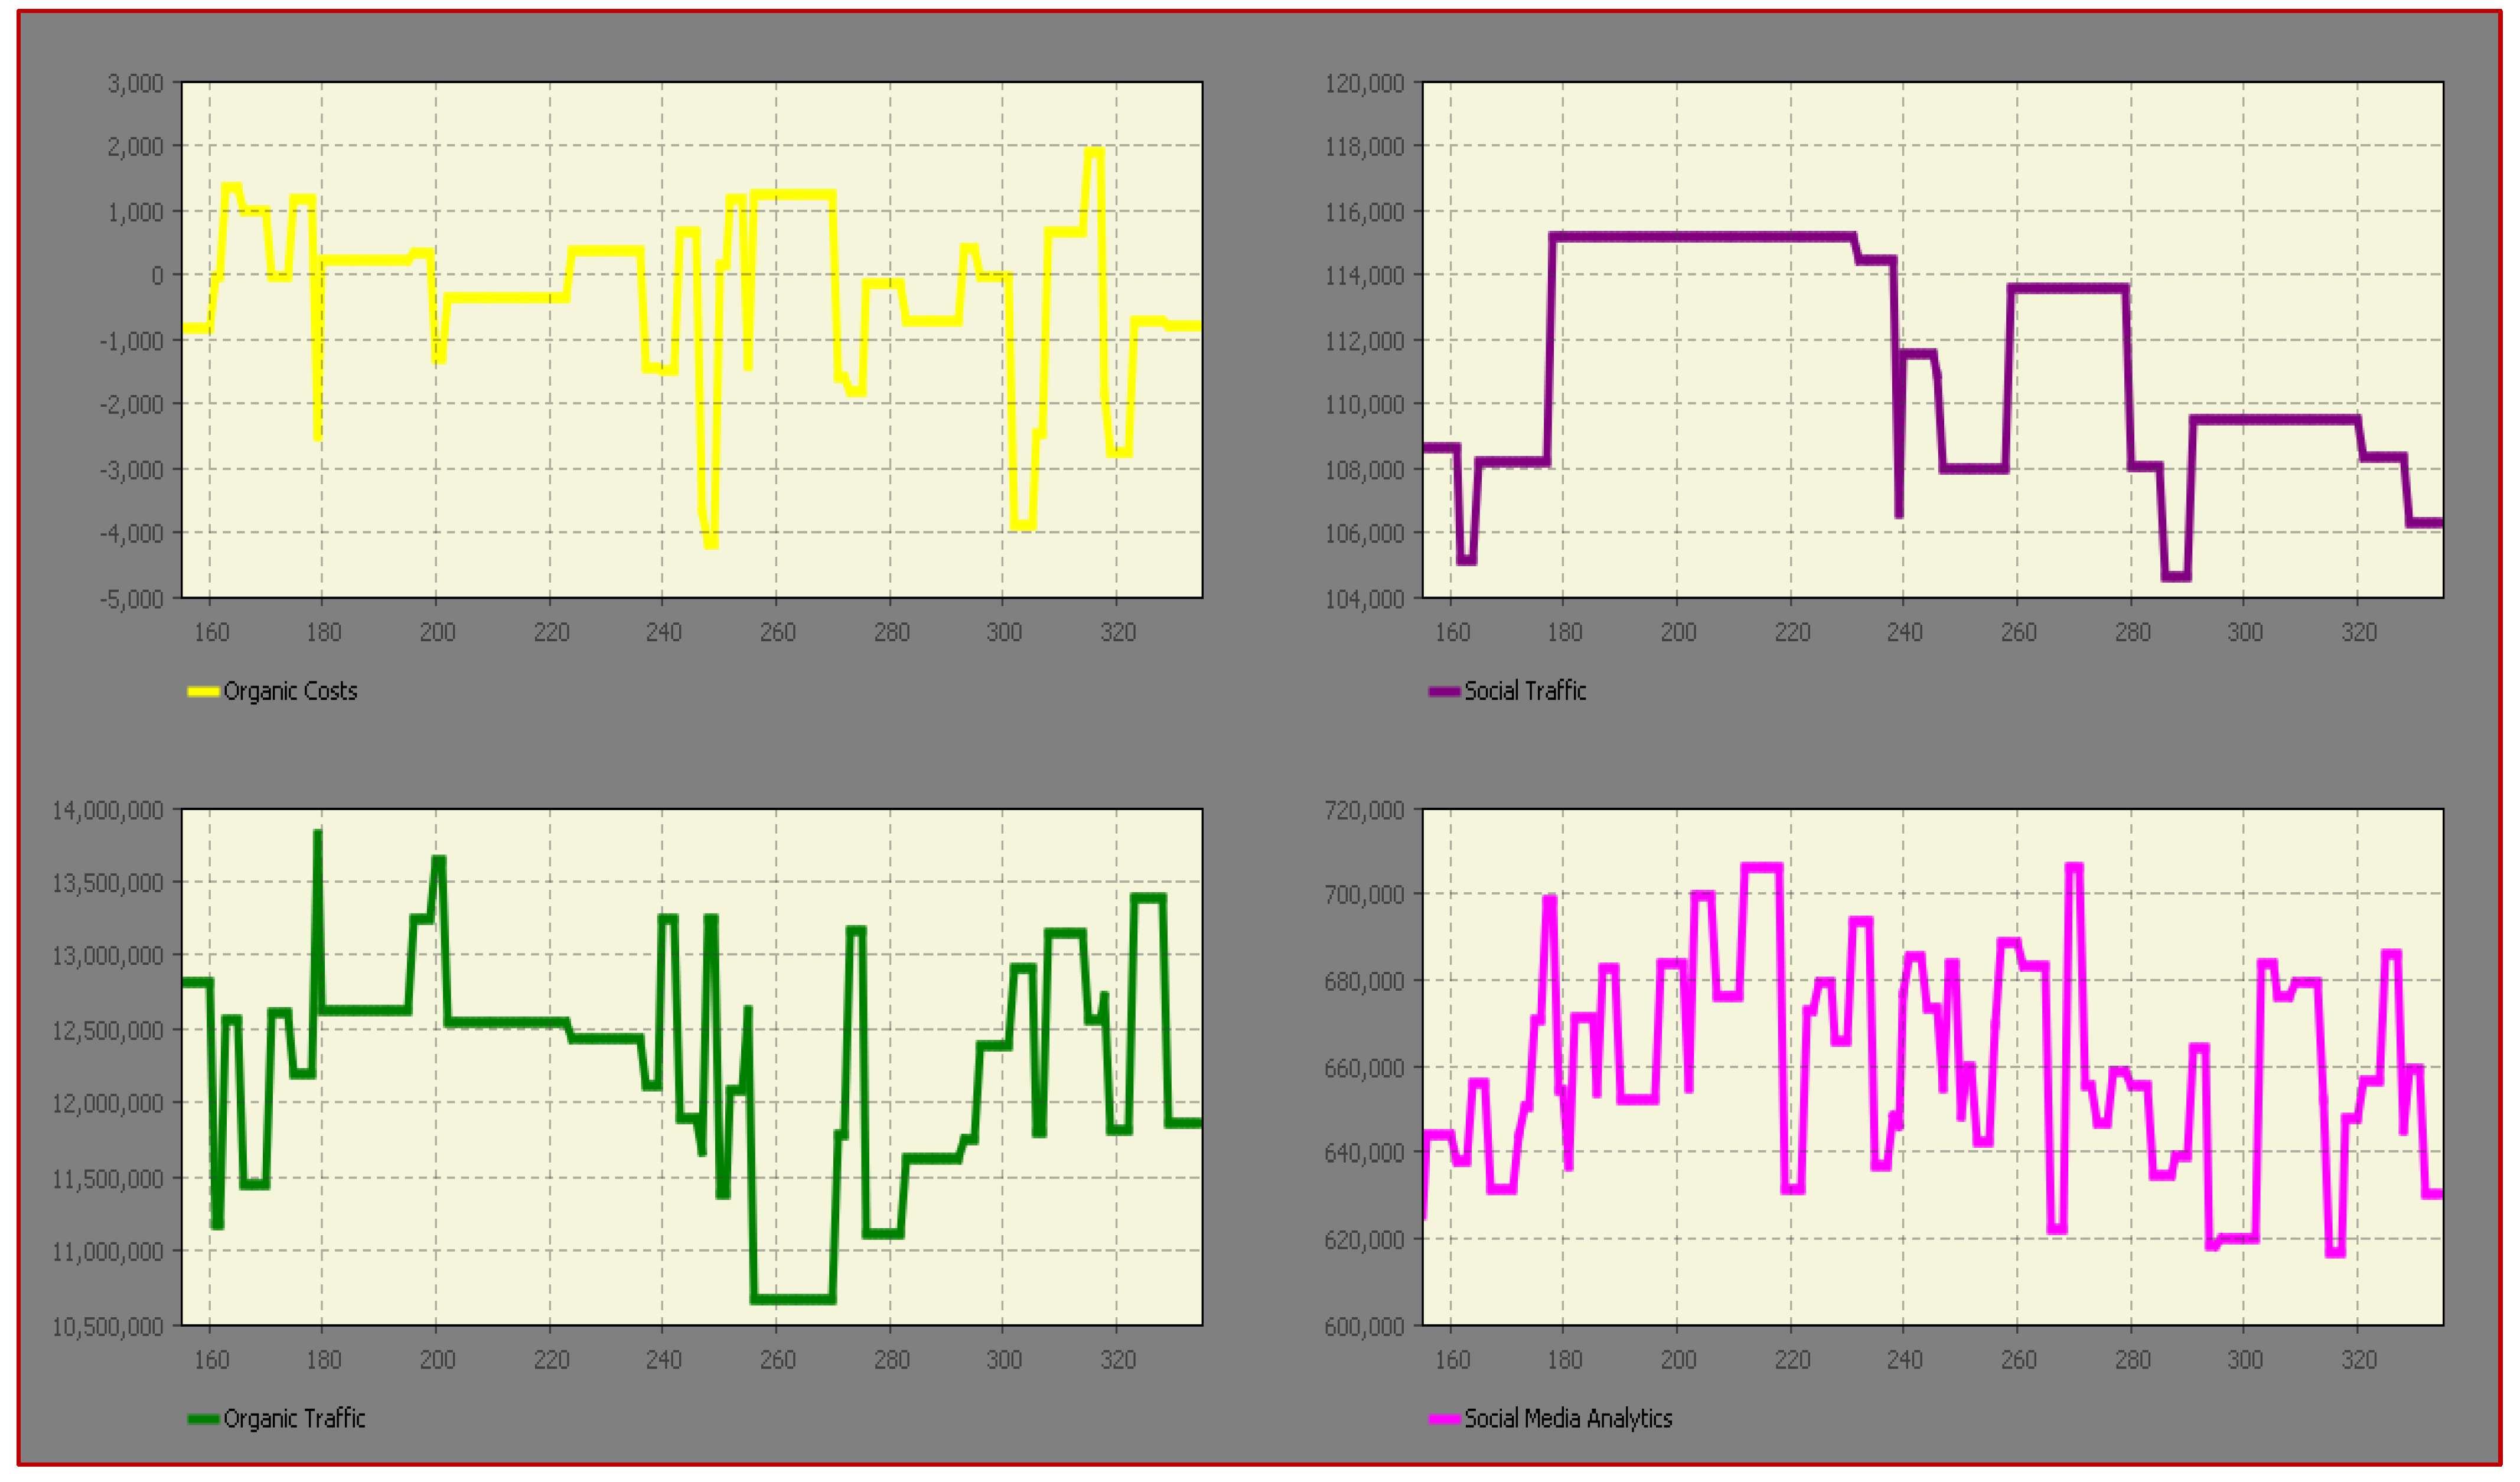
3.3. Simulation Model

At this stage of the paper, the authors capitalize on the Agent-Based Modeling (ABM) process to develop and shape a simulation model. This model will be based on the relationships and coefficients of all variables of the analysis, improving the model’s simulation and consistency [101]. The ABM analysis of the research aims to show the potential benefits of CPN firms’ organic traffic increase by decreasing their total organic campaign costs. Thus, the simulation’s key factors for observation are website organic traffic and campaign costs, as well as social traffic and bounce rates. By using this ABM process, visitors, depicted by agents, enter the model’s statecharts and interact with their parameters and variables to form procedures valuable for decision making. To perform the above process, agents strictly follow the variation in the model’s commands (if, and, etc.), parameters, and guidance lines (statecharts’ arrows). The paper’s simulation process is set to a 180 day period, with a one-time snapshot measurement.
Hence, in Figure 4, the ABM process begins by using the statechart of Centralized Payment Networks’ Visitors (CPNVisitors), where customers keen to visit CPN websites enter. These visitors will end up on a website either from social traffic sources or from every other traffic source (direct, referral traffic, etc.). Then, they contribute to the organic keyword variation of CPNs’ websites since they enter that statechart while reaching the last statechart of organic traffic. Each time they enter the final statechart of CPNs’ organic traffic, no matter if they abandon the website too soon (via the bounce rate statechart), their behavior is shaped and various social media analytic metrics begin to receive values following the normal distribution. Organic campaign costs also begin to be affected by agents’ movement. The Java routine can be observed in Table A1 in Appendix A.
Figure 5 below depicts a comparison of CPN firms’ website traffic allocation before and after the extensive strategic usage of social media analytics in digital marketing planning. With the beige color, we can see potential visitors of CPNs’ websites. The purple color shows CPN visitors from social media sources, while the gray color depicts visitors from all other traffic sources (direct, referral, etc.). Then, the red color represents the visitors that tend to abandon CPN firms’ websites, and the green color shows the visitors that contribute to their organic traffic. In Figure 5a, CPNs’ websites do not apply social media strategies to their digital marketing plans; thus, the number of red agents (those that abandon the website) is pretty high compared to green agents, which constitutes its organic traffic. On the contrary, in Figure 5b, where CPN firms use extensive social media strategies, we can discern that red agents show a significant decrease and green agents have risen in numbers, highlighting the positive impact of social media analytics elaboration on organic traffic enhancement.
CPN key digital marketing metrics’ variations are presented in Figure 6 below. In this way, authors can discern that social media analytics are varied in a similar way to all other metrics (organic traffic, organic campaign costs, and social traffic), and in most cases, its values slightly precede those of other metrics that have similar variations. For example, just before day 180 of the simulation, social media analytics had rising values, with an increase in social traffic, and then organic traffic started to increase in number, decreasing organic campaign costs. This graphical presentation of the website’s analytic metrics of digital marketing performance, together with social media analytic usage variations, can provide valuable intel for CPN firms about the efficiency of their social media strategies.

4. Discussion

In this section of the paper, the authors seek to investigate the outcome of multiple tools used for obtaining valuable insights for CPN firms’ digital marketing strategies. The authors focused on the utility and implications of social media strategy in explaining and assessing CPN organizations’ digital marketing performance and as a risk-management evaluation tool. To perform this, the war crisis in Ukraine was invoked, and data from the period before and after the crisis’ outset was retrieved and analyzed. For this reason, the authors capitalized on static and dynamic simulation models of FCM [97] and ABM [98], apart from statistical analysis, to extract the required outcomes.
Paper’s social media strategy included various variables and metrics from the five selected CPNs’ social media platforms, such as the number of fans, follower growth, number of comments, number of likes, etc. These social media analytics were found to covariate with key indicators of CPNs’ digital marketing performance, such as organic costs, organic traffic, bounce rate, and social traffic. Through that finding, the authors proceeded to suggest the exact impact of social media analytic metrics on CPNs’ organic traffic, costs, website bounce rate, and social traffic.
Having pointed out the significance of social media analytics in adequately explaining the variation of CPNs’ organic traffic, costs, bounce rate, and social traffic, the elaboration of the simulation analyses comes next. From the static modeling of FCM, we can observe that a gradual increase in all social media analytic metrics leads to much higher website organic traffic, lower organic campaign costs, a slight increase in organic keywords, and lower social website traffic, with the cost of a slight increase in website bounce rates. The increase in CPNs’ bounce rates is due to the large number of visitors landing on CPNs’ websites, with a small part of them being uninterested, which would not have landed on the site prior to the enhancement of social media analytics. Furthermore, the social website traffic decrease could be explained by the increase in organic traffic as a result of increased social media analytics, which might have switched the people visiting CPNs’ preference from social sources to organic search.
Regarding ABM’s dynamic simulation results, we can discern that organic traffic and organic costs are negatively connected, meaning when organic traffic rises and costs fall. Social and organic traffic courses closely follow the course of social media analytics, with less variation intensities. Thus, it can be suggested that CPNs can achieve higher organic and social traffic and reduce their organic costs by adjusting their social media metrics (e.g., increasing social media engagement and number of fans, decreasing posts per day, etc.). Overall, we can see that the role of social media analytics in increasing CPNs’ digital marketing performance is decisive since they are capable of enhancing key performance metrics of their websites after a proper adjustment of each metric.

5. Conclusions

5.1. Conclusions

Throughout the research context of the study, the main interest has shifted to the war crisis and CPNs’ digital marketing response. As shown from the Results section, CPNs’ digital marketing performance has been afflicted from the outset of the Ukrainian war crisis, causing a drop in their organic traffic levels. The authors attempted to estimate whether modeling and processing CPNs’ social media analytics could lead to enhanced digital marketing performance. More specifically, digital marketing’s enhancement could be achieved by increasing organic traffic, decreasing organic campaign costs [102], and increasing website traffic from social sources.
The results of this research study provide further intelligence concerning the implication of social media analytics and the overall strategy of centralized payment networks and, generally, Fintech firms. Our study is aligned with the following relevant literature findings. Wang et al. [103] stated that creating and supporting, using IT implications, knowledge bases for firms’ social media analytics could improve their overall marketing strategy and performance. Garg et al. [104] found that social media analytics, by harvesting customers’ engagement role, could significantly improve business performances and digital marketing outcomes. Social media analytics involve key components that allow business organizations to gather useful information regarding customers’ segments and are also efficiently utilized for marketing business processes [105]. By modeling social media analytics, business marketers can gain insights for their digital marketing campaigns depending on their market characteristics [106].
Furthermore, the outcome of social media analytics as an effective risk-management tool also supports the findings of Enekel et al. [107], who indicate that social media data, after being collected and analyzed, can be contextualized as a supporting tool for risk management, in addition to the findings of Chon and Kin [85] who suggest social media analytics as a valuable risk identification tool during a crisis.
As a result, social media strategy should be considered as an important process for CPN firms’ toolkit for improving their digital marketing performance and risk management via the proper adjustment of each social media metric.

5.2. Future Work

Social media analytics and strategies based on their empirical results for digital marketing performance assessment can be adopted by other relevant fields. For example, the strategic capitalization of social media could be adopted in decentralized finance and payment sectors to improve digital marketing performance. Since big data and web analytics have become valuable tools for analyzing the online behavior of customers, social media analytics could be added to this list and aid in the process of customer acknowledgement. In this manner, by examining corporate website and social platform users’ behavior, more accurate insights [108] might accrue in the sectors of centralized and decentralized payment network firms.

Author Contributions

Conceptualization, D.P.S.; methodology, D.P.S., N.T.G., and D.K.N.; software, N.T.G. and D.K.N.; validation, D.P.S., M.C.T., and N.K.; formal analysis, D.P.R., I.D.G.K., and M.C.T.; investigation, N.T.G., I.D.G.K., and N.K.; resources, D.P.R. and N.T.G.; data curation, I.D.G.K., M.C.T., and N.K.; writing—original draft preparation, D.P.R., N.T.G., I.D.G.K., M.C.T., D.K.N., and N.K.; writing—review and editing, D.P.R. and N.T.G.; visualization, D.P.S., D.P.R., and N.T.G.; supervision, D.P.S. and D.K.N.; project administration, D.P.S. and D.P.R.; funding acquisition, D.P.S., D.P.R., N.T.G., I.D.G.K., M.C.T., D.K.N., and N.K. All authors have read and agreed to the published version of the manuscript.

Funding

This research received no external funding.

Institutional Review Board Statement

Not applicable.

Informed Consent Statement

Not applicable.

Data Availability Statement

Not applicable.

Conflicts of Interest

The authors declare no conflict of interest.

Appendix A

Table A1. JAVA coding route for CPN websites’ social media analytics.
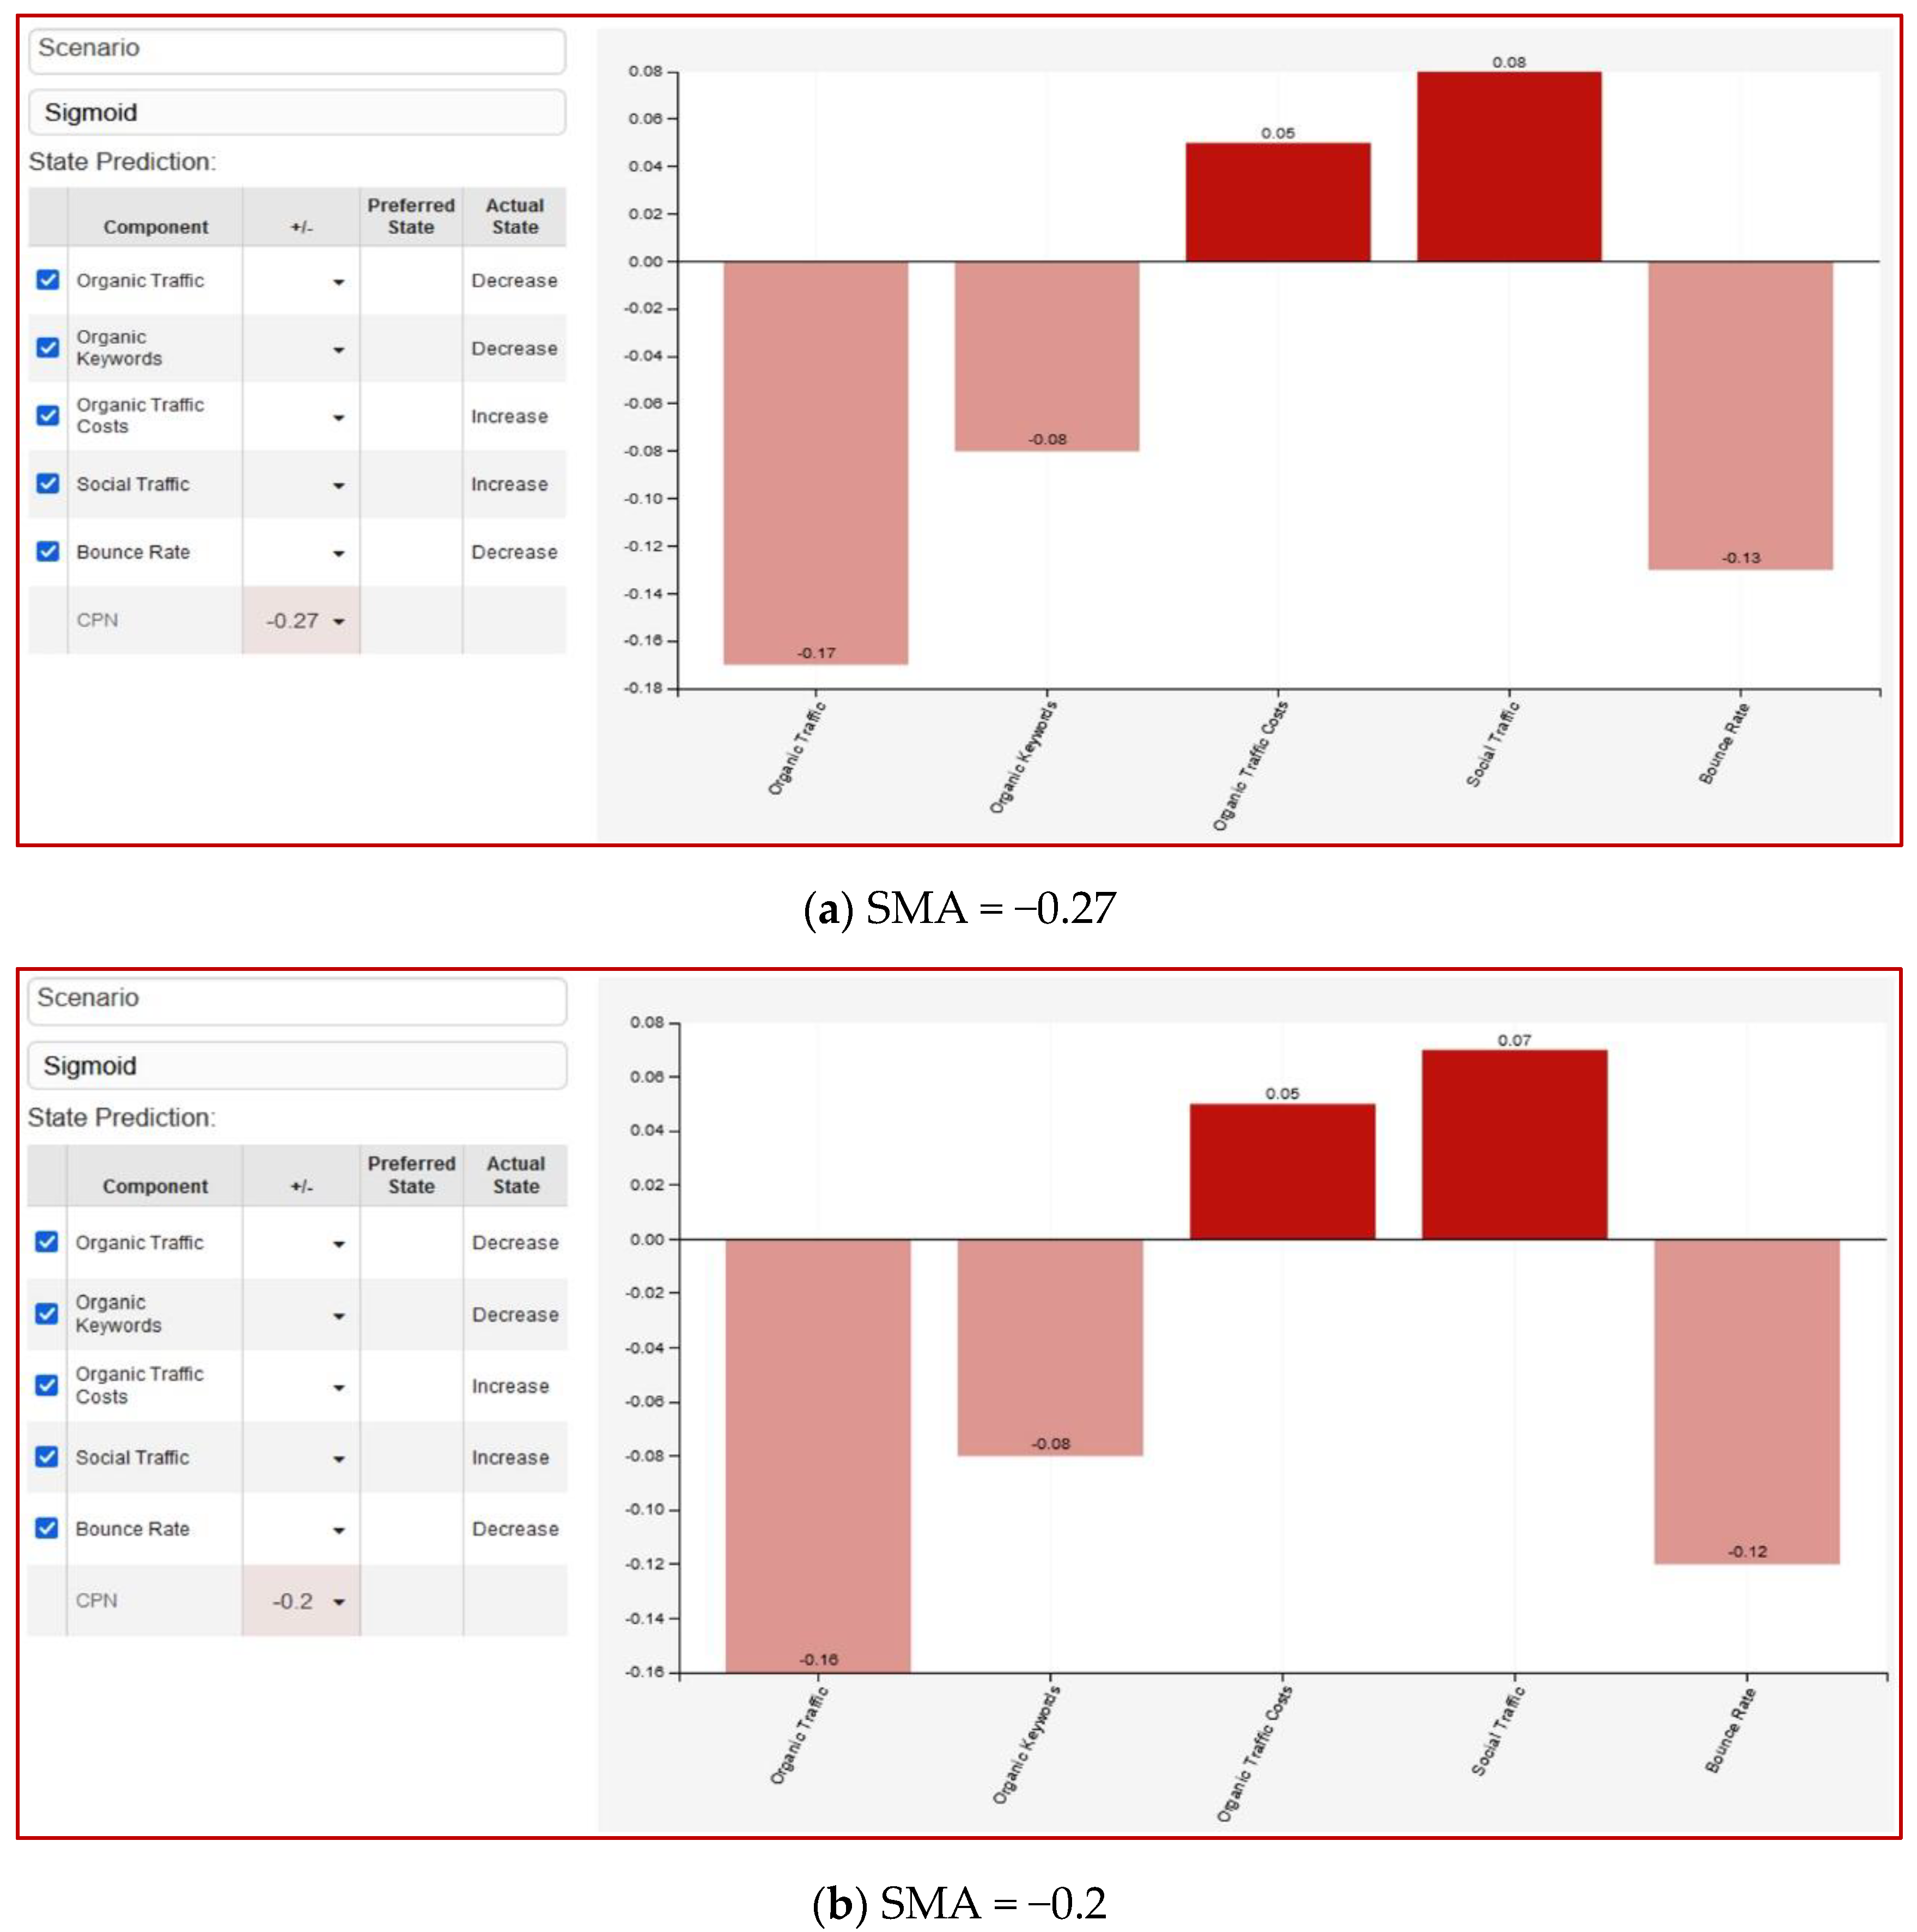
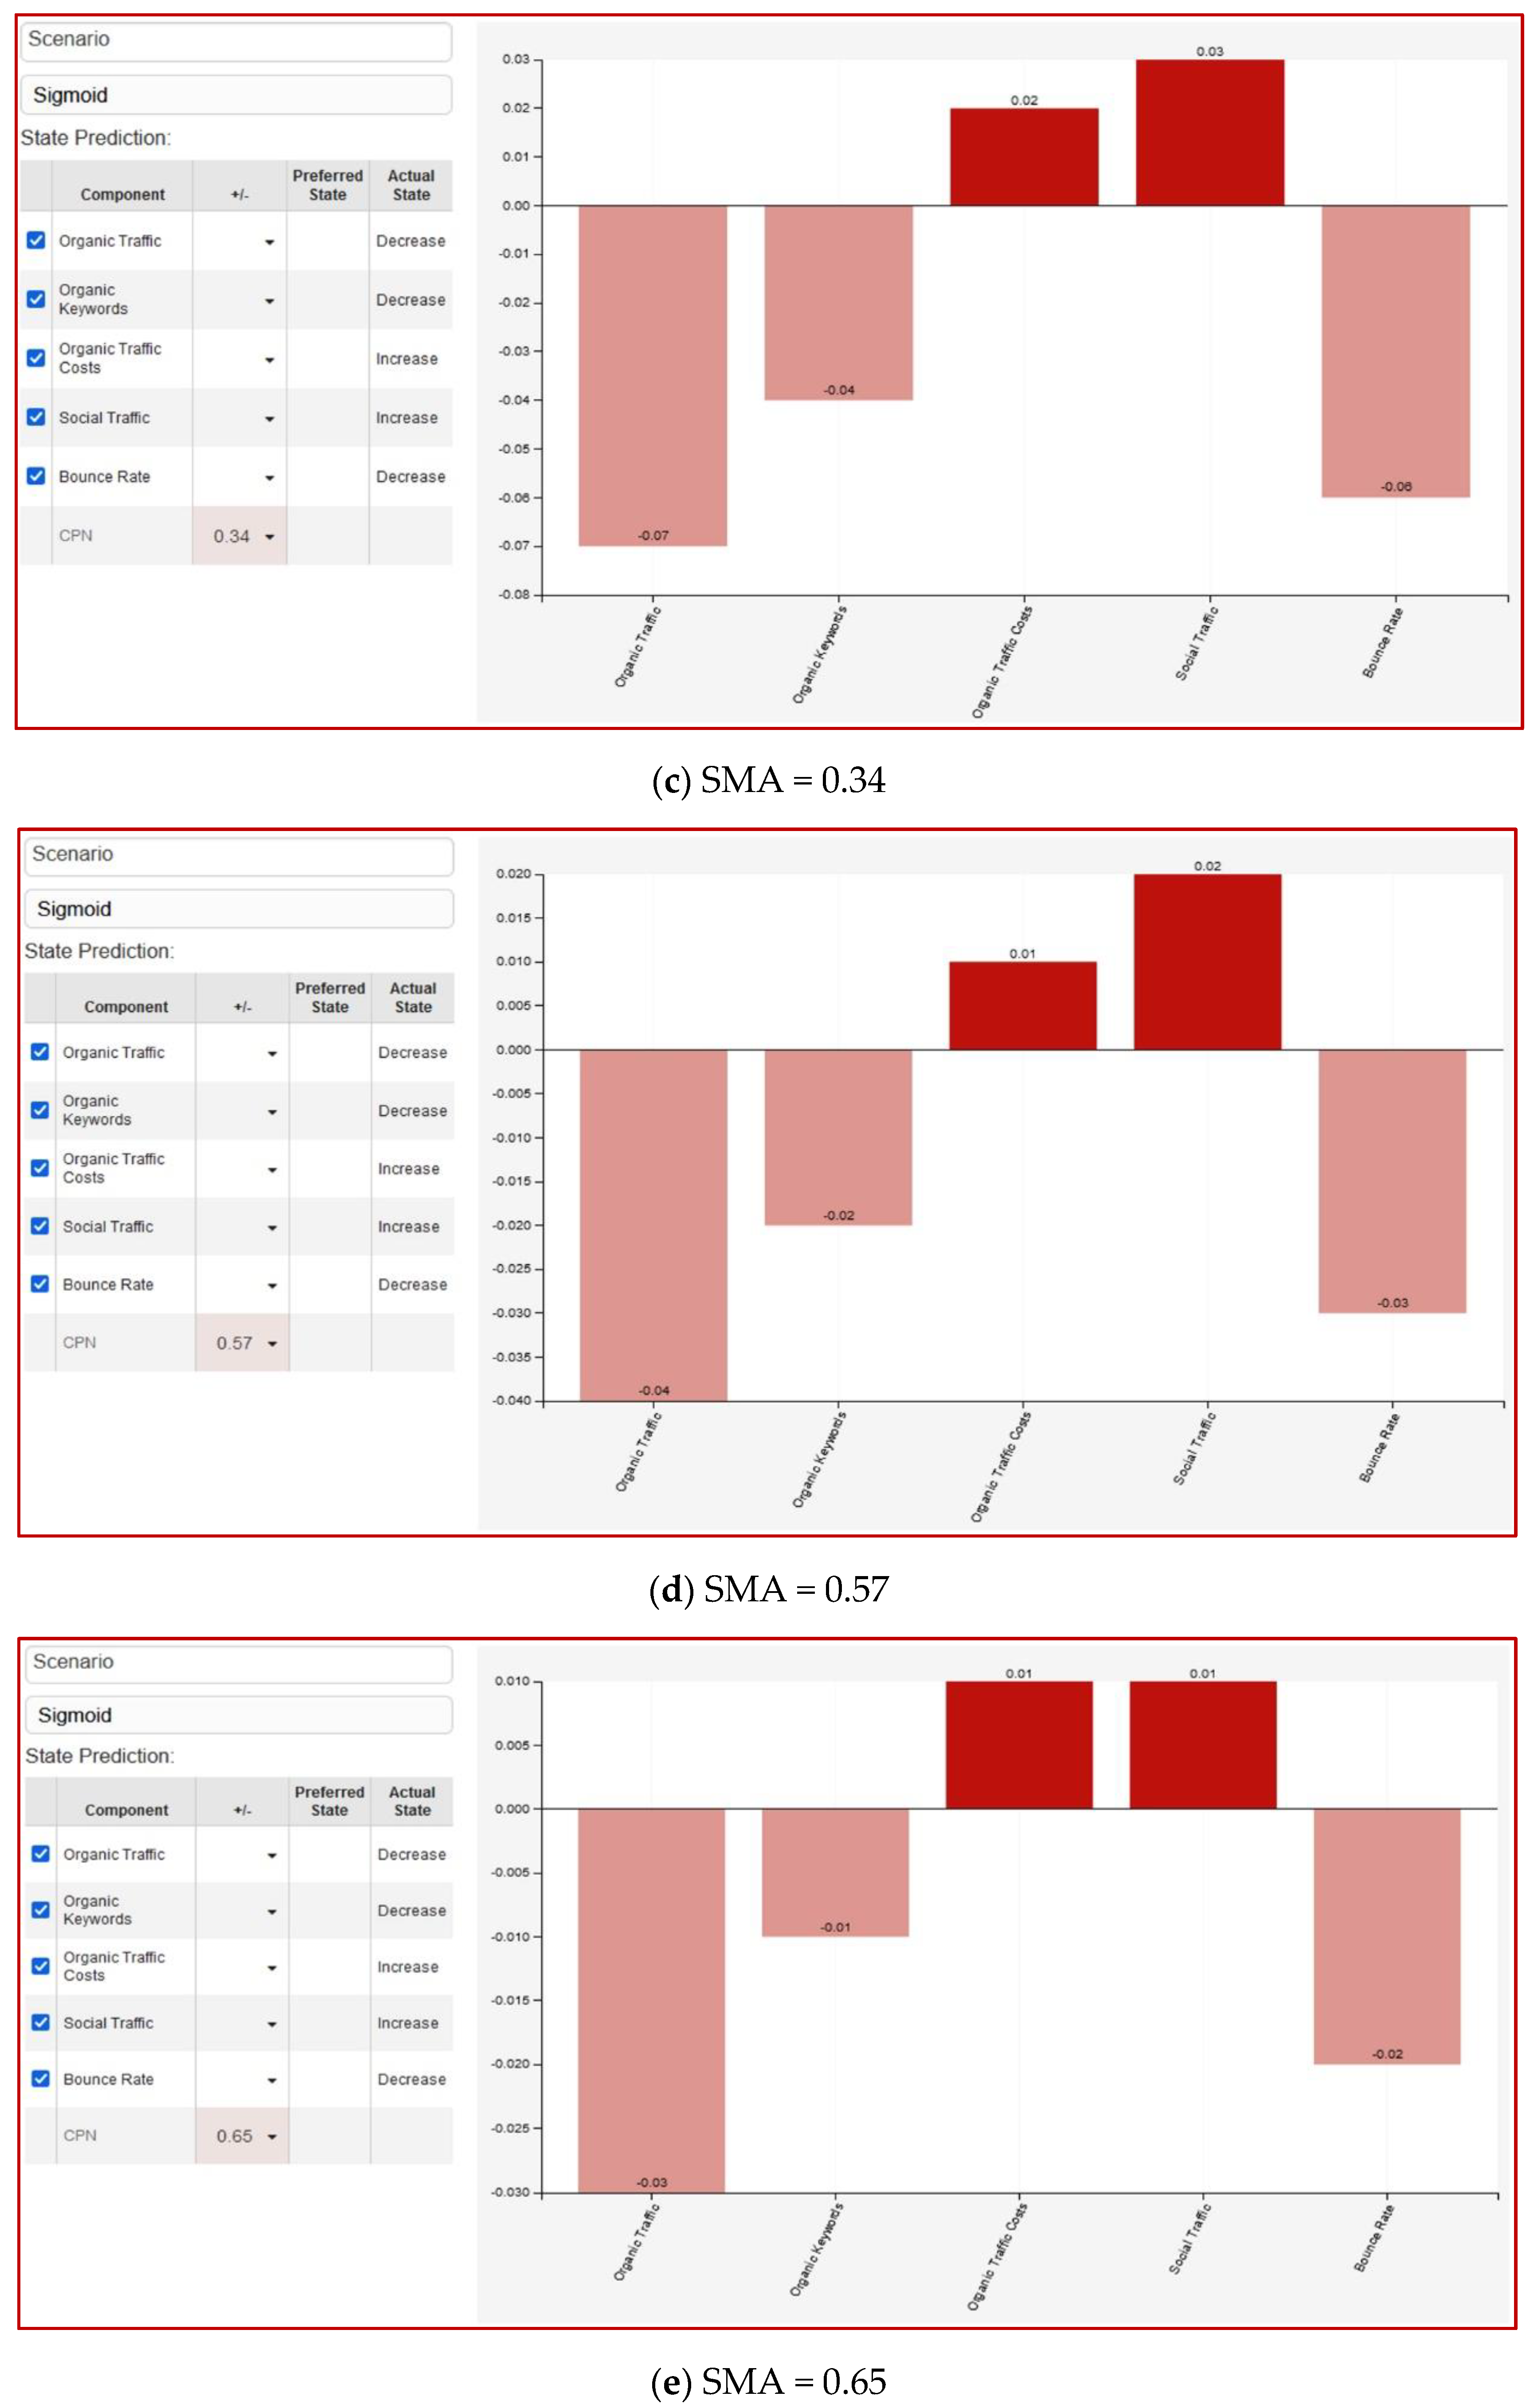
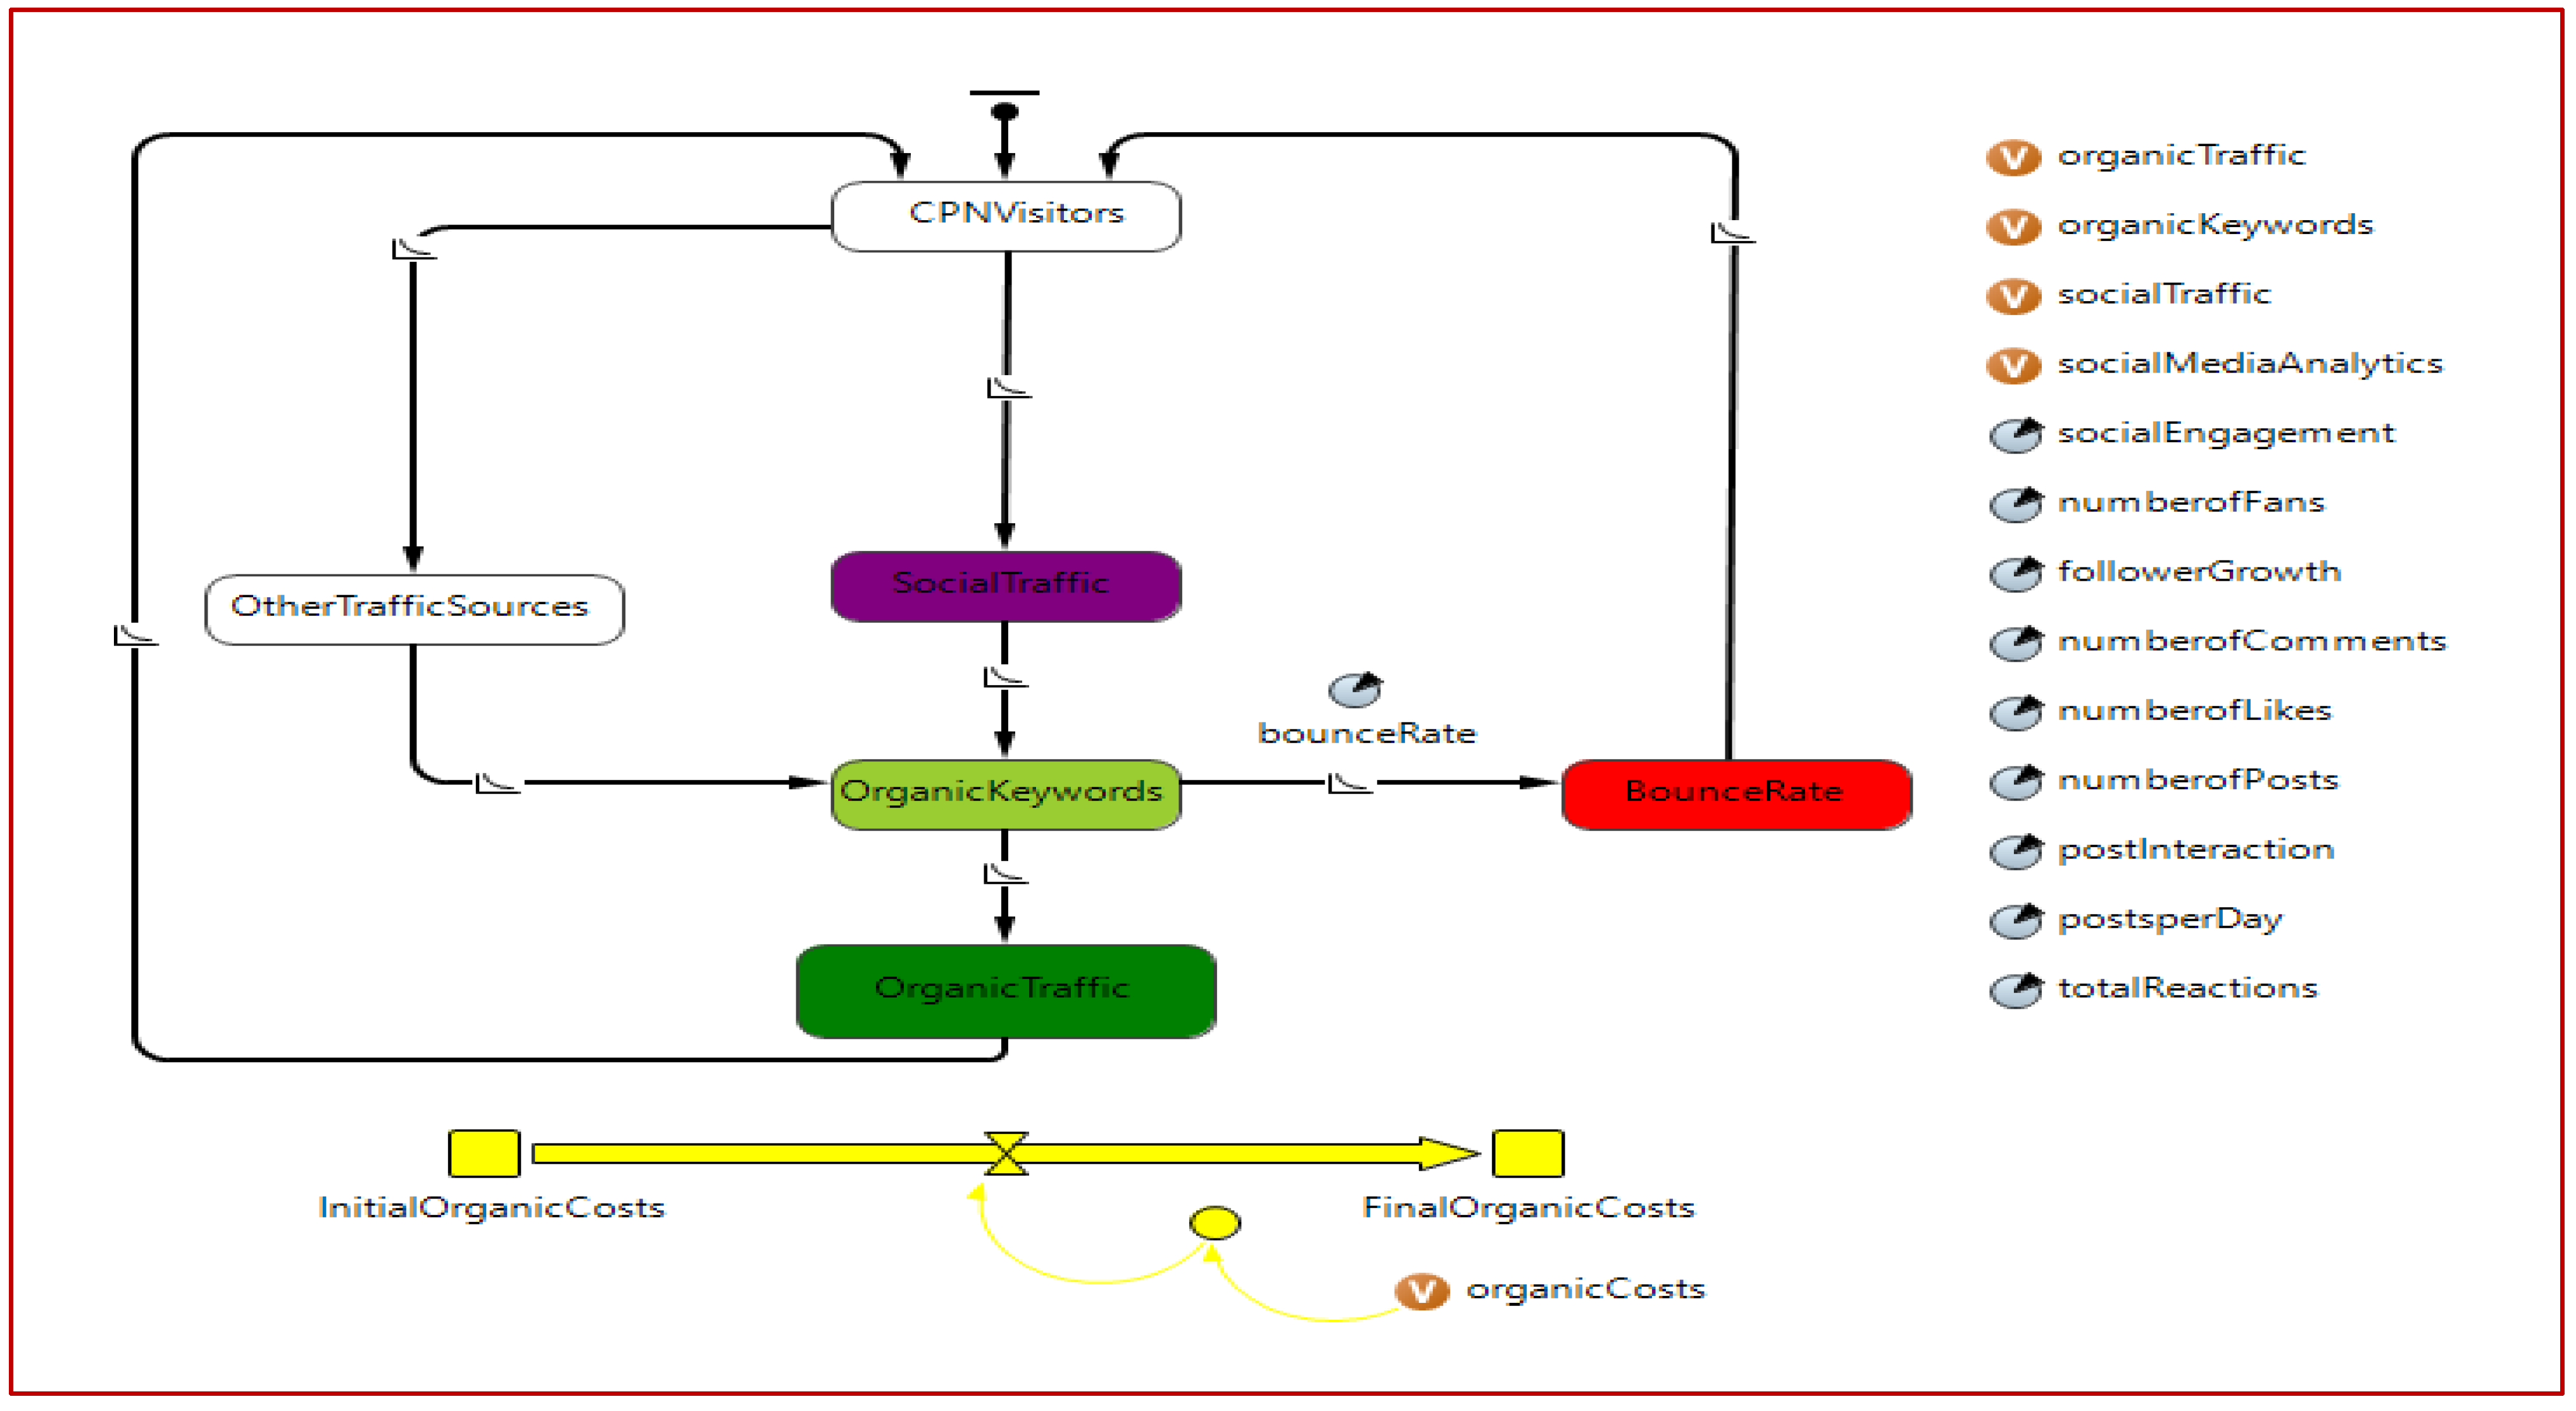
public void enterState(short _state, boolean _destination) {
switch(_state) {
case CPNVisitors: // (Simple state (not composite))
statechart.setActiveState_xjal(CPNVisitors);
{
socialEngagement = normal(0.00032, 0.0004);
numberofFans = normal(24069.3, 655557.22);
followerGrowth = normal(132.14295, 225.359);
numberofComments = normal(4.00367, 12.141);
numberofLikes = normal(202.65334, 239.0577);
numberofPosts = normal(1.92318, 11.9615);
postInteraction = normal(0.00095, 0.0009);
postsperDay = normal(0.2988, 1.8601);
totalReactions = normal(235.97, 283.7756);
socialMediaAnalytics = socialEngagement + numberofFans + followerGrowth + numberofComments + numberofLikes + numberofPosts + postInteraction + postsperDay + totalReactions
;}
transition.start();
transition1.start();
return;
case SocialTraffic: // (Simple state (not composite))
statechart.setActiveState_xjal(SocialTraffic);
{
bounceRate = normal(0.02007, 0.533164);
bounceRate = socialEngagement*(0.002) + numberofFans*(−0.643) + followerGrowth*(0.472) + numberofComments*(0.007) + numberofPosts*(0.934) + totalReactions*(0.743);
socialTraffic = normal(255904.58, 651846.114);
socialTraffic = socialEngagement*(1.144) + numberofFans*(0.165) + followerGrowth*(0.225) + numberofComments*(0.445) + numberofPosts*(−0.988) + totalReactions*(−0.023)
;}
transition3.start();
return;
case OrganicKeywords: // (Simple state (not composite))
statechart.setActiveState_xjal(OrganicKeywords);
{
organicKeywords = normal(32227.48, 616364.616)
;}
transition4.start();
transition5.start();
return;
case OrganicTraffic: // (Simple state (not composite))
statechart.setActiveState_xjal(OrganicTraffic);
{
bounceRate = normal(0.02007, 0.533164);
organicTraffic = normal(846987.5, 12396829.1);
organicCosts = normal(4411200.442, 22115440.80);
organicCosts = followerGrowth*(−0.454) + numberofComments*(0.591) + numberofLikes*(4.489) + numberofPosts*(−7.529) + postInteraction*(−1.137) + postsperDay*(7.513) + totalReactions*(−4.881)
;}
transition7.start();
return;
case BounceRate: // (Simple state (not composite))
statechart.setActiveState_xjal(BounceRate);
transition6.start();
return;
case OtherTrafficSources: // (Simple state (not composite))
statechart.setActiveState_xjal(OtherTrafficSources);
{
bounceRate = normal(0.02007, 0.533164);
bounceRate = socialEngagement*(0.002) + numberofFans*(−0.643) + followerGrowth*(0.472) + numberofComments*(0.007) + numberofPosts*(0.934) + totalReactions*(0.743)
;}
transition2.start();
return;
default:
super.enterState(_state, _destination);
return;
}
}
@Override
@AnyLogicInternalCodegenAPI
public void exitState(short _state, Transition _t, boolean _source, Statechart _statechart) {
switch(_state) {
case CPNVisitors: // (Simple state (not composite))
if (!_source || _t!= transition) transition.cancel();
if (!_source || _t!= transition1) transition1.cancel();
return;
case SocialTraffic: // (Simple state (not composite))
if (!_source || _t!= transition3) transition3.cancel();
return;
case OrganicKeywords: // (Simple state (not composite))
if (!_source || _t!= transition4) transition4.cancel();
if (!_source || _t!= transition5) transition5.cancel();
return;
case OrganicTraffic: // (Simple state (not composite))
if (!_source || _t!= transition7) transition7.cancel();
return;
case BounceRate: // (Simple state (not composite))
if (!_source || _t!= transition6) transition6.cancel();
return;
case OtherTrafficSources: // (Simple state (not composite))
if (!_source || _t!= transition2) transition2.cancel();
return;
default:
super.exitState(_state, _t, _source, _statechart);
return;
} }

References

  1. EU Sanctions against Russia Explained. Available online: https://www.consilium.europa.eu/en/policies/sanctions/restrictive-measures-against-russia-over-ukraine/sanctions-against-russia-explained (accessed on 27 July 2022).
  2. EU Statement on Safety, Security, and Safeguards Implications of the Situation in Ukraine as Delivered at the International Atomic Energy Agency (IAEA) Board of Governors on 9 March 2022. Available online: https://www.eeas.europa.eu/eeas/eu-statement-safety-security-and-safeguards-implications-situation-ukraine-delivered_en (accessed on 27 July 2022).
  3. War and the World Economy: Stock Market Reactions to International Conflicts on JSTOR. Available online: https://www.jstor.org/stable/27638514 (accessed on 1 August 2022).
  4. The Impact on Trade and Development of the War in Ukraine. Available online: https://unctad.org/system/files/official-document/osginf2022d1_en.pdf (accessed on 27 July 2022).
  5. Blessley, M.; Mudambi, S.M. A Trade War and a Pandemic: Disruption and Resilience in the Food Bank Supply Chain. Ind. Mark. Manag. 2022, 102, 58–73. [Google Scholar] [CrossRef]
  6. Unlu, A.; Kapucu, N.; Sahin, B. Disaster and Crisis Management in Turkey: A Need for a Unified Crisis Management System. Disaster Prev. Manag. Int. J. 2010, 19, 155–174. [Google Scholar] [CrossRef]
  7. Larsson, O.L. The Connections between Crisis and War Preparedness in Sweden. Secur. Dialogue 2021, 52, 306–324. [Google Scholar] [CrossRef]
  8. Freedman, L. Ukraine and the Art of Crisis Management. Survival 2014, 56, 7–42. [Google Scholar] [CrossRef] [Green Version]
  9. Sendai Framework for Disaster Risk Reduction 2015–2030. Available online: https://www.undrr.org/publication/sendai-framework-disaster-risk-reduction-2015-2030 (accessed on 27 July 2022).
  10. Iankova, K.; Longart, P. Marketing after COVID-19: Crisis Adaptation, Innovation and Sustainable Technological Advances. Trans. Mkt. J. 2022, 10, 1–3. [Google Scholar] [CrossRef]
  11. Tut, D. FinTech and the COVID-19 Pandemic: Evidence from Electronic Payment Systems. In MPRA Paper; University Library of Munich: Munich, Germany, 2020; Available online: https://EconPapers.repec.org/RePEc:pra:mprapa:102401 (accessed on 30 July 2022).
  12. Charaia, V.; Chochia, A.; Lashkhi, M. Promoting Fintech Financing for SME in S. Caucasian and Baltic States, During the COVID-19 Global Pandemic. J. Bus. Manag. Econ. Eng. 2021, 19, 358–372. [Google Scholar] [CrossRef]
  13. Sugandi, E.A. The COVID-19 Pandemic and Indonesia’s Fintech Markets. In ADBI Working Paper 1281; Asian Development Bank Institute: Tokyo, Japan, 2021; Available online: https://www.adb.org/publications/covid-19-pandemic-indonesia-fintech-markets (accessed on 30 July 2022).
  14. Warsaw School of Management—Higher School, Warsaw, Poland; Gajda, W.; Zaplatynskyi, V. Innovations in Crisis Management. MEST J. 2017, 5, 32–39. [Google Scholar] [CrossRef]
  15. Wang, W.; Cao, Q.; Qin, L.; Zhang, Y.; Feng, T.; Feng, L. Uncertain Environment, Dynamic Innovation Capabilities and Innovation Strategies: A Case Study on Qihoo 360. Comput. Hum. Behav. 2019, 95, 284–294. [Google Scholar] [CrossRef]
  16. Woolliscroft, J.O. Innovation in Response to the COVID-19 Pandemic Crisis. Acad. Med. 2020, 95, 1140–1142. [Google Scholar] [CrossRef]
  17. Głodziński, E.; Marciniak, S. Organizational Innovations in Crisis Management of Project-Based Enterprises. Econ. Bus. 2016, 28, 26–32. [Google Scholar] [CrossRef]
  18. Driving Innovation in Crisis Management for European Resilience. Available online: https://cordis.europa.eu/project/id/607798 (accessed on 28 July 2022).
  19. Rutsaert, P.; Regan, Á.; Pieniak, Z.; McConnon, Á.; Moss, A.; Wall, P.; Verbeke, W. The Use of Social Media in Food Risk and Benefit Communication. Trends Food Sci. Technol. 2013, 30, 84–91. [Google Scholar] [CrossRef]
  20. Regan, Á.; Raats, M.; Shan, L.C.; Wall, P.G.; McConnon, Á. Risk Communication and Social Media during Food Safety Crises: A Study of Stakeholders’ Opinions in Ireland. J. Risk Res. 2016, 19, 119–133. [Google Scholar] [CrossRef]
  21. Smith, L.; Liang, Q.; James, P.; Lin, W. Assessing the Utility of Social Media as a Data Source for Flood Risk Management Using a Real-Time Modelling Framework: Assessing the Utility of Social Media for Flood Risk Management. J. Flood Risk Manag. 2017, 10, 370–380. [Google Scholar] [CrossRef]
  22. Tang, Z.; Zhang, L.; Xu, F.; Vo, H. Examining the Role of Social Media in California’s Drought Risk Management in 2014. Nat. Hazards 2015, 79, 171–193. [Google Scholar] [CrossRef]
  23. Holderness, T.; Turpin, E. From Social Media to GeoSocial Intelligence: Crowdsourcing Civic Co-Management for Flood Response in Jakarta, Indonesia. In Social Media for Government Services; Nepal, S., Paris, C., Georgakopoulos, D., Eds.; Springer International Publishing: Cham, Switzerland, 2015; pp. 115–133. ISBN 978-3-319-27235-1. [Google Scholar]
  24. Alexander, D.E. Social Media in Disaster Risk Reduction and Crisis Management. Sci. Eng. Ethics 2014, 20, 717–733. [Google Scholar] [CrossRef]
  25. Kraus, S.; Clauss, T.; Breier, M.; Gast, J.; Zardini, A.; Tiberius, V. The Economics of COVID-19: Initial Empirical Evidence on How Family Firms in Five European Countries Cope with the Corona Crisis. IJEBR 2020, 26, 1067–1092. [Google Scholar] [CrossRef]
  26. Dahlke, J.; Bogner, K.; Becker, M.; Schlaile, M.P.; Pyka, A.; Ebersberger, B. Crisis-Driven Innovation and Fundamental Human Needs: A Typological Framework of Rapid-Response COVID-19 Innovations. Technol. Forecast. Soc. Chang. 2021, 169, 120799. [Google Scholar] [CrossRef]
  27. Dahles, H.; Susilowati, T.P. Business Resilience in Times of Growth and Crisis. Ann. Tour. Res. 2015, 51, 34–50. [Google Scholar] [CrossRef]
  28. Aboramadan, M.; Albashiti, B.; Alharazin, H.; Zaidoune, S. Organizational Culture, Innovation and Performance: A Study from a Non-Western Context. JMD 2019, 39, 437–451. [Google Scholar] [CrossRef]
  29. Dobni, C.B. Measuring Innovation Culture in Organizations: The Development of a Generalized Innovation Culture Construct Using Exploratory Factor Analysis. Eur. J. Innov. Manag. 2008, 11, 539–559. [Google Scholar] [CrossRef]
  30. Dawson, M.; Abbott, J.; Shoemaker, S. The Hospitality Culture Scale: A Measure Organizational Culture and Personal Attributes. Int. J. Hosp. Manag. 2011, 30, 290–300. [Google Scholar] [CrossRef]
  31. Büschgens, T.; Bausch, A.; Balkin, D.B. Organizational Culture and Innovation: A Meta-Analytic Review: Organizational Culture and Innovation. J. Prod. Innov. Manag. 2013, 30, 763–781. [Google Scholar] [CrossRef]
  32. Russia-Ukraine War Increases Financial Stability Risks, ECB Financial Stability Review Finds. Available online: https://www.ecb.europa.eu/press/pr/date/2022/html/ecb.pr220525~fa1be4764d.en.html (accessed on 28 July 2022).
  33. Sanctions List Search. Available online: https://sanctionssearch.ofac.treas.gov (accessed on 28 July 2022).
  34. Ante, L. The Non-Fungible Token (NFT) Market and Its Relationship with Bitcoin and Ethereum. FinTech 2022, 1, 216–224. [Google Scholar] [CrossRef]
  35. Where the World Regulates Cryptocurrency. Available online: https://www.statista.com/chart/27069/cryptocurrency-regulation-world-map/ (accessed on 27 July 2022).
  36. Haroon, O.; Rizvi, S.A.R. COVID-19: Media Coverage and Financial Markets Behavior—A Sectoral Inquiry. J. Behav. Exp. Financ. 2020, 27, 100343. [Google Scholar] [CrossRef]
  37. Haapio, H.; Mero, J.; Karjaluoto, H.; Shaikh, A.A. Implications of the COVID-19 Pandemic on Market Orientation in Retail Banking. J. Financ. Serv. Mark. 2021, 26, 205–214. [Google Scholar] [CrossRef]
  38. Panjaitan, F.A.B.K.; Sayyid, M.; Maqsudi, A.; Andjarwati, T. The Impact of the COVID-19 Pandemic on the Batik Industry: An Empirical Study in Indonesia. J. Asian Financ. Econ. Bus. 2021, 8, 923–930. [Google Scholar] [CrossRef]
  39. Almeida, F.; Duarte Santos, J.; Augusto Monteiro, J. The Challenges and Opportunities in the Digitalization of Companies in a Post-COVID-19 World. IEEE Eng. Manag. Rev. 2020, 48, 97–103. [Google Scholar] [CrossRef]
  40. Guo, H.; Yang, Z.; Huang, R.; Guo, A. The Digitalization and Public Crisis Responses of Small and Medium Enterprises: Implications from a COVID-19 Survey. Front. Bus. Res. China 2020, 14, 19. [Google Scholar] [CrossRef]
  41. Amankwah-Amoah, J. Note: Mayday, Mayday, Mayday! Responding to Environmental Shocks: Insights on Global Airlines’ Responses to COVID-19. Transp. Res. Part E Logist. Transp. Rev. 2020, 143, 102098. [Google Scholar] [CrossRef]
  42. Bertoni, F.; Bonini, S.; Capizzi, V.; Colombo, M.G.; Manigart, S. Digitization in the Market for Entrepreneurial Finance: Innovative Business Models and New Financing Channels. Entrep. Theory Pract. 2021, 46, 104225872110384. [Google Scholar] [CrossRef]
  43. FinTech—Worldwide|Statista Market Forecast. Available online: https://www.statista.com/outlook/dmo/fintech/worldwide (accessed on 28 July 2022).
  44. Gozman, D.; Liebenau, J.; Mangan, J. The Innovation Mechanisms of Fintech Start-Ups: Insights from SWIFT’s Innotribe Competition. J. Manag. Inf. Syst. 2018, 35, 145–179. [Google Scholar] [CrossRef]
  45. Our Top 2021 Unicorn Reports. Available online: https://www.cbinsights.com/research/report/unicorn-research-reports/ (accessed on 28 July 2022).
  46. Stewart, H.; Jürjens, J. Data Security and Consumer Trust in FinTech Innovation in Germany. ICS 2018, 26, 109–128. [Google Scholar] [CrossRef]
  47. Jagtiani, J.; John, K. Fintech: The Impact on Consumers and Regulatory Responses. J. Econ. Bus. 2018, 100, 1–6. [Google Scholar] [CrossRef]
  48. Lee, Ae Ri; Ahn, Hyo Young Fintech Users’ Information Privacy Concerns and User Resistance: Investigating the Interaction Effect with Regulatory Focus. J. Korea Inst. Inf. Secur. Cryptol. 2016, 26, 209–226. [CrossRef] [Green Version]
  49. Nambisan, S.; Zahra, S.A.; Luo, Y. Global Platforms and Ecosystems: Implications for International Business Theories. J. Int. Bus. Stud. 2019, 50, 1464–1486. [Google Scholar] [CrossRef]
  50. Archibugi, D.; Filippetti, A.; Frenz, M. Economic Crisis and Innovation: Is Destruction Prevailing over Accumulation? Res. Policy 2013, 42, 303–314. [Google Scholar] [CrossRef] [Green Version]
  51. Suryono, R.R.; Budi, I.; Purwandari, B. Challenges and Trends of Financial Technology (Fintech): A Systematic Literature Review. Information 2020, 11, 590. [Google Scholar] [CrossRef]
  52. Alber, N.; Dabour, M. The Dynamic Relationship between FinTech and Social Distancing under COVID-19 Pandemic: Digital Payments Evidence. IJEF 2020, 12, 109. [Google Scholar] [CrossRef]
  53. Daud, S.N.M.; Ahmad, A.H.; Khalid, A.; Azman-Saini, W.N.W. FinTech and Financial Stability: Threat or Opportunity? Financ. Res. Lett. 2022, 47, 102667. [Google Scholar] [CrossRef]
  54. Akram, U.; Fülöp, M.T.; Tiron-Tudor, A.; Topor, D.I.; Căpușneanu, S. Impact of Digitalization on Customers’ Well-Being in the Pandemic Period: Challenges and Opportunities for the Retail Industry. Int. J. Environ. Res. Public Health 2021, 18, 7533. [Google Scholar] [CrossRef]
  55. Kim, S.; Yim, M.Y.-C. Exploring Consumers’ Attitude Formation toward Their Own Brands When in Crisis: Cross-National Comparisons between USA and China. JPBM 2022, 31, 56–72. [Google Scholar] [CrossRef]
  56. Bank Customer Trust Levels Worldwide in 2021, by Country. 2021. Available online: https://www.statista.com/statistics/1097139/consumer-trust-score-of-banks-worldwide-by-country/ (accessed on 8 September 2022).
  57. Fungáčová, Z.; Hasan, I.; Weill, L. Trust in Banks. J. Econ. Behav. Organ. 2019, 157, 452–476. [Google Scholar] [CrossRef]
  58. Kowalski, M.; Lee, Z.W.Y.; Chan, T.K.H. Blockchain Technology and Trust Relationships in Trade Finance. Technol. Forecast. Soc. Chang. 2021, 166, 120641. [Google Scholar] [CrossRef]
  59. Trust in Fintech Brands vs Other Financial Services Providers in the United States in 2021, by Age Group. 2021. Available online: https://www.statista.com/statistics/1312809/trust-in-fintech-sector-united-states/ (accessed on 8 September 2022).
  60. Nangin, M.A.; Barus, I.R.G.; Wahyoedi, S. The Effects of Perceived Ease of Use, Security, and Promotion on Trust and Its Implications on Fintech Adoption. JCS 2020, 5, 124–138. [Google Scholar] [CrossRef]
  61. An Update to Our Message for the SWIFT Community. 2022. Available online: https://www.swift.com/news-events/news/message-swift-community (accessed on 8 September 2022).
  62. Mariotti, S.A. Warning from the Russian–Ukrainian War: Avoiding a Future That Rhymes with the Past. J. Ind. Bus. Econ. 2022. [Google Scholar] [CrossRef]
  63. Total Value of Investments into Fintech Companies Worldwide from 2010 to 2021. Available online: https://www.statista.com/statistics/719385/investments-into-fintech-companies-globally/ (accessed on 28 July 2022).
  64. Gomber, P.; Koch, J.-A.; Siering, M. Digital Finance and FinTech: Current Research and Future Research Directions. J. Bus. Econ. 2017, 87, 537–580. [Google Scholar] [CrossRef]
  65. Digital 2022: Global Overview Report. Available online: https://datareportal.com/reports/digital-2022-global-overview-report (accessed on 28 July 2022).
  66. Hammerschlag, Z.; Bick, G.; Luiz, J.M. The Internationalization of African Fintech Firms: Marketing Strategies for Successful Intra-Africa Expansion. IMR 2020, 37, 299–317. [Google Scholar] [CrossRef]
  67. Bilgin, Y. The Effect of Social Media Marketing Activities on Brand Awareness, Brand Image and Brand Loyalty. Bus. Manag. Stud. Int. J. 2018, 6, 128–148. [Google Scholar] [CrossRef]
  68. Yadav, M. Social Media as a Marketing Tool: Opportunities and Challenges. Indian J. Mark. 2017, 47, 16. [Google Scholar] [CrossRef]
  69. Dolega, L.; Rowe, F.; Branagan, E. Going Digital? The Impact of Social Media Marketing on Retail Website Traffic, Orders and Sales. J. Retail. Consum. Serv. 2021, 60, 102501. [Google Scholar] [CrossRef]
  70. Sashi, C.M.; Brynildsen, G.; Bilgihan, A. Social Media, Customer Engagement and Advocacy: An Empirical Investigation Using Twitter Data for Quick Service Restaurants. IJCHM 2019, 31, 1247–1272. [Google Scholar] [CrossRef]
  71. Achen, R.M. Measuring Social Media Marketing: Moving towards a Relationship-Marketing Approach. Manag. Sport Leis. 2017, 22, 33–53. [Google Scholar] [CrossRef]
  72. Ul Islam, J.; Rahman, Z. The Impact of Online Brand Community Characteristics on Customer Engagement: An Application of Stimulus-Organism-Response Paradigm. Telemat. Inform. 2017, 34, 96–109. [Google Scholar] [CrossRef]
  73. Di Gangi, P.M.; Wasko, M.M. Social Media Engagement Theory: Exploring the Influence of User Engagement on Social Media Usage. J. Organ. End User Comput. 2016, 28, 53–73. [Google Scholar] [CrossRef] [Green Version]
  74. Seo, E.J.; Park, J.-W.; Choi, Y.J. The Effect of Social Media Usage Characteristics on E-WOM, Trust, and Brand Equity: Focusing on Users of Airline Social Media. Sustainability 2020, 12, 1691. [Google Scholar] [CrossRef] [Green Version]
  75. Füller, J.; Matzler, K.; Hoppe, M. Brand Community Members as a Source of Innovation: Brand Community Members as a Source of Innovation. J. Prod. Innov. Manag. 2008, 25, 608–619. [Google Scholar] [CrossRef]
  76. Daily Time Spent on Social Networking by Internet Users Worldwide from 2012 to 2022. Available online: https://www.statista.com/statistics/433871/daily-social-media-usage-worldwide/ (accessed on 28 July 2022).
  77. Lee, I. Social Media Analytics for Enterprises: Typology, Methods, and Processes. Bus. Horiz. 2018, 61, 199–210. [Google Scholar] [CrossRef]
  78. Sakas, D.P.; Kamperos, I.D.G.; Reklitis, D.P.; Giannakopoulos, N.T.; Nasiopoulos, D.K.; Terzi, M.C.; Kanellos, N. The Effectiveness of Centralized Payment Network Advertisements on Digital Branding during the COVID-19 Crisis. Sustainability 2022, 14, 3616. [Google Scholar] [CrossRef]
  79. RISE Social Media Analytics. Available online: https://cordis.europa.eu/project/id/823866 (accessed on 28 July 2022).
  80. Batrinca, B.; Treleaven, P.C. Social Media Analytics: A Survey of Techniques, Tools and Platforms. AI Soc. 2015, 30, 89–116. [Google Scholar] [CrossRef] [Green Version]
  81. Wang, Z.; Ye, X. Social Media Analytics for Natural Disaster Management. Int. J. Geogr. Inf. Sci. 2018, 32, 49–72. [Google Scholar] [CrossRef]
  82. Rathore, A.K.; Kar, A.K.; Ilavarasan, P.V. Social Media Analytics: Literature Review and Directions for Future Research. Decis. Anal. 2017, 14, 229–249. [Google Scholar] [CrossRef]
  83. The Adoption of Social Media Analytics for Crisis Management—Challenges and Opportunities. Available online: https://www.researchgate.net/publication/325416290_The_Adoption_of_Social_Media_Analytics_for_Crisis_Management_-_Challenges_and_Opportunities (accessed on 28 July 2022).
  84. Park, D.; Kim, W.G.; Choi, S. Application of Social Media Analytics in Tourism Crisis Communication. Curr. Issues Tour. 2019, 22, 1810–1824. [Google Scholar] [CrossRef]
  85. Chon, M.-G.; Kim, S. Dealing with the COVID-19 Crisis: Theoretical Application of Social Media Analytics in Government Crisis Management. Public Relat. Rev. 2022, 48, 102201. [Google Scholar] [CrossRef]
  86. Franco-Riquelme, J.N.; Rubalcaba, L. Innovation and SDGs through Social Media Analysis: Messages from FinTech Firms. JOItmC 2021, 7, 165. [Google Scholar] [CrossRef]
  87. Fischhoff, B.; Slovic, P.; Lichtenstein, S.; Read, S.; Combs, B. How Safe Is Safe Enough? A Psychometric Study of Attitudes Toward Technological Risks and Benefits. Policy Sci. 1978, 9, 127–152. [Google Scholar] [CrossRef]
  88. Sakas, D.P.; Kamperos, I.D.G.; Reklitis, P. Estimating Risk Perception Effects on Courier Companies’ Online Customer Behavior during a Crisis, Using Crowdsourced Data. Sustainability 2021, 13, 12725. [Google Scholar] [CrossRef]
  89. Kurko, M. Best Payment Gateways. Increase Your Sales by Accepting Credit Card Purchases. 2022. Available online: https://www.thebalancesmb.com/best-payment-gateways-5079334 (accessed on 10 July 2022).
  90. Authorizenet. 2022. Available online: https://www.authorize.net/ (accessed on 10 July 2022).
  91. Braintree. 2022. Available online: https://www.braintreepayments.com/ (accessed on 10 July 2022).
  92. Paypal. 2022. Available online: https://www.paypal.com/ (accessed on 10 July 2022).
  93. Square. 2022. Available online: https://squareup.com/ (accessed on 10 July 2022).
  94. Stripe. 2022. Available online: https://stripe.com/ (accessed on 10 July 2022).
  95. Semrush. 2022. Available online: https://www.semrush.com/projects (accessed on 10 July 2022).
  96. Fanpage Karma. 2022. Available online: https://www.fanpagekarma.com/ (accessed on 10 July 2022).
  97. Khoumbati, K.; Themistocleous, M. Application of fuzzy simulation for the evaluation of enterprise application integration in healthcare organisations. Transform. Gov. People Process Policy 2007, 1, 230–241. [Google Scholar] [CrossRef] [Green Version]
  98. Case, D.M.; Blackburn, T.; Stylios, C. Modelling Construction Management Problems with Fuzzy Cognitive Maps. In Fuzzy Hybrid Computing in Construction Engineering and Management; Fayek, A.R., Ed.; Emerald Publishing Limited: Bingley, UK, 2018; pp. 413–449. [Google Scholar] [CrossRef]
  99. Bao, Z.; Shang, B. Self-efficacy and continuance intention of Web 2.0 platforms: A meta-analysis. Data Technol. Appl. 2021, 55, 511–526. [Google Scholar] [CrossRef]
  100. Voorveld, H.A.M.; Neijens, P.C.; Smit, E.G. Consumers’ responses to brand websites: An interdisciplinary review. Internet Res. 2009, 19, 535–565. [Google Scholar] [CrossRef]
  101. Retzlaff, C.O.; Ziefle, M.; Calero-Valdez, A. The history of agent-based modeling in the social sciences. In Digital Human Modeling and Applications in Health, Safety, Ergonomics and Risk Management: Human Body, Motion and Behavior; Duffy, V.G., Ed.; HCII 2021. Lecture notes in computer science; Springer: Cham, Switzerland, 2021; p. 12777. [Google Scholar] [CrossRef]
  102. Sakas, D.P.; Giannakopoulos, N.T.; Kanellos, N.; Migkos, S.P. Innovative Cryptocurrency Trade Websites’ Marketing Strategy Refinement, via Digital Behavior. IEEE Access 2022, 10, 63163–63176. [Google Scholar] [CrossRef]
  103. Wang, Y.; Deng, Q.; Rod, M.; Ji, S. A thematic exploration of social media analytics in marketing research and an agenda for future inquiry. J. Strateg. Mark. 2021, 29, 471–491. [Google Scholar] [CrossRef]
  104. Garg, P.; Guptra, B.; Dzever, S.; Sivarajah, U.; Kumar, V. Examining the Relationship between Social Media Analytics Practices and Business Performance in the Indian Retail and IT Industries: The Mediation Role of Customer Engagement. Int. J. Inf. Manag. 2020, 52, 102069. [Google Scholar] [CrossRef]
  105. Madila, S.S.; Dida, M.A.; Kaijage, S. A Review of Usage and Applications of Social Media Analytics. J. Inf. Syst. Eng. Manag. 2021, 6, em0141. [Google Scholar] [CrossRef]
  106. Jayaram, D.; Manrai, A.K.; Manrai, L.A. Effective use of marketing technology in Eastern Europe: Web analytics, social media, customer analytics, digital campaigns and mobile applications. J. Econ. Financ. Adm. Sci. 2015, 20, 118–132. [Google Scholar] [CrossRef] [Green Version]
  107. Enenkel, M.; Saenz, S.M.; Dookie, D.S.; Braman, L.; Obradovich, N.; Kryvasheyeu, Y. Social Media Data Analysis and Feedback for Advanced Disaster Risk Management. arXiv 2018, arXiv:1802.02631. [Google Scholar] [CrossRef]
  108. Sakas, D.P.; Reklitis, D.P.; Trivellas, P.; Vassilakis, C.; Terzi, M.C. The Effects of Logistics Websites’ Technical Factors on the Optimization of Digital Marketing Strategies and Corporate Brand Name. Processes 2022, 10, 892. [Google Scholar] [CrossRef]
Figure 1. Correlations between variables with FCM.
Processes 10 01995 g001
Figure 2. Economic and Social Impacts and Policy Implications of the War in Ukraine OECD Economic Outlook, Interim Report March 2022 (oecd-ilibrary.org; accessed on 23 July 2022).
Processes 10 01995 g002
Figure 3. The results of the concept map (FCM) present correlations between variables. This figure presents three phases of the model depending on war crisis cases. (a) presents lower cases, (be) present medium cases, and (f) presents higher cases of the war crisis.
Processes 10 01995 g003aProcesses 10 01995 g003bProcesses 10 01995 g003c
Figure 4. Agent-based model development.
Processes 10 01995 g004
Figure 5. Population dispersion for 10,000 agents. (a) With little or no use of social media analytics and (b) with increasing usage of social media analytics.
Processes 10 01995 g005aProcesses 10 01995 g005b
Figure 6. Depiction of CPNs’ digital marketing metrics.
Processes 10 01995 g006
Table 1. Correlation Analysis Matrix.
Organic TrafficOrganic KeywordsOrganic Traffic CostsSocial TrafficBounce RateSocial EngagementNumber of FansFollower GrowthNumber of CommentsNumber of LikesNumber of PostsPost InteractionPosts per DayTotal Reactions
Organic Traffic10.319−0.538 **−0.562−0.5690.506−0.556 *0.182−0.1210.656 *0.0710.3150.0560.650 *
Organic Keywords0.3191−0.2200.167−0.2620.335−0.533−0.4540.4920.3410.0240.579 *0.0290.337
Organic Traffic Costs−0.538 **−0.2201−0.4340.607−0.4320.020−0.564 *0.297−0.256−0.066−0.482−0.059−0.268
Social Traffic−0.5620.167−0.4341−0.2330.6730.1800.1180.322−0.344−0.0260.761 *−0.024−0.204
Bounce Rate−0.569−0.2620.607−0.23310.142−0.042−0.0790.5820.7330.624−0.2090.6260.570
Social Engagement0.5060.335−0.4320.6730.1421−0.4200.1510.5120.836 **0.1360.838 **0.1410.824 **
Number of Fans−0.556 *−0.5330.0200.180−0.042−0.42010.228−0.200−0.724 **0.230−0.2400.232−0.738 **
Follower Growth0.182−0.454−0.564 *0.118−0.0790.1510.2281−0.193−0.0210.0690.0930.069−0.039
Number of Comments−0.1210.4920.2970.3220.5820.512−0.200−0.19310.2840.0260.595 *0.0350.268
Number of Likes0.656 *0.341−0.256−0.3440.7330.836 **−0.724 **−0.0210.28410.1440.5040.1450.997 **
Number of Posts0.0710.024−0.066−0.0260.6240.1360.2300.0690.0260.14410.1301.000 **0.111
Post Interaction0.3150.579 *−0.4820.761 *−0.2090.838 **−0.2400.0930.595 *0.5040.13010.1360.487
Posts per Day0.0560.029−0.059−0.0240.6260.1410.2320.0690.0350.1451.000 **0.13610.112
Total Reactions0.650 *0.337−0.268−0.2040.5700.824 **−0.738 **−0.0390.2680.997 **0.1110.4870.1121
* and ** indicate statistical significance at the 95% and 99% level respectively.
Table 2. Descriptive statistics of 5 CPN firms’ websites during a six-month period.
MeanMinMaxStd. Deviation
Organic Traffic12,396,829.110,597,332.613,557,164.8846,987.5
Organic Keywords616,364.616551,015.8689,284.232,227.48
Organic Traffic Costs22,115,440.8014,987,699.431,237,574.84,411,200.442
Social Traffic651,846.114465,269.21,188,802255,904.58
Bounce Rate0.5331640.49060.55090.02007
Social Engagement0.00040.0000940.0010830.00032
Number of Fans655,557.22612,388.0866,924.9124,069.3
Follower Growth225.35930.21461.13132.14295
Number of Comments12.1414.4217.254.00367
Number of Likes239.057764.75662.83202.65334
Number of Posts11.96158.3315.831.92318
Post Interaction0.00090.0001510.0032410.00095
Posts per Day1.86011.302.450.2988
Total Reactions283.775681.75805.25235.97
n = 180 observation days for 10 CPN websites.
Table 3. CPNs websites’ organic traffic Levene’s t-test before and after the crisis.
VariablestSig.Fp-Value
Equal variances assumed−0.5250.6052.1400.157
Equal variances not assumed−0.8580.402
Table 4. Impact of social media analytics on CPNs websites’ organic traffic.
VariablesStandardized CoefficientR2Fp-Value
Constant-0.9143.5480.163
Social Engagement−0.2070.884
Number of Fans−0.1350.814
Follower Growth0.0890.716
Number of Comments−0.03260.304
Number of Likes4.6060.239
Number of Posts21.4000.052
Post Interaction0.4070.568
Posts per Day−21.5530.052
Total Reactions−3.9500.274
Table 5. Impact of social media analytics on CPNs websites’ organic keywords.
VariablesStandardized CoefficientR2Fp-Value
Constant-0.9033.0960.191
Social Engagement−2.4830.171
Number of Fans0.0140.981
Follower Growth−0.1740.515
Number of Comments0.2250.481
Number of Likes1.7420.638
Number of Posts−2.1990.781
Post Interaction1.8020.076
Posts per Day2.1100.791
Total Reactions−0.2780.935
Table 6. Impact of social media analytics on CPNs websites’ organic traffic costs.
VariablesStandardized CoefficientR2Fp-Value
Constant-0.999246.5230.000 **
Social Engagement0.4330.077
Number of Fans−0.2080.051
Follower Growth−0.4540.001 **
Number of Comments0.5910.000 **
Number of Likes4.4890.001 **
Number of Posts−7.5290.003 **
Post Interaction−1.1370.001 **
Posts per Day7.5130.003 **
Total Reactions−4.8810.001 **
** indicates statistical significance at the 99% level.
Table 7. Impact of social media analytics on CPNs websites’ social traffic.
VariablesStandardized CoefficientR2Fp-Value
Constant-1.000-0.000 **
Social Engagement1.1440.000 **
Number of Fans0.1650.000 **
Follower Growth0.2250.000 **
Number of Comments0.4450.000 **
Number of Posts−0.9880.000 **
Total Reactions−0.0230.000 **
** indicates statistical significance at the 99% level.
Table 8. Impact of social media analytics on CPNs websites’ bounce rate.
VariablesStandardized CoefficientR2Fp-Value
Constant-1.000-0.000 **
Social Engagement0.0020.000 **
Number of Fans−0.6430.000 **
Follower Growth0.4720.000 **
Number of Comments0.0070.000 **
Number of Posts0.9340.000 **
Total Reactions0.7430.000 **
** indicates statistical significance at the 99% level.
Publisher’s Note: MDPI stays neutral with regard to jurisdictional claims in published maps and institutional affiliations.

