Article

Potential Predictors for Cognitive Decline in Vascular Dementia: A Machine Learning Analysis

1
Department of Internal Medicine, University of Genoa, 16132 Genoa, Italy
2
IRCCS OspedalePoliclinico San Martino, 16132 Genoa, Italy
3
School and Operative Unit of Allergy and Clinical Immunology, Department of Clinical and Experimental Medicine, University of Messina, 98125 Messina, Italy
4
Clinical Physiology Institute, National Research Council of Italy (IFC-CNR), 56124 Pisa, Italy
5
Institute for Biomedical Research and Innovation (IRIB), National Research Council of Italy (CNR), 98164 Messina, Italy
*
Author to whom correspondence should be addressed.
Processes 2022, 10(10), 2088; https://doi.org/10.3390/pr10102088
Submission received: 13 July 2022 / Revised: 16 September 2022 / Accepted: 11 October 2022 / Published: 15 October 2022

Abstract

:
Vascular dementia (VD) is a cognitive impairment typical of advanced age with vascular etiology. It results from several vascular micro-accidents involving brain vessels carrying less oxygen and nutrients than it needs. This being a degenerative disease, the diagnosis often arrives too late, when the brain tissue is already damaged. Thus, prevention is the best solution to avoid irreversible cognitive impairment in patients with specific risk factors. Using the machine learning (ML) approach, our group evaluated Mini-Mental State Examination (MMSE) changes in patients affected by Alzheimer’s disease by considering different clinical parameters. We decided to apply a similar ML scheme to VD due to the consistent data obtained from the first work, including the assessment of various ML models (LASSO, RIDGE, Elastic Net, CART, Random Forest) for the outcome prediction (i.e., the MMSE modification throughout time). MMSE at recruitment, folate, MCV, PTH, creatinine, vitamin B12, TSH, and hemoglobinwere the best predictive parameters individuated by the best ML model: Random Forest. ML results can be useful inidentify predictive biomarkers for cognitive worsening in VD early and also for focusing on necessary examinations at the first visits to draw the most predictive features, saving time and money and reducethe burden on the patients themselves. Such results should be integrated with brain imaging, physiological signal measurements, and sensory patterns, particularly forthose senses already demonstrated to have a significant link with neurodegeneration. Adjusting compound deficit by administering nutraceuticals could support treatment effectiveness and lead to a better quality of life for patients, families, and caregivers, with a consistent impact on the national health systems load.

1. Introduction

Vascular dementia (VD) is a cognitive impairment typical in advanced age featuring a vascular etiology [1]. It is the second most common age-related mental impairment [2], with a prevalence that doubles every 5.3 years in the advanced ages, now affecting 4.2% of the population aged over 85 and is predicted to grow two-fold in the next 20 years, likely to contribute to a heavy social and economic burden [3]. VD mainly affects males [4] and results from several vascular micro-accidents involving brain vessels that carry less oxygen and nutrients than needed. Hypertensive disease and multiple small infarcts have an essential role in the disease. The load of cognitive deterioration is worsened by motor impairment and significant apathy. However, the clinical presentation may differ from one patient to another, mainly due to the cerebral area involved in the vascular damage. Overall, VD can be classified into four main subtypes: post-stroke dementia (defined as dementia manifesting within six months after a stroke), subcortical ischemic vascular dementia, multi-infarct dementia, and mixed dementia [5,6]. The exact frequencies of the different subtypes are still unclear; usually, the proposed subtypes are not pure but rather mixtures of pathology that contribute to the complete clinical picture [4]. Clinically, the onset can be gradual or sudden, and the clinical severity varies, ranging from mild cognitive impairment to severe dysfunction [7]. Patients with VD may suffer from slowed thinking, forgetfulness, depression and anxiety, disorientation, and loss of executive functions such as problem solving, working memory, thinking, reasoning, judgment, planning and execution of tasks [5]. This being a degenerative disease, the diagnosis often arrives too late, when the brain tissue is already damaged, making its treatment costly and rarely effective. As such, the treatment of VD consists of a diverse range of drugs such as aspirin, anti-hypertensives, cholinesterase inhibitors, and vasodilators [8]. A broad range of nutraceuticals are used. However, most of the time, the patients do not have a benefit in their cognitive functions [9,10]. Moreover, their outcome is not alleviated. For this reason, prevention is the best solution to avoid cognitive impairment in patients with specific risk factors. Cardiovascular risk factors and lifestyle have been pointed out as predictors of dementia in general [11]. Among these, obesity, untreated hypertension, lack of exercise, diabetes, and dyslipidemia are only some of the parameters likely to promote the disease onset. Of course, treating most of the aforementioned characteristics could diminish VD incidence; however, this is not enough. In recent times, new ICT technologies and methods have been employed in the field of clinical research, supporting clinicians in understanding disease progression, treatment outcomes, and possible questions related to the clinical condition (e.g., limitedly to neurodegenerative conditions, see [12,13,14]). Among them, Artificial Intelligence (AI) appears to be among the most promising approaches in this respect, with a plethora of interesting articles published to date in different clinical domains, including in the field of neurodegenerative disorders. Therefore, we decided to adopt AI, in particular machine learning (ML), in VD patients, to evaluate a series of parameters to understand which analyses could be more beneficial to be carried out to predict the cognitive deterioration associated with VD. In this regard, the present paper differs from the current literature in the field of AI applied to VD [15,16,17] since it does not propose a method for differential diagnosis versus other types of dementia. Instead, it attempts to predict the clinical outcome within a cohort whose diagnosis of VD is already present and eventually selecting which of the biomarkers possibly collected within a clinical setting could be more beneficial to predict the outcome. Using the ML approach, our group already evaluated Mini-Mental State Examination (MMSE) changes in patients affected by Alzheimer’s disease by considering different parameters. We decided to apply a similar AI scheme to VD due to the consistent data obtained from the first work [18], thus using the MMSE variation from the first visit to a second assessment, later described in more detail (see Section 2), as the outcome to be predicted by personal data and clinical variables through performing a regression task.

2. Materials and Methods

Fifty-four individuals with VD (40 females, 14 males), aged 82.7 ± 4.7 years (age range 68–92 years) were enrolled in the study from 2013 to 2021 at the San Martino Polyclinic Hospital. All the participants were duly informed about the study aims and agreed to sign an informed consent before study participation. The patients were followed up at the outpatient clinic of the Geriatric Clinic of the San Martino Polyclinic in Genoa. The presence of VD was confirmed through neuroimaging. The inclusion criteria for the study were: the presence of vascular encephalopathy confirmed through CT scan or MRI, and at least two visits to the Geriatric Clinic of the San Martino Polyclinic in Genoa at 6 months of distance one from the other before the enrollment. The exclusion criterion for the study was age under 65 years old. To test the neuro-cognitive functions of the patients evaluated, we used the MMSE, a 30-question assessment of cognitive functioning that evaluates attention, orientation, memory, registration, recall, calculation, language, and ability to draw a complex polygon. The exam is made of 11 items divided into 5 sections, with a total score ranging from 0 to 30. The threshold score for “normality” is set at 24/30; the limitations of the test are age and education. In order to solve this problem, correction factors have been developed. Our paper took into account the MMSE calculated at the first visit (MMSE1) and at the last visit (MMSE2) performed up to the year 2021 (Figure 1), 2.7 years apart on average, and in particular their differences. A machine learning (ML) approach was employed to assess which of the parameters (age, gender, first-visit MMSE, hemoglobin, Mean Corpuscular Volume, platelets, creatinine, TSH, parathyroid hormone (PTH), vitamin B12, vitamin D, folic acid, cholesterol, and glycated hemoglobin) drawn from the patients were most predictive of their cognitive involvement concerned with VD.

2.1. Machine Learning

ML was employed in this study to predict the modification of the MMSE score at the follow-up with respect to the first assessment for each patient. In addition, the most significant predictors were assessed among the candidates and were included in the dataset (Figure 2) in terms of their predictivity within the various ML models implemented and trained to understand which analyses could be more beneficial to perform to predict the cognitive deterioration associated with VD accurately. The training portion of the dataset was normalized, and such normalization was then applied to the test set. There was no need for outlier clearance or imputation; therefore, after normalization, collinearities were searched for and eventually solved through the elimination of one (or more variables) when the Variance Inflation Factor (VIF) score exceeded 5 [19,20]. Even in this case, none of the variables included in the dataset was seen to be collinear; therefore, all the variables were retained for further use.
At this point, the various models were implemented and trained, as specified below.
The task demanded to the ML models concerned the prediction of the MMSE modification at follow-up with respect to the baseline with the least possible error, representing a regression problem, whose aim was to minimize the objective target to be calculated. For the specific aim, the target indicator to evaluate the performances of the different models was represented by the Root Mean Square Error (RMSE), defined as:
R M S E = i = 1 N y ( i ) y ^ ( i ) 2 N
where N is the number of the data points, y ( i ) represents the i-th measurement, and y ^ ( i ) is its corresponding prediction
The RMSE displayed represents the cross-validated RMSE upon 10 repetitions and 10 folds, a typical value for cross-validation, intended to reduce the occurrence of overfitting, therefore likely to increase the model’s generalizability. The ML analysis was conducted under the open-source R language, using the RStudio IDE, version 1.4.1717 for Windows, available with the GNU Affero General Public License. Five basic, supervised ML models were implemented using caret, one of the most common and useful R-based packages for ML modeling and setup [21]. The choice for supervised models was performed, since in this study, both inputs (x) and output (Y) are known, and the algorithm should learn to best approximate the mapping function relating inputs and output.
Such models, better explained later, include LASSO, RIDGE, Elastic Net, Classification and Regression Tree, and Random Forest, all of them performing a regression task, as explained above.
Implementing and training all of them using one single package (caret) allows for a fair comparison between their performances, enabling an unbiased best model selection for the study purposes.

2.1.1. LASSO

The Least Absolute Shrinkage and Selection Operator (LASSO) regression is a particular type of linear regression, characterized by its peculiar use of shrinkage [22]. Shrinkage means data values condensed towards a central point, including the mean. This kind of procedure is handy in the presence of highly multicollinear data (i.e., when several independent variables in a model or dataset are correlated) or in case the operator wants to perform sorting of variable selection or parameter elimination automatically or semi-automatically. In the present approach, LASSO was trained with the entire dataset and performed variable selection upon the specified task demanded, making use of selected variables for regression purposes.

2.1.2. RIDGE

The RIDGE regression is another technique particularly useful in the presence of multicollinear data, making use of all the features in a dataset [23]. When multicollinearity exists, least squares estimates are usually poorly biased. However, their variance is exceptionally high, making them often far from their true value. As occurs with the RIDGE regression, including a bias in the regression estimates makes the standard error lower. It possibly leads to a net effect leading estimates to be closer to the real value, and therefore more reliable.

2.1.3. Elastic Net

The Elastic Net regularization attempts at merging together the positive sides of both the LASSO and RIDGE approaches, by mixing the two models, through a continuous tuning of its main hyperparameter, namely the alpha (α), ranging from 0 to 1. An alpha value of 0 leads the Elastic Net to the characteristics of the RIDGE, whereas when alpha becomes 1, the Elastic Net equals the LASSO. Typically, the alpha value is set around 0.5, which leads to a 50/50 blend between the two regression models referenced above [24].

2.1.4. CART

Differently from the models above presented, the Classification and Regression Tree (CART), as the name suggests, can be applied to both regression and classification problems [25]. The CART is a predictive model that can explain how an outcome variable can be predicted based on the values from a set of input variables. The CART produces a decision tree, where each branch represents a split in a predictor variable and each end-node holds a prediction for the outcome variable of interest.

2.1.5. Random Forest

The concept of the Random Forest can be deemed somehow similar to the CART, i.e., it can be used for both regression and classification tasks, and it relies on decision trees. However, differently from the CART, which uses a single tree, the Random Forest relies on many decision trees operating as an ensemble. Each of the trees produces an output (i.e., a class prediction). The class with the highest number of outputs is awarded as the “winner” output, therefore becoming the model’s final prediction. Although often difficult to interpret, the Random Forest is an efficient and common approach within the ML universe, carrying several advantages, among which is the quite infrequent tendency for overfitting, making it one of the favorite approaches when the generalization is particularly desired [26].

2.2. Machine Learning Approach—Data Augmentation

The literature is full of practical examples where ML is beneficial and well operating in conditions where amounts of data are significant. However, particularly clinical research often lacks such broad datasets, thus making the implementation and application of ML models somewhat troublesome. To overcome such methodological issues, countermeasures have been studied and practically applied to merge the advantages AI brings with optimal use of the available data. Among those methodologies, data augmentation was particularly useful in various domains of application of the ML techniques, as the literature reports [27], with the possibility to artificially increase the size of the training set of an algorithm through various approaches, among which the inclusion of a given amount (typically 5%) of Gaussian noise was seen to provide the best results so far [28]. In this way, the training set could work on a more considerable amount of data to set up the model, in turn being validated on the original test set later on. Our study performed the analysis following different approaches: using the original dataset with an 80–20% split between training and test set, which represents one of the most classical approaches to ML. The original dataset was also used for a 70–30% split to eventually test for an increase of the test set without altering the dataset with the Gaussian noise. However, other attempts were made in terms of data augmentation (100% and 200% training data augmentation with Gaussian noise at 5% with either 80–20% and with 70–30% training/test data split) to evaluate whether this approach could have been useful for this specific purpose.

3. Results

Among the different approaches adopted, with the various data augmentation options and the original dataset, the original dataset with a 70–30% train-test split was seen as the optimally performing option for the regression task demanded (see Table 1).
As such, the overall comparison between the five different ML models when it comes to the RMSE computed on the regression task is displayed in Table 1. On the other hand, taking into account the approach providing the optimal solution, a visual comparison of the models’ performances, in terms of RMSE and associated standard deviations, is displayed in Figure 3.
In order to have further comparison metrics, we also took into account the Mean Absolute Error (MAE) to eventually confirm the correct choice towards the “best model”, overall, considering the approach where the best result was obtained in terms of lowest RMSE (i.e., the original dataset with 70/30% training/test set split) (see Table 2).
This further attempt with the MAE confirmed the Random Forest as the best performing model in the approach selected. In fact, the Random Forest model appears to be more efficient than the others and surprisingly outperformed those relying on regularization methods, usually thought to be somewhat more competitive when datasets with high dimensionality are involved (i.e., a relatively small number of individuals and relatively large number of features), or models not fully respecting the “rule of thumb” (i.e., at least 10 observations per each feature) [29]. The result obtained by the Random Forest can be deemed as satisfying, with a RMSE of 1.979 and a MAE of 2.864, which are fairly good performances when considering the MMSE range of values (0–30) or the actual range of values reported within the MMSE Delta outcome variable (between −15 and +8).
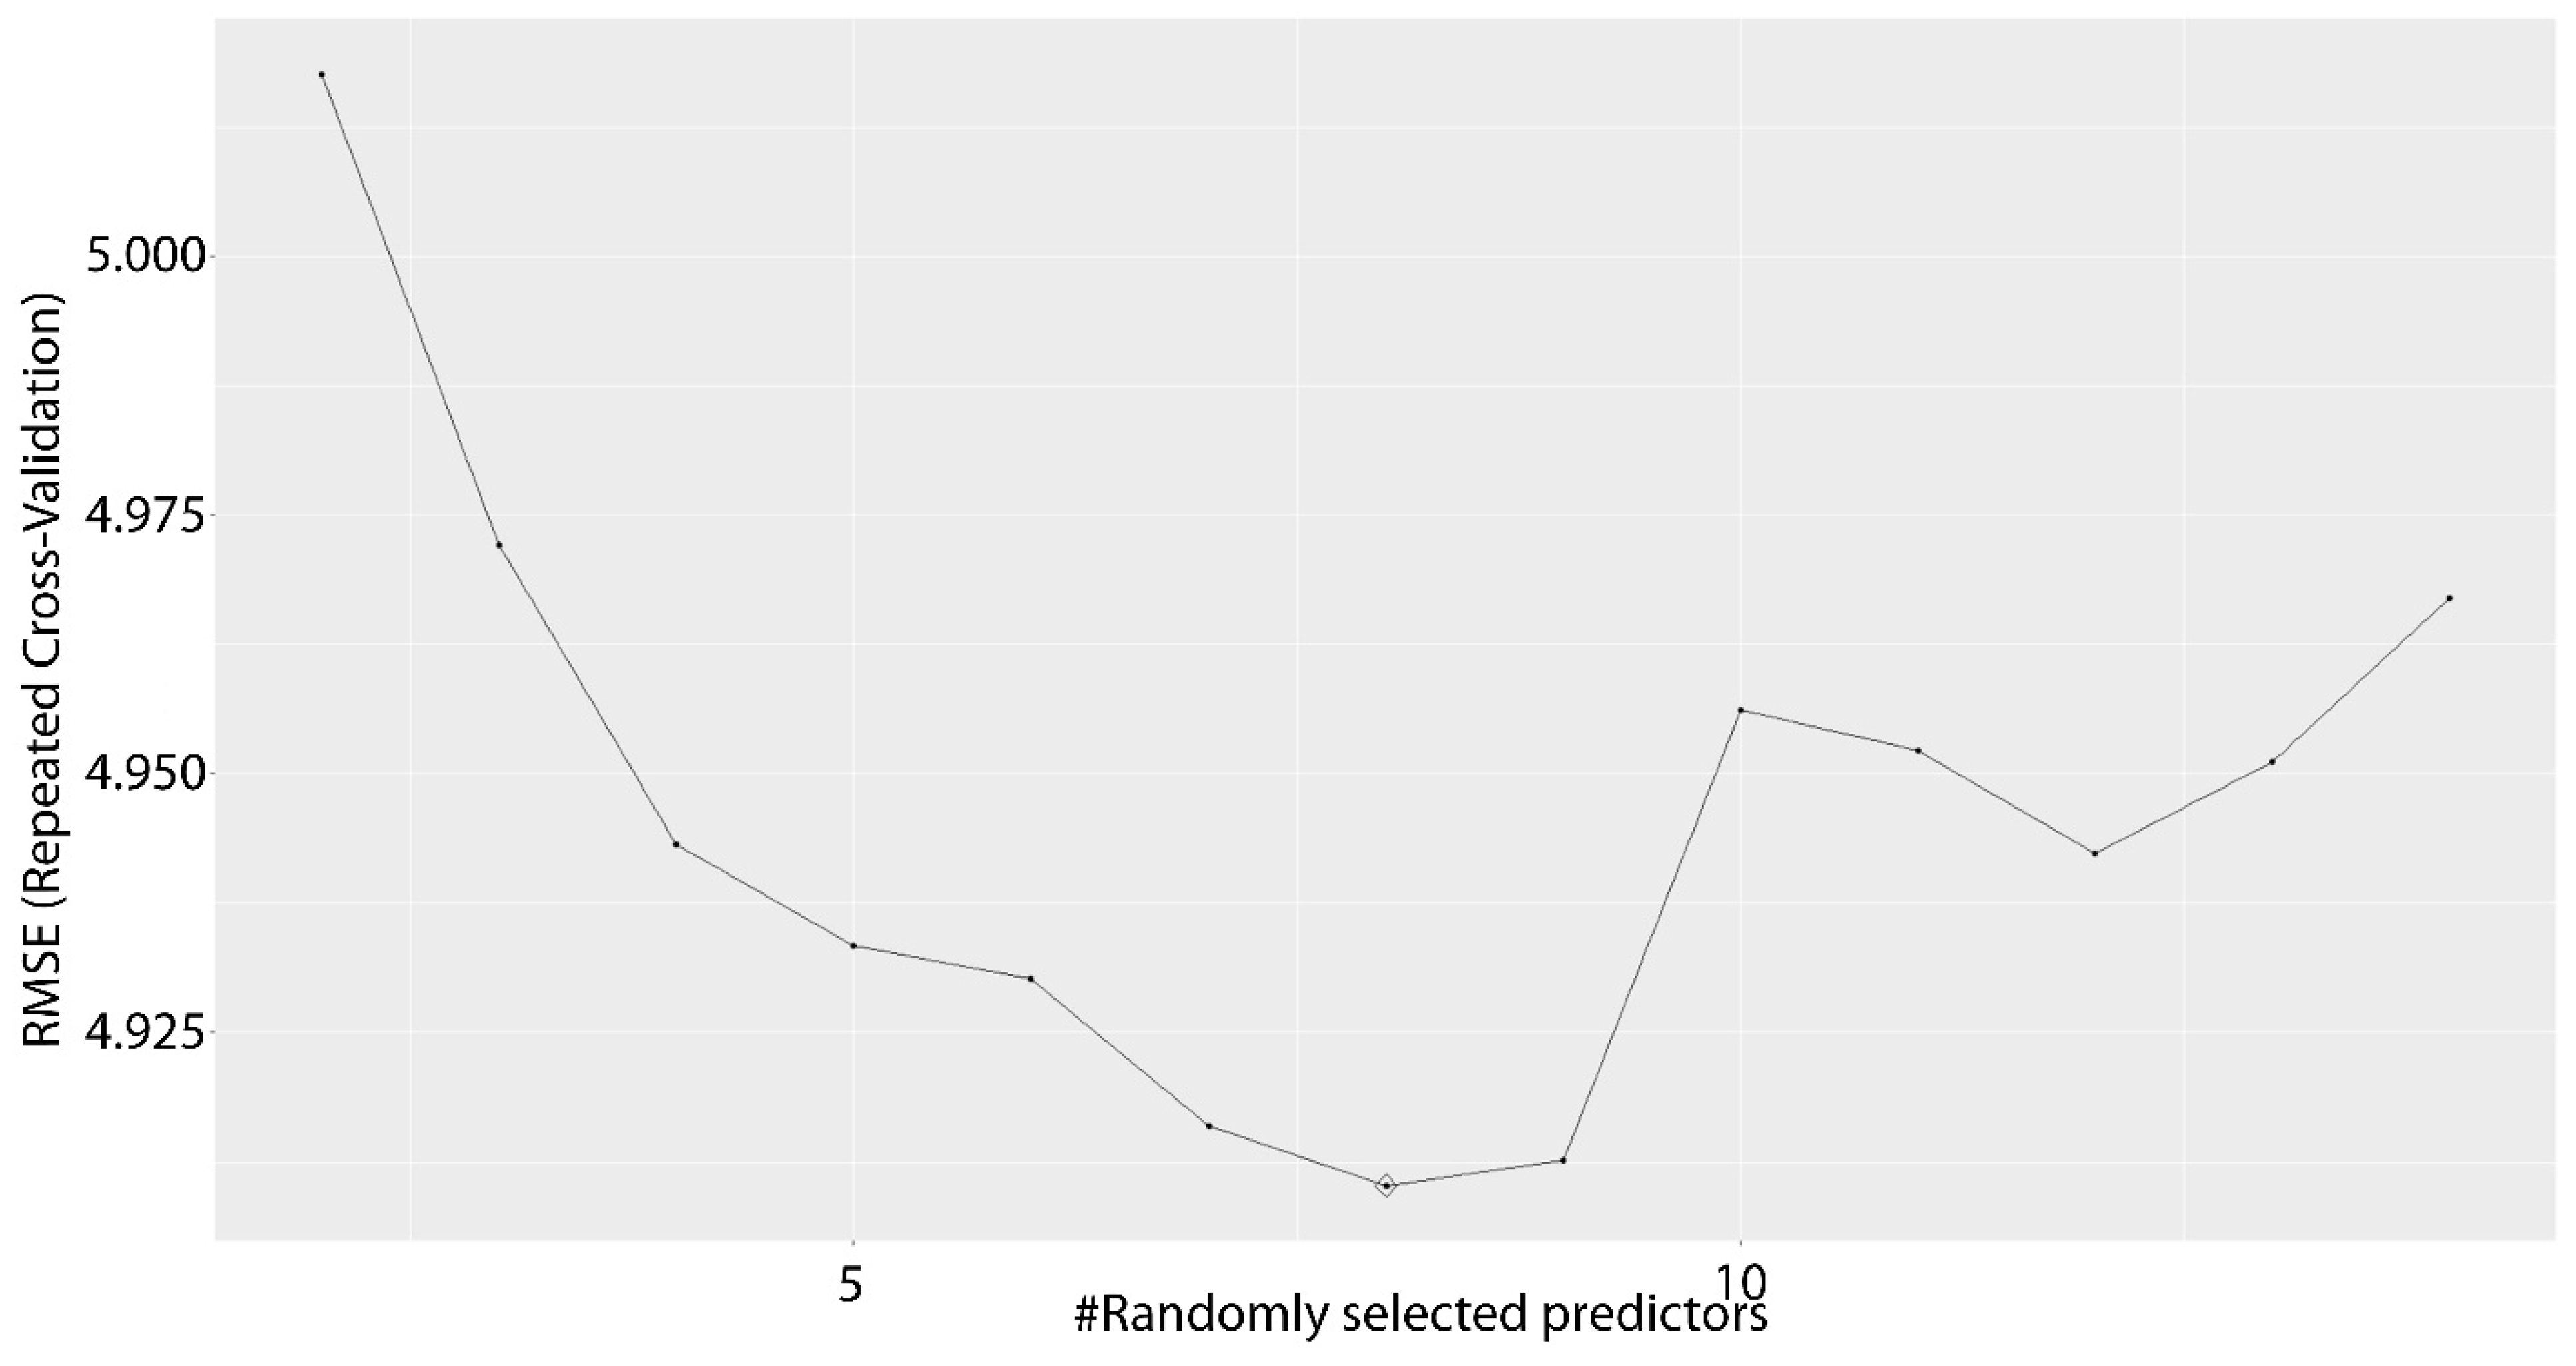
The Random Forest considered was the one proposed by the caret package, therefore using 500 trees for the “forest”, and whose performances on the training set based on the number of predictors are displayed in Figure 4.
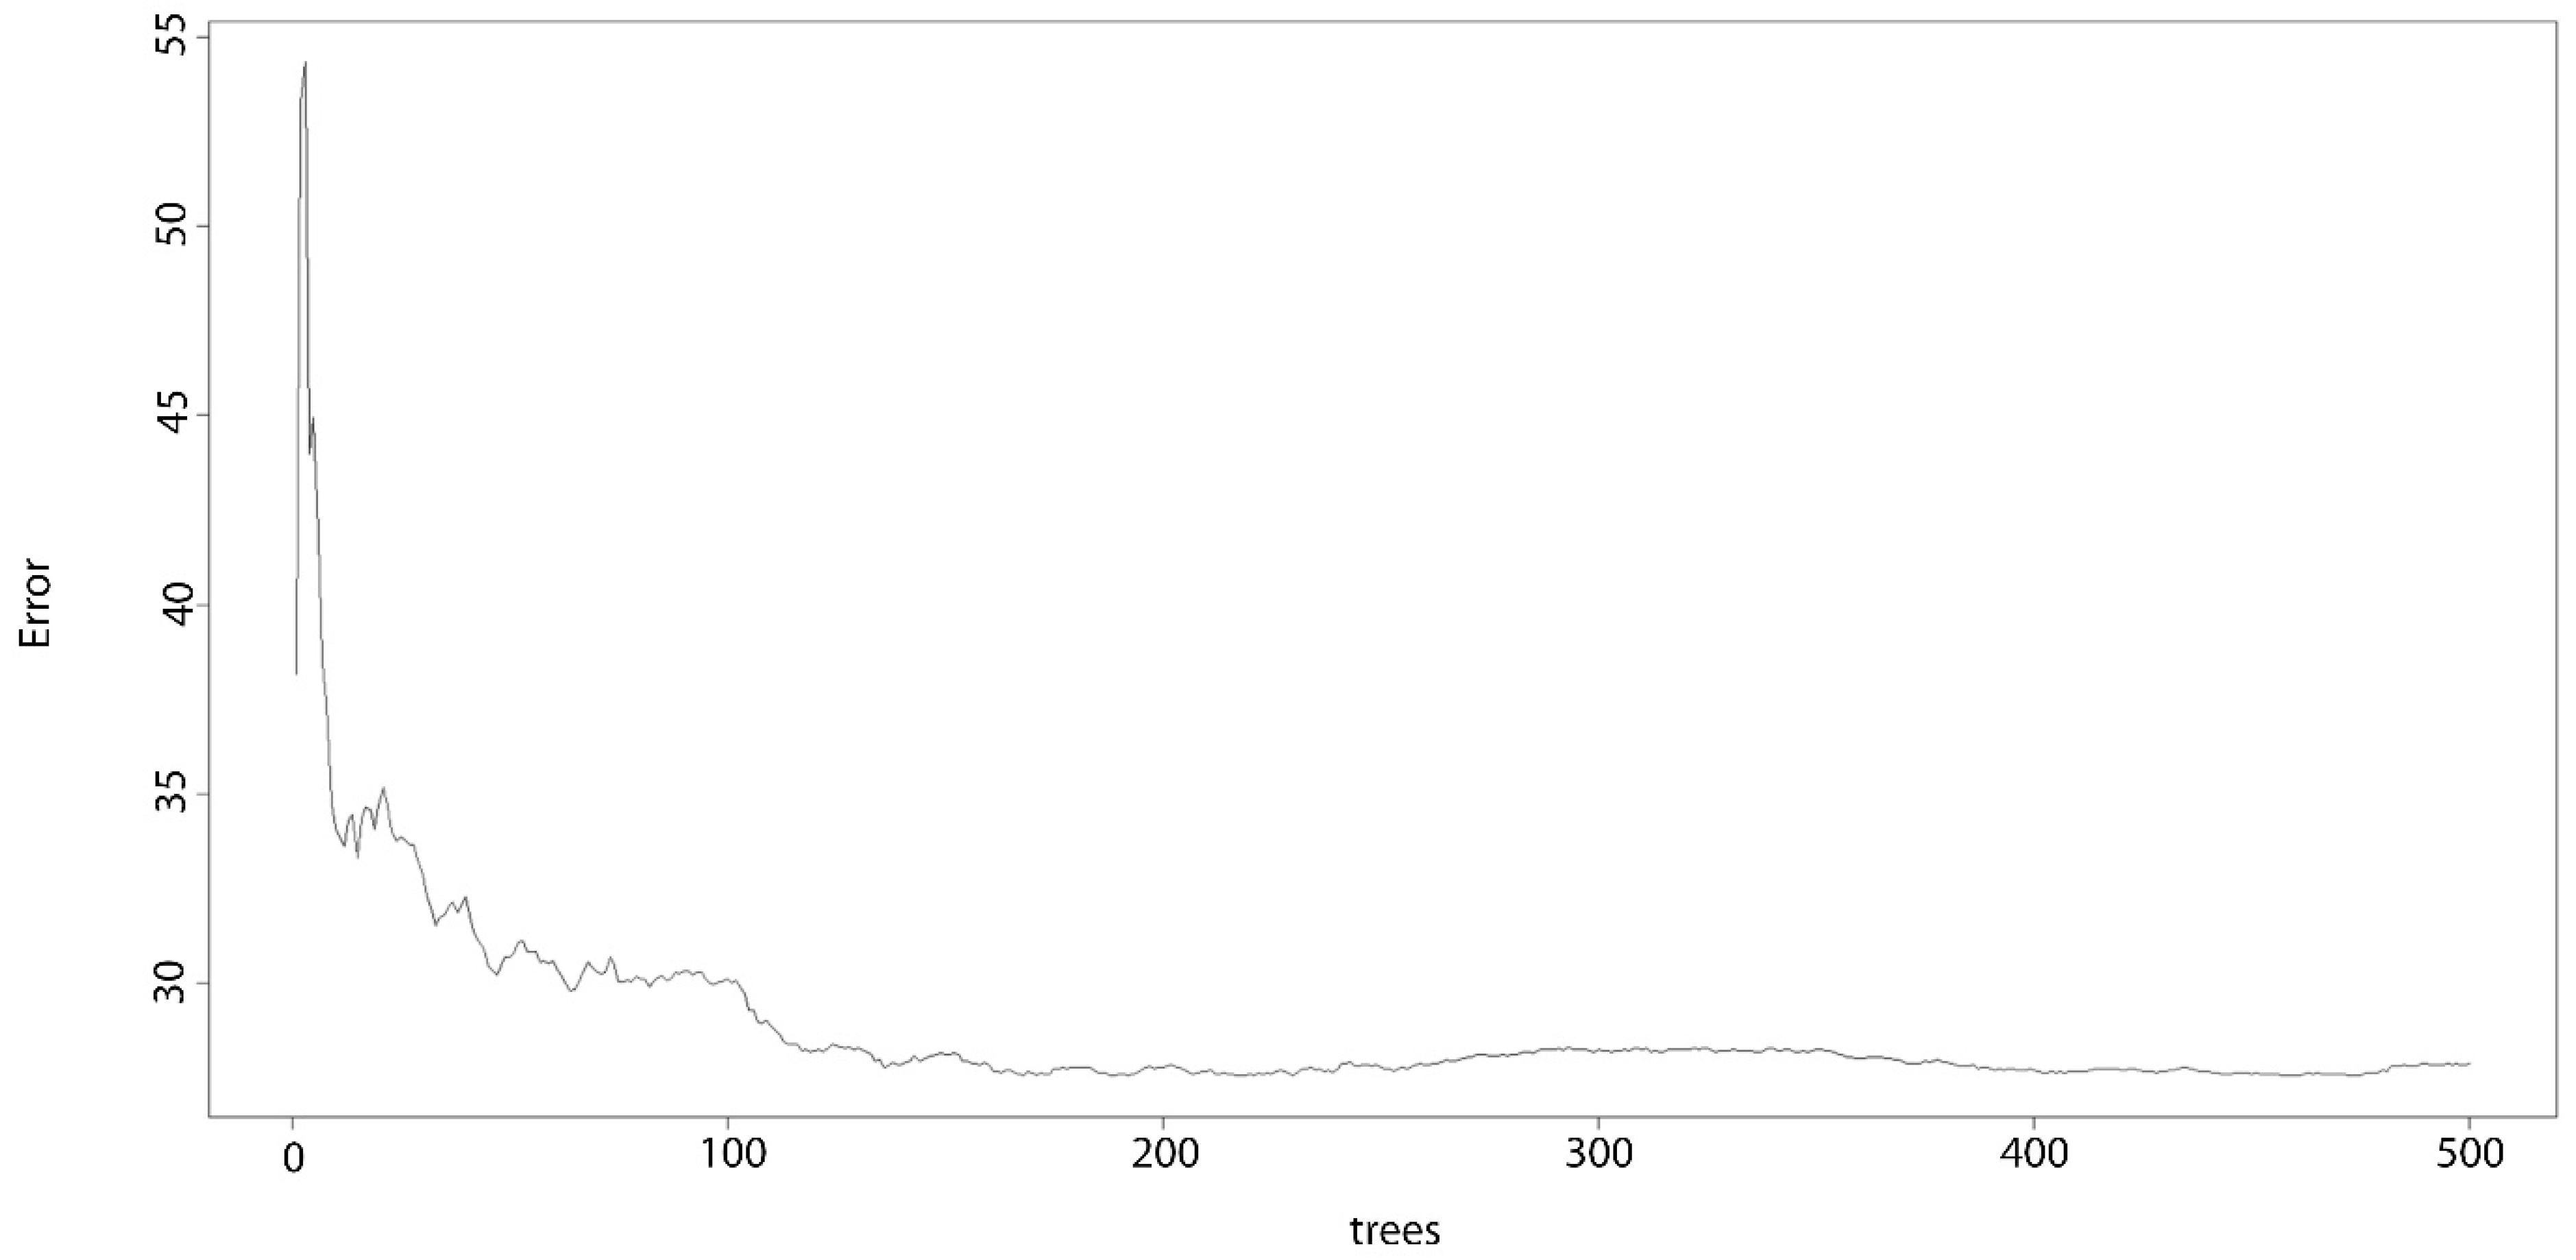
It might be noticed, from Figure 5, that a Random Forest with a lower number of trees (around 150–200) would have guaranteed similar performances, at least on the training set.
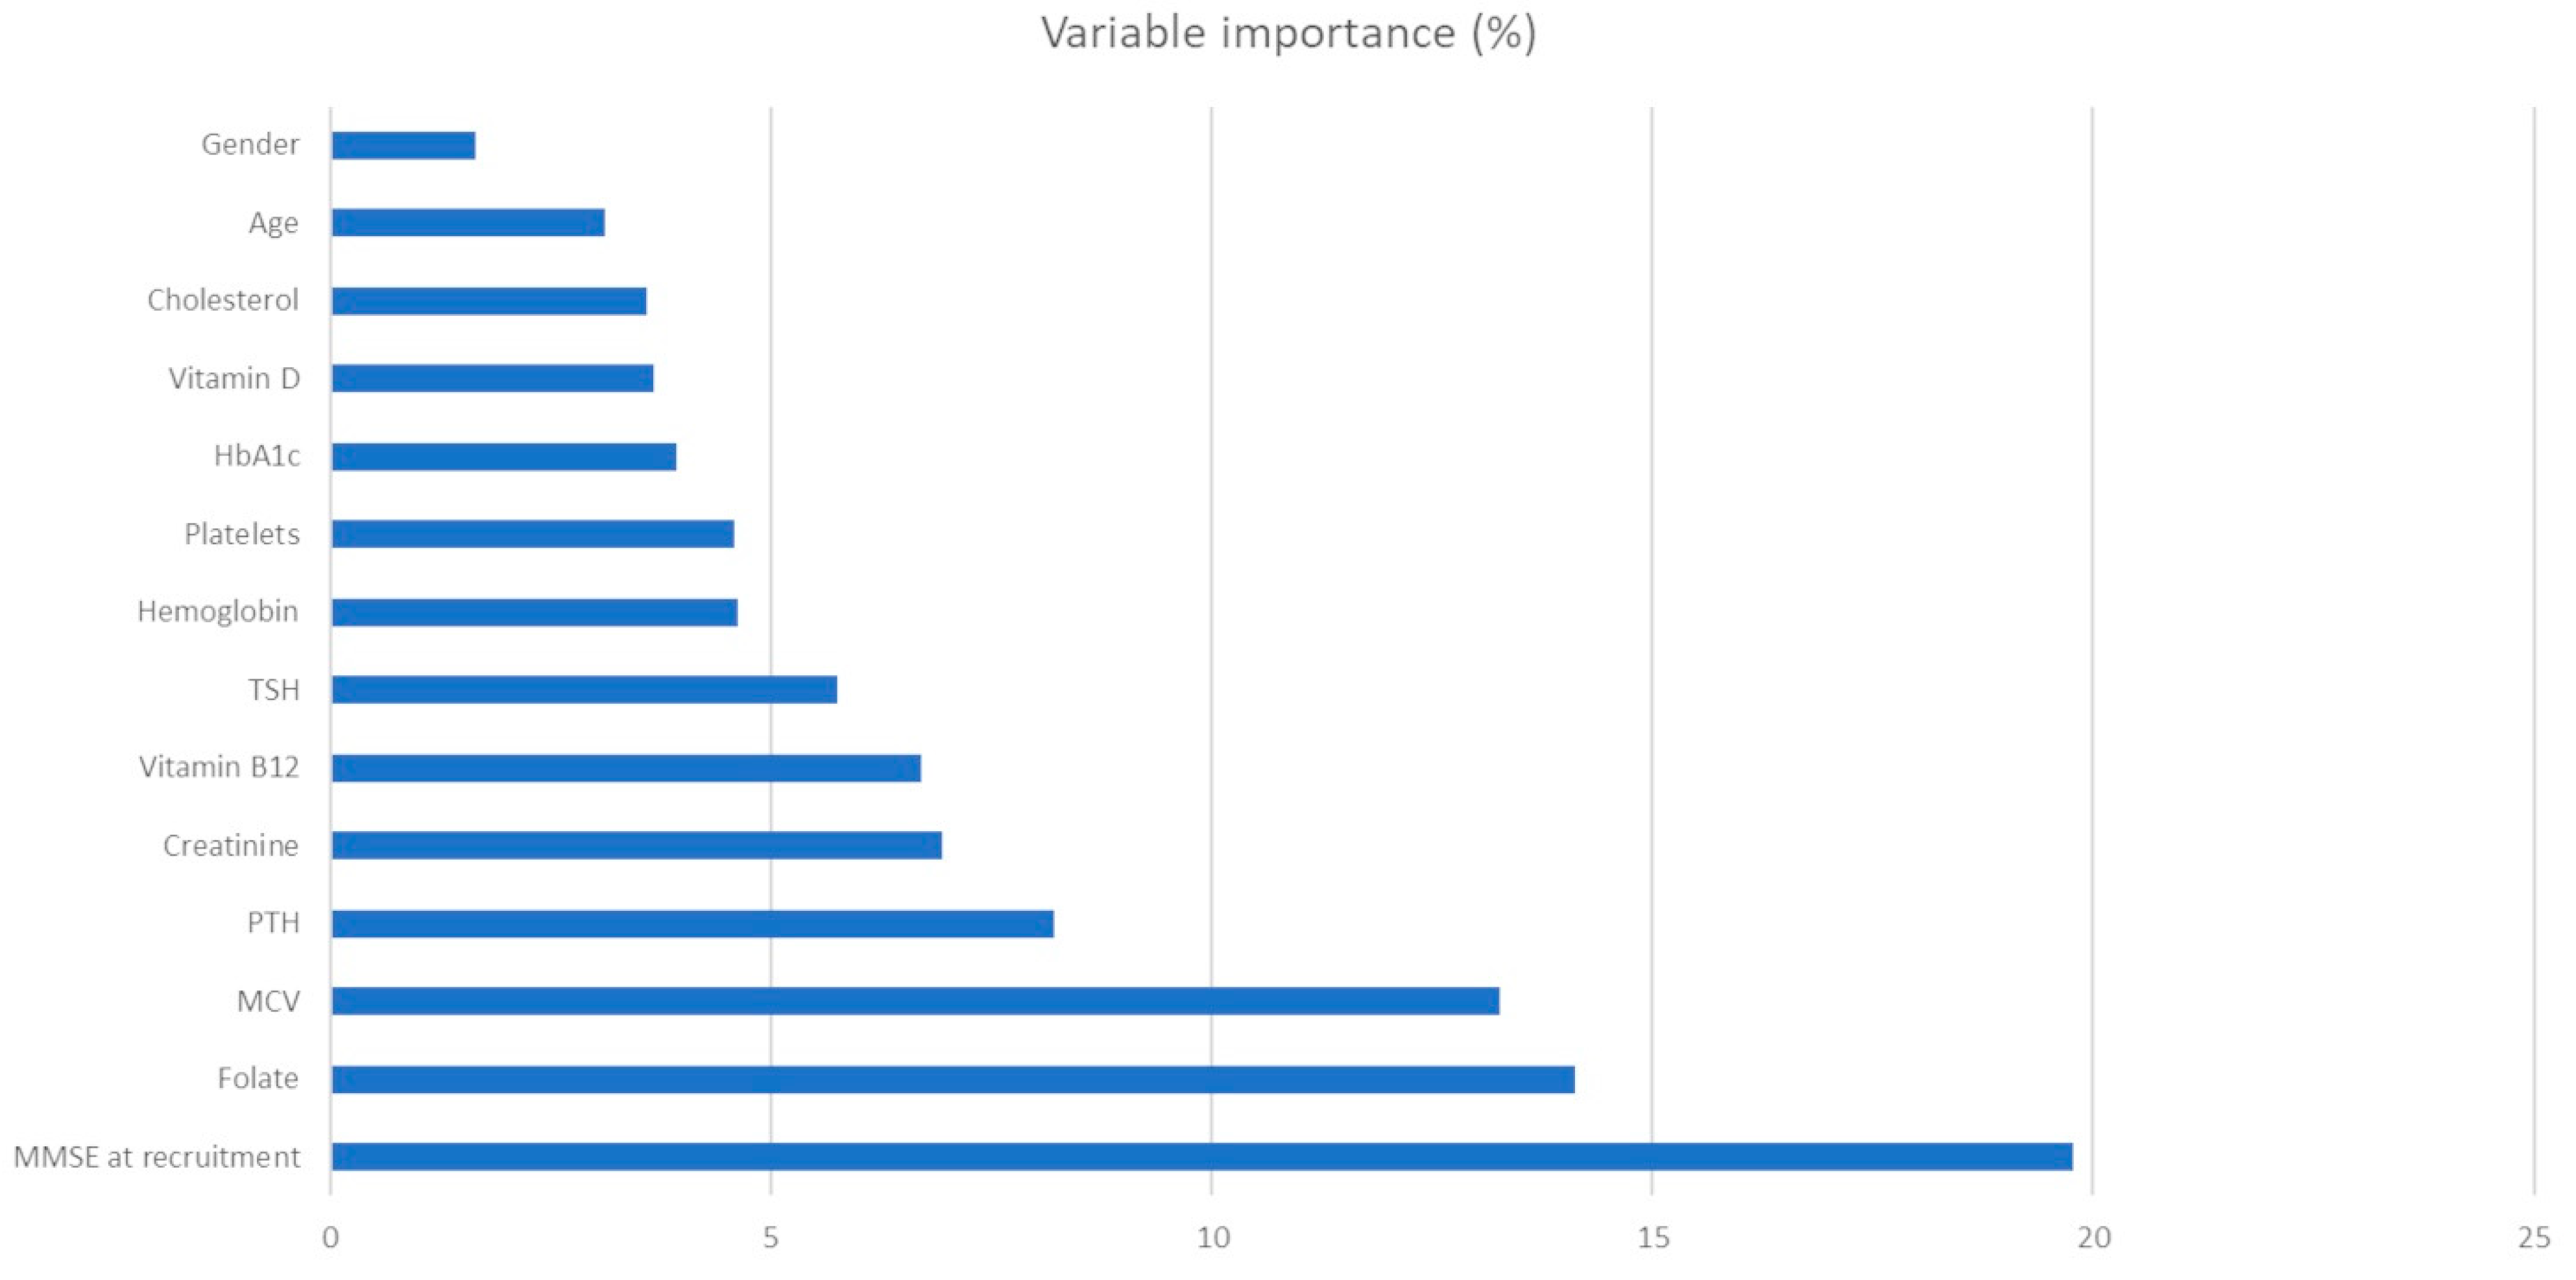
According to the evidence obtained, the best-performing Random Forest model made best use of randomly selected 8 out of the 14 parameters included in the dataset. According to the variable importance displayed, the first eight turn out to be: MMSE at recruitment, folate, MCV, PTH, creatinine, vitamin B12, TSH, and hemoglobin, deemed to be the most useful predictors to this extent. However, the importance of platelets is quite close to hemoglobin; thus, this variable can also be considered a helpful predictor for the VD progression.
As such, and to take into account the importance this paper might represent for the future, and to the benefit of the clinical community, a complete outlook on the variable importance for the “best” model is displayed in Figure 6.

4. Discussion

Artificial Intelligence is always employed more frequently in the clinical framework and applied to neurodegenerative conditions. Its use is growing, particularly when it comes to the analysis of images or genes eventually obtained by examinations or biological material from an individual affected by such a disorder. Both ML [30] and, in some instances, deep learning (DL) [31] approaches are commonly used, depending on the task demanded; however, such methods are usually applied to the classification of the disease into various stages and subtypes [31,32,33] to investigate eventual relationships between clinical parameters and biomarkers not easily retrieved by basic statistics [13], to detect early signs or symptoms of the disease occurring [34], as well as in the overall framework of the “p4 medicine” [35] that is nowadays trendy within the clinical research field. Within the framework of vascular dementia, our paper aimed to implement and train ML models for predicting the clinical outcome, represented by the variation in the MMSE score at follow-up versus the basal assessment, by using the variables acquired at the baseline as inputs. This can be deemed particularly important also in the sense of predictive and preventive medicine, as predicting in advance which course the disease can have in a large timescale can add value and drive the clinicians and caregivers to adopt proper, timely measures to delay the onset of a given condition, as in the case of dementia [36,37,38]. Considering VD, it is interesting to note that, to the best of our knowledge, this appears to be one of the first studies applying supervised ML techniques to predict the clinical outcome from clinical biomarkers without making use of complex imaging techniques or genetics. Indeed, this approach would allow a more cost-effective stance towards the disease, based on a slightly convenient procedure and its predictivity in a relatively long timeframe. This is even possibly the first work to undergo this specific approach for the aim aforementioned. That is to say, it is not to propose a differential diagnosis method for distinguishing types of dementia [16,17,39], but a way to predict the clinical outcome within a cohort whose diagnosis of VD was already present, eventually selecting which of the biomarkers possibly collected within a clinical setting could be more helpful to predict the outcome.
Considering the task proposed and the main drawback of the present investigation, which is the small sample size, the results in terms of predictivity are fairly satisfying, being that the RMSE is slightly lower than 5% and the MAE is lower than 10% of the MMSE maximum value (and the RMSE is less than 10% than the MMSE delta range). From a ML perspective, the Random Forest model performs better than the other ones taken into account, which is particularly surprising, considering the low number of individuals in our dataset.
Considering the most predictive biomarkers for the clinical evolution of VD, according to the results obtained by the best-performing model, MMSE at recruitment, folate, MCV, PTH, creatinine, vitamin B12, TSH, and hemoglobin were found to be the most predictive ones. Since the authors found no similar approaches in the existing literature, an interesting comparison can be performed with a study conducted with a similar methodology on a cohort of individuals with Alzheimer’s Disease [18]. In that case, vitamin D and folate were found to play an essential role in predicting the outcome, and folate was also seen here as the most important predictor for cognitive worsening after the MMSE at recruitment, whereas vitamin D is not particularly informative here. This is particularly interesting, as it might suggest similar etiopathological patterns between the two conditions, as expected mainly in light of the typical clinical hallmarks and considering the problematic discrimination between the two conditions, often also interrelated and somewhat consequential the one for the other [17,40]. However, the different roles appearing to be played by vitamin D levels might help in future works seeking to perform differential diagnosis between the two conditions. Differences in this case might be related to the fact that vascular dementia is also known to involve more complex phenomena, whose final result is represented by cognitive dysfunctions, mainly caused by brain tissue damage, which is in turn, brought by a vascular disease that can lead to large artery strokes; small vessel disease; and other, less-frequent vascular lesions [41].

4.1. Hematic Values as Predictors of Cognitive Impairment

MMSE at recruitment, folate, MCV, PTH, creatinine, vitamin B12, TSH, and hemoglobin were the best predictive parameters individuated by the machine learning models. The folate deficit was quite well studied in this domain since an optimal folate status overrides the influence of immunostimulation on Th1 [42]. Several authors reported the effectiveness of folic acid in diminishing serum homocysteine concentration [43]. In turn, homocysteine at high levels co-operates with low vitamin D intake onthe vascular damage [41]. Diseases with increased levels of PTH, such as primary hyperparathyroidism (pHPT) and chronic kidney disease (CKD) with secondary hyperparathyroidism (HPT), are not only associated with mineral metabolism pathology such as osteoporosis but also with a higher risk of a cardiovascular disorder [43,44]. Increasing levels of PTH were correlated with a higher risk of a clinical diagnosis of VD [45]. It is known that PTH is part of vitamin D metabolism. PTH and vitamin D act on the calcium cycle with a mutual influence. Once that serum vitamin D is reduced, PTH increases. A life-threatening lack of vitamin D may provoke secondary hyperparathyroidism and increase the risk of cognitive impairment [46]. Additionally, anemia and MCV, in combination with vitamin B12, are known to contribute to the development of impaired brain function due to circulation failure [47]. Finally, kidney function can be associated with VD, at least in specified clinical groups [48,49], and creatinine might be a surrogate biomarker to take into account to this extent. Once more, these data were confirmed by our analysis [50]. Our machine learning analysis indicated a clear trend, validating the ML work further.

4.2. Study Limitations

As mentioned above, the main limitation of the present work is represented by the low sample size of the dataset. This is due to the fact that VD is often misdiagnosed, and patients referred to the clinics for this kind of disease, matching the inclusion criteria of the research, are still relatively few, albeit increasing. Furthermore, the features available from the dataset come from the routine clinical assessment at the first visit and only refer to those examinations that can be performed keeping costs at bay, which is one of the main aims of the work. Finally, no differential diagnosis was evaluated (e.g., with respect to other dementias), and this could be one of the future works possibly stemming from this research.

5. Conclusions

5.1. Findings

The present study suggests that MMSE at recruitment, folate, MCV, PTH, creatinine, vitamin B12, TSH, and hemoglobin are potential predictors for cognitive decline in VD. The results that emerged are consistent with data from the literature. Regarding the serum parameters, we can speculate that nutraceutical supplementation could help to prevent or delay the disease progression in most cases. Moreover, to take advantage of ML potentialities, future studies are required to increase the number of data supporting the predictability of brain function loss. Ideally, serum biomarkers could represent an easy-to-achieve, fast, non-obtrusive, and cheap screening method.

5.2. Future Works

To be concretely evaluated, ML results should be integrated with brain imaging, physiological signal measurements, and sensory patterns, particularly for those senses already demonstrated to have a significant link with neurodegeneration, including olfaction [51,52]. Adjusting compound deficit by administering nutraceuticals could support treatment effectiveness and lead to a better quality of life for patients, families, and caregivers, with a consistent impact on the national health systems load.

Author Contributions

Conceptualization, G.M. and S.G. (Sara Genovese); methodology, G.M., S.B., A.T., L.B., F.M. and S.G. (Sebastiano Gangemi); software, A.T. and L.B.; validation, M.C., A.T. and S.G. (Sara Genovese); formal analysis, G.M., S.B., A.T., A.N., F.M. and S.G.(Sebastiano Gangemi); investigation, S.B., F.M.; resources, G.M., G.P. and S.G. (Sara Genovese); data curation, G.M., A.T. and S.G. (Sara Genovese); writing—original draft preparation, G.M., S.B., M.C., A.T., A.N. and F.M.; writing—review and editing, G.M., A.T. and S.G. (Sara Genovese); supervision, G.M., A.N., F.M. and S.G. (Sebastiano Gangemi); project administration, G.M. and S.G. (Sara Genovese); funding acquisition, G.P. All authors have read and agreed to the published version of the manuscript.

Funding

This research received no external funding.

Institutional Review Board Statement

For the Italian regulations for IRCCS institutions (IRCCS: Institute of Recovery and Care with Scientific Purpose), retrospective, observational studies do not require an ethical board approval, since they are included in the ordinary care activity brought by the institution. The patients are asked to sign an informed consent at their entry where they are asked to accept the usage of their data and the extent to which such data are used, including for research. For the patients included in this research, informed consent was obtained.

Informed Consent Statement

Informed consent details are provided upon request.

Data Availability Statement

Data can be provided by the authors upon request.

Conflicts of Interest

The authors declare no conflict of interest.

References

  1. O’Brien, J.T.; Thomas, A. Vascular Dementia. Lancet Lond. Engl. 2015, 386, 1698–1706. [Google Scholar] [CrossRef] [Green Version]
  2. Uwagbai, O.; Kalish, V.B. Vascular Dementia. In StatPearls; StatPearls Publishing: Treasure Island, FL, USA, 2022. [Google Scholar]
  3. Tariq, S.; Barber, P.A. Dementia Risk and Prevention by Targeting Modifiable Vascular Risk Factors. J. Neurochem. 2018, 144, 565–581. [Google Scholar] [CrossRef] [PubMed] [Green Version]
  4. van der Flier, W.M.; Scheltens, P. Epidemiology and Risk Factors of Dementia. J. Neurol. Neurosurg. Psychiatry 2005, 76, 2–7. [Google Scholar] [CrossRef] [PubMed] [Green Version]
  5. Venkat, P.; Chopp, M.; Chen, J. Models and Mechanisms of Vascular Dementia. Exp. Neurol. 2015, 272, 97–108. [Google Scholar] [CrossRef] [PubMed] [Green Version]
  6. Iadecola, C.; Duering, M.; Hachinski, V.; Joutel, A.; Pendlebury, S.T.; Schneider, J.A.; Dichgans, M. Vascular Cognitive Impairment and Dementia: JACC Scientific Expert Panel. J. Am. Coll. Cardiol. 2019, 73, 3326–3344. [Google Scholar] [CrossRef] [PubMed]
  7. Korczyn, A.D.; Vakhapova, V.; Grinberg, L.T. Vascular Dementia. J. Neurol. Sci. 2012, 322, 2–10. [Google Scholar] [CrossRef] [PubMed] [Green Version]
  8. Gorelick, P.B.; Scuteri, A.; Black, S.E.; DeCarli, C.; Greenberg, S.M.; Iadecola, C.; Launer, L.J.; Laurent, S.; Lopez, O.L.; Nyenhuis, D.; et al. Vascular Contributions to Cognitive Impairment and Dementia. Stroke J. Cereb. Circ. 2011, 42, 2672–2713. [Google Scholar] [CrossRef] [PubMed]
  9. Howes, M.-J.R.; Perry, N.S.L.; Vásquez-Londoño, C.; Perry, E.K. Role of Phytochemicals as Nutraceuticals for Cognitive Functions Affected in Ageing. Br. J. Pharmacol. 2020, 177, 1294–1315. [Google Scholar] [CrossRef] [Green Version]
  10. Mecocci, P.; Tinarelli, C.; Schulz, R.J.; Polidori, M.C. Nutraceuticals in Cognitive Impairment and Alzheimer’s Disease. Front. Pharmacol. 2014, 5, 147. [Google Scholar] [CrossRef] [PubMed] [Green Version]
  11. Wahl, D.; Solon-Biet, S.M.; Cogger, V.C.; Fontana, L.; Simpson, S.J.; Le Couteur, D.G.; Ribeiro, R.V. Aging, Lifestyle and Dementia. Neurobiol. Dis. 2019, 130, 104481. [Google Scholar] [CrossRef]
  12. de la Fuente Garcia, S.; Ritchie, C.W.; Luz, S. Artificial Intelligence, Speech, and Language Processing Approaches to Monitoring Alzheimer’s Disease: A Systematic Review. J. Alzheimers Dis. 2020, 78, 1547–1574. [Google Scholar] [CrossRef] [PubMed]
  13. Popuri, K.; Ma, D.; Wang, L.; Beg, M.F. Using machine learning to quantify structural MRI neurodegeneration patterns of Alzheimer’s disease into dementia score: Independent validation on 8834 images from ADNI, AIBL, OASIS, and MIRIAD databases. Hum. Brain. Mapp. 2020, 41, 4127–4147. [Google Scholar] [CrossRef] [PubMed]
  14. Platten, M.; Brusini, I.; Andersson, O.; Ouellette, R.; Piehl, F.; Wang, C.; Granberg, T. Deep Learning Corpus Callosum Segmentation as a Neurodegenerative Marker in Multiple Sclerosis. J. Neuroimaging 2021, 31, 493–500. [Google Scholar] [CrossRef] [PubMed]
  15. Gurevich, P.; Stuke, H.; Kastrup, A.; Stuke, H.; Hildebrandt, H. Neuropsychological Testing and Machine Learning Distinguish Alzheimer’s Disease from Other Causes for Cognitive Impairment. Front. Aging Neurosci. 2017, 9, 114. [Google Scholar] [CrossRef]
  16. Zheng, Y.; Guo, H.; Zhang, L.; Wu, J.; Li, Q.; Lv, F. Machine Learning-Based Framework for Differential Diagnosis between Vascular Dementia and Alzheimer’s Disease Using Structural MRI Features. Front. Neurol. 2019, 10, 1097. [Google Scholar] [CrossRef] [PubMed]
  17. Castellazzi, G.; Cuzzoni, M.G.; Cotta Ramusino, M.; Martinelli, D.; Denaro, F.; Ricciardi, A.; Vitali, P.; Anzalone, N.; Bernini, S.; Palesi, F.; et al. A Machine Learning Approach for the Differential Diagnosis of Alzheimer and Vascular Dementia Fed by MRI Selected Features. Front. Neuroinform. 2020, 14, 25. [Google Scholar] [CrossRef] [PubMed]
  18. Murdaca, G.; Banchero, S.; Tonacci, A.; Nencioni, A.; Monacelli, F.; Gangemi, S. Vitamin D and Folate as Predictors of MMSE in Alzheimer’s Disease: A Machine Learning Analysis. Diagnostics 2021, 11, 940. [Google Scholar] [CrossRef]
  19. James, G.; Witten, D.; Hastie, T.; Tibshirani, R. An Introduction to Statistical Learning; Springer: New York, NY, USA, 2013. [Google Scholar] [CrossRef]
  20. Danieli, M.G.; Tonacci, A.; Paladini, A.; Longhi, E.; Moroncini, G.; Allegra, A.; Sansone, F.; Gangemi, S. A machine learning analysis to predict the response to intravenous and subcutaneous immunoglobulin in inflammatory myopathies. A proposal for a future multi-omics approach in autoimmune diseases. Autoimmun. Rev. 2022, 21, 103105. [Google Scholar] [CrossRef]
  21. Kuhn, M. Caret: Classification and Regression Training. R Package Version 6.0-73. Available online: https://CRAN.R-Project.Org/Package=caret (accessed on 10 March 2021).
  22. Tibshirani, R. Regression shrinkage and selection via the lasso. J. R. Stat. Soc. B 1996, 58, 267–288. [Google Scholar] [CrossRef]
  23. Hoerl, A.E.; Kennard, R.W. Ridge Regression: Biased Estimation for Nonorthogonal Problems. Technometrics 1970, 12, 55–67. [Google Scholar] [CrossRef]
  24. Zou, H.; Hastie, T. Regularization and Variable Selection via the Elastic Net. J. R. Stat. Soc. B 2005, 67, 301–320. [Google Scholar] [CrossRef] [Green Version]
  25. Breiman, L.; Friedman, J.H.; Olshen, R.A.; Stone, C.J. Classification and Regression Trees, 1st ed.; Routledge: Milton Park, UK, 1984. [Google Scholar] [CrossRef]
  26. Ho, T.K. The Random Subspace Method for Constructing Decision Forests. IEEE Trans. Pattern Anal. Mach. Intell. 1998, 20, 832–844. [Google Scholar]
  27. Conlin, A.K.; Martin, E.B.; Morris, A.J. Data Augmentation: An Alternative Approach to the Analysis of Spectroscopic Data. Chemom. Intell. Lab. Syst. 1998, 44, 161–173. [Google Scholar] [CrossRef]
  28. Beinecke, J.; Heider, D. Gaussian Noise Up-Sampling Is Better Suited than SMOTE and ADASYN for Clinical Decision Making. BioData Min. 2021, 14, 49. [Google Scholar] [CrossRef] [PubMed]
  29. Finch, W.; Finch, M. Regularization Methods for Fitting Linear Models with Small Sample Sizes: Fitting the Lasso Estimator Using R. Pract. Assess. Res. Eval. 2019, 21, 7. [Google Scholar] [CrossRef]
  30. Gaubert, S.; Houot, M.; Raimondo, F.; Ansart, M.; Corsi, M.-C.; Naccache, L.; Sitt, J.D.; Habert, M.-O.; Dubois, B.; De Vico Fallani, F.; et al. A Machine Learning Approach to Screen for Preclinical Alzheimer’s Disease. Neurobiol. Aging 2021, 105, 205–216. [Google Scholar] [CrossRef]
  31. Shojaie, M.; Tabarestani, S.; Cabrerizo, M.; DeKosky, S.T.; Vaillancourt, D.E.; Loewenstein, D.; Duara, R.; Adjouadi, M. PET Imaging of Tau Pathology and Amyloid-β, and MRI for Alzheimer’s Disease Feature Fusion and Multimodal Classification. J. Alzheimers Dis. 2021, 84, 1497–1514. [Google Scholar] [CrossRef]
  32. Andrade de Oliveira, A.; Carthery-Goulart, M.T.; Oliveira Júnior, P.P.d.M.; Carrettiero, D.C.; Sato, J.R. Defining Multivariate Normative Rules for Healthy Aging Using Neuroimaging and Machine Learning: An Application to Alzheimer’s Disease. J. Alzheimers Dis. 2015, 43, 201–212. [Google Scholar] [CrossRef] [PubMed]
  33. Mirelman, A.; Ben, O.; Melamed, M.; Granovsky, L.; Nieuwboer, A.; Rochester, L.; Del, D.; Avanzino, L.; Pelosin, E.; Bloem, B.R.; et al. Detecting Sensitive Mobility Features for Parkinson Disease Stages via Machine Learning. Mov. Disord. 2021, 36, 2144–2155. [Google Scholar] [CrossRef] [PubMed]
  34. Rizk-Jackson, A.; Stoffers, D.; Sheldon, S.; Kuperman, J.; Dale, A.; Goldstein, J.; Corey-Bloom, J.; Poldrack, R.A.; Aron, A.R. Evaluating Imaging Biomarkers for Neurodegeneration in Pre-Symptomatic Huntington’s Disease Using Machine Learning Techniques. NeuroImage 2011, 56, 788–796. [Google Scholar] [CrossRef] [PubMed]
  35. Caballero, H.S.; McFall, G.P.; Zheng, Y.; Dixon, R.A. Data-Driven Approaches to Executive Function Performance and Structure in Aging: Integrating Person-Centered Analyses and Machine Learning Risk Prediction. Neuropsychology 2021, 35, 889–903. [Google Scholar] [CrossRef] [PubMed]
  36. Maffei, L.; Picano, E.; Andreassi, M.G.; Angelucci, A.; Baldacci, F.; Baroncelli, L.; Begenisic, T.; Bellinvia, P.F.; Berardi, N.; Biagi, L.; et al. Randomized Trial on the Effects of a Combined Physical/Cognitive Training in Aged MCI Subjects: The Train the Brain Study. Sci. Rep. 2017, 7, 39471. [Google Scholar] [CrossRef] [Green Version]
  37. Tonacci, A.; Bruno, R.M.; Ghiadoni, L.; Pratali, L.; Berardi, N.; Tognoni, G.; Cintoli, S.; Volpi, L.; Bonuccelli, U.; Sicari, R.; et al. Olfactory Evaluation in Mild Cognitive Impairment: Correlation with Neurocognitive Performance and Endothelial Function. Eur. J. Neurosci. 2017, 45, 1279–1288. [Google Scholar] [CrossRef] [PubMed]
  38. Brai, E.; Tonacci, A.; Brugada-Ramentol, V.; D’Andrea, F.; Alberi, L. Intercepting Dementia: Awareness and Innovation as Key Tools. Front. Aging Neurosci. 2021, 13, 730727. [Google Scholar] [CrossRef]
  39. Er, F.; Iscen, P.; Sahin, S.; Çinar, N.; Karsidag, S.; Goularas, D. Distinguishing Age-Related Cognitive Decline from Dementias: A Study Based on Machine Learning Algorithms. J. Clin. Neurosci. Off. J. Neurosurg. Soc. Australas. 2017, 42, 186–192. [Google Scholar] [CrossRef]
  40. Emrani, S.; Lamar, M.; Price, C.C.; Wasserman, V.; Matusz, E.; Au, R.; Swenson, R.; Nagele, R.; Heilman, K.M.; Libon, D.J. Alzheimer’s/Vascular Spectrum Dementia: Classification in Addition to Diagnosis. J. Alzheimers Dis. 2020, 73, 63–71. [Google Scholar] [CrossRef] [PubMed]
  41. Vinters, H.V.; Zarow, C.; Borys, E.; Whitman, J.D.; Tung, S.; Ellis, W.G.; Zheng, L.; Chui, H.C. Review: Vascular Dementia: Clinicopathologic and Genetic Considerations. Neuropathol. Appl. Neurobiol. 2018, 44, 247–266. [Google Scholar] [CrossRef]
  42. Gofir, A.; Wibowo, S.; Hakimi, M.; Putera, D.D.; Satriotomo, I. Mustofa Folic Acid Treatment for Patients with Vascular Cognitive Impairment: A Systematic Review and Meta-Analysis. Int. J. Neuropsychopharmacol. 2022, 25, 136–143. [Google Scholar] [CrossRef]
  43. Block, G.A.; Klassen, P.S.; Lazarus, J.M.; Ofsthun, N.; Lowrie, E.G.; Chertow, G.M. Mineral Metabolism, Mortality, and Morbidity in Maintenance Hemodialysis. J. Am. Soc. Nephrol. 2004, 15, 2208–2218. [Google Scholar] [CrossRef]
  44. Garcia de la Torre, N.; Wass, J.A.H.; Turner, H.E. Parathyroid Adenomas and Cardiovascular Risk. Endocr. Relat. Cancer 2003, 10, 309–322. [Google Scholar] [CrossRef] [Green Version]
  45. Hagström, E.; Kilander, L.; Nylander, R.; Larsson, E.-M.; Michaëlsson, K.; Melhus, H.; Ahlström, H.; Johansson, L.; Lind, L.; Ärnlöv, J. Plasma Parathyroid Hormone Is Associated with Vascular Dementia and Cerebral Hyperintensities in Two Community-Based Cohorts. J. Clin. Endocrinol. Metab. 2014, 99, 4181–4189. [Google Scholar] [CrossRef] [PubMed]
  46. Lourida, I.; Thompson-Coon, J.; Dickens, C.M.; Soni, M.; Kuźma, E.; Kos, K.; Llewellyn, D.J. Parathyroid Hormone, Cognitive Function and Dementia: A Systematic Review. PLoS ONE 2015, 10, e0127574. [Google Scholar] [CrossRef] [PubMed] [Green Version]
  47. Jiang, Z.; Han, X.; Wang, Y.; Hou, T.; Cong, L.; Tang, S.; Han, X.; Ngandu, T.; Kivipelto, M.; Winblad, B.; et al. Red Cell Distribution Width and Dementia Among Rural-Dwelling Older Adults: The MIND-China Study. J. Alzheimers Dis. 2021, 83, 1187–1198. [Google Scholar] [CrossRef] [PubMed]
  48. Koenig, A.M.; Nobuhara, C.K.; Williams, V.J.; Arnold, S.E. Biomarkers in Alzheimer’s, Frontotemporal, Lewy Body, and Vascular Dementias. Focus (Am. Psychiatr. Publ.) 2018, 16, 164–172. [Google Scholar] [CrossRef]
  49. Kurella Tamura, M.; Gaussoin, S.A.; Pajewski, N.M.; Chelune, G.J.; Freedman, B.I.; Gure, T.R.; Haley, W.E.; Killeen, A.A.; Oparil, S.; Rapp, S.R.; et al. Kidney Disease, Intensive Hypertension Treatment, and Risk for Dementia and Mild Cognitive Impairment: The Systolic Blood Pressure Intervention Trial. J. Am. Soc. Nephrol. 2020, 31, 2122–2132. [Google Scholar] [CrossRef]
  50. Hong, C.H.; Falvey, C.; Harris, T.B.; Simonsick, E.M.; Satterfield, S.; Ferrucci, L.; Metti, A.L.; Patel, K.V.; Yaffe, K. Anemia and Risk of Dementia in Older Adults: Findings from the Health ABC Study. Neurology 2013, 81, 528–533. [Google Scholar] [CrossRef] [Green Version]
  51. Brai, E.; Hummel, T.; Alberi, L. Smell, an Underrated Early Biomarker for Brain Aging. Front. Neurosci. 2020, 14, 792. [Google Scholar] [CrossRef]
  52. Tonacci, A.; Baldus, G.; Corda, D.; Piccaluga, E.; Andreassi, M.G.; Cremonesi, A.; Guagliumi, G.; Picano, E. Olfactory non-cancer effects of exposure to ionizing radiation in staff working in the cardiac catheterization laboratory. Int. J. Cardiol. 2014, 171, 461–463. [Google Scholar] [CrossRef]
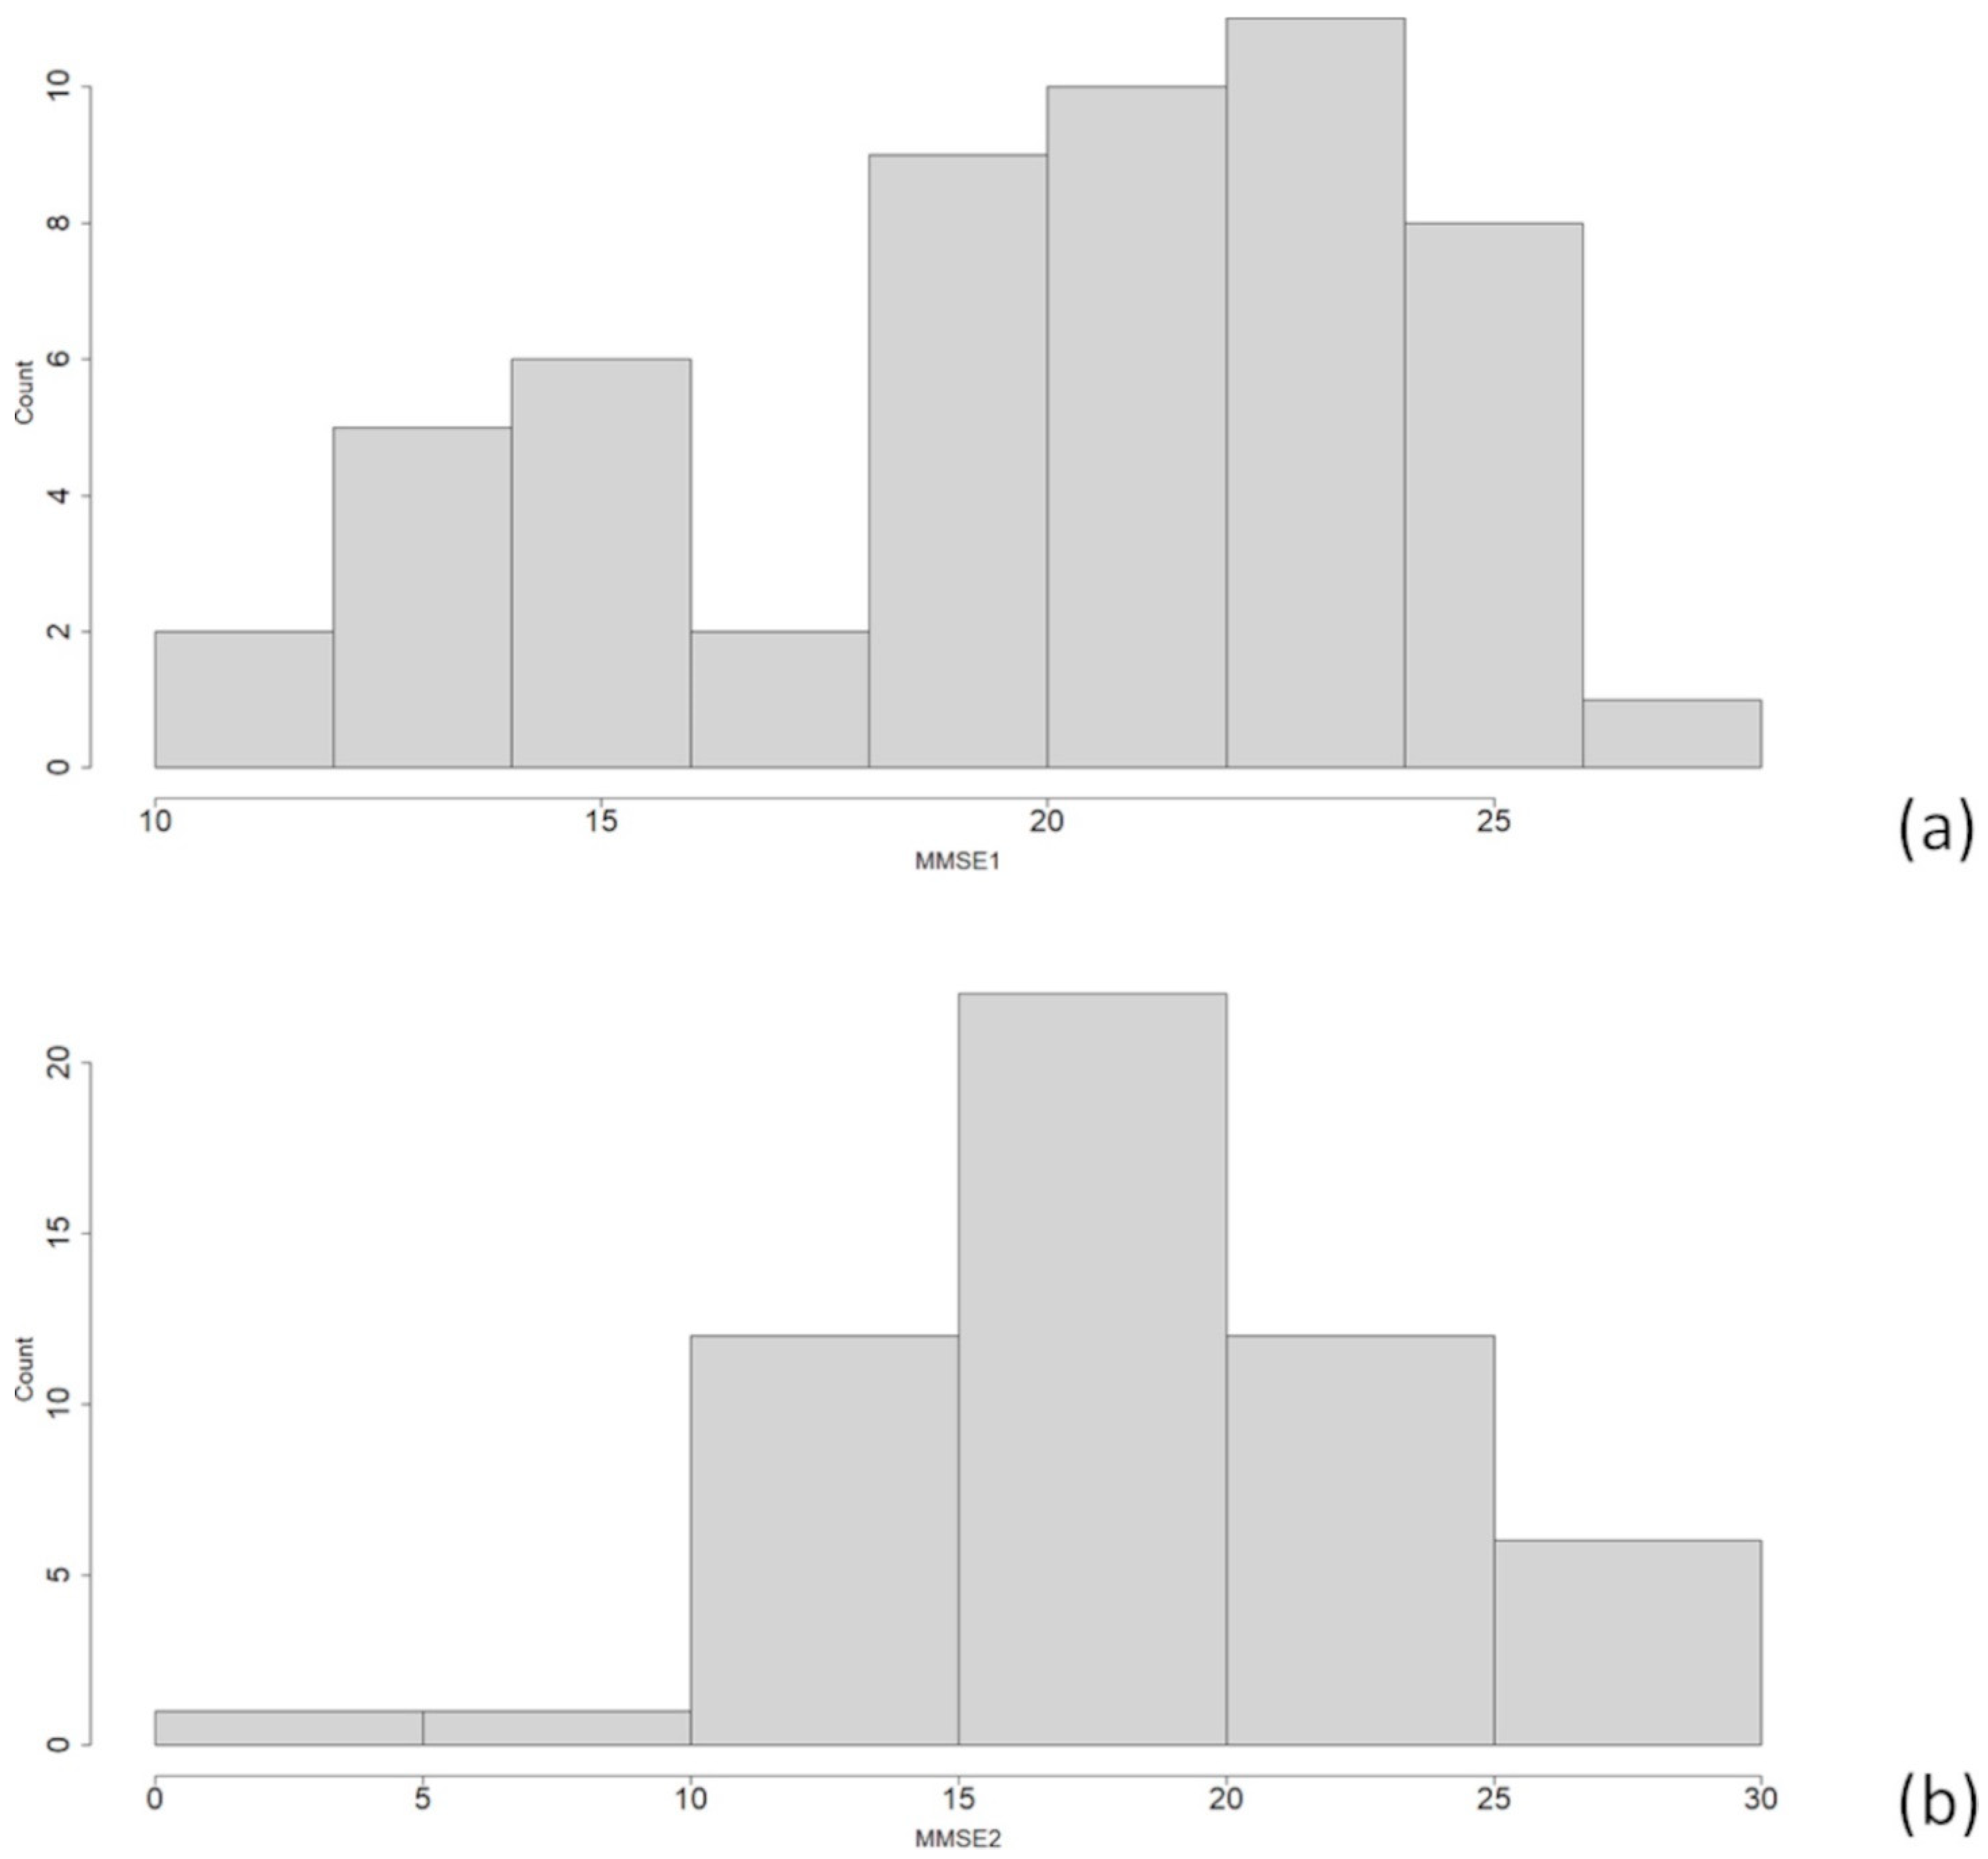
Figure 1. MMSE1 (a) and MMSE2 (b) distribution throughout the dataset.
Processes 10 02088 g001
Figure 2. Inputs and output used for the ML models.
Processes 10 02088 g002
Figure 3. Comparison of the five models in the regression task on the original dataset and 70%/30% training/test set split.
Processes 10 02088 g003
Figure 4. Training performances of the Random Forest model when seeking the best model to be selected.
Processes 10 02088 g004
Figure 5. Error variation on the training set for the Random Forest based on the number of trees.
Processes 10 02088 g005
Figure 6. Variable importance for the Random Forest model.
Processes 10 02088 g006
Table 1. Model performances, as RMSE, in the regression task.
ApproachTrain/Test (%)LASSORIDGEE-NetCARTRandom Forest
Original Dataset80/203.9924.2203.9674.3703.710
70/303.3213.3643.3263.9711.979
Data Augmentation by 100%80/203.9394.4304.1815.4334.212
70/304.7204.7774.7347.1975.001
Data Augmentation by 200%80/203.7573.7563.8013.1353.948
70/305.3865.5275.3515.8625.419
Table 2. Model performances, as MAE, in the regression task for the original dataset under the 70/30% training/test set split.
ApproachTrain/Test (%)LASSORIDGEE-NetCARTRandom Forest
Original Dataset70/303.2953.8333.2923.3072.864
Publisher’s Note: MDPI stays neutral with regard to jurisdictional claims in published maps and institutional affiliations.