Article

Nanofiltration Treatment of Industrial Wastewater Doped with Organic Dye: A Study of Hydrodynamics and Specific Energy

1
Laboratory Valorization and Recycling of Matters and Sustainable Development, University of Science and Technology Houari Boumediene, Algiers 16111, Algeria
2
Laboratory of Reaction Engineering, University of Science and Technology Houari Boumediene, Algiers 16111, Algeria
3
Unilasalle-Ecole des Metiers de l’Environnement, Cyclann, Campus de Ker Lann, 35170 Bruz, France
4
Laboratory of Water-Energy-Environment, National Engineering School of Sfax, University of Sfax, B.P 1173. W., Sfax 3038, Tunisia
*
Authors to whom correspondence should be addressed.
Processes 2022, 10(11), 2277; https://doi.org/10.3390/pr10112277
Submission received: 26 September 2022 / Revised: 17 October 2022 / Accepted: 26 October 2022 / Published: 3 November 2022

Abstract

:

Highlights

  • Positive influence of the media through wastewater dilution to permeate quality.
  • Reduction in COD removal efficiency with an increase in pressure due to interactions between negative sites on the membrane and ions in solution.
  • Optimal energy consumption attained an efficient process for high quality treated wastewater.
  • Solution pH and composition changes ion and membrane charge and decreases selectivity.

Abstract

This study was conducted to eliminate the ions and molecules present in the industrial wastewater received by the municipal wastewater treatment plant (WWTP) of Reghaia, which is located east of Algiers, Algeria. The process was developed for two different study matrices: (a) the wastewater from WWTP and (b) wastewater mixed with Brilliant Blue FCF (BBF) dye to show the influence of the strength of the ionic solution on the treatment. The most effective operating parameters were determined by assessing the residence time distribution applied to the reactor flow regime. Energy analysis showed the viability of a nanofiltration membrane, improving the permeate flux. The nanofiltration process consumed 1.94 kWh/m3 to reduce the chemical oxygen demand (COD) of 63.58% and 48.35% for raw wastewater and doped BBF wastewater, respectively. The results demonstrated that nanofiltration performance with a volume dilution ratio of 1/2 showed the reduction of the COD of 87.2% after 15 min for undoped wastewater, whereas the retention rate decreases to 64% with an increase of dilution ratio to 4/5 for the same water matrix. The influence of a pH of 5 has a significant influence on the composition of the wastewater matrix by the reduction of COD of 49.8% and 59.68% for doped wastewater and raw wastewater, respectively. This could be explained by the isolated points of the membrane in the order of 4.5.

Graphical Abstract

1. Introduction

The last decade can be defined by climate change, population growth, urbanization, pollution, and the expansion of irrigated agriculture, which has caused problems and has had a direct impact on the humid zone. Globally, freshwater scarcity is an important challenge affecting human activity and the sustainable development of arid zones and protected marine areas [1]. For instance, Reghaia Lake, which is situated in the Mediterranean Region of Algeria, has been recognized as a wetland and a site of ecological importance. However, the lake has been threatened by industrial pollution. Some of the polluted water was purified in a municipal wastewater treatment plant (WWTP) in Reghaia and then returned to the lake [2,3]. Considerable effort has been made in water management to minimize contamination risk [4]. The WWTP station has a conventional wastewater purification system with a capacity of 90,000 population-equivalents [5]. The possibility of organic pollutants finding their way into the aquatic environments even after treatment exists. An increase in the turbidity of the water, for example, can cause deterioration of the ecosystem. Therefore, improving wastewater treatment processes are crucial [6,7,8].
Moreover, access to clean water is the main reason for the development of more effective methods for the treatment and delivery of water and sanitation services, which are important for society. Wastewater can contain different impurities, such as organic matter. This typically needs multiple-step treatments, such as sedimentation [9], filtration [10], and adsorption [9], which are able to reduce the concentration of contaminants but are energy-consuming and may be costly [11]. The goals of reusing or disposing of wastewater will determine levels of treatment required. Conventional methods include physical, chemical, and biological treatments for wastewater treatment. The biological treatment of wastewater is applied for organic/nutrient removal through an activated sludge process, followed by a sand filtration process, to achieve high quality water. This process removes particles and inactivates microorganisms in order to meet strict wastewater discharge standards [1,12]. However, there are drawbacks to water reuse, such as higher conductivity and chemical oxygen demand (COD) [7].
Membrane technologies are increasingly employed as a long-term solution to wastewater treatment and reuse [13]. These are very promising candidates because of their many advantages, such as abilities that provide an excellent effluent quality regarding their removal of different pollutants, their ease of operation, and their small footprint [14]. Normally, a conventionally activated sludge process is applied to biologically treated wastewater and then the effluent is further purified for the removal of dissolved organic and ions by membrane processes, such as nanofiltration (NF) [15] or reverse osmosis (RO) [7,16], towards sustainable wastewater reclamation [1].
On the other hand, rejected organic dyes from the coloring process are a serious problem because of their resistance to treatment, reducing sunlight transmission and affecting aquatic ecosystems [17,18]. Membrane separation is a possible remedy due to the better control of hydraulic retention times and lower operating costs [19,20].
Combining membrane filtration and hybrid processes has attracted interest due to the ability to overcome the disadvantages of traditional water treatment processes. Researchers have shown that a combination of processes is better than the single one for performance. However, the need to reduce energy consumption and fouling problems are still limitations in membrane process treatments [21]. Studies have been conducted to combine processes to enhance wastewater treatment [22]. Among them, Grzechulska-Damszel et al. investigated the integration of photocatalysis with membrane processes for the removal of azo dyes. It was found that the use of nanofiltration was very effective in decreasing the concentration of the dye and its conductivity. This was accompanied by an increase in pH of the permeate. The analysis of inorganic ions showed that over 95% of the sulfate ions and 80% of total inorganic nitrogen were removed after nanofiltration [23]. Moreover, Ganzenko et al. reported on the elimination of carbamazepine from wastewater using titanium oxides (TiOX) with reactive electrochemical membranes (REM) as the anode. With a monodispersed pore size distribution of 1.4 nm, this membrane was effective in removing a pharmaceutical pollutant when the current density was 73 A.m−2. This study shows that more than 70% of minerals and 98% of carbamazepine were eliminated [24]. On the other hand, according to Sharjeel Waqas et al., the combination of biological and membrane processes could be used to treat domestic wastewater. Indeed, the results showed that the hybridization of the process doubled the permeability and was able to achieve the removal of 96% of the turbidity and 84% of the COD [25].
The feasibility of reducing the number of stages and obtaining acceptable water quality plays a crucial role in minimizing energy consumption [13,24,25]. Direct membrane filtration of wastewater, such as pressure-driven, osmosis-driven, thermal-driven, and electrical-driven nanofiltration, have received a great deal of interest for their ability to reduce and control membrane fouling from wastewater, thus leading to high efficiency, in terms of permeate quality and commercial availability [1]. A previous work by Sharif et al., has developed a new theoretical model to estimate the specific energy consumption of the particular reverse osmosis process for desalting a NaCl solution by considering the membrane properties and operating parameters. It was found that the high-pressure pump is directly proportional to the volumetric flow rate and inversely proportional to the membrane flow rate factor [19]. On the other hand, Adda et al. have carried out work on the optimization and modeling of specific energy ranging from 2.17 to 2.27 kWh/m3 for the reverse osmosis process with pressure exchangers type energy recovery to produce desalinated water flux around 120,000 m3/j [20].
In the present paper, the Nanofiltration treatment was considered as a possible solution due to its many advantages, such as its ability to remove different molecules despite the variation in the composition of wastewater (with/or without Brilliant Blue FCF), its ease of operation, and its part in reducing the number of stages to minimize energy consumption. The novelty of this work is focused on the treatment of industrial wastewater and the description of design specifications and evaluation of the specific energy consumption, as well as to solve the problem related to the separation and the retention of particles or solutes, leading to the accumulation of material on the surface of the membrane, which leads to a decrease of the permeation flux depending on the variation of the operation conditions and the specific energy consumption. The optimum operating parameters were determined by assessing the residence time distribution (RTD) applied to the reactor flow regime. The key factors affecting the reduction of molecules and the variation of the permeate flow inside the reactor were assessed numerically via residence time distribution (RTD) curves. A reduction in specific energy consumption was also studied by varying the operating parameters, such as the pH of the wastewater, operating pressure, and the ratio of matric dilution.

2. Materials and Methods

2.1. Effluent

A pilot reactor was fed with industrial wastewater sampled from a wastewater treatment plant (WWTP) located to the north of Reghaia city, Algiers, Algeria. The WWTP was equipped with a biological process “activated sludge” system. Wastewater effluents arrived from different regions with 80,000 m3 of polluted water per day to be treated. After treatment, the water was returned to Reghaia Lake [5]. The samples were collected manually using a pole equipped with a bottle and taken between 8:30 a.m. and 11:00 a.m. Bottles containing the wastewater samples were transported under isothermal conditions at 4 °C. The experiments on wastewater treatment were conducted in the presence and absence of food coloring to test the efficiency of the system. The main characteristics of the effluents are presented in Table 1. The concentration of total dissolved solids (TDS) can reach 1204 mg/L and total nitrogen NT-exceeding discharge standards.

2.2. Chemicals

All chemicals used in this work were purchased at commercial grade. The Brilliant Blue FCF (C37H34N2Na2O9S3) came from “Fuital”, an Algerian commercial industrial company with a molecular weight of 792.85 g/mol. Antimony potassium tartrate (K2Sb2C8H4O12, 3H2O, Sigma-Aldrich), Barium sulfate (BaSO4, Sigma-Aldrich), Para nitro Salicylic acid (C7H6O3, Sigma-Aldrich), Phenol (C6H6O, Sigma-Aldrich), Potassium dichromate (K2Cr2O7, Sigma-Aldrich, Algeria), Potassium molybdate (K2MoO4, Sigma-Aldrich, Algeria), Mercury (II) sulfate (HgSO4, Sigma-Aldrich, Algeria), Silver sulfate (Ag2SO4, Biochem Chemopharma, Algeria), and Sulfanic acid (C6H7NO3S, Sigma-Aldrich, Algeria) were also purchased at commercial grade.

2.3. Nanofiltration Setup and Operations

Nanofiltration experiments (Figure 1) were carried out using a spiral wound polymeric membrane (Nanomax 50, Millipore, Burlington, MA, USA) system with tangential filtration. The organic membrane had an asymmetrical structure that was negatively charged and assembled into an active layer (skin) made of polybenzamide with a thickness of 0.4 µm, microporous polysulfone support of 40 μm thickness, and macroporous polyester support of 120 μm thickness. The characteristics of the membrane were the surface area of 0.37 m2; pure water permeability of 8.97 µm.s−1.Bar−1; a cut-off of 300 Dalton for uncharged solutes; a pore diameter of 1 nm; a pH of 2–10; maximum temperature of 40 °C; and operating pressureof 0–5 bar. All characteristics of the membrane were mentioned in Table 2. During the filtration, the experiments were performed in a reactor by introducing the solution of 5 L capacity under a studied flow rate by controlled pressure for 20 min and the recirculation of both permeate and retentate to retain a constant concentration (Figure 1). The temperature was maintained at 20 ± 0.5 °C [26,27].
The simulated wastewater samples were obtained by dissolving the target or model pollutant of Brilliant Blue FCF to an initial concentration of 40 mg/L and were taken at different time intervals by following the efficacy of elimination by the nanofiltration system. The reduction in COD, dye concentration, and variation in the flow rate of the permeate was studied based on a driven drove pressure-driven membrane process (0–5 bar), pH solution (3, 5, 7, and 10), and wastewater dilution ratio with drinking tap water (1/5, 2/5, 1/2, 3/5, and 4/5).

2.4. Analysis

The chemical oxygen demand (COD) was measured following the NF T 90-101 method, using an ECO thermoreactor that provides simple and easy programming of time (from 1 to 199 min or continuously) and temperature (from ambient to 200 °C). This method is applied for the digestion of the solution for a wide range of applications. The biological oxygen demand (BOD5) was measured directly by the NFT 90-103 method using an electronic manometer measured directly on the bottle containing the sample on scales of 90, 250, 600, 999, and 4000 ppm. The total dissolved solids (TDS) concentration was determined through a cellulosic filter (0.45 µm), according to the method of NFT 90-105. The nitrate concentration (NO3) was measured following the method of AFNOR (T90-012). The test in the presence of sodium salicylate gave a yellowish color, which allowed the colorimetrical measurement at a wavelength of 415 nm. The measurement of nitrite concentration (NO2) was performed using the method of AFNOR (T90-013) in a hydrochloric medium, which formed a yellow-colored complex that absorbs at the wavelength of 435 nm. The sulfate concentration (SO42−) was determined by nephelometry, according to the AFNOR method (T90-040). The technique was based on the reaction of sulfate ions in the presence of barium chloride in hydrochloric acid that forms a barium sulfate precipitate, which was stabilized with a steadying agent to be absorbed in a wavelength of 650 nm. The concentration of orthophosphates (PO43−) was determined by a colorimetric process according to the ISO method (6878) by forming a complex with ammonium molybdate and tartrate of antimony and potassium in an acid medium. Measurement with a spectrophotometer was performed at a wavelength of 880 nm. All analysis was performed in duplicate and absorbance was recorded using a UV-Shimadzu 1800 spectrophotometer (spectra ranged from 190 to 1100 nm). The HI88703-02 EPA Compliant Benchtop Turbidity Meter utilized 0.00 to 4000 NTU (Nephelometric Turbidity Units). The HI2300 conductivity meter with a built-in temperature sensor operates over a wide range from 0.00 μS/cm to 500.0 mS/cm, and pH was measured using Hanna Instruments™ HI2211-02.

3. Results and Discussion

3.1. The Study of the Residence Time Distribution

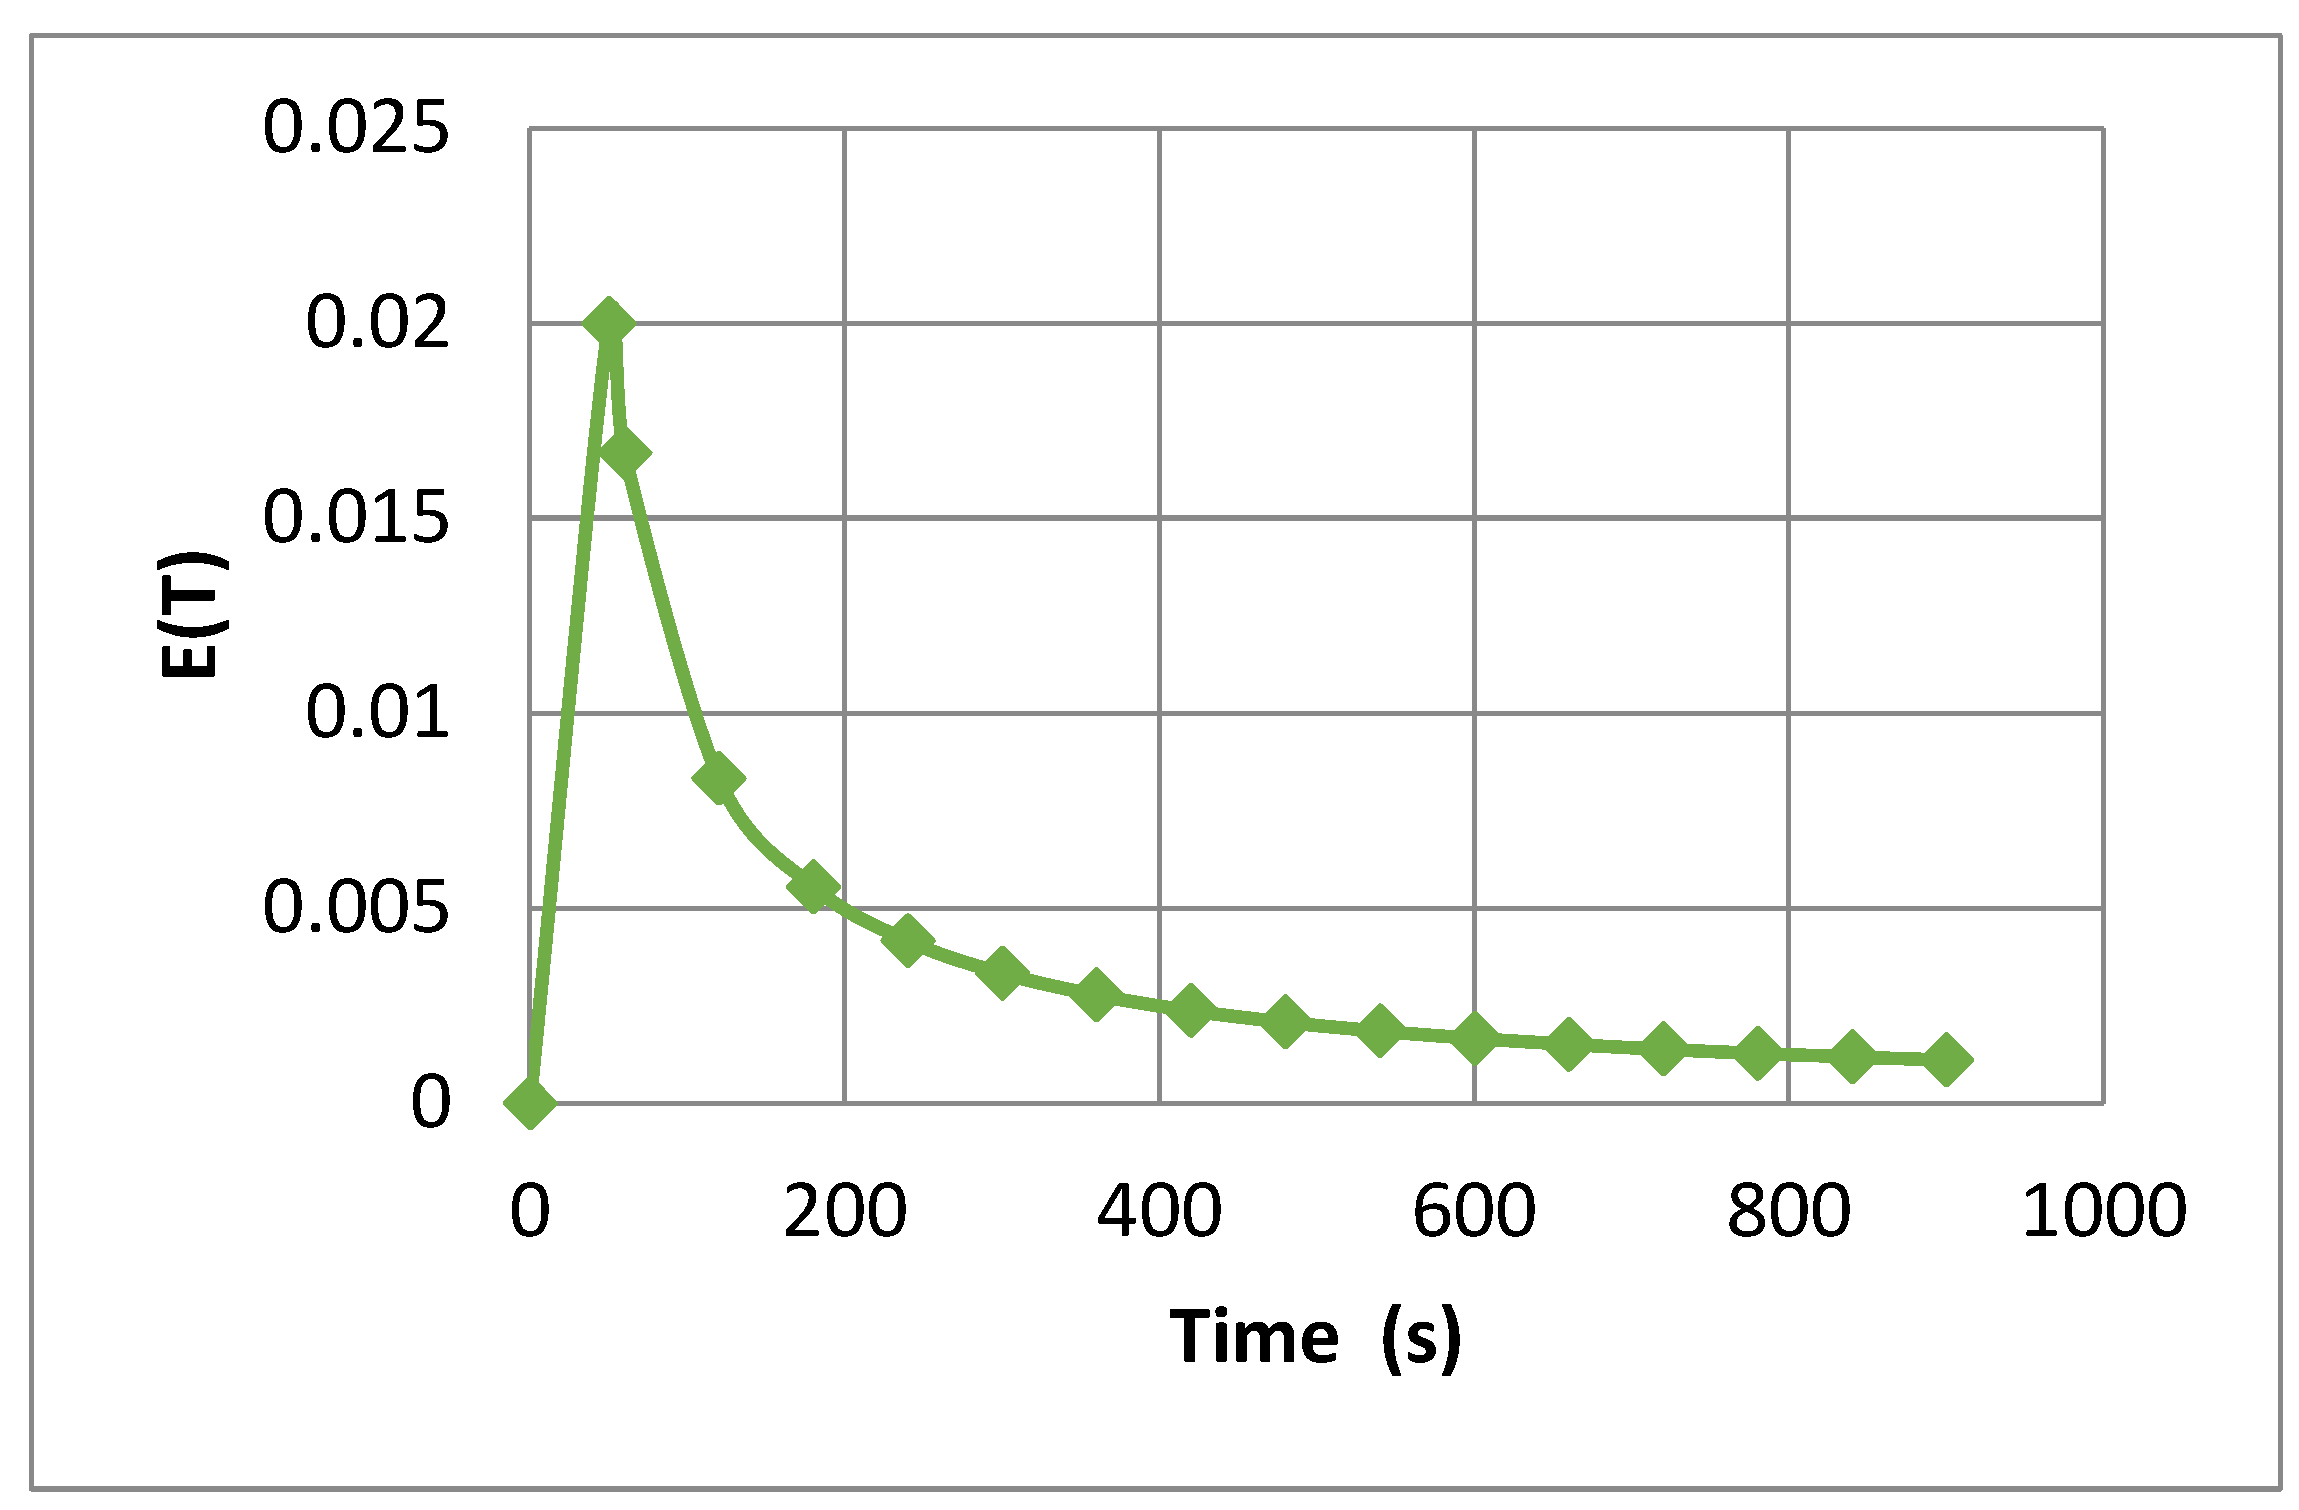
The residence time distribution (RTD) was carried out to assess the probability distribution in a reactor regardless of its design specifications, such as the reactor type, design, and flow characteristics. The hydrodynamic study was evaluated by following the temporal concentration of the tracer impulse KCl (0.05 M) to identify the flow inside a continuous reactor and to observe the response at the exit of the reactor. The probability density function of the residence times E(t) for selected flow rate shown in Figure 2 was expressed as follows (Equations (1) and (2)):
0 E ( t ) dt = 1
E ( t ) = c i 0 c i dt
where Ci corresponds to a tracer concentration at the exit time and the denominator 0 C i dt represents the area under the C(t) curve.
The measured RTD observed (Figure 2, Table 3) for operating conditions: Qa = 2.28 L/min and Vr = 5 L suggested that it was an intermediate reactor type between a perfectly mixed and a plug flow with two distinct parts, displayed in an initial sharp peak followed by a long tail [23].
The mean residence time tm was the first moment of the distribution indicative of the average transient time of processing material defined by Equation (3) [28]:
t m = 0 tE ( t ) dt
The residence time describes the average residence time in a reactor as the ratio of reactor volume to the volumetric flow rate (Equation (4)) [29]:
τ = V r Q
The variance of the residence time (σ2) and the dimensionless variance (σ2D) are given by Equations (5) and (6), and the results are summarized in Table 2:
σ 2 = 0 ( t t m ) 2 E ( t ) dt
σ D 2 = ( σ 2 t m ) 2
The integral of Equations (2), (3) and (5) were determined numerically by using the Simpson method [30]. These equations were adopted to describe the flow of fluids within the reactor. In addition, a normalized time θ was introduced according to (Equation (7)) in terms of size and space time.
θ = t t m
It can be observed in Table 2 that an increase in treatment time resulted in an increase of θ and a lower mean residence time tm. This outcome is explained by the higher mean velocity in the reactor under such conditions. In addition, the values of the RTD dimensionless variance (σ2D) used to verify and a measure of the dispersion with a higher value of residence time (σ2) and the dimensionless variance (σ2D) indicated a higher dispersion with the flow approaching a perfect mix [17]. Additionally, the comparison between the average transient time tm and the residence time shown in Table 2 suggests the existence of a short circuit.

3.2. Electrical Energy Consumption

The performance of nanofiltration (NF) membranes with different levels of water permeability and rejection was determined by their potential to separate pollutants from contaminated water. The required energy consumption needed to be optimized for low-water production costs [31]. Several studies measured specific energy consumption defined as the energy needed to produce one cubic meter to permeate with increasing membrane water permeability and neither concentration polarization nor pressure loss [20,31,32,33]. In NF membranes, the selection of the high-pressure pump is important for evaluating the specific energy consumption. The work of the high-pressure pump occurs between 0–5 bar and the expression is in the following forms (Equations (8) and (9)):
E NF = W pump 0 36 . 6 η Q p = PQ A 36 . 6 η Q p
W pump 0 = PQ A
Similarly, water permeate flux Jw and permeate rate of flow Qp through a membrane can be expressed by Equations (10) and (11):
J W = v At
Q P = 10 - 3 L p A ( Δ p Δ π )
where Jw is the permeate flux (m/s), Lp is the permeability of the membrane solvent in (m.Pa−1.s−1), V is the volume of permeated water (m3), A is the effective membrane area (m2), and t is the permeate collection time (s).
Optimal conditions were found to remove a wide range of pollutants with high treatment efficiency. The result demonstrates that the maximum water permeate flux led to a higher power consumption caused by the compression of a higher feed flow rate [32]. As shown in Figure 3, once the permeation flux reached between 3.35 × 10⁻⁶–2.55 × 10⁻⁵ m/s, it was noticed that an increase in specific energy consumption and the optimal treatment condition was found for a permeate flux of 4.07 × 10⁻⁵ m/s and specific energy consumption of 1.94 kWh/m3. This could be explained by an inverse relationship between energy consumption and the permeate flow to produce permeate. We found that after 15 min of treatment, a reduction of COD was about 48.35% and 63.58% for raw wastewater and doped wastewater, respectively.

3.3. Parametric Study

3.3.1. Effect of pH

Nanofiltration (NF) has been increasingly employed to remove colors, soluble monovalent, and divalent ions in wastewater [34,35]. For this purpose, the current investigation utilized two matrices or effluents: raw wastewater and raw wastewater doped with the BBF dye. The influence of the water composition on the efficiency of the treatment by the membrane processes NF is observed by following the reduction of both the COD and the color.
The influence of pH on the surface charge had a direct effect on the performance of the membrane due to changes in poor structure, the rejection of uncharged organic, and the quality of the permeate [36]. Additionally, the difference between membrane chemical structures, separation targets, and membrane properties reported in the literature must be considered. The high retention of dye could be due to lower molecular weights than values of the molecular weight cut-off of the membrane [37].
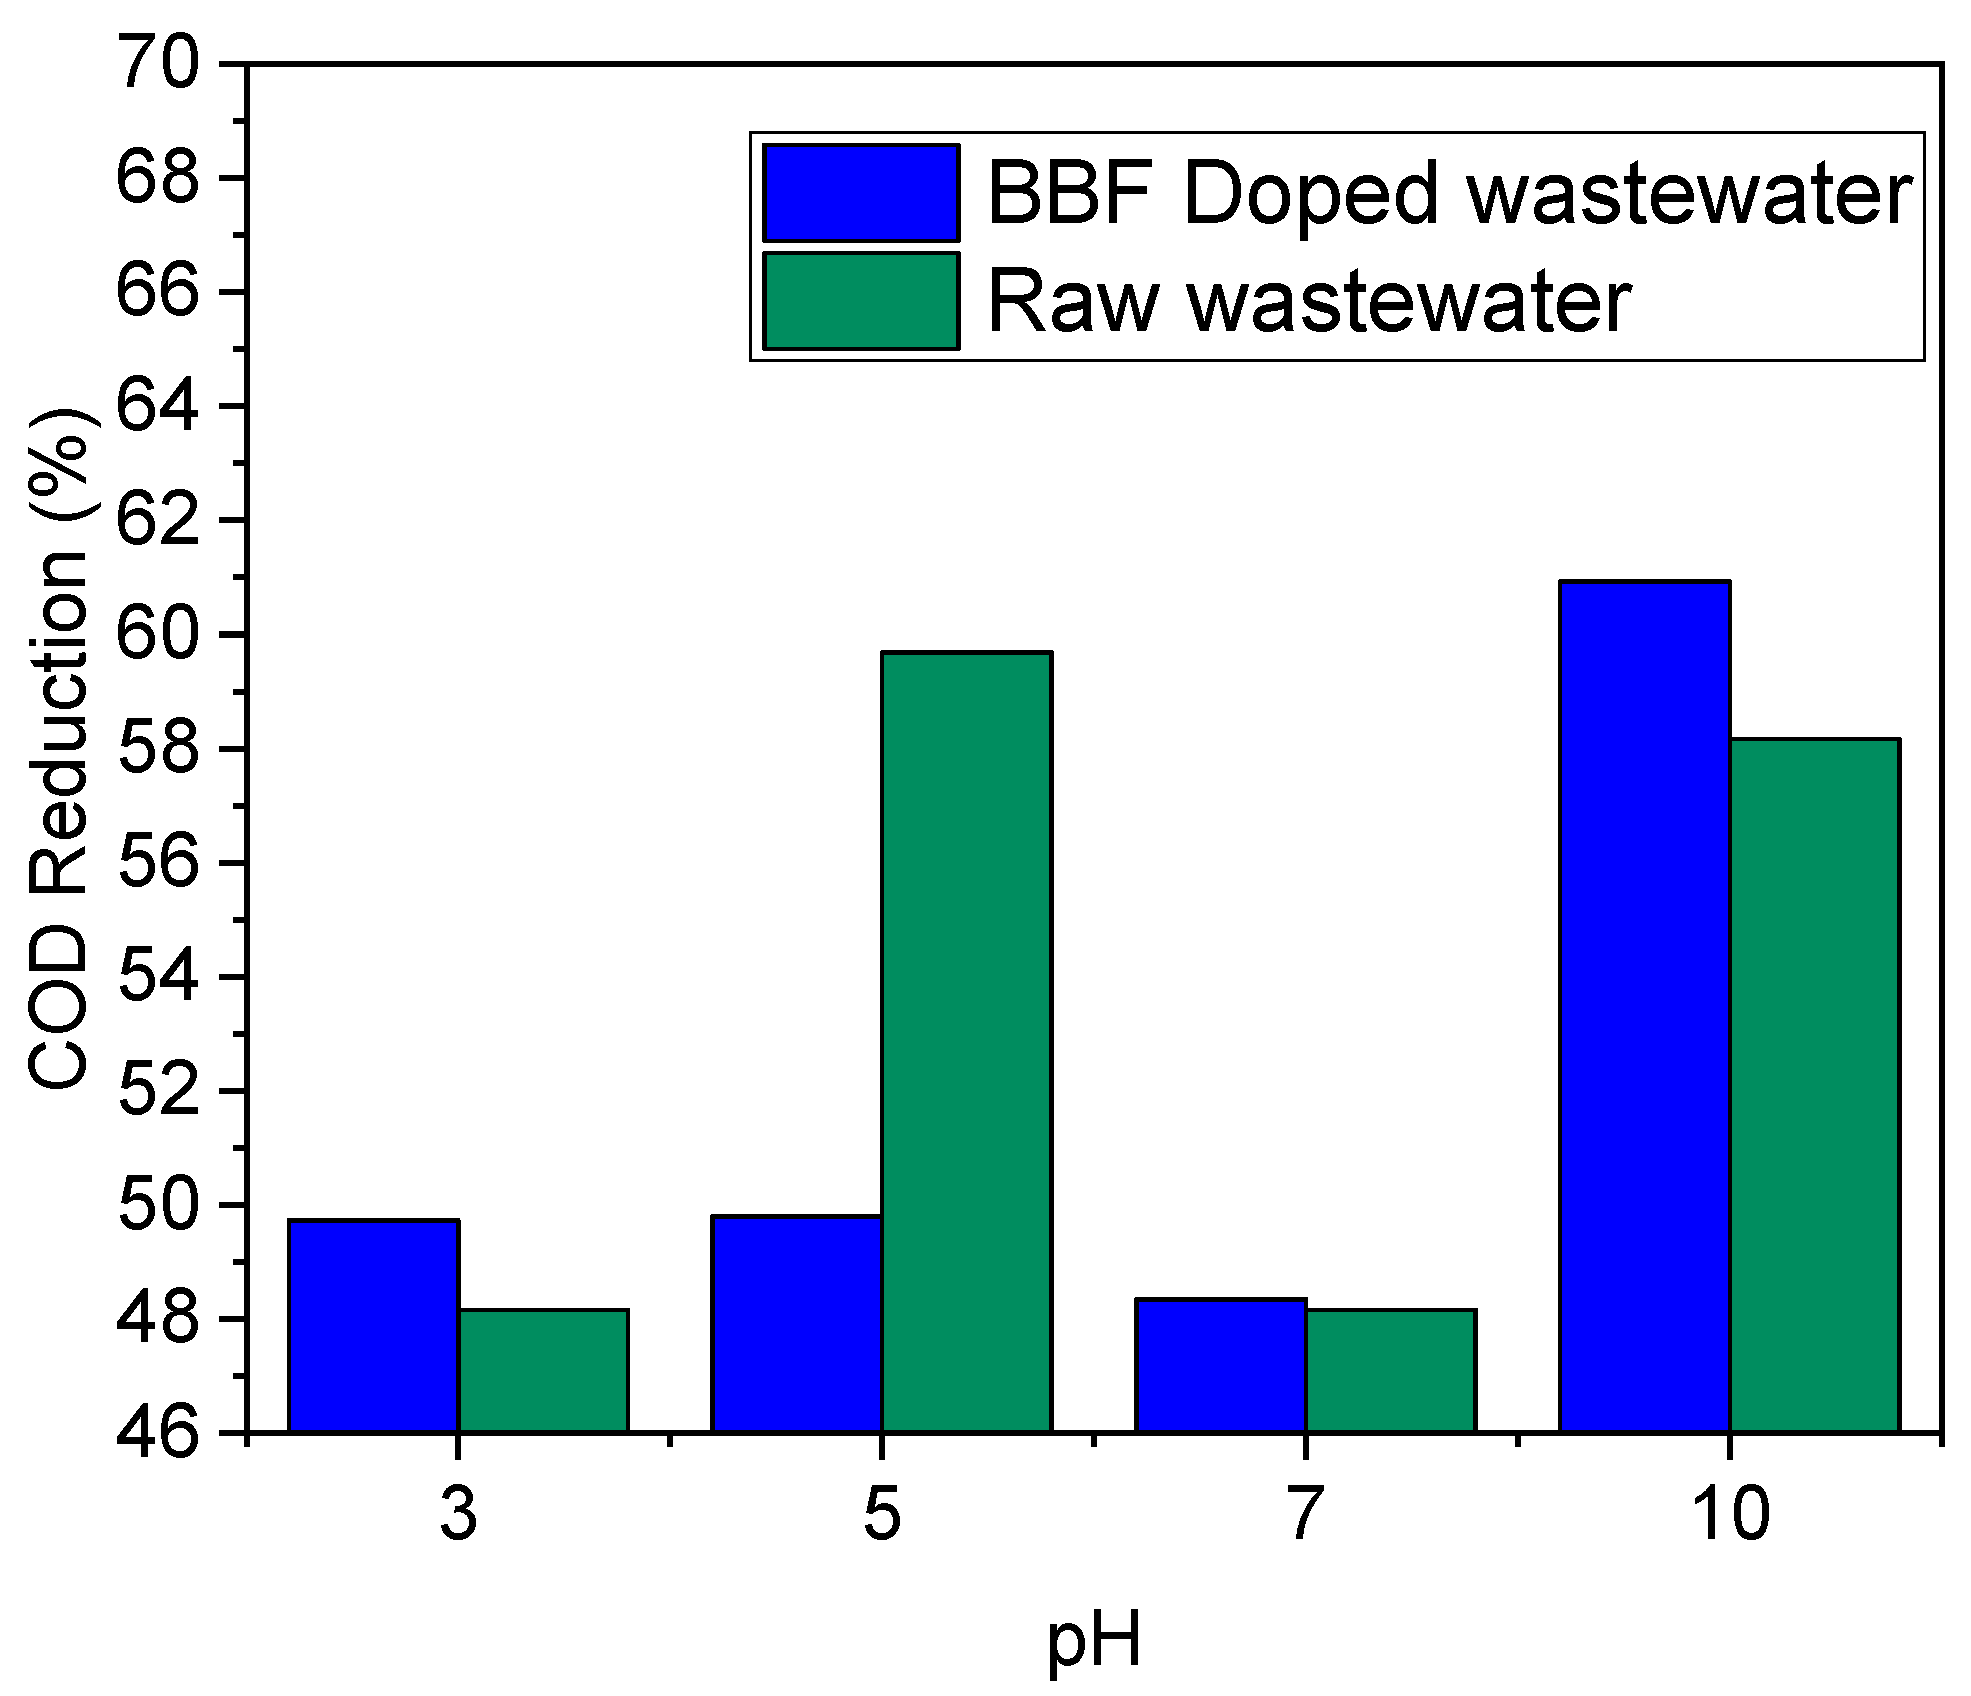
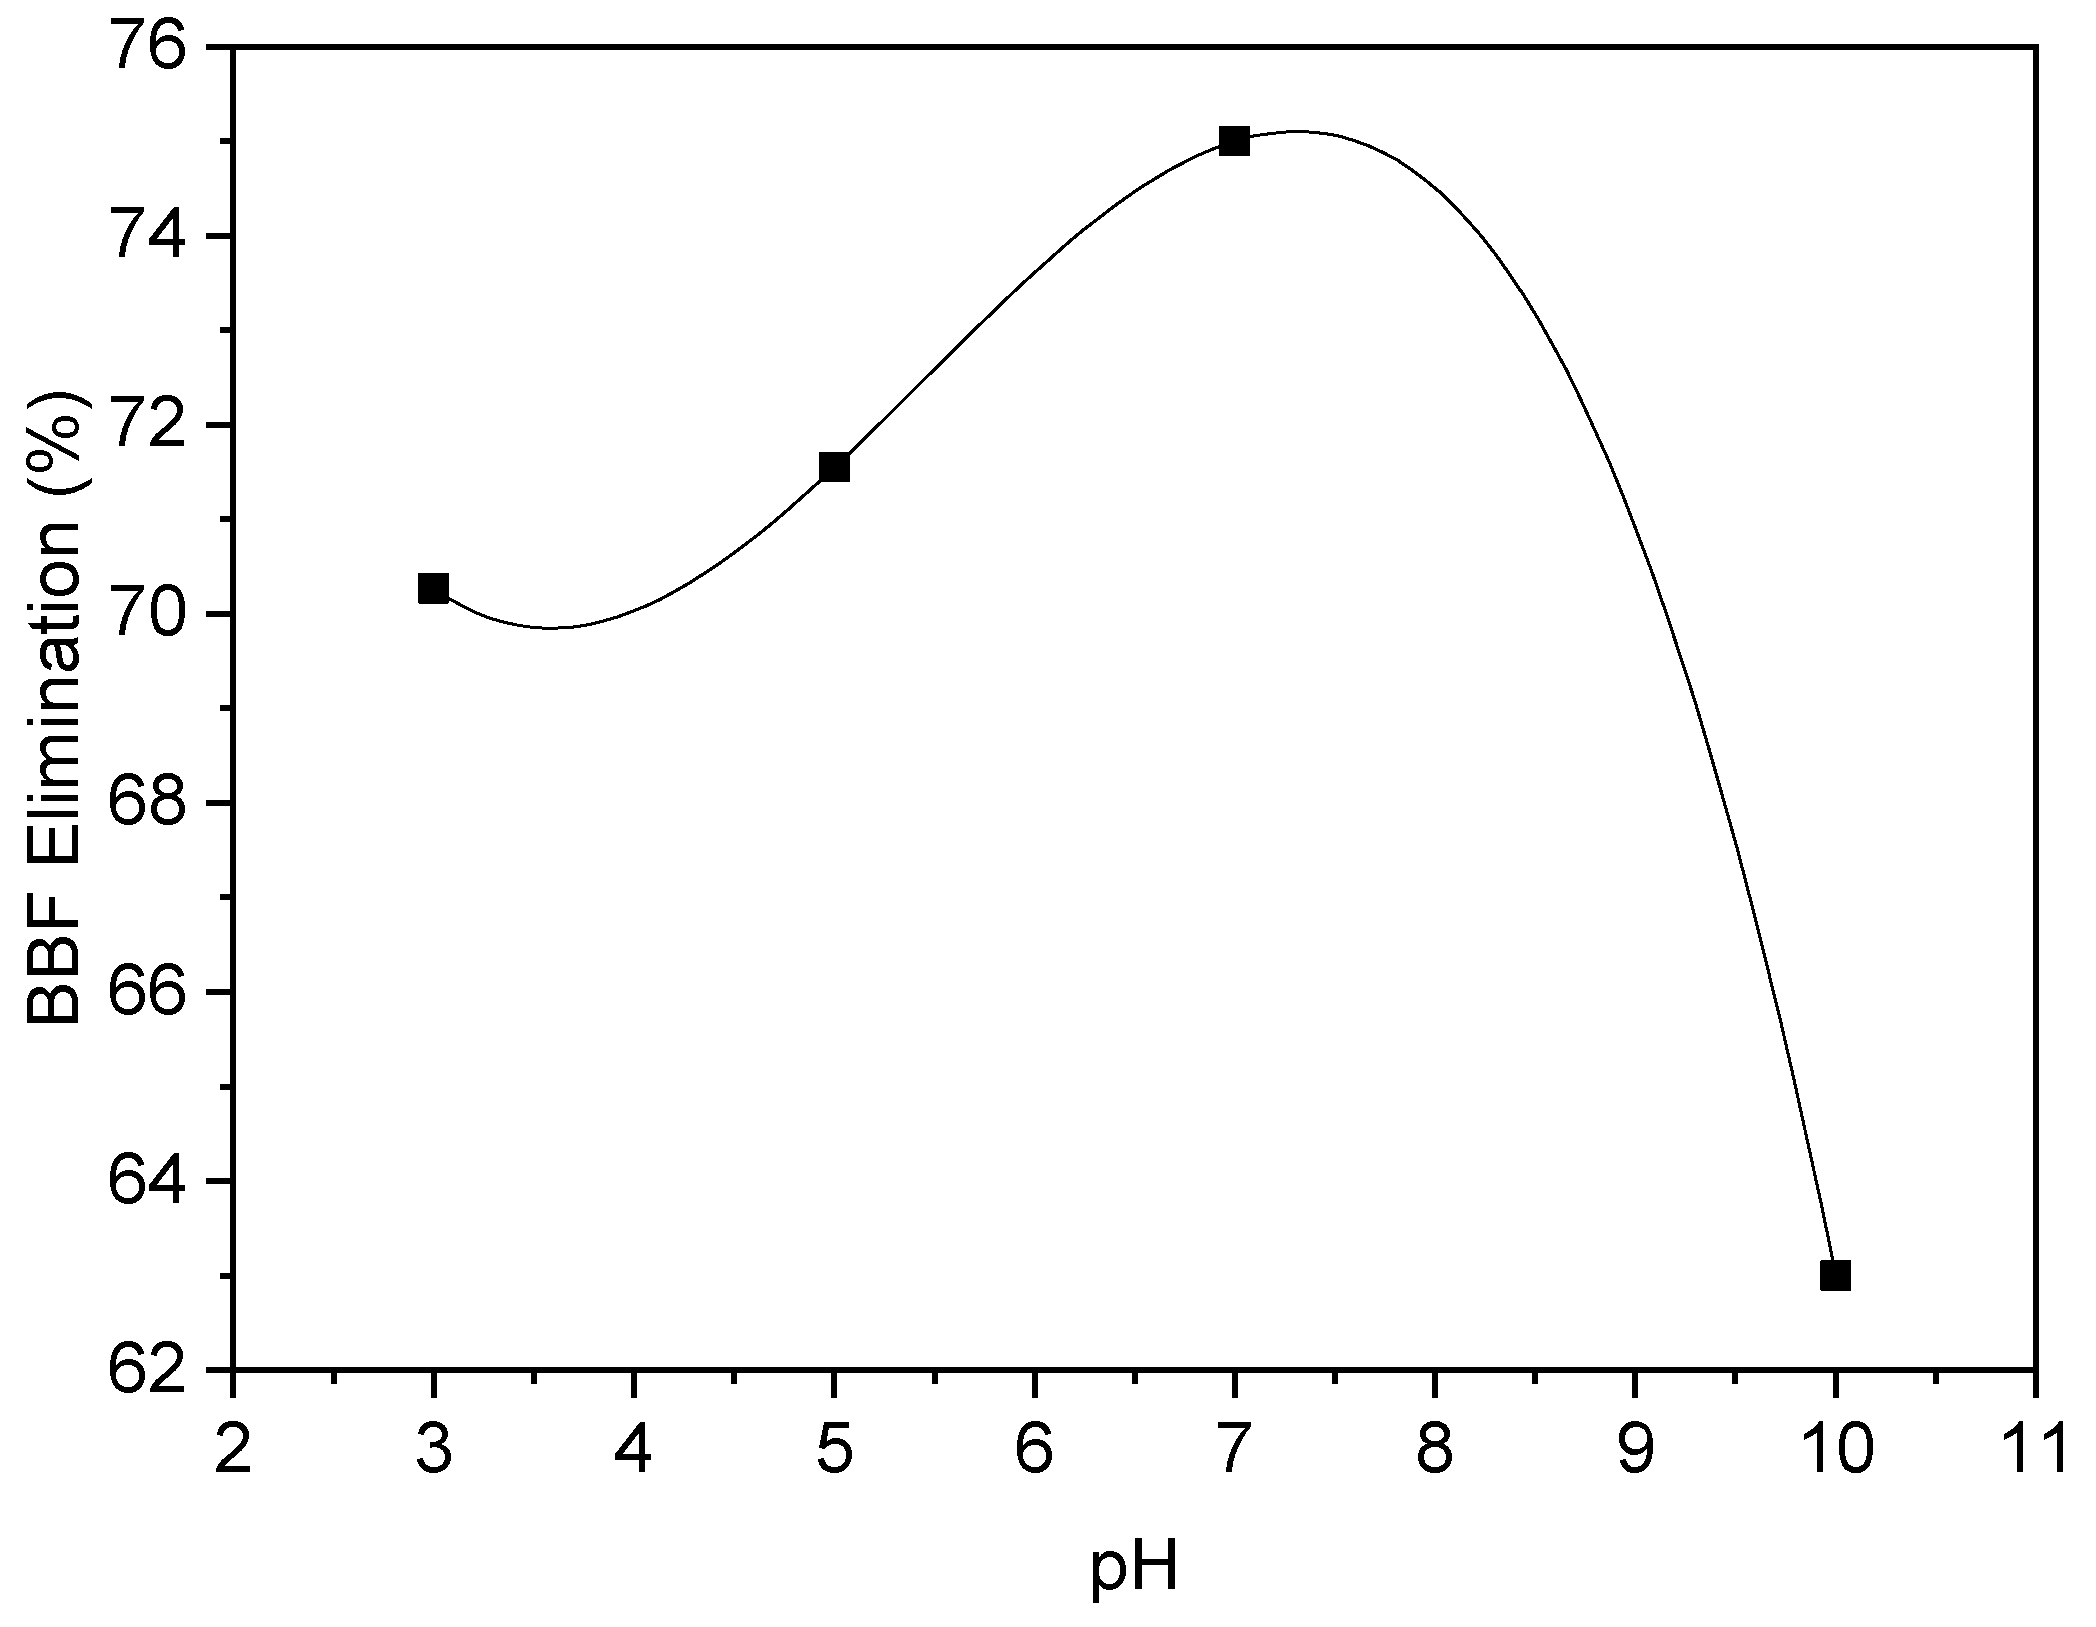
The filtration was performed at pH values of 3, 5, 7, and 10 and the retention of pollutants and BBF dye was assessed. Figure 4 and Figure 5 represent the reductions in COD and color. Retention during the filtration of the permeate matrix for solutes dissolved in wastewater was greater than those obtained with the same dye-doped wastewater matrix. Their elimination at a neutral pH would therefore allow for higher retention. Moreover, this study highlighted the importance of quantifying retention in the presence of complex real matrices. Electrostatic attractions between negatively charged organic matter at a neutral pH and pollutants could then contribute to forming complexes that were better retained by the membrane [38]. Furthermore, the difference observed between the two treatment matrices can be explained by the complexity of the interactions between a solute and the membrane surface and thus the difficulty in predicting the retention of a given compound, which was due to the impact of the hydrophobicity and the molar mass of the solute [36,39].
The filtration results confirmed that the NF membrane showed better COD removal at pH values of 10 and 5. Basic pH can lead to an increase in the absolute value of the effective charge density of the membrane and the Donnan effect leads to the tilting of the ions in retentate or to permeate according to their charge [40]. This increase leads to an increase in the electro-viscosity coefficient and a decrease in the permeability of the solution. As a result, the permeate flux decreased with increasing pH and thus displayed better removal. While at pH 5, which was close to the isoelectric pH of the membrane, it affects the retention of molecules because the formed anions repulse and dielectrically exclude the hydrophilic character of the particles, which are additionally rejected by size and the structure of the membrane [41,42]. Additionally, we noticed that, according to the results found in Figure 5, the removal of the dye decreases at a low value of pH and basic media, which is due to the reduction in repulsive force and the elimination was optimum at pH equal to 7, because the exclusion mechanism and space prevention became more significant due to concentration polarization [40].

3.3.2. Effect of Pressure

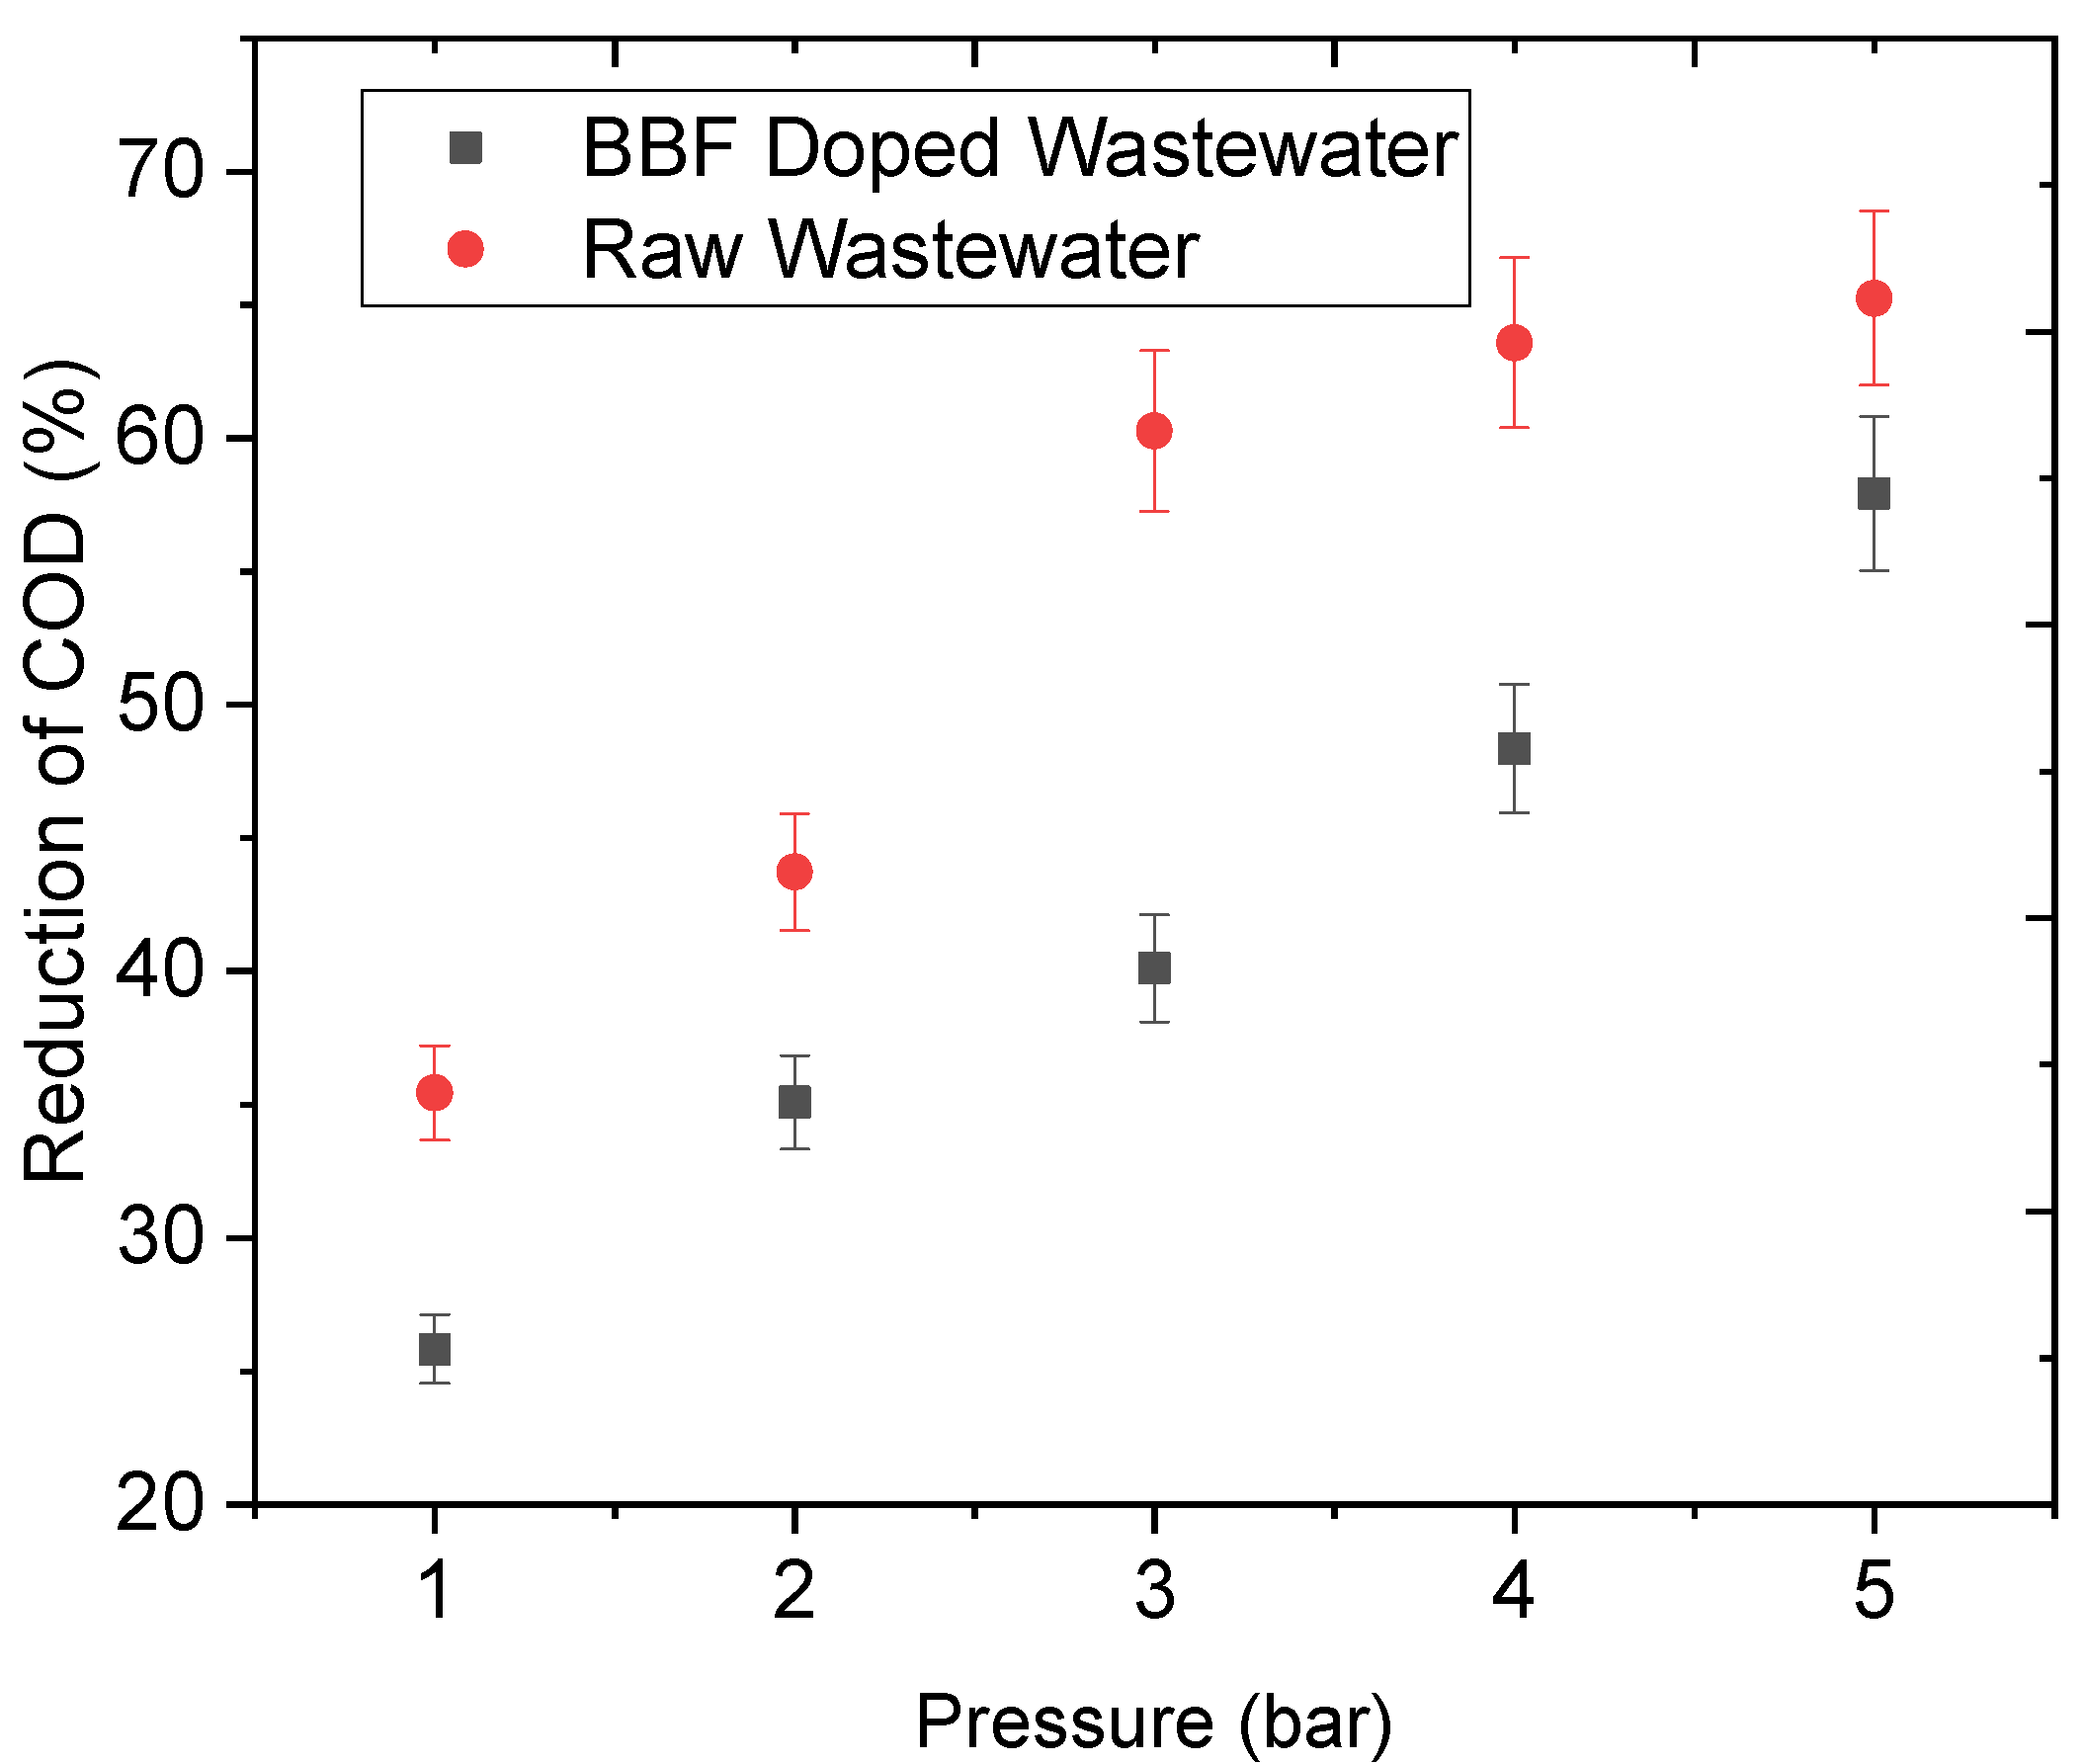
The main driving force in a membrane based on liquid-phase separations is operating pressure, which is directly proportional to the wastewater treatment cost and higher flux rates [43,44,45]. For that reason, we focused on the effect of pressure was investigated by varying from 1 to 5 bars. The COD and color removal rates in industrial waters are shown in the Figure 6 and Figure 7. The results were similar to those obtained in the case of doped wastewater, showing that the retention increased with the transmembrane pressure. The COD reduction was 48.35% and 63.58% for domestic wastewater and doped wastewater, respectively.
Moreover, it was noticed that the removal of color increased with an increase of transmembrane pressure of 5 bar to 84.05% but take into consideration the increase of the specific energy with the increase of the pressure. The treatment of industrial wastewater could be done by optimizing the specific energy consumption and to apply the pressure of 4 bar and permeate flux of 407.03 × 10⁻⁷ m/s. These results confirm that transmembrane flux is a function of the effective pressure results from the combination of different mechanisms, such as size exclusion, diffusion, and Donnan exclusion, and is in agreement with the hypothesis that the transport of components through the membrane is achieved through three mechanisms: diffusion, electrical migration, and convection [43]. At low pressures, transport is strongly affected by the diffusion mechanism, at least for weakly and moderately retained pollutants due to a reduced driving force rather than an increase in the resistance to mass transfer leading to concentration polarization, gel formation, and internal pores fouling [27,46]. Therefore, pollutants will be weakly or moderately retained at low transmembrane pressure. Once the applied pressure increases, the contribution of electromigration and convection to transport becomes dominant over diffusion and, therefore, retention will improve [47]. This is corresponding to the greater initial permeate fluxes observed under higher concentrate flow rates, attributable to lower concentration polarization and internal pores fouling resistance at higher tangential flow velocities [48].

3.3.3. Effect of Matric Dilution

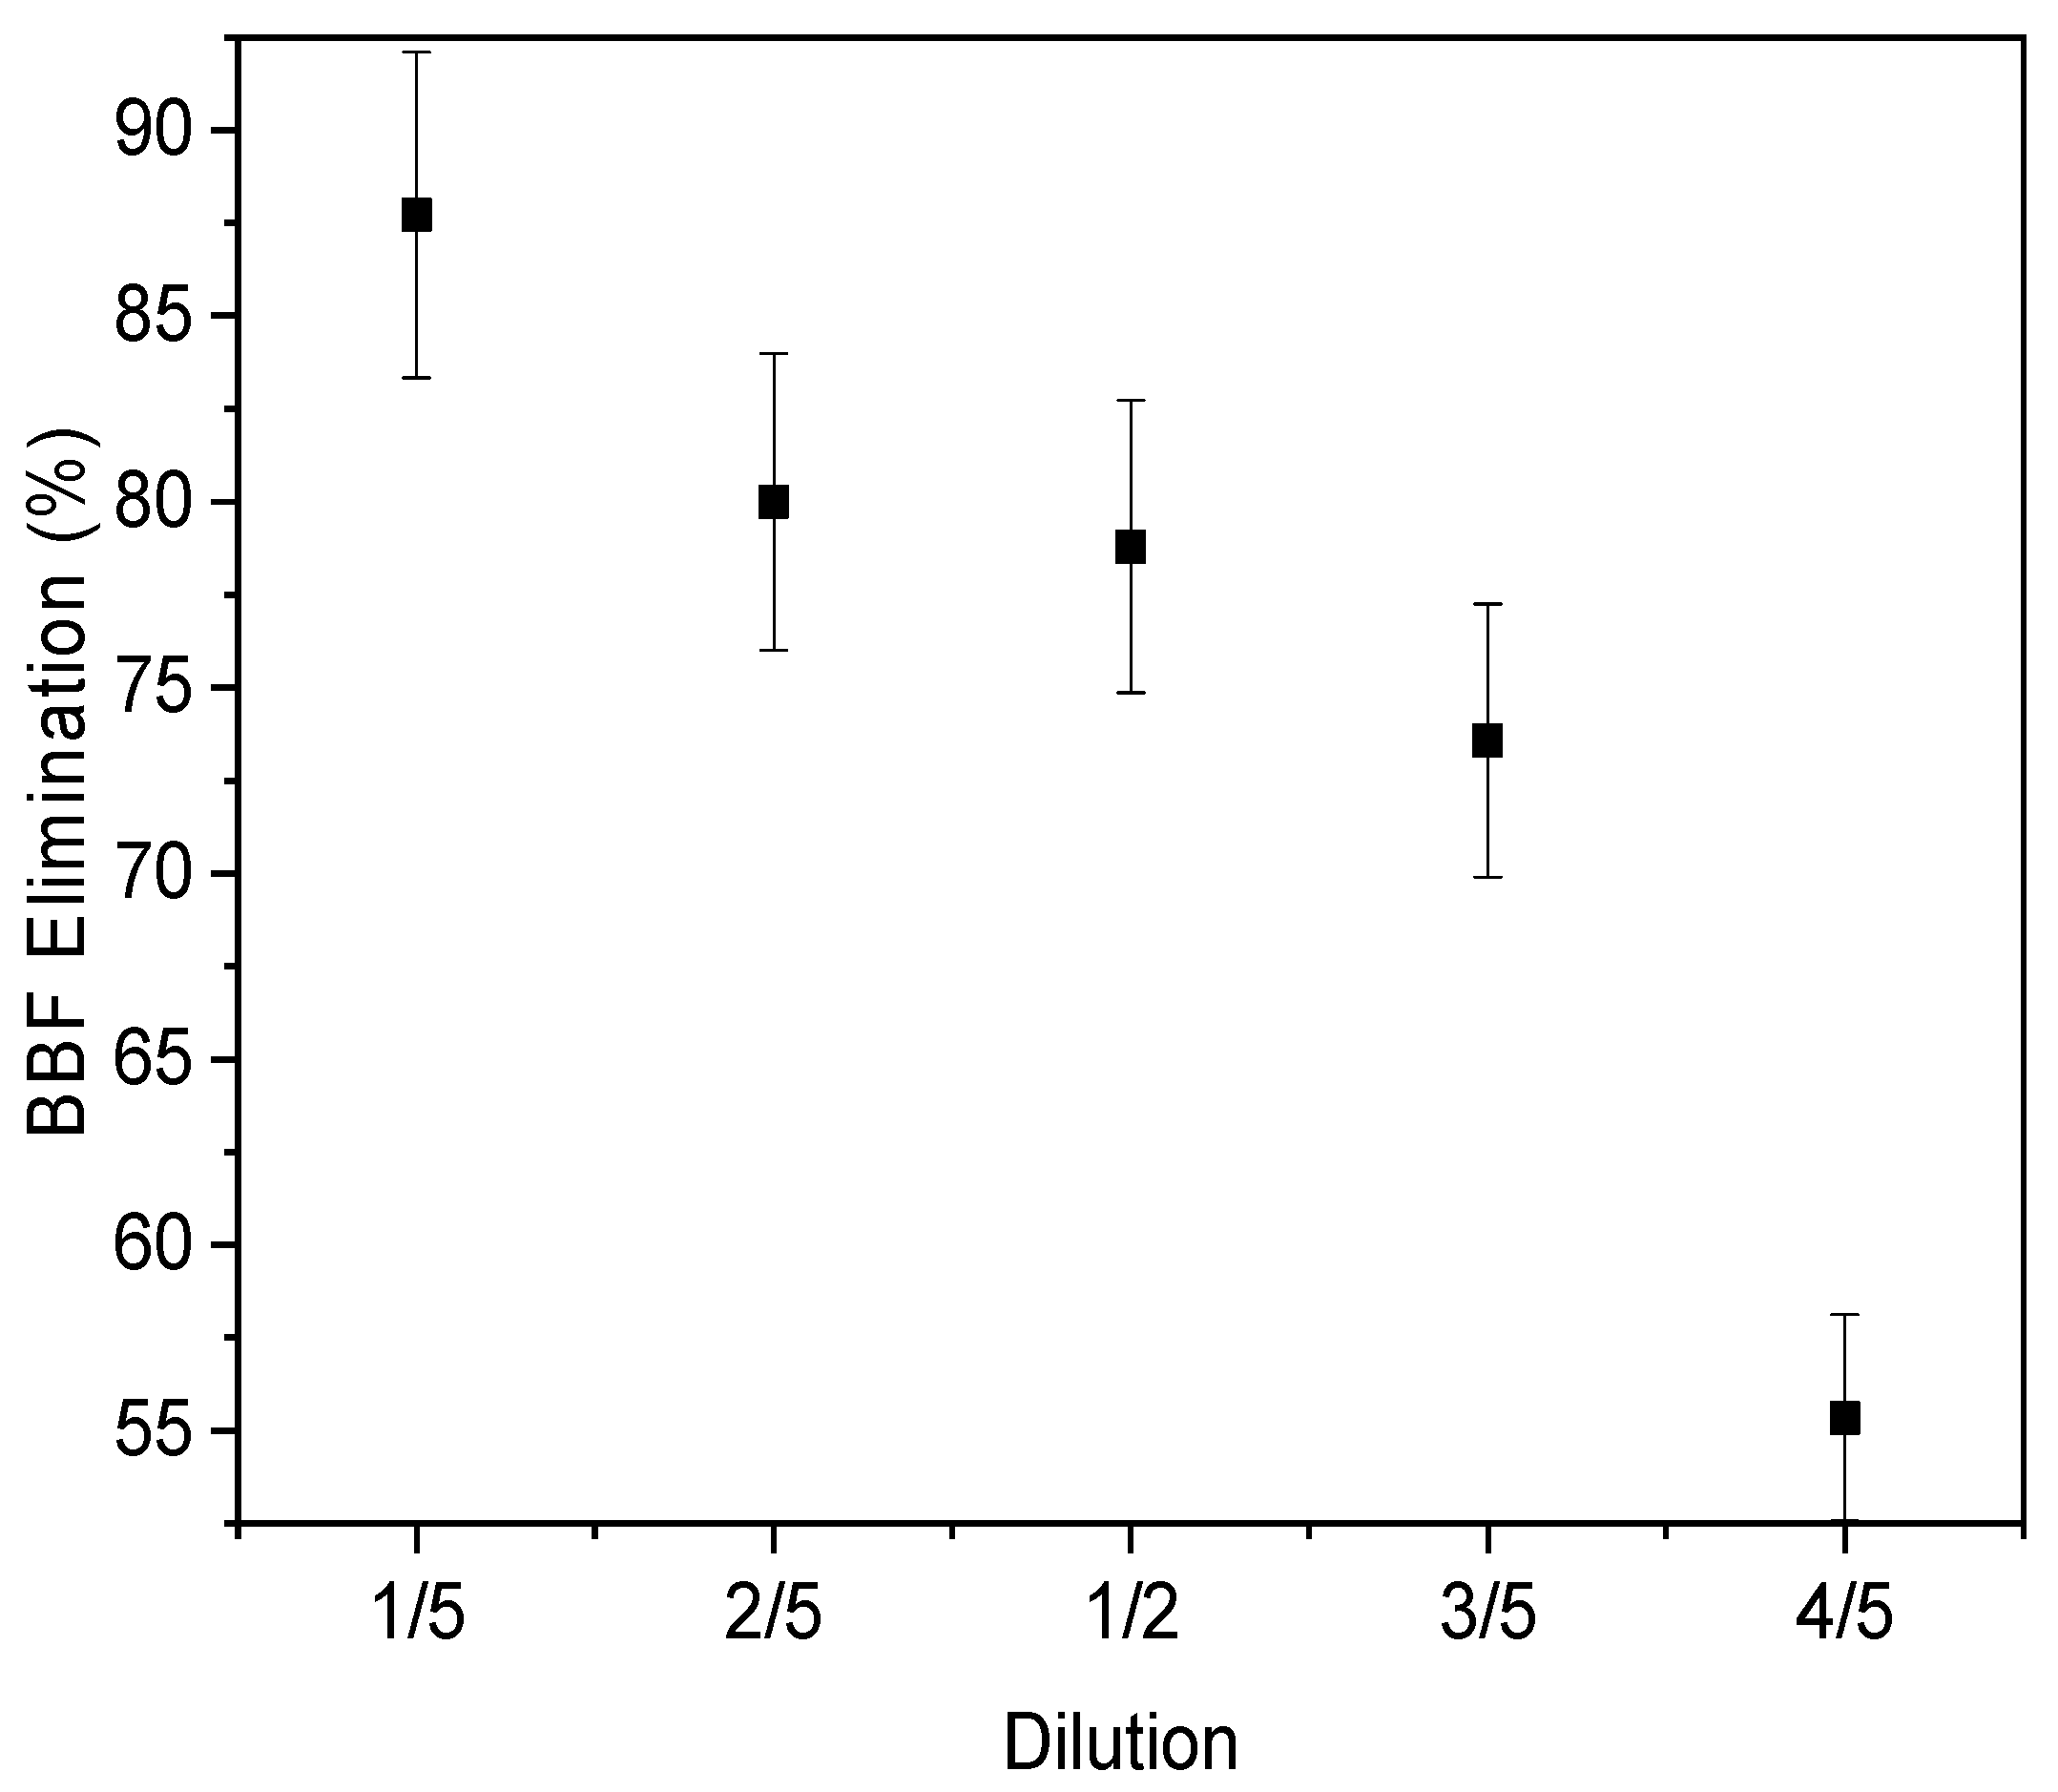
The quantity of water produced for the reused neither domestic nor agricultural purposes by NF membranes treatment combined and used after pretreatment, primary, and secondary treatment is high, but when NF membranes are used alone for recovering industrial wastewater the fouling, it poses a serious problem, thereby decreasing the quality of the product compared with other processes [43,49]. For that, we are interested to test the influence of water matric dilution on nanofiltration performance with various dilution factors (i.e., 1/5, 2/5, 1/2, 3/5, and 4/5) to reduce the number of stages, the time of treatment, and thus the cost. The tests were conducted at an operating pressure of 5 bar with a variable pH, depending on the composition of the wastewater (pH raw wastewater = 5, pH BBF doped wastewater = 7). Figure 8 and Figure 9 show the influence of dilution on the retention rate of COD and color reduction. It was noted that the retention increased with time and with a decrease in the dilution ratio of the wastewater and an increase in the added volume of tap water. This behavior was due to the presence of solutes and the increase of concentration of the ions and dye at high dilution ratios and the accumulation of the solute at the membrane surface led to a decrease in the water flux and rejections. Indeed, according to studies, the presence of solutes made the membrane surface more compact due to pore contraction by the increase of the solution viscosity, along with the rise in the concentration polarization onto the membrane surface, which led to an increase in the membrane resistance for a decrease in permeability and thus a decrease in permeate flux [50,51].
Similarly, when the dilution ratio was 1/2, the retention rate was 87.2% after 15 min of filtration of the non-doped wastewater, whereas for lower dilutions of about 4/5, the retention rate decreased slightly to 64% for the same water matric. With doped wastewater, it can be seen that the COD reduction followed the same kinetics but with a lower yield. This result was attributed to the retention of suspended matter in terms of turbidity. The progressive decrease of the reduction rate over time may have been due to the clogging of the membrane pores [34].

4. Conclusions

The nanofiltration treatment was used as a single process to demonstrate the importance of optimizing operating conditions and to emphasize the importance of the properties of the membrane, which are in a polyamide polysulfone of negative surface charge, making the study more significant in a real situation.
The use of nanofiltration could be effectively employed to treat wastewater based on the parameters, such as the pH, the effect of pressure and the dilution ratio, which has an influence on the size of the particles, their charge, the pH of the medium, and the concentration. The results show that both the pH of the solution and the composition of the water could change both the charges of the ions and affect the charge on the membrane and consequently decrease the selectivity. Additionally, there was a reduction in COD removal efficiency to 57.92% and 65.25% with an increase in pressure to 5 bar in raw wastewater and doped wastewater, respectively. On the other hand, the increase in operating pressure positively influenced the membrane treatment performance through increasing the permeate flow but the specific energy consumption was increased.
The results show that the optimum conditions to have good quality treated water with a reduced amount of energy consumption were a permeate flux of 4.07 × 10⁻⁵ m/s and specific energy consumption of 1.94 kWh/m3. Moreover, decreasing the wastewater dilution ratio and adjusting the pH of the solution to the basic medium can enhance COD reduction to 60.93% in raw wastewater, optimize BBF elimination of 75% at pH equal to 7, and solve the problem of the complex composition of the industrial rejects received by the WWTP of Reghaia, which have become very harmful to the environment.
The residence time distribution (RTD) can lead to enhanced energy consumption in terms of dispersion, flow approaches, and velocities in the reactor. This information can be utilized numerically in a model to better describe the relationship between the product at various operating conditions and the characteristics of the RTD.
This study demonstrated the use of nanofiltration for industrial wastewater treatment provides the maximum reduction of the COD of 87.2% for undoped wastewater at a volume dilution ratio of 1/2 after 15 min. The evolution in this study is more comprehensive through the consideration of the modeling of specific energy consumption with the variation of permeate flux in the membrane process. For that, the researchers must provide the maximum amount of information on the evolution and the optimization of the processes for acceptable water security and the minimum electrical energy.

Author Contributions

R.Y.: Investigation, Methodology, Writing—original draft, Funding acquisition; N.S.: Resources, Funding acquisition; A.B.: Review and Editing, Funding acquisition; H.D.: Formal analysis, Review and Editing, Funding acquisition; N.F.: Visualization, Funding acquisition; M.T.A.: Conceptualization, Methodology, Resources, Supervision, Review and Editing. All authors have read and agreed to the published version of the manuscript.

Funding

This research received no external funding.

Institutional Review Board Statement

Not applicable.

Informed Consent Statement

Not applicable.

Data Availability Statement

Not applicable.

Acknowledgments

This research is provided by University of Science and Technology Houari Boumediene, Algiers, Algeria (2021). The authors thank the laboratory team of “water, energy and environment” from the National Engineering School of Sfax, Tunisia, and Padmanaban V. Chellam from Kamaraj College of Engineering Technology, India, for their valuable comments and for proofreading the manuscript. The authors also thank M. Goosen from Alfaisal University of Riyadh, Saudi Arabia, and M.-A. Hairan from Unilasalle-EME Rennes, France, for the correction of the English language.

Conflicts of Interest

The authors declare that they have no known competing financial interest or personal relationships that could have appeared to influence the work reported in this paper.

Nomenclature

AEffective membrane area
CiTracer concentration
ENFSpecific energy consumption
E(t)Probability density function of the residence times
JwWater permeate flux
LpPermeability of the membrane
PPump power
QAAlimentation flow
QpPermeate flow
tPermeate collection time
tmMean residence time
VVolume of permeated water
VrReactor volume
W pump 0 Work of the hight pressure pump
∆pTransmembrane pressure
∆πOsmotic pressure
ηPump efficiency
θNormalized time
σ2Variance of the residence time
σ2DDimensions variance
τResidence time

References

  1. Hube, S.; Eskafi, M.; Hrafnkelsdóttir, K.F.; Bjarnadóttir, B.; Bjarnadóttir, M.; Axelsdóttir, S.; Wu, B. Direct membrane filtration for wastewater treatment and resource recovery: A review. Sci. Total Environ. 2019, 710, 136375. [Google Scholar] [CrossRef]
  2. Ilia, M. Impact of the Precoagulation Performance of the Ultrafiltration Process in the Tertiary Treatment for Recycling of Urban Sewage. Curr. Environ. Manag. 2020, 6, 188–195. [Google Scholar] [CrossRef]
  3. Ahmed, M.T.; Chaabane, T.; Maachi, R.; Darchen, A. Efficiency of a Pretreatment by Electrocoagulation with Aluminum Electrodes in a Nanofiltration Treatment of Polluted Water. Procedia Eng. 2012, 33, 465–474. [Google Scholar] [CrossRef]
  4. Ahriz, S.; Nedjraoui, D.; Sadki, N. The impact of industrial pollution on the ecosystem of Réghaia Lake (Algeria). Desalination Water Treat. 2010, 24, 1–6. [Google Scholar] [CrossRef]
  5. Bouchelouche, D.; Saal, I.; Arab, A. Study of the impact of metal and organic pollution on benthic macrofauna using multivariate analyses in coastal wetland of Reghaïa, Algeria. Environ. Sci. Pollut. Res. 2021, 28, 46816–46826. [Google Scholar] [CrossRef]
  6. Liu, Z.; Lei, M.; Chen, G.; Yuan, J. Treatment of Chromium Removal Wastewater from Tanning by a New Coupling Technology. Processes 2022, 10, 1134. [Google Scholar] [CrossRef]
  7. Fernández-Medrano, V.; Cuartas-Uribe, B.; Bes-Piá, M.-A.; Mendoza-Roca, J.-A. Application of Nanofiltration and Reverse Osmosis Membranes for Tannery Wastewater Reuse. Water 2022, 14, 2035. [Google Scholar] [CrossRef]
  8. Altowayti, W.A.H.; Shahir, S.; Othman, N.; Eisa, T.A.E.; Yafooz, W.M.S.; Al-Dhaqm, A.; Soon, C.Y.; Yahya, I.B.; Rahim, N.A.N.B.C.; Abaker, M.; et al. The Role of Conventional Methods and Artificial Intelligence in the Wastewater Treatment: A Comprehensive Review. Processes 2022, 10, 1832. [Google Scholar] [CrossRef]
  9. Boutilier, L.; Jamieson, R.; Gordon, R.; Lake, C.; Hart, W. Adsorption, sedimentation, and inactivation of E. coli within wastewater treatment wetlands. Water Res. 2009, 43, 4370–4380. [Google Scholar] [CrossRef]
  10. Marszałek, J.; Żyłła, R. Recovery of Water from Textile Dyeing Using Membrane Filtration Processes. Processes 2021, 9, 1833. [Google Scholar] [CrossRef]
  11. Yin, X.; Zhang, Z.; Ma, H.; Venkateswaran, S.; Hsiao, B.S. Ultra-fine electrospun nanofibrous membranes for multicomponent wastewater treatment: Filtration and adsorption. Sep. Purif. Technol. 2020, 242, 116794. [Google Scholar] [CrossRef]
  12. Nelabhotla, A.; Savva, I.; Jensen, J.T.; Wang, S. High Salinity Wastewater Treatment Study Using an Automated Pilot Combining Anaerobic and Aerobic Biofilm Processes. Processes 2022, 10, 766. [Google Scholar] [CrossRef]
  13. Drioli, E.; Romano, M. Progress and New Perspectives on Integrated Membrane Operations for Sustainable Industrial Growth. Ind. Eng. Chem. Res. 2001, 40, 1277–1300. [Google Scholar] [CrossRef]
  14. Li, P.; Yang, C.; Sun, F.; Li, X.-Y. Fabrication of conductive ceramic membranes for electrically assisted fouling control during membrane filtration for wastewater treatment. Chemosphere 2021, 280, 130794. [Google Scholar] [CrossRef]
  15. Shi, Y.-T.; Meng, X.; Yao, L.; Tian, M. A full-scale study of nanofiltration: Separation and recovery of NaCl and Na2SO4 from coal chemical industry wastewater. Desalination 2021, 517, 115239. [Google Scholar] [CrossRef]
  16. Ivić, I.; Kopjar, M.; Jakobek, L.; Jukić, V.; Korbar, S.; Marić, B.; Mesić, J.; Pichler, A. Influence of Processing Parameters on Phenolic Compounds and Color of Cabernet Sauvignon Red Wine Concentrates Obtained by Reverse Osmosis and Nanofiltration. Processes 2021, 9, 89. [Google Scholar] [CrossRef]
  17. Sharif, A.; Merdaw, A.; Al-Bahadili, H.; Al-Taee, A.; Al-Aibi, S.; Rahal, Z.; Derwish, G. A new theoretical approach to estimate the specific energy consumption of reverse osmosis and other pressure-driven liquid-phase membrane processes. Desalination Water Treat. 2009, 3, 111–119. [Google Scholar] [CrossRef] [Green Version]
  18. Adda, A.; Naceur, W.M.; Abbas, M. Modélisation et optimisation de la consommation d’énergie d’une station de dessalement par procédé d’osmose inverse en Algérie. Rev. Energ. Renouvelables 2016, 19, 157–164. [Google Scholar] [CrossRef]
  19. Ejraei, A.; Aroon, M.A.; Saravani, A.Z. Wastewater treatment using a hybrid system combining adsorption, photocatalytic degradation and membrane filtration processes. J. Water Process Eng. 2019, 28, 45–53. [Google Scholar] [CrossRef]
  20. El Bahja, H.; Vega, P.; Tadeo, F. Integrating Dynamic Economic Optimization and Nonlinear Closed-Loop GPC: Application to a WWTP. Processes 2022, 10, 1821. [Google Scholar] [CrossRef]
  21. Grzechulska-Damszel, J.; Mozia, S.; Morawski, A.W. Integration of photocatalysis with membrane processes for purification of water contaminated with organic dyes. Catal. Today 2010, 156, 295–300. [Google Scholar] [CrossRef]
  22. Ganzenko, O.; Sistat, P.; Trellu, C.; Bonniol, V.; Rivallin, M.; Cretin, M. Reactive electrochemical membrane for the elimination of carbamazepine in secondary effluent from wastewater treatment plant. Chem. Eng. J. 2021, 419, 129467. [Google Scholar] [CrossRef]
  23. Waqas, S.; Harun, N.Y.; Bilad, M.R.; Samsuri, T.; Nordin, N.A.H.; Shamsuddin, N.; Nandiyanto, A.B.D.; Huda, N.; Roslan, J. Response Surface Methodology for Optimization of Rotating Biological Contactor Combined with External Membrane Filtration for Wastewater Treatment. Membranes 2022, 12, 271. [Google Scholar] [CrossRef] [PubMed]
  24. Giwa, A.; Jung, S.M.; Kong, J.; Hasan, S.W. Combined process of electrically-membrane bioreactor and TiO2 aerogel filtration for efficient wastewater treatment. J. Water Process Eng. 2019, 28, 107–114. [Google Scholar] [CrossRef]
  25. Razali, M.; Kim, J.F.; Attfield, M.; Budd, P.M.; Drioli, E.; Lee, Y.M.; Szekely, G. Sustainable wastewater treatment and recycling in membrane manufacturing. Green Chem. 2015, 17, 5196–5205. [Google Scholar] [CrossRef] [Green Version]
  26. Taleb-Ahmed, M.; Taha, S.; Maachi, R.; Dorange, G. The influence of physico-chemistry on the retention of chromium ions during nanofiltration. Desalination 2002, 145, 103–108. [Google Scholar] [CrossRef]
  27. Djahida, Z.; Amel, B.; Mourad, T.A.; Hayet, D.; Rachida, M. Treatment of a dye solophenyle 4GE by coupling electrocoagulation/nanofiltration. Membr. Water Treat. 2014, 5, 251–263. [Google Scholar] [CrossRef]
  28. Ounnar, A.; Bouzaza, A.; Favier, L.; Bentahar, F. Macrolide antibiotics removal using a circulating TiO2-coated paper photoreactor: Parametric study and hydrodynamic flow characterization. Water Sci. Technol. 2016, 73, 2627–2637. [Google Scholar] [CrossRef]
  29. Lali, F. A hydrodynamic study of cylindrical metal foam packings: Residence time distribution and two phase pressure drop. Chem. Eng. Process. Process Intensif. 2017, 115, 1–10. [Google Scholar] [CrossRef]
  30. Teng, J.; Shen, L.; He, Y.; Liao, B.-Q.; Wu, G.; Lin, H. Novel insights into membrane fouling in a membrane bioreactor: Elucidating interfacial interactions with real membrane surface. Chemosphere 2018, 210, 769–778. [Google Scholar] [CrossRef]
  31. Okamoto, Y.; Lienhard, J.H. How RO membrane permeability and other performance factors affect process cost and energy use: A review. Desalination 2019, 470, 114064. [Google Scholar] [CrossRef]
  32. Meriläinen, A.; Seppälä, A.; Kauranen, P. Minimizing specific energy consumption of oxygen enrichment in polymeric hollow fiber membrane modules. Appl. Energy 2012, 94, 285–294. [Google Scholar] [CrossRef]
  33. Hafiz, M.; Hawari, A.; Alfahel, R.; Hassan, M.; Altaee, A. Comparison of Nanofiltration with Reverse Osmosis in Reclaiming Tertiary Treated Municipal Wastewater for Irrigation Purposes. Membranes 2021, 11, 32. [Google Scholar] [CrossRef] [PubMed]
  34. Hakami, M.W.; Alkhudhiri, A.; Al-Batty, S.; Zacharof, M.-P.; Maddy, J.; Hilal, N. Ceramic Microfiltration Membranes in Wastewater Treatment: Filtration Behavior, Fouling and Prevention. Membranes 2020, 10, 248. [Google Scholar] [CrossRef] [PubMed]
  35. Mulyanti, R.; Susanto, H. Wastewater treatment by nanofiltration membranes. IOP Conf. Ser. Earth Environ. Sci. 2018, 142, 012017. [Google Scholar] [CrossRef]
  36. Bellona, C.; Drewes, J.E.; Xu, P.; Amy, G. Factors affecting the rejection of organic solutes during NF/RO treatment—A literature review. Water Res. 2004, 38, 2795–2809. [Google Scholar] [CrossRef]
  37. Zhang, X. Selective separation membranes for fractionating organics and salts for industrial wastewater treatment: Design strategies and process assessment. J. Membr. Sci. 2021, 643, 120052. [Google Scholar] [CrossRef]
  38. Ringkjøb, H.-K.; Haugan, P.M.; Solbrekke, I.M. A review of modelling tools for energy and electricity systems with large shares of variable renewables. Renew. Sustain. Energy Rev. 2018, 96, 440–459. [Google Scholar] [CrossRef]
  39. Bolong, N.; Ismail, A.F.; Salim, M.R.; Matsuura, T. A review of the effects of emerging contaminants in wastewater and options for their removal. Desalination 2009, 239, 229–246. [Google Scholar] [CrossRef]
  40. Dreier, L.B.; Nagata, Y.; Lutz, H.; Gonella, G.; Hunger, J.; Backus, E.H.; Bonn, M. Saturation of charge-induced water alignment at model membrane surfaces. Sci. Adv. 2018, 4, eaap7415. [Google Scholar] [CrossRef]
  41. Yaroshchuk, A.; Bruening, M.L.; Zholkovskiy, E. Modelling nanofiltration of electrolyte solutions. Adv. Colloid Interface Sci. 2019, 268, 39–63. [Google Scholar] [CrossRef] [PubMed]
  42. Meschke, K.; Daus, B.; Haseneder, R.; Repke, J.-U. Strategic elements from leaching solutions by nanofiltration—Influence of pH on separation performance. Sep. Purif. Technol. 2017, 184, 264–274. [Google Scholar] [CrossRef]
  43. Kaya, C.; Jarma, Y.A.; Guler, E.; Kabay, N.; Arda, M.; Yükse, M. Seawater Desalination by using Nanofiltration (NF) and Brackish Water Reverse Osmosis (BWRO) Membranes in Sequential Mode of Operation. J. Membr. Sci. Res. 2020, 6, 40–46. [Google Scholar] [CrossRef]
  44. Shon, H.K.; Phuntsho, S.; Chaudhary, D.S.; Vigneswaran, S.; Cho, J. Nanofiltration for water and wastewater treatment—A mini review. Drink. Water Eng. Sci. 2013, 6, 47–53. [Google Scholar] [CrossRef] [Green Version]
  45. AL Mashrafi, S.; Diaz-Elsayed, N.; Benjamin, J.; Arias, M.E.; Zhang, Q. An environmental and economic sustainability assessment of a pressure retarded osmosis system. Desalination 2022, 537, 115869. [Google Scholar] [CrossRef]
  46. Tang, C.Y.; Chong, T.; Fane, A.G. Colloidal interactions and fouling of NF and RO membranes: A review. Adv. Colloid Interface Sci. 2011, 164, 126–143. [Google Scholar] [CrossRef]
  47. Damtie, M.M.; Woo, Y.C.; Kim, B.; Hailemariam, R.H.; Park, K.-D.; Shon, H.K.; Park, C.; Choi, J.-S. Removal of fluoride in membrane-based water and wastewater treatment technologies: Performance review. J. Environ. Manag. 2019, 251, 109524. [Google Scholar] [CrossRef]
  48. Tu, S.; Ravindran, V.; Pirbazari, M. A pore diffusion transport model for forecasting the performance of membrane processes. J. Membr. Sci. 2005, 265, 29–50. [Google Scholar] [CrossRef]
  49. Ng, M.; Dalhatou, S.; Wilson, J.; Kamdem, B.P.; Temitope, M.B.; Paumo, H.K.; Djelal, H.; Assadi, A.A.; Nguyen-Tri, P.; Kane, A. Characterization of Slaughterhouse Wastewater and Development of Treatment Techniques: A Review. Processes 2022, 10, 1300. [Google Scholar] [CrossRef]
  50. Larrañaga, A.; Lomora, M.; Sarasua, J.; Palivan, C.; Pandit, A. Polymer capsules as micro-/nanoreactors for therapeutic applications: Current strategies to control membrane permeability. Prog. Mater. Sci. 2017, 90, 325–357. [Google Scholar] [CrossRef]
  51. Abdelhamid, A.E.; El-Sayed, A.A.; Khalil, A.M. Polysulfone nanofiltration membranes enriched with functionalized graphene oxide for dye removal from wastewater. J. Polym. Eng. 2020, 40, 833–841. [Google Scholar] [CrossRef]
Figure 1. Schematic of the spiral wound polymeric membrane (Nanomax 50, Millipore USA) system with tangential filtration.
Processes 10 02277 g001
Figure 2. Residence time distribution (RTD) curve in nanofiltration process.
Processes 10 02277 g002
Figure 3. Variation of specific energy consumption as a function of the permeate flux.
Processes 10 02277 g003
Figure 4. Evaluation of the effect of pH on the COD reduction rate of industrial discharges: ΔP = 4 bar; [COD]wastewater = 180 mg of O2/L; [BBF] = 40 mg/L; [COD]doped wastewater = 220 mg of O2/L; Turbiditywastewater = 20 FNU; TurbidityBBF doped wastewater = 28 FNU; and treatment time = 15 min.
Processes 10 02277 g004
Figure 5. Evaluation of the effect of pH on dye removal in industrial discharge: ΔP = 4 bar; [BBF] = 40 mg/L; [COD]doped wastewater = 220 mg O2/L; Turbiditydoped wastewater = 28 FNU; and treatment time = 15 min.
Processes 10 02277 g005
Figure 6. Evaluation of the effect of pressure on COD reduction in industrial discharges: pHwastewater = 5; pHBBF doped wastewater = 7; [COD]wastewater = 205 mg O2/L; [BBF] = 40 mg/L; [COD]doped wastewater = 245 mg O2/L; Turbiditywastewater = 28 FNU; TurbidityBBF doped wastewater = 33 FNU; treatment time = 15 min.
Processes 10 02277 g006
Figure 7. Evaluation of the effect of pressure on dye removal in industrial wastewater: pHwastewater = 5; pHBBF doped wastewater = 7; [COD]wastewater = 205 mg O2/L; [BBF] = 40 mg/L; [COD]doped wastewater = 245 mg O2/L; Turbiditywastewater = 28 FNU; TurbidityBBF doped wastewater = 33 FNU; treatment time = 15 min.
Processes 10 02277 g007
Figure 8. Evaluation of the effect of wastewater dilution on dye removal: wastewater pH = 5; doped wastewater pH = 7; ΔP = 5 bar; treatment time = 15 min.
Processes 10 02277 g008
Figure 9. Evaluation of the effect of wastewater matric dilution on COD reduction: wastewater pH = 5; doped wastewater pH = 7; ΔP = 5 bars; treatment time = 15 min.
Processes 10 02277 g009
Table 1. Characteristics of industrial wastewater sampled in November 2020 and used for nanofiltration treatment.
Wastewater Raw WastewaterMixed Wastewater with BBFDischarge Standards
(WHO)
Parameters
T (°C)2222˂30 °C
Turbidity (FNU)91.795.25 NTU
pH7.277.066.5-8.5
Conductivity (mS/cm)1.711.70-
TDS (mg/L)205210˂20 mg/L
COD (mg O2/L)620660˂90 mg O2/L
BOD5 (mg O2/L)218209˂30 mg O2/L
COD/BOD52.843.16˂3
NO3 (mg/L)0.580.66˂1 mg/L
NO2(mg/L)2.262.201 mg/L
SO4 (mg/L)0.310.30-
PO4 (mg/L)12.2912.19-
Absorbance at 254 nm1.0921.106-
T: Temperature, TDS: Total dissolved solids, COD: Chemical oxygen demand, BOD5: Biological oxygen demand, NO3: Nitrate ion concentration, NO2: Nitrite ion concentration, SO4: Sulfate ion concentration, PO4: Phosphate ion concentration, and UV254: the absorbance of organic matters in wastewater.
Table 2. Characteristics of the membrane used in this study.
Membrane NameNanomax-50
Membrane materialpolysulfon
Molecular weight cutoff300 Da
pH operating range2–10
Maximum temperature40 °C
Maximum pressure5 bar
Water permeability8.97 µm/s bar
Table 3. Results of residence time distribution of Nanofiltration reactor.
t (min)θtm (min)τ (min−1)σ2σ2D
10.4658211.162.131.35 × 10+164.12 × 10+27
52.3292
104.6564
156.9876
Publisher’s Note: MDPI stays neutral with regard to jurisdictional claims in published maps and institutional affiliations.