Article

Optimization Design of an Alfalfa Seed Airflow Collection and Drainage System Based on Numerical Simulation

1
College of Agricultural Engineering and Food Science, Shandong University of Technology, Zibo 255000, China
2
College of Engineering, China Agricultural University, Beijing 471033, China
*
Author to whom correspondence should be addressed.
Processes 2022, 10(11), 2281; https://doi.org/10.3390/pr10112281
Submission received: 27 September 2022 / Revised: 1 November 2022 / Accepted: 2 November 2022 / Published: 3 November 2022

Abstract

:
In order to improve the working performance of an Alfalfa air conveyor, a type of horizontal screw conveyor with a seed stirring function was designed. The working process of the horizontal screw conveyor was co-simulated by EDEM software and ADAMS software. The effects of a seed stirring mechanism on population movement characteristics, population stress, the seed mass flow rate and the variation coefficient of each index were obtained. The results showed that the stirring mechanism can effectively improve the mobility of the population, reduce the local dead zone of the population, and increase the material filling coefficient between the spiral blades. Under the same working conditions, the horizontal screw conveyor with a stirring mechanism has a higher conveying efficiency and better conveying uniformity. In order to optimize the structure parameters of the Venturi injector diffuser and improve seeding efficiency and uniformity, EDEM software and Fluent software were used to co-simulate the seeding process. The influence of diffuser structure parameters on the working performance of the Venturi injector was analyzed by taking the changes in pressure and velocity in the inner flow field of the pipeline and the velocity and force of seed particles as indices. The results showed that when the diffusion angle is 5°, the length of the diffusion section is 200 mm and the length of the mixing section is 50 mm, the pressure loss of the Venturi ejector is the smallest, the outlet air velocity is the largest, the uniformity of seed feeding is the best and the seed feeding efficiency is the highest. Taking the inlet air pressure and particle feeding efficiency as test factors and the variation number of ejector discharge as test index, a two-factor and five-level full factor test was carried out, and the range and variance analyses were carried out. The results showed that the seed feeding rate and the inlet wind pressure had significant effects on the coefficient of variation. The optimal combination of working parameters was 1.6 kpa inlet wind pressure and 1.8 g/s particle feeding efficiency.

1. Introduction

Alfalfa is known as the “King of Pastures”. In 2019, the global market of alfalfa reached USD 16.74 billion and is expected to grow to USD 29.35 billion in 2026 [1,2,3]. The improvement of natural degraded grasslands and the construction of artificially planted grasslands require supplementary seeding, mixed seeding or re-seeding to promote the benign and sustainable development of grasslands. It has been proved that developing the mechanized sowing technology and equipment of grassland can effectively improve the production efficiency of grassland, improve natural grassland, build artificial grassland, and promote the sustainable development of the grass industry. At present, most forage planters at home and abroad use an external groove wheel-type or friction disc-type seed metering device, which has poor adaptability to small grass seeds, difficult seeding, poor fluidity, and poor sowing effect. Zhao [4] designed a small mountain alfalfa seed drill, using a shaped hole wheel metering device—for each line, the displacement consistency coefficient of variation is 4.09%. Zhai [5] designed a multi-line one-device-type forage seed metering device, based on the mechanical and physical properties study of forage grass seeds. It was composed of an adjustable screw, a stirrer, a metering device housing, a central metering sheave, etc. The sowing rate can be set by turning the screw to change the working length of the central metering sheave relative to a metering device housing, the stirrer inside of the sheave housing was used to prevent seed overhead, and metering of different sizes of seed was adjusted by changing the position of the internal components of the slot wheel mechanism. Yin [6] added a seed filling brush in the outer grooved wheel seed metering device box and removed the seed metering tongue, based on the study of the working process of the seed metering device, in order to meet the requirements of actual seeding amount. Zhao [7] designed a type of seed metering device with a spiral external grooved wheel. The seed output per rotation of the spiral outer grooved wheel is far less than that of the ordinary outer grooved wheel, and the range of change in the seed amount adjustment is small, but the seed amount is relatively stable, which is suitable for sowing small grains such as alfalfa, bermuda root, and rape.
The air-delivered collector has the advantages of adapting to many types of crops, high speed and high efficiency, and has become the main trend of the development of seed metering devices for planters at home and abroad. However, in the air flow collection and drainage system, the mechanical seed feeding device usually uses the external grooved wheel seed metering device. Due to its own structural characteristics, the seed flow pulse usually occurs during the seed feeding process, which leads to the increase in the coefficient of variation of the consistency of the discharge capacity of each row of the collection and drainage device. The screw feeder has the advantages of simple structure and steady flow transportation, and is often used as the core component of wheat and rice seed metering devices. Mei [8] designed a seed metering device with spiral tube scooping for rice and wheat—its main components include a seed feeding tube; front, middle and rear shells; a central shaft; a seed chamber; seed bailing tube assembly fixed disk; a seed outlet hole length adjustment block; a seed metering tube; a base; and a spiral seed bailing tube assembly. Based on the external grooved wheel seed metering device, a rice precision direct seeding spiral grooved seed metering device is designed [9]. The seeds enter the spiral groove under their own gravity and the interaction force between the seeds. With the rotation of the seed metering wheel, the surplus seeds are brushed back to the seed filling area by the seed brush. The seeds in the spiral groove are protected by the seed guard plate. When they turn through the seed protection area, they fall down to realize sowing. In the field of simulation optimization, Wu [10] carried out a simulation experiment on the conveying process of the grain conveyor by using the EDEM software and an orthogonal test method. According to the least-squares method, the response surface model of conveying capacity and energy dissipation index was constructed by the MATLAB data fitting program, and the influence relationship between structural parameters and operating parameters of the vertical screw conveyor on performance index was obtained. Guo [11] established the discrete element model of the screw conveyor, and simulated the process of conveying rice by the screw conveyor by using EDEM software—taking the 20° inclined screw conveyor as an example, the optimal combination of the inclined screw conveyor is obtained by using orthogonal experiments.
During the seeding process of the collector, the interaction between the airflow and the seeds, and between the seeds and the seeds is complex. Meanwhile, the forces and movements of the seeds in each stage of the conveying process are very complicated. It is difficult to quantitatively describe them through mathematical models. With the development of computer technology, CFD–DEM (gas–solid two-phase flow coupled simulation) is widely used to study the motion state and characteristics of airflow field between particles and particles and between particles and shells [12,13,14,15,16,17]. Yang [12] carried out the numerical analysis of the particle movement of the fertilizer separating device through the coupling simulation discrete element method and computational fluid dynamics. Han [13] used the EDEM–CFD coupling analysis method to optimize the structure of the internal inflatable seed metering device. Ding [14] used the coupling method of discrete element and computational fluid dynamics to simulate the working process of the air suction seed metering device, and analyzed the drag force and movement speed of the seed. Siamak [16] simulated the cuttings transport considering the dynamic collision process using a coupled computational fluid dynamics and discrete element method (CFD–DEM). Gao [16] used the gas–solid coupling method to numerically simulate the working process of the corn pneumatic conveying device. Quantity and other working parameters have been optimized.
In the air-delivered collector, the seed supply uniformity of the quantitative seed supply device and the Venturi ejector has a significant impact on the performance index of the collector. This paper firstly uses EDEM software and ADAMS software to co-simulate the working process of the auger conveying seed feeder with and without the churning wheel, and analyzes the movement characteristics of the seed wheel pair population, the mass flow rate of seeds and the displacement coefficient of variation and other indicators. The method of coupling EDEM software and Fluent is used to numerically simulate the seed delivery process of the Venturi seed supply pipeline, and to explore and optimize the influence of the structural parameters of the expansion pipe on the internal flow field and seed motion characteristics of the pipeline. The efficiency of pressure feeding and seed feeding is used as the test index, and the coefficient of variation of the Venturi ejector displacement is used as the test index. A two-factor and five-level orthogonal bench test is carried out to obtain the optimal working parameter combination, so as to improve the working performance of an Alfalfa air conveyor.

2. Structure and Working Principle

2.1. Air-Delivered Collector

The alfalfa air-delivered collector is mainly composed of a fan, a damper, a Venturi ejector, a seed feeding elbow, a corrugated pipe, a conical distribution head, a seed guide pipe and a horizontal screw conveyor. Among them, the screw conveyor is mainly composed of a seed drop port, a front screw cover, a front stop head, a seed box, an end stop head, an end screw cover, a seed stirring wheel, a seed stirring rod and an auger, as shown in Figure 1.
When working, start the fan and adjust the air pressure through the air valve, so that a stable airflow field is generated inside each pipeline; add an appropriate amount of seeds to the seed box, turn on the motor to make the auger rotate, and the auger drives the seed stirring wheel to rotate, and the wheel rotates. The stirring rod on the top disturbs the population to improve its fluidity, and the auger continuously, uniformly and quantitatively discharges the seeds into the Venturi injector, and the seeds are mixed with the air flow to form a gas–solid two-phase flow into the seed conveying elbow; the flow is further mixed in the seed feeding pipe and then reaches the bellows. Under the disturbance of the concave–convex structure, the airflow velocity rises and falls alternately, the seed velocity decreases, the probability of the seeds colliding with the wall increases, and the distribution of the seeds in the bellows is more discrete and smooth. The evenly arranged air passages in the conical distribution head distribute the seed flow evenly under the action of the internal and external pressure difference, and the distributed seed flow enters the seed guide tube to complete the seeding operation.

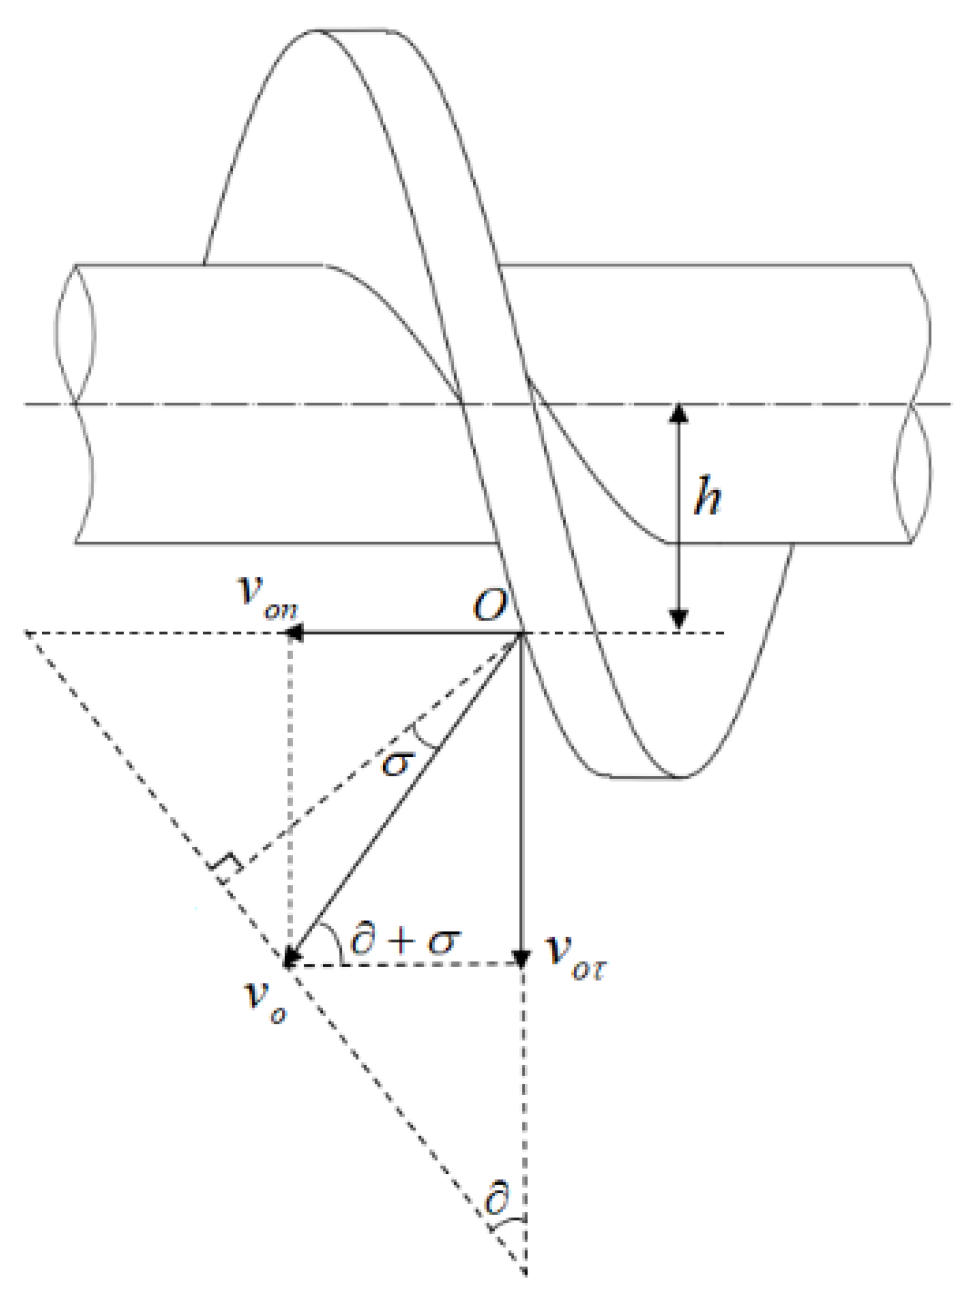
2.2. The Horizontal Screw Conveyor

The core components of the horizontal screw conveyor are the auger and the seed stirring wheel. The seed stirring wheel is fixed on the shell of the seed box and is driven by the auger blades to rotate. The symmetrically distributed 4 groups of seed stirring rods can disturb the population in real time to prevent card material, as shown in Figure 2.
During the working process of the conveyor, the self-weight of the seeds, the friction between the seeds and the friction of the blades cause the particles to not rotate with the helical blades, but to perform compound motion along the axis direction, that is, with the circumferential speed v o τ , the speed in the axis direction v o n and the combined speed v o , as shown in Figure 3.
Assuming that the rotation speed of the screw is n, the speed analysis of the seed particle at O is as follows:
v o = 2 π h n 60 sin cos σ
v o τ = v o sin ( + σ ) = 2 π h n 60 sin ( + σ ) sin cos σ
σ = arctg u o , sin = s 2 π h 1 + ( s 2 π h ) 2 , cos = 1 1 + ( h 2 π h ) 2 .
Therefore
v o τ = s n 60 s 2 π h + μ o ( s 2 π h ) 2 + 1
where the friction coefficient between seed and helical surface is μ o ; the spiral speed is n and the unit is rpm; the distance between the seed particle and the axis of the helix is h and the unit is m; the pitch of the helix is s and the unit is m.
Similarly, the axial velocity of the seed can be obtained as:
v o τ = v o cos ( + σ ) = s n 60 1 μ o s 2 π h ( s 2 π h ) 2 + 1
It can be seen from Formula (4) that under the condition of a certain rotational speed, the size of the screw pitch has a significant influence on the axial conveying speed and conveying effect of the particles. According to the working efficiency requirements of the seeder, the outer diameter of the screw auger D l is initially set to be 21.5 mm, and the pitch is generally taken as 0.8~1.0 [17] for a standard horizontal screw conveyor, so the design pitch is 17 mm. The diameter of the screw shaft is related to factors such as pitch and strength. The calculation formula is d l = ( 0.2 ~ 0.35 ) D l , considering the requirements of strength and stiffness, the design diameter of the rotating shaft is 8 mm. Conveying efficiency Q l is among the key performance indicators of screw conveyors, and its calculation formula is:
Q l = 3600 S z ρ w v o τ
S z = π ξ ( D l 2 + d l 2 ) 4
Q l = 15 π ξ ( D l 2 + d l 2 ) ρ w s n 1 μ o s 2 π h ( s 2 π h ) 2 + 1
where material conveying cross-sectional area is S z and the unit is m2; the material fill factor is ξ ; the material density is ρ w and the unit is kg/m3.
It can be seen from Formula (7) that when the screw structure of the screw conveyor and the rotation speed of the screw conveyor are constant, increasing the material filling coefficient can improve the conveying efficiency.

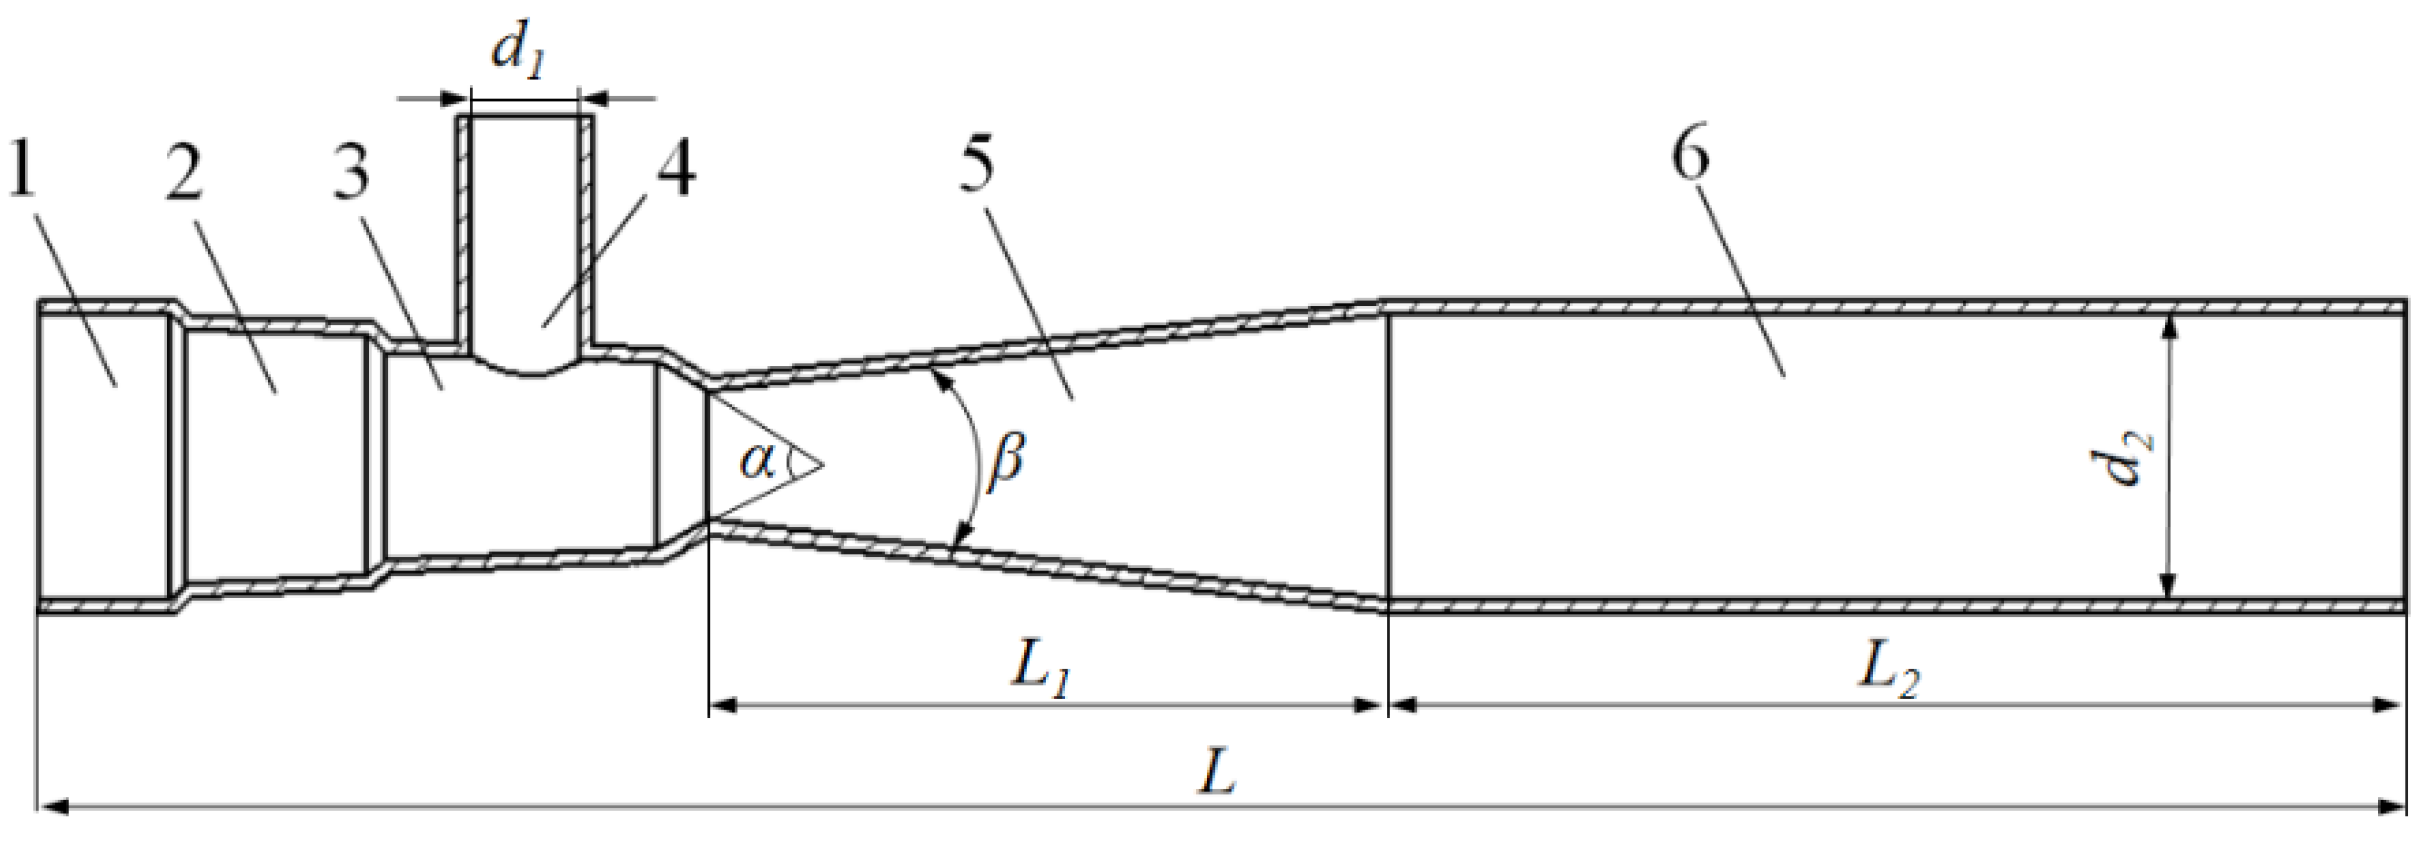
2.3. The Venturi Ejector

The Venturi ejector is a key component to achieve uniform mixing of airflow and seeds and continuous and stable seed supply, as shown in Figure 4. Among them, the total length of the injector is L , the length of the diffuser is L 1 , the length of the mixing pipe is L 2 , the inner diameter of the feeding pipe is d 1 , the inner diameter of the mixing pipe is d 2 , the injection angle of the throat is α , and the diffusion angle is β . The working principle of the ejector is as follows: the seed flow discharged from the auger conveying seed feeder enters the nozzle through the seed inlet. Due to the “Venturi” structure of the ejector, a large air pressure difference is generated between the airflow inlet and the throat, so the throat The airflow velocity at the nozzle increases and the pressure decreases, and the high-speed airflow brings the seeds into the diffuser tube with a gradually increasing cross-sectional area to complete a series of processes such as dispersion, mixing and transportation.
The seed feeding tube receives the seed flow discharged from the seed feeder. In order to reduce the collision between the seeds and the tube wall, the inner diameter d 1 of the seed feeding tube is designed to be 16 mm. The throat nozzle plays a role in increasing the local seed velocity. According to the relevant literature [18], the throat injection angle α is selected as 60°. The length of the pipe should meet the needs of fully mixing the seeds with the airflow field. In addition, due to the limitation of the size of the seeder, the total length of the ejector is finally designed to be 350 mm. According to the transport principle of particles in the pipeline [19], the inlet wind speed can be expressed as:
v r = k w ρ w + ζ L
where the Inlet wind speed is v r and the unit is m/s; the Material particle size factor is k w ; the particle density is ρ w and the unit is kg/m3; the Material characteristic factor is ζ .
When the particle size is 1~10 mm, the value of k w is 16~20. Since the equivalent diameter of the alfalfa seeds used is less than 10 mm, the value is 18. The density of alfalfa seeds is 1231 kg/m3, the influence of material characteristic coefficient on the wind speed can be ignored in the study, so the reference value of the inlet wind speed is about 20 m/s. The material-to-air delivery ratio is the ratio of the quality of the seeds transported per unit time to the quality of the airflow through the pipeline. The larger the delivery ratio, the smaller the required air quality, and the lower the required power for delivery, but it is easy to cause particle accumulation; the delivery ratio is too small, seeding efficiency will be greatly reduced, affecting seeding efficiency. The material-to-gas delivery ratio can be expressed as:
ψ = G k G q
G q = ρ g π d 2 2 4 v g
where the material-to-gas delivery ratio is ψ ; the particle conveying mass per unit time is G k and the unit is g/s; the air delivery mass per unit time is G q and the unit is g/s; the air density is ρ g and the value is 1.025 kg/m3. So:
d 2 = 4 G k π ψ ρ g v r
According to agronomic requirements and the actual working speed, the seeding rate of alfalfa seeds in a single row is about 0.45 g/s. Since the gas–solid two-phase flow of the seeds in the seed conveying pipeline is a dilute phase flow, the value of the material-gas conveying ratio ranges from 0.1 to 1.0. The air velocity and pressure inside the diffuser have a significant impact on the conveying and mixing performance [20]. The selection of the diffusion angle will be analyzed in detail later.

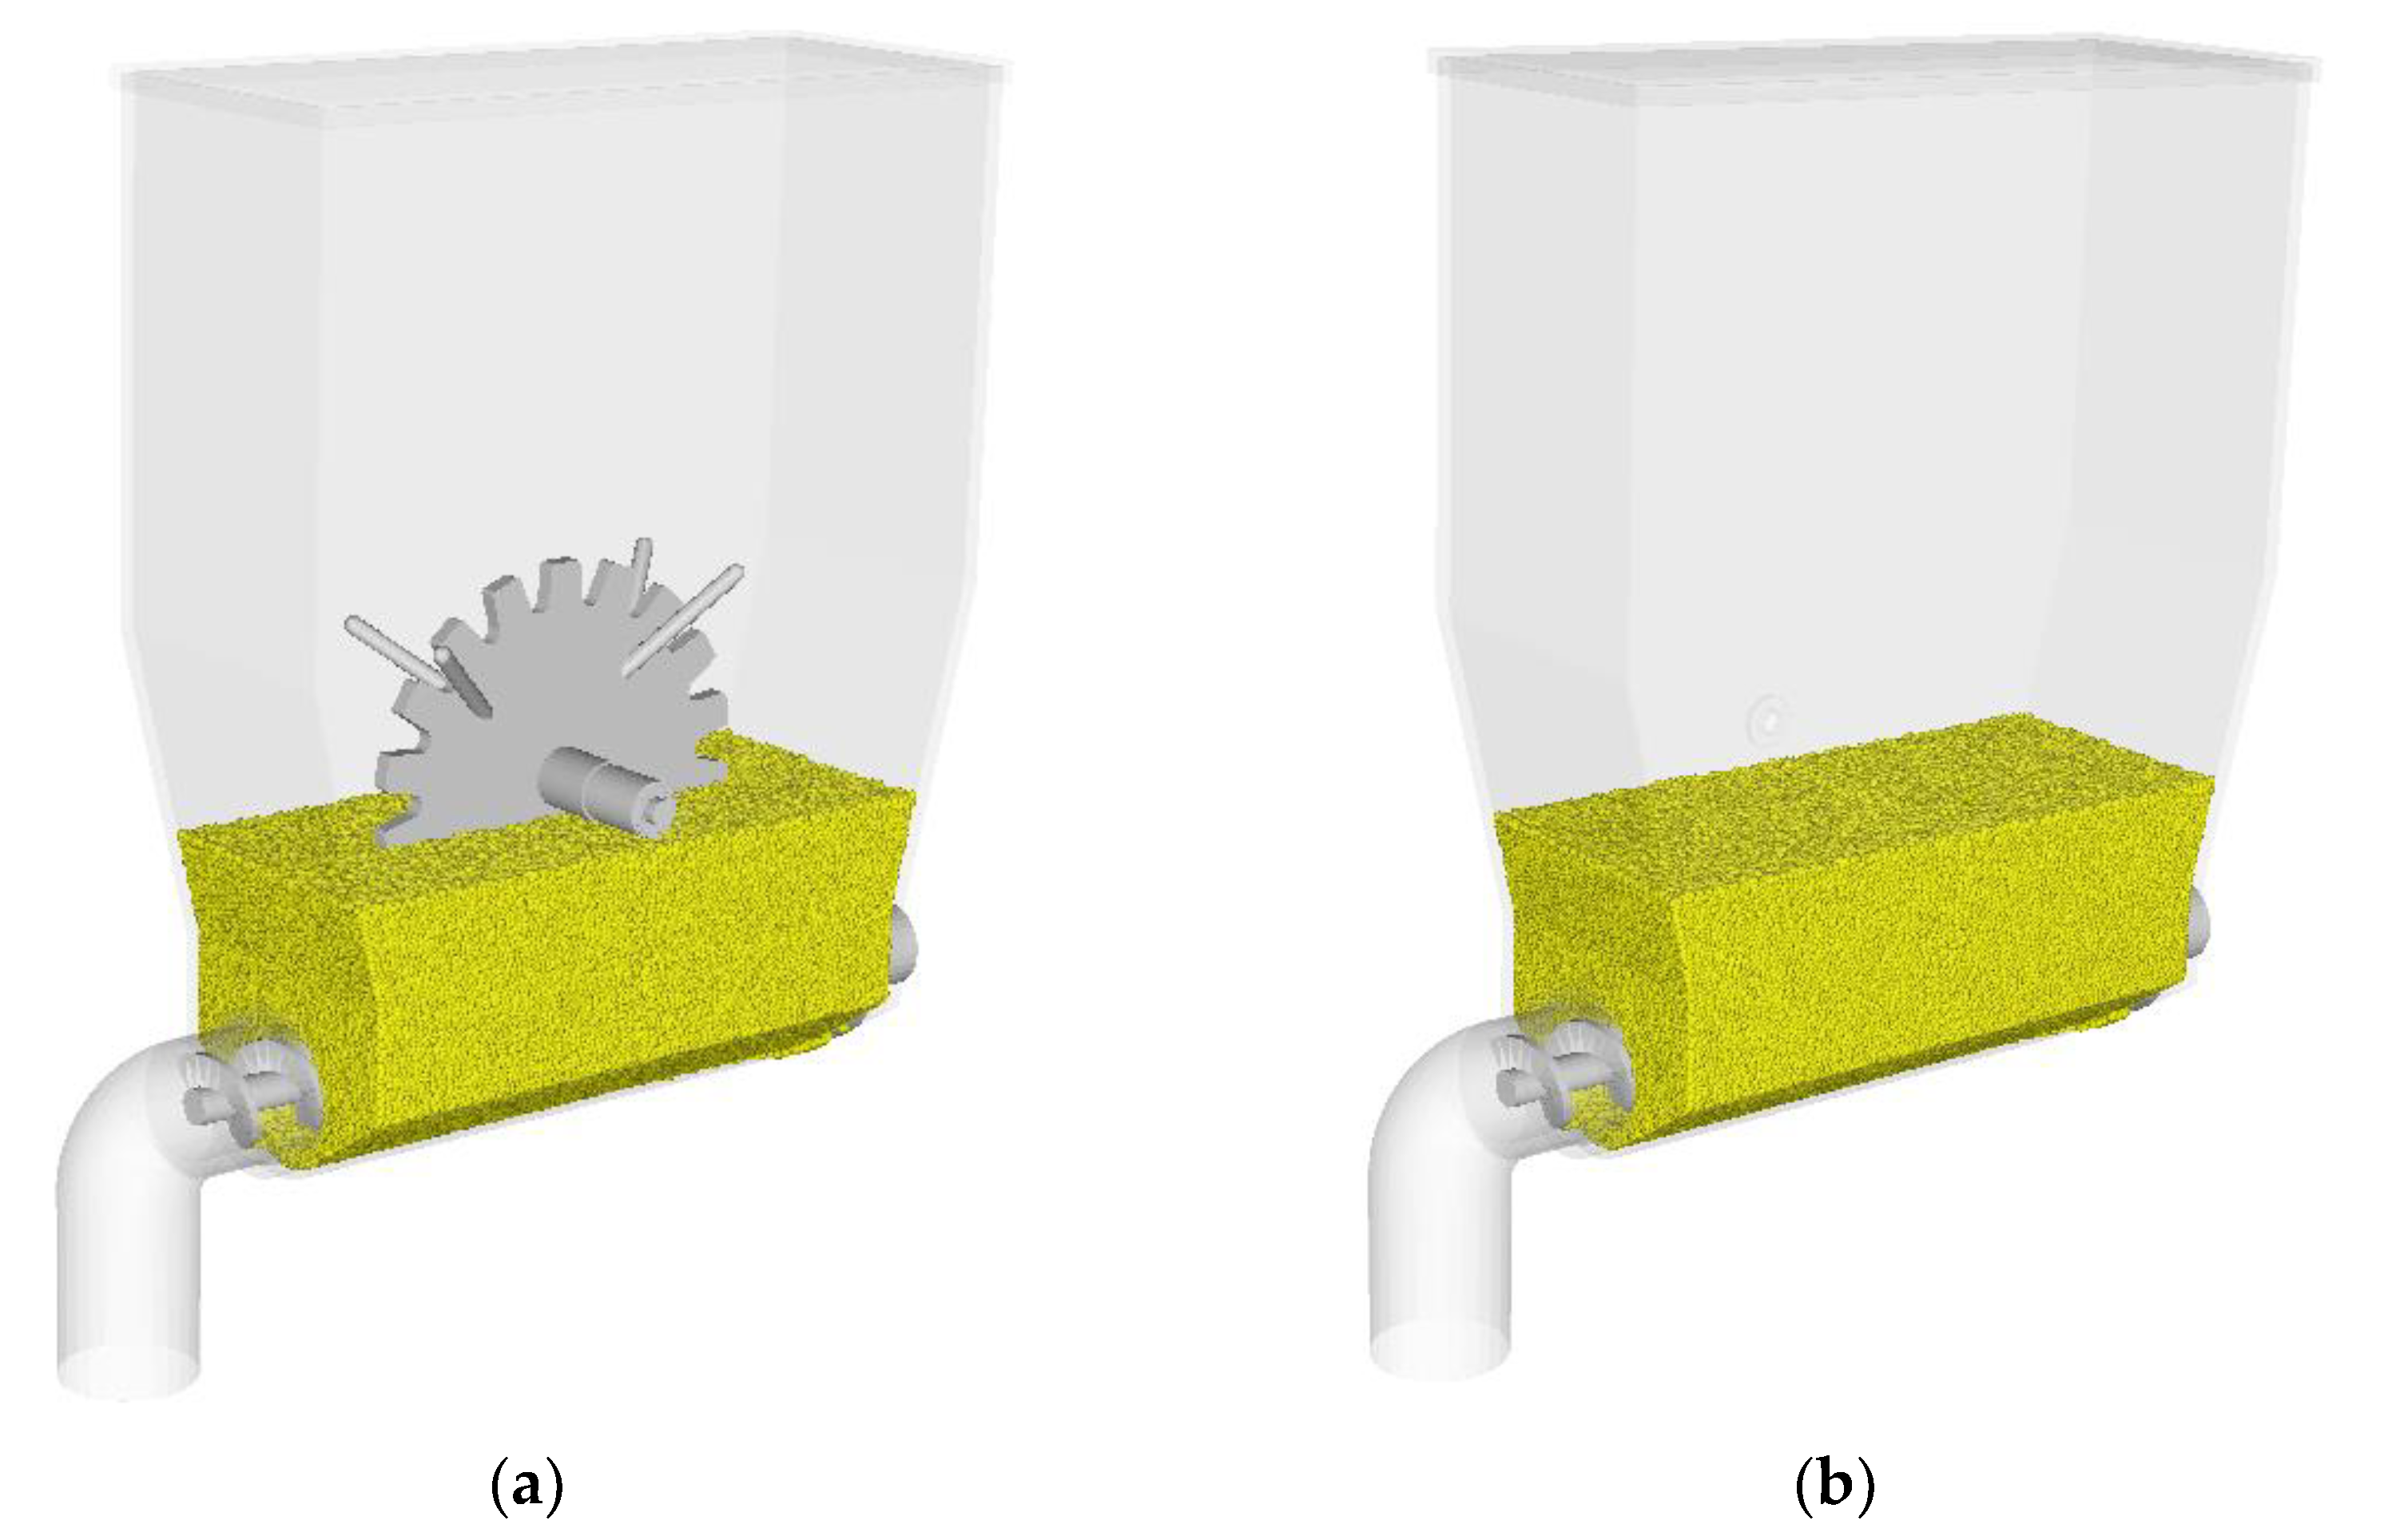
3. Simulation Analysis of the Screw Conveyor

The discrete element EDEM software and the multi-body dynamics ADAMS software are used to numerically simulate the working process of the screw conveyor with a seed stirring mechanism and the screw conveyor without a seed stirring mechanism, respectively. The influence of the seed movement characteristics and other indicators is aimed at verifying the rationality of the design of the seed stirring mechanism and improving the working performance of the screw conveyor.

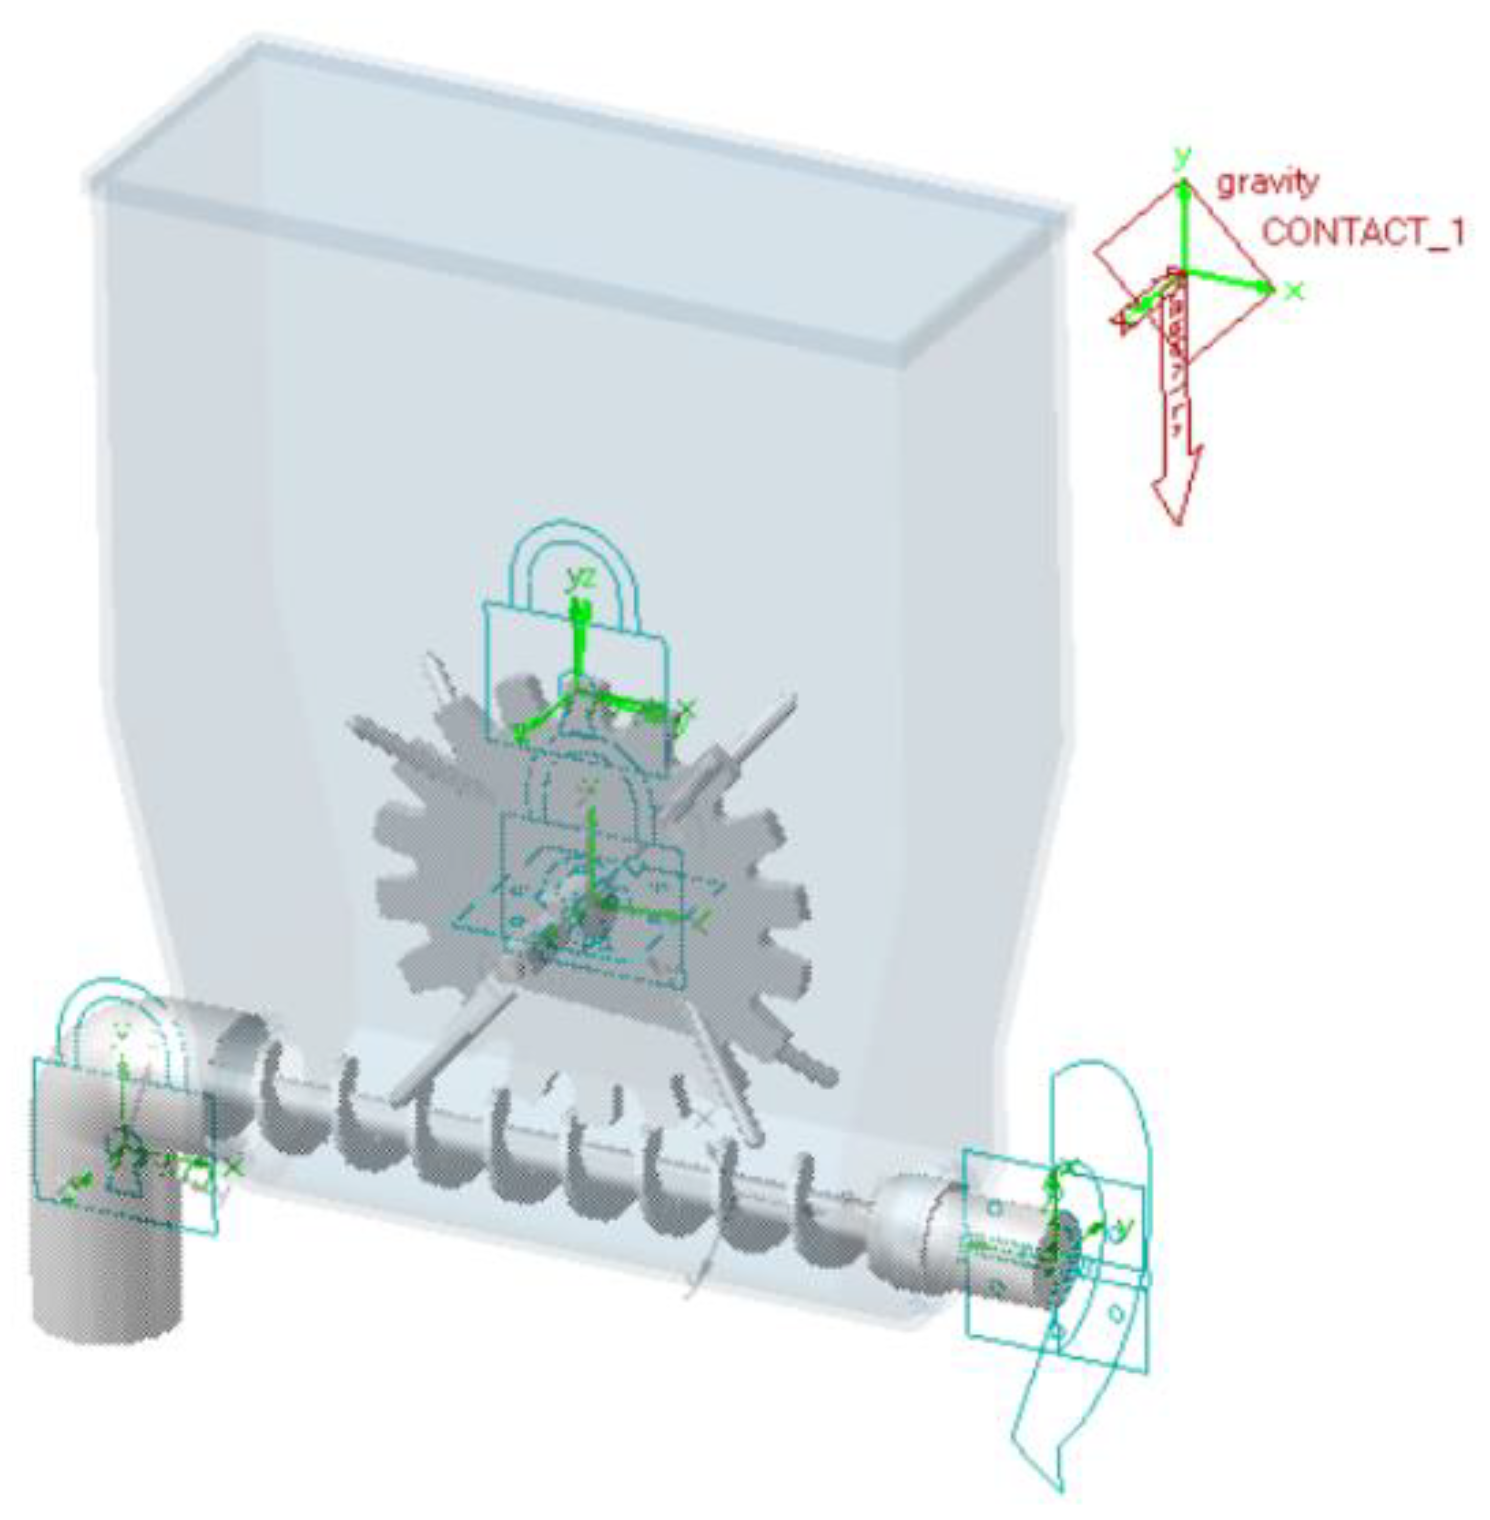
3.1. Discrete Element Model Building

According to the physical properties of alfalfa seeds, a simulation model of alfalfa seeds is established in EDEM software by using the spherical particle combination method. The Hertz–Mindlin non-sliding model is set up for the contact model between particles and the contact model between particles and the parts of the conveyor, as shown in Figure 5. In order to find the optimal contact parameter combination of the discrete element model of alfalfa seeds, the parameters of the alfalfa seed model were calibrated based on the errors of the measured and simulated values of the angle of repose and accumulation angle of alfalfa seeds [21]. The calibrated model parameter combinations are shown in Table 1. The grooved wheel seed metering device was used for experimental verification. The average relative error between the measured and simulated values of the alfalfa seed mass flow rate under the conditions of different seed metering wheel speeds was 2.89%. Therefore, the discrete element model and contact parameters of the alfalfa seeds satisfy the requirements. Discrete element simulation test accuracy requirements. The three-dimensional model of the screw conveyor with a seed stirring mechanism and the three-dimensional model of the screw conveyor without a seed stirring mechanism established by Solidworks software were imported into EDEM software, and the appropriate population of equal height was generated through the particle factory, as shown in Figure 6a,b.

3.2. EDEM and ADAMS Co-Simulation Test

When only using EDEM to numerically simulate the working process of the screw conveyor with the seed stirring mechanism, the force transmission between the auger blades and the seed stirring wheel cannot be realized, and the complex rotational characteristics of the seed stirring wheel cannot be directly set. Therefore, it is necessary to use EAlink software to carry out the co-simulation of EDEM and ADAMS [22], and transfer the rotation characteristics of the churning wheel in ADAMS to the churning wheel in EDEM, so that it rotates in real time according to the obtained rotation speed.
After the 3D model of the screw conveyor is imported into ADAMS software, the material properties of each part are defined, and the relatively static parts form an integral part through Boolean operation, so that only the auger and seed stirring wheel can rotate. In order to better simulate the real environment, the damping value of 100 is added between the auger and the seed stirring wheel. The stirring wheel is driven to rotate by adding a rotary drive to the rotating pair of the auger, and the rotational speed of the rotary drive is set to 180 rpm. In order to make the simulation of the screw conveyor match the actual situation as much as possible, friction force is added to each rotating pair in ADAMS, and the entire model is placed in the same gravity field [23,24]. The virtual prototype model of the horizontal screw conveyor is shown in Figure 7.
Before co-simulation, make sure that EDEM is in a coupled state, and open the completed conveyor virtual prototype model. According to the Rayleigh wave method, the EDEM simulation time step is 6 × 10⁻⁶ s, and the simulation time is set as the 3rd second. Considering that the particle movement reaches a stable state, the ADAMS simulation time step should be an integral multiple of the EDEM time, so it is set to 3 × 10⁻⁵ s. Finally, the coupling calculation is performed through the EALink software. After the simulation, the data can be analyzed in EDEM and ADAMS, respectively. Apply the EDEM post-processing Selection module to set up a Grid Bin Group below the seed drop port to record the mass flow rate of seeds flowing through the virtual body at different times. In order to explore the uniformity of seeding, the seed mass flow rate was recorded every 0.01 s, and the coefficient of variation of the mass flow rate was calculated. The calculation formula is:
κ = t x ¯ × 100 %
{ x ¯ = a = 1 b x a b t = a = 1 b ( x a x ¯ ) 2 b 1
where the mass flow rate of the seeding port at the first moment a is x a and the unit is g/s; the average mass flow rate is x ¯ and the unit is g/s; the standard deviation of the mass flow rate is t .

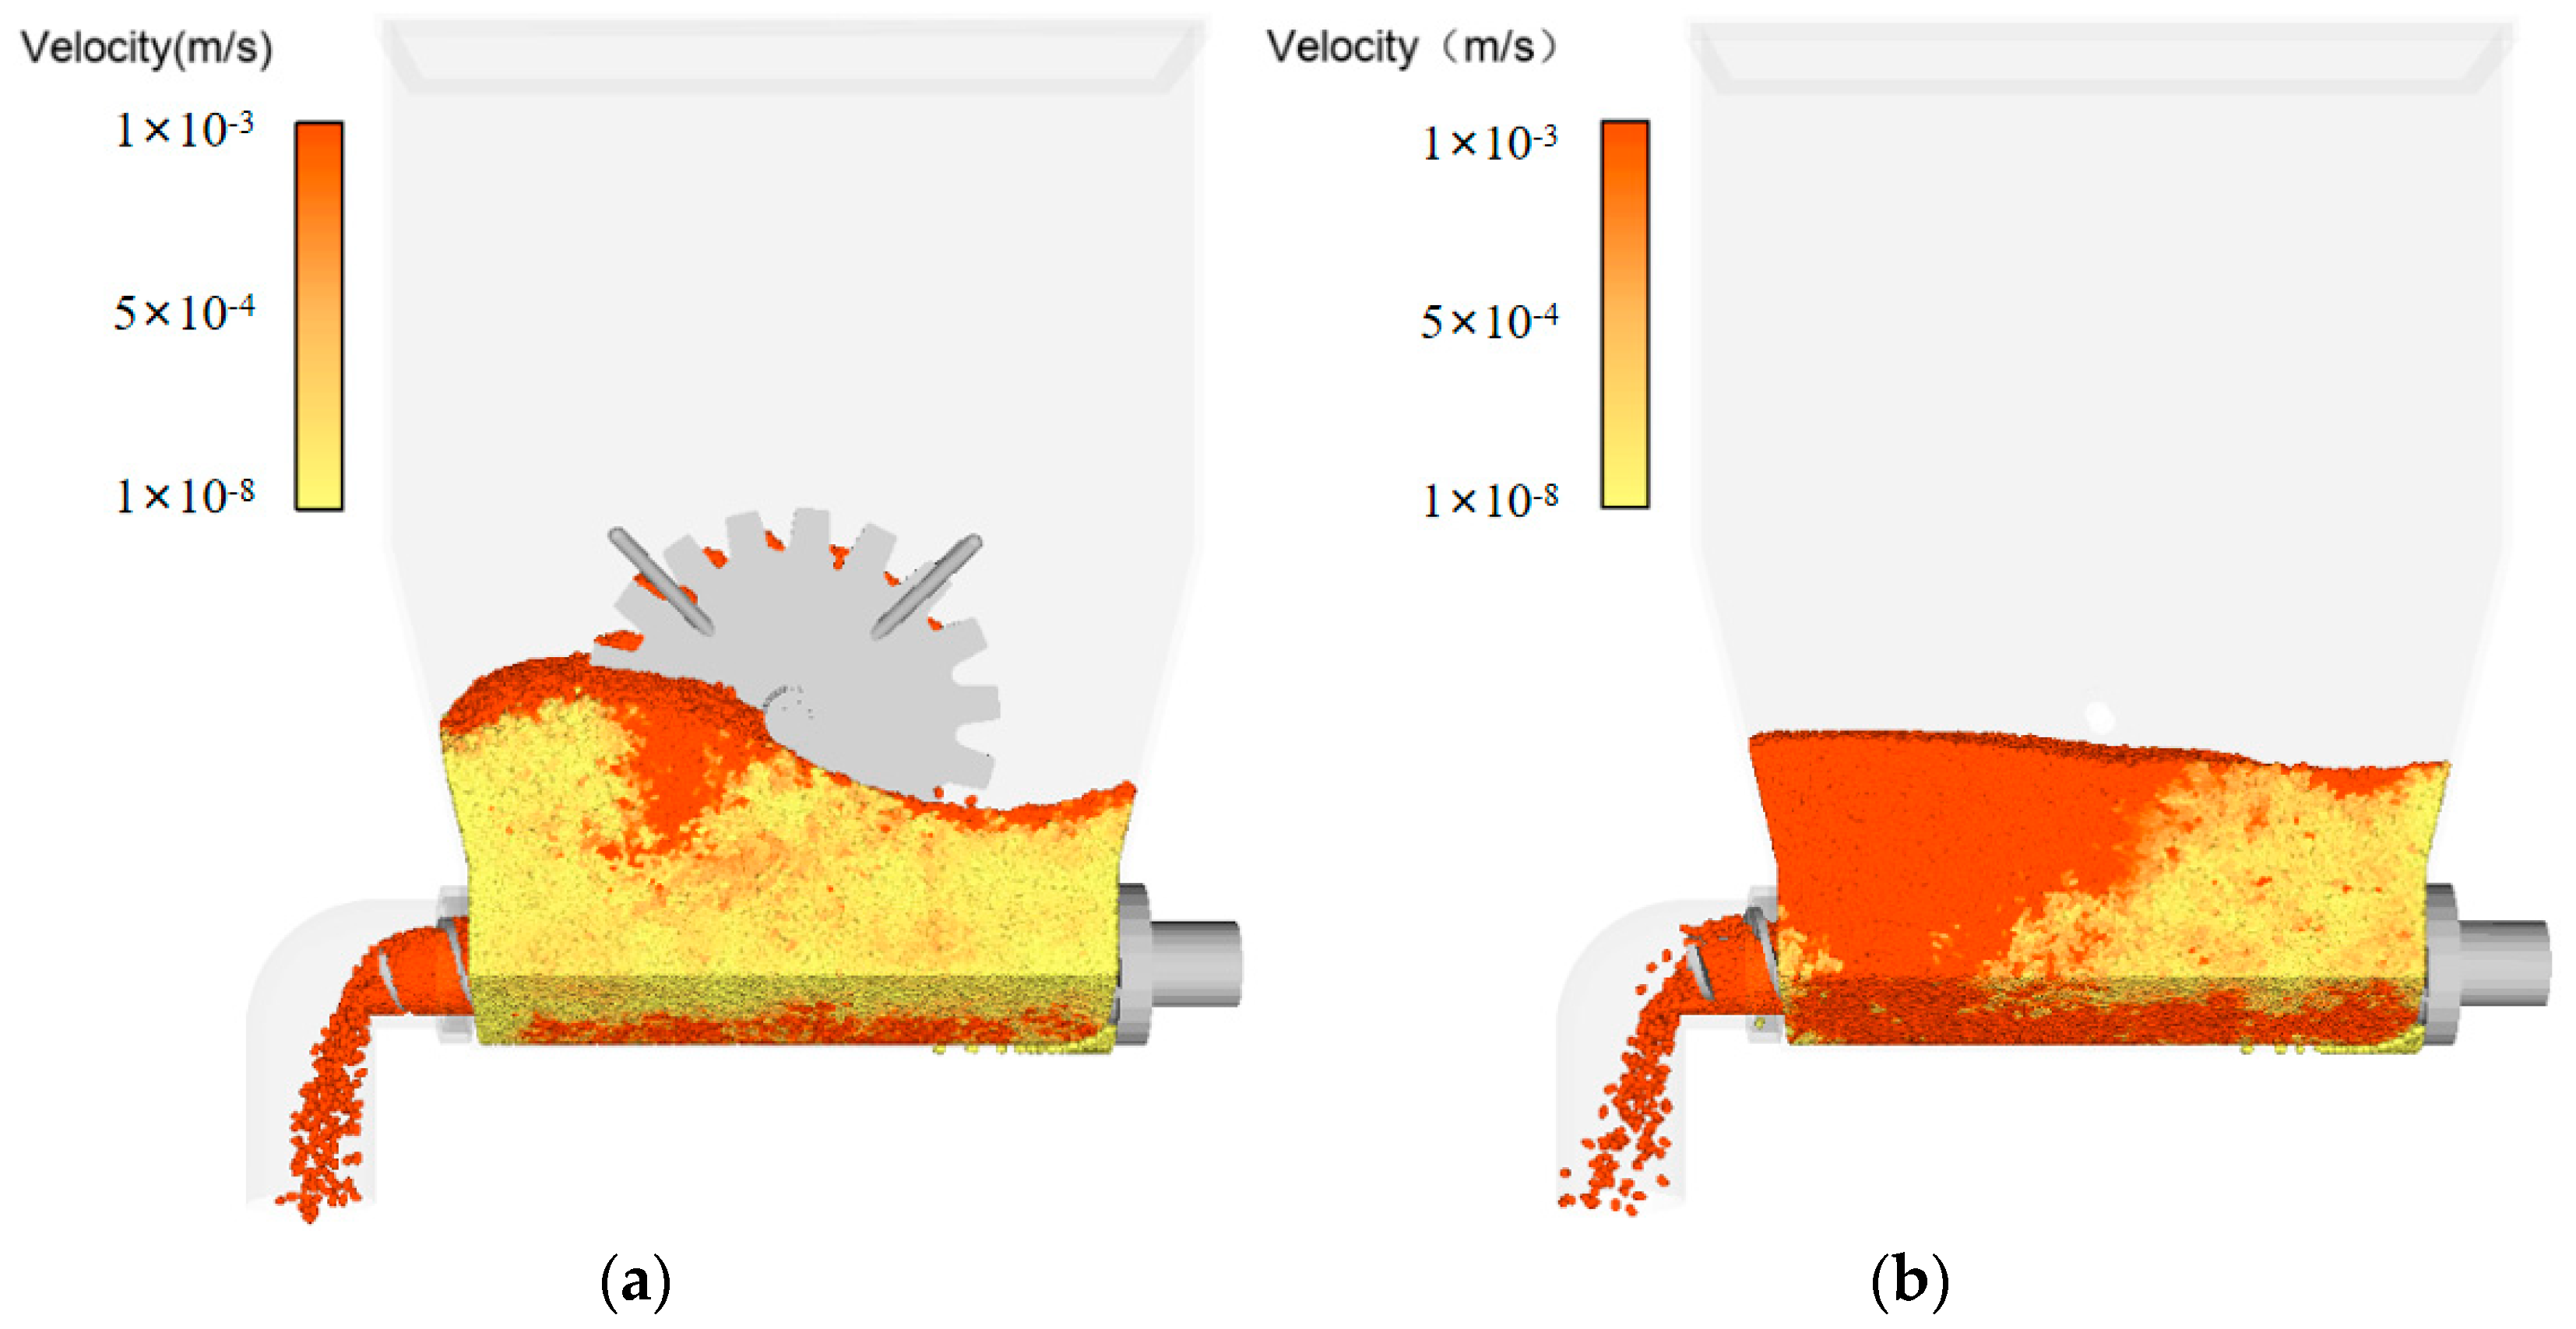
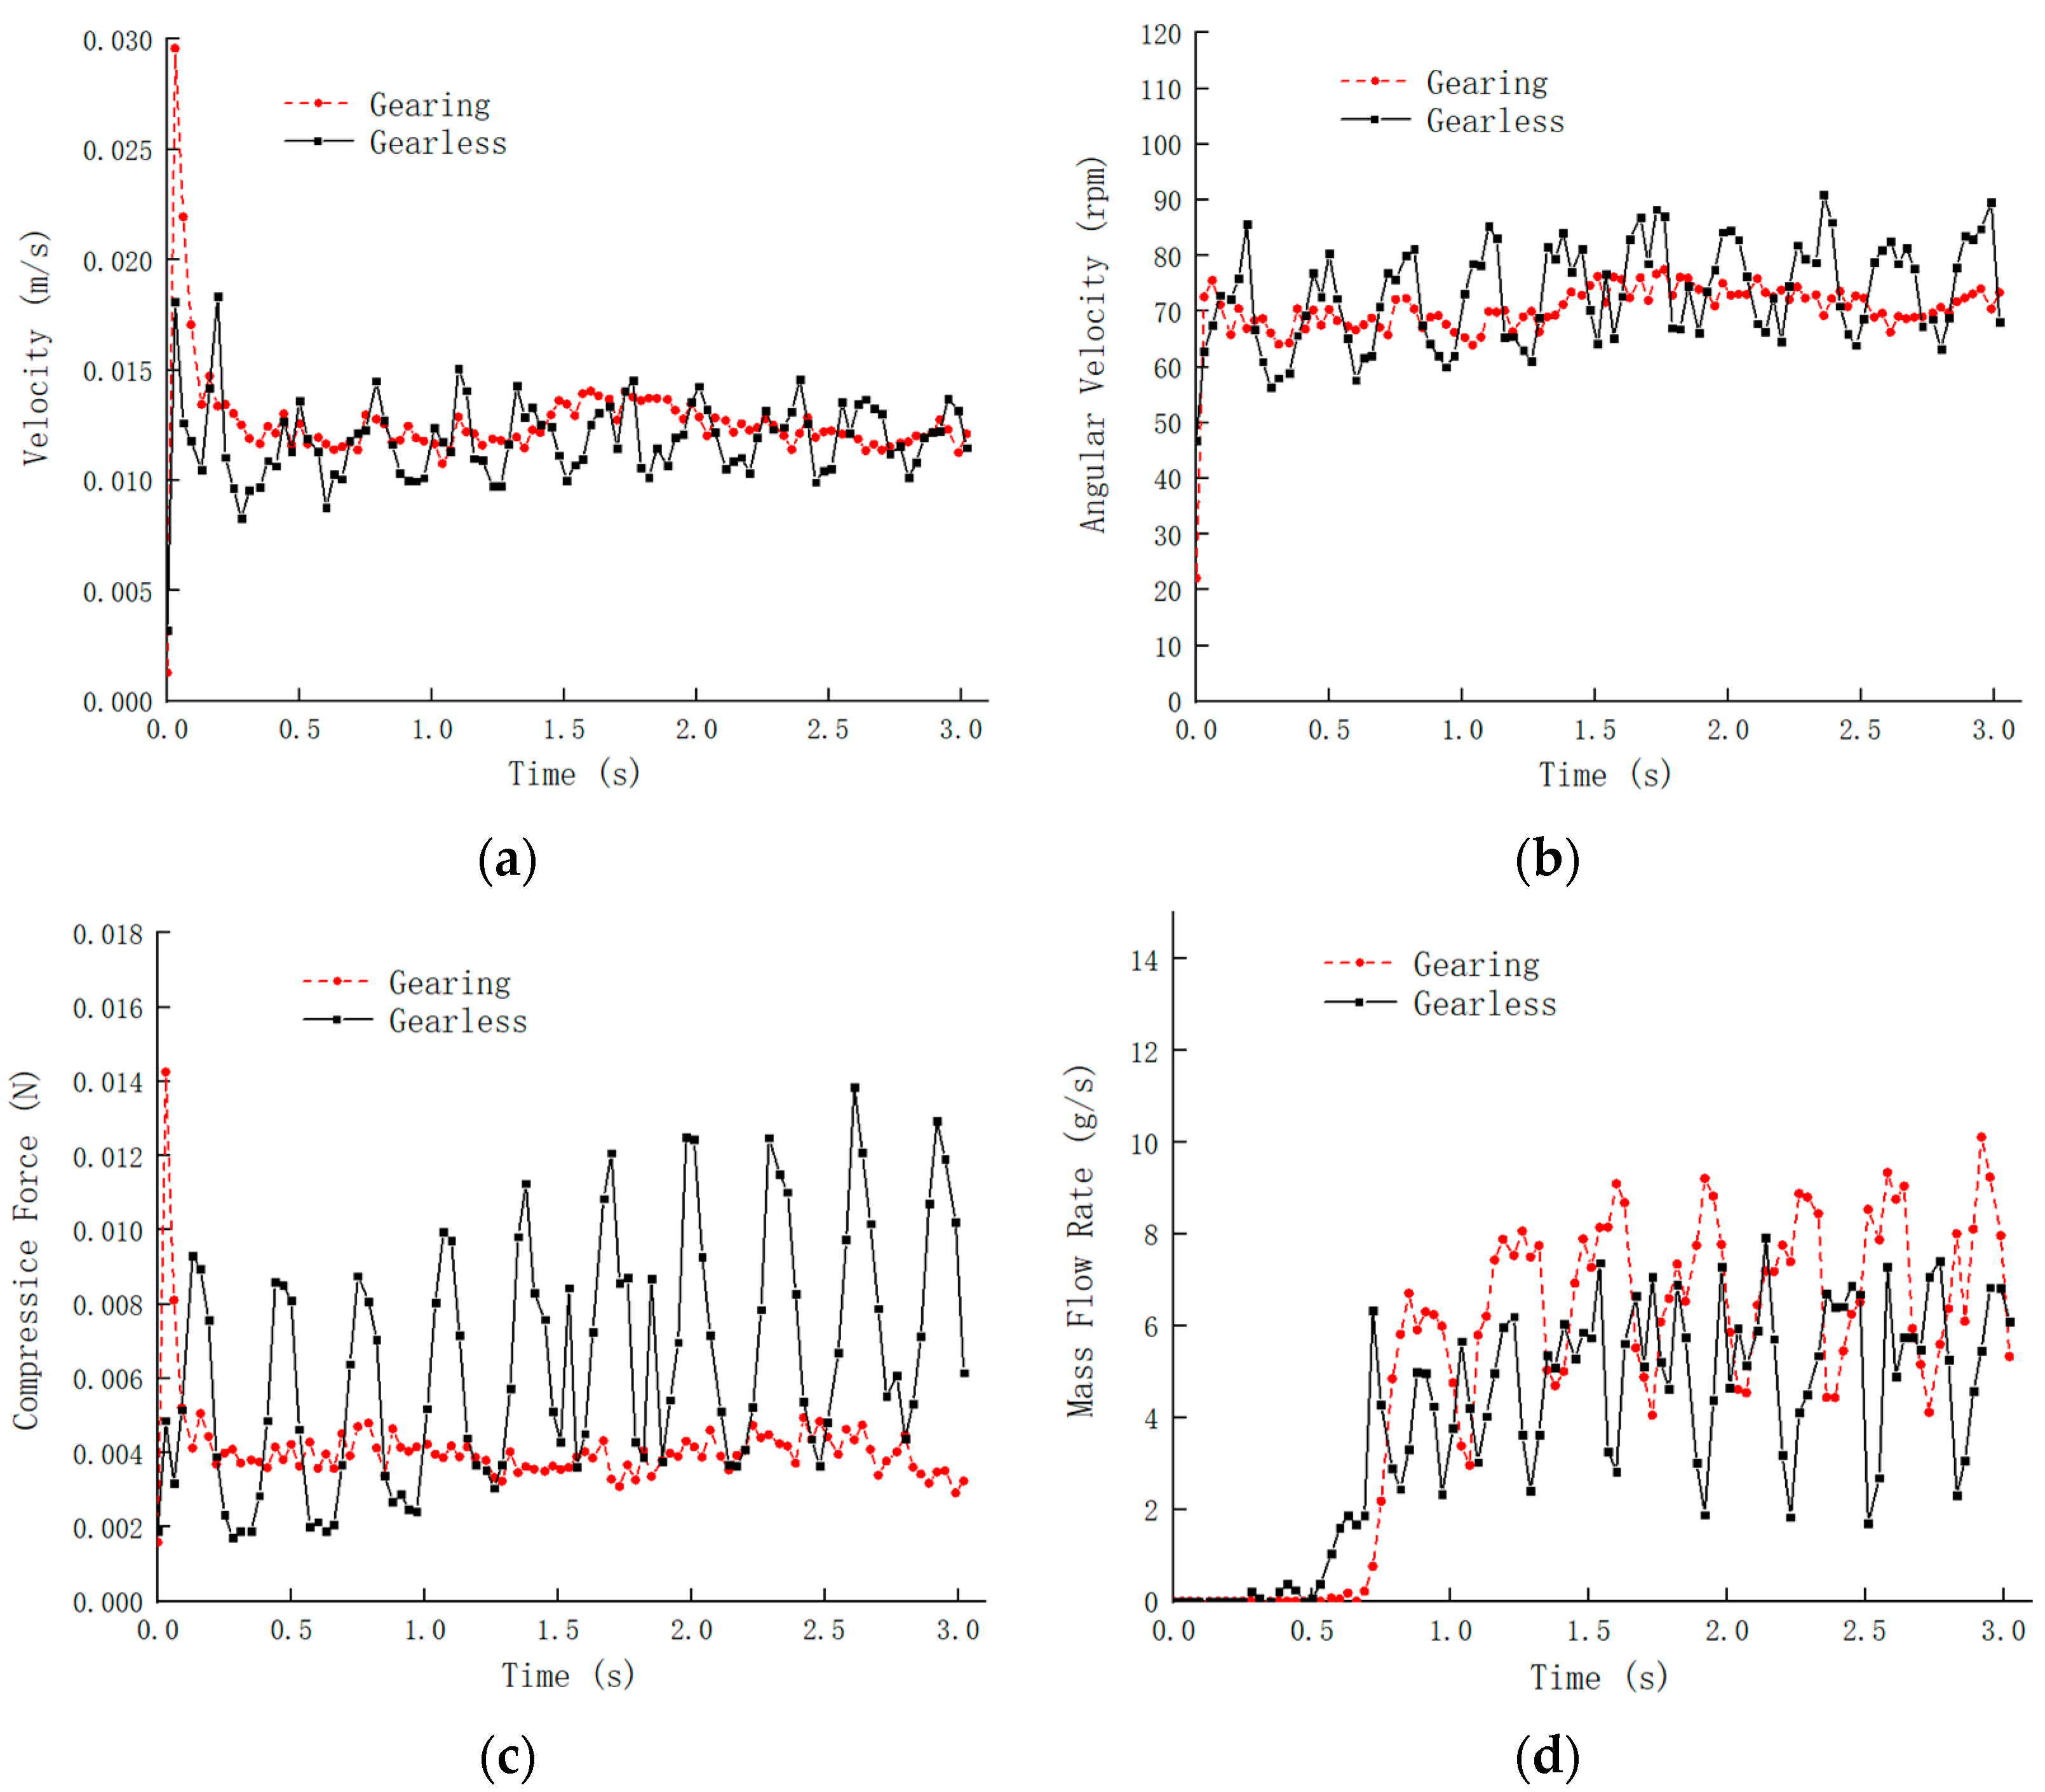
3.3. Analysis of Simulation Results

In order to explore the influence of the seed stirring mechanism on the movement characteristics of the population and the conveying performance of the screw conveyor, the internal population velocity distribution of the conveyor with the seed stirring mechanism and the conveyor without the seed stirring mechanism at the time of the 3rd second was compared and analyzed, as shown in Figure 8. It can be seen from Figure 8a that under the combined action of the auger and the seed stirring mechanism, the population moves to the left and upward, the population is uplifted greatly, the distribution of high-speed particles in the seed box is relatively uniform, and the seeds in the seed drop area are relatively uniform. The distribution is uniform and the density is high, indicating that the conveying capacity of the screw conveyor is large and the conveying uniformity is good. The reason is that while the stirring rod moving with the stirring wheel disturbs the population, it can squeeze the inner population towards the direction of the auger, which increases the filling coefficient of the material between the spiral blades, thereby improving the efficiency of the spiral. The working performance of the conveyor. It can be seen from Figure 8b that in the case of no seed stirring mechanism, the population moves to the left, the population uplift is not obvious, and the distribution of high-speed particles in the seed box is uneven, mainly concentrated on the top of the spiral blade near the outlet, and the seeds are dropped. The distribution of seeds in the mouth area is uneven and the degree of dispersion is large, indicating that the conveying volume of the screw conveyor is small at this time, and the conveying uniformity is poor. The reason is that when the population moves to the left with the spiral blade, it gradually gathers at the outlet. With the continuous increase in the interspecific pressure, the mobility of the population decreases, and finally, a local dead zone is formed, which reduces the filling coefficient of the material between the spiral blades, thereby affecting the working performance of the screw conveyor.
The EDEM post-processing module is used to obtain the time-varying trend of the internal population movement characteristics of the screw conveyor with the seed stirring mechanism (hereinafter referred to as the Y-type conveyor) and the screw conveyor without the seed stirring mechanism (hereinafter referred to as the W-type conveyor) within 0~3 s, as shown in Figure 9. It can be seen from Figure 9a that with the rotation of the auger, the linear speed of the two conveyor populations gradually decreases after a rapid increase. The linear velocity of the Y-type conveyor population varies less with time and has a larger average value, indicating that its internal particle fluidity and stability are better. It can be seen from Figure 9b that after the auger starts to rotate, the angular velocity of the two conveyor populations increases rapidly, and then fluctuates within a certain range. Compared with the Y-type conveyor, the internal angular velocity of the W-type conveyor changes with time. The amplitude is larger and the average value is larger, indicating that the particles inside the W-type conveyor are mostly in a rolling state, and the friction between species is larger, resulting in increased power consumption and reduced conveying efficiency. It can be seen from Figure 9c that from 0 s, the compressive force on the internal population of the Y-type conveyor decreases rapidly after a sharp increase, and then fluctuates smoothly in a small range, and its average value is small; while the compressive force curve of the population inside the machine of the W-type conveyor shows a large fluctuation upward trend, and the overall compression force curve is higher than that of the Y-type conveyor, and the higher compressive force will reduce the mobility of the population, and local populations will appear overhead and even dead zones, seriously affecting the efficiency of the conveyor. It can be seen from Figure 9d that after the screw conveyor is in a stable working state, the average mass flow rate of the seeds at the seed drop port of the Y-type conveyor is higher than that of the W-type conveyor, and the variation range is small, indicating that the Y-type conveyor has a higher output rate than the W-type conveyor. The transport efficiency is higher and the stability is better, which also verifies the above analysis of the movement characteristics of the population. See Table 2 for the mean values and coefficients of variation corresponding to each parameter in Figure 9.
To sum up, the seed stirring mechanism can effectively improve the mobility of the population, reduce the local dead zone of the population, and increase the material filling coefficient between the spiral blades. Under the conditions of the same auger rotation speed and the same seed layer height, the horizontal screw conveyor with the seed stirring mechanism has a higher conveying efficiency and better conveying uniformity.

4. Simulation Analysis of Venturi Ejector

Using EDEM software and Fluent software to co-simulate the process of Venturi ejector seed supply, using the changes in the pressure and velocity of the flow field inside the pipeline, the velocity and force of the seed particles as indicators, the influence of the structural parameters of the diffuser tube on the working performance of the ejector was analyzed, and then impact and optimize it.

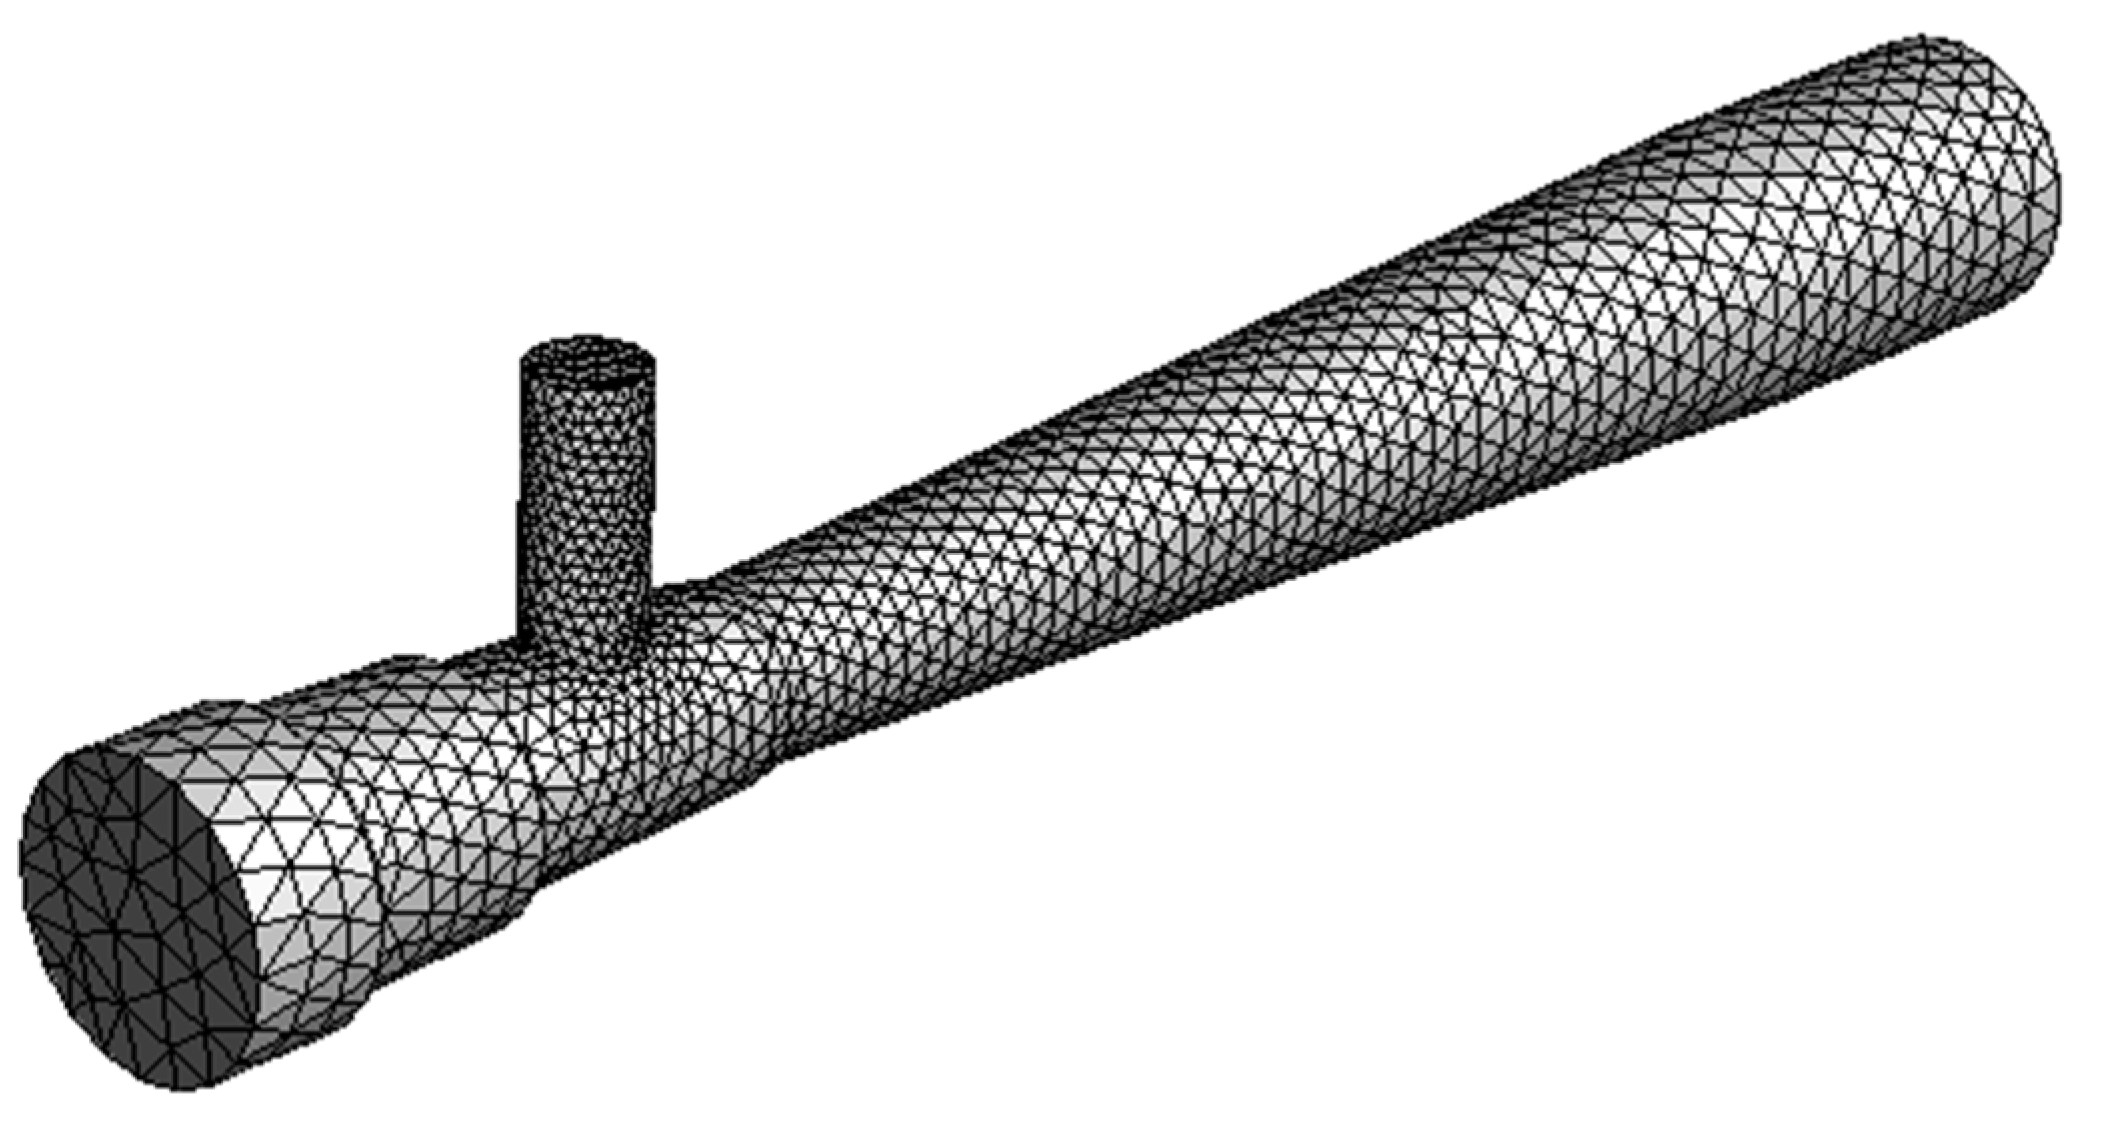
4.1. CFD–DEM Coupled Simulation Method

Firstly, meshing is performed for the gas–solid coupling analysis area, that is the interior of the Venturi injector. The meshing module in ANASYS software is used to mesh the injector, and the total number of meshes obtained is 20,718, of which the maximum mesh volume is, and the minimum mesh volume is 4.58 × 10⁻¹⁰ m3. Since the airflow enters from the inlet at the left end of the ejector and flows out from the outlet at the right end, the inlet of the ejector is selected as the pressure inlet boundary condition, and the seed inlet and the other end of the pipeline are the pressure outlet boundary conditions, as shown in Figure 10.
The seeds are generated by the particle factory at the seed inlet, and the generated seeds enter the Venturi injector under the action of their own gravity, and the number of dynamically generated seeds is set to 5 g/s. The high-speed airflow enters from the nozzle inlet and joins the seeds at the shrinking tube, and the airflow inlet pressure is set to 3000 Pa. The seeds are blown into the diffusion tube by the high-speed air flow, fully mixed with the air flow, and then discharged through the mixing tube to realize the seed supply. In this process, EDEM software obtains the real-time particle position and contact information, and transfers the obtained information to the Fluent software. Fluent simulates and calculates the influence of the particles on the flow field according to the obtained information, and then uses the obtained flow field information. In the feedback conduction EDEM, the influence of the flow field on the particles is simulated and circulated in turn to achieve the effect of two-way fluid-structure coupling. During the simulation, the EDEM time step is set to 1 × 10⁻⁶ s, and the Fluent time step is set to 5 × 10⁻⁵ s, which is 50 times of the EDEM; the number of Fluent steps is 60,000, the simulation time is 3 s; each time step is set to iterate 50 times; within EDEM and Fluent, data are saved every 0.01 s. In the simulation test, the level of diffusion angle is set to 5°, 10° and 15°, and the three types of injector structure parameters corresponding to different diffusion angles are shown in Table 3.

4.2. Simulation Results and Analysis

4.2.1. Validation of CFD–DEM Model

In order to verify the feasibility of the gas–solid coupling model, a pneumatic seed supply test bench was built, its diffusion angle is 5°, the diffuser length is 200 mm, and the length of the mixing pipe is 50 mm, as shown in Figure 11. During the test, the inlet air pressure was set to 3 kpa, and the seed feeding efficiency was 5 g/s. When the wind pressure and seed feeding speed were stable, the number of seed particles collected from the outlet of the Venturi ejector was recorded every 5 s, and the average value was obtained by repeating 3 times each test. The Venturi injection simulation test was carried out under the same working parameters, and the comparison between the bench test results and the numerical simulation results is shown in Figure 12. It can be seen from the figure that there is little difference between the bench test results and the numerical simulation results, and it is feasible to use CFD–DEM to carry out numerical simulation of the ejector.

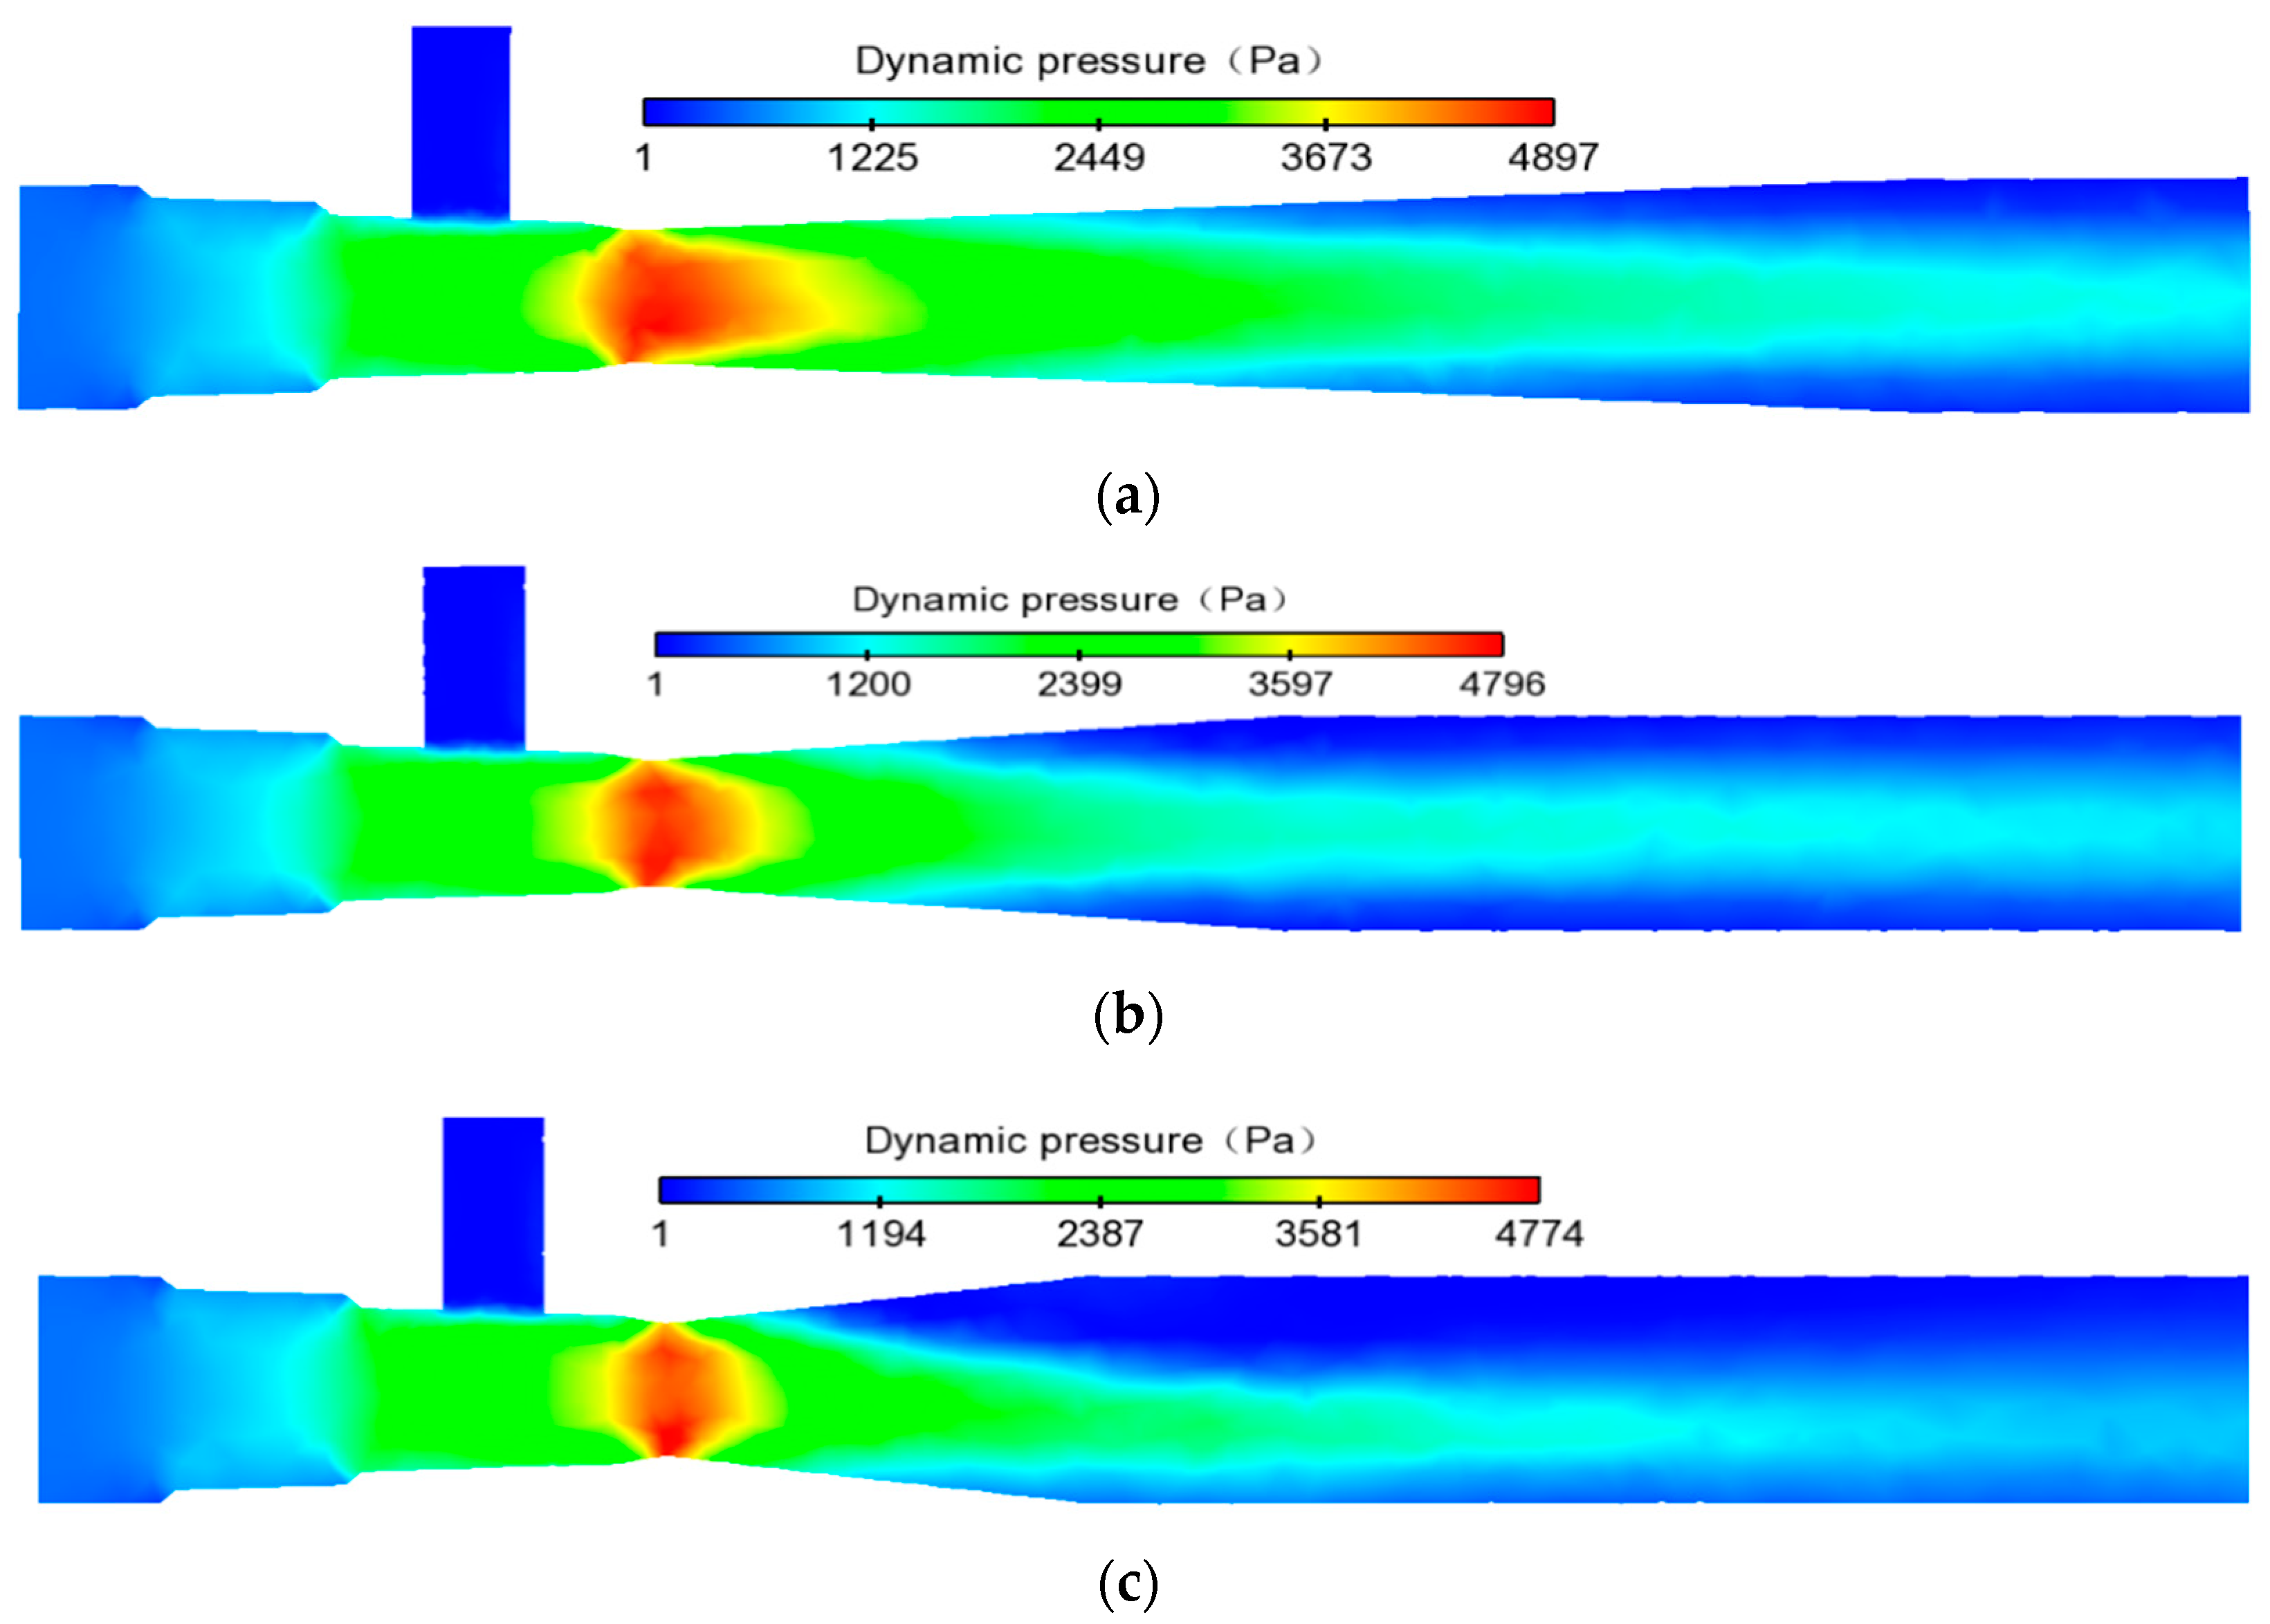
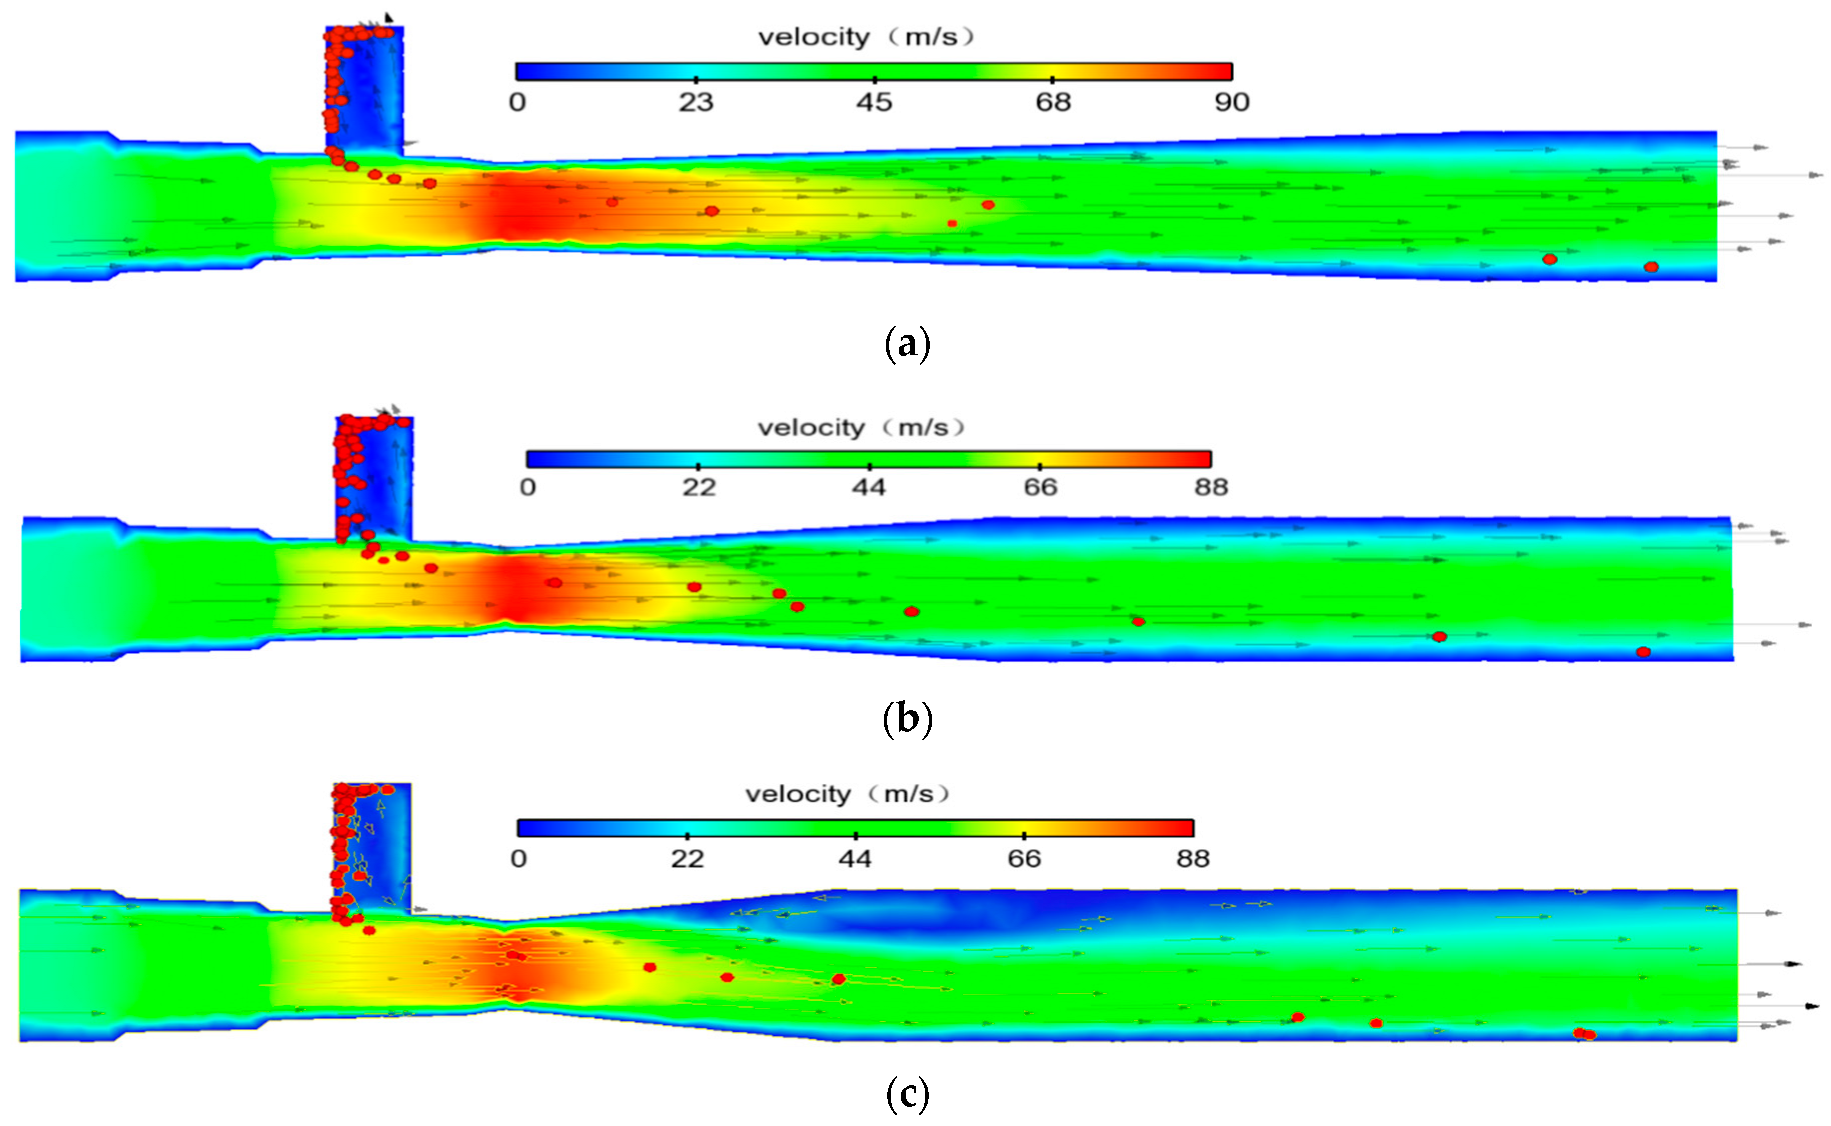
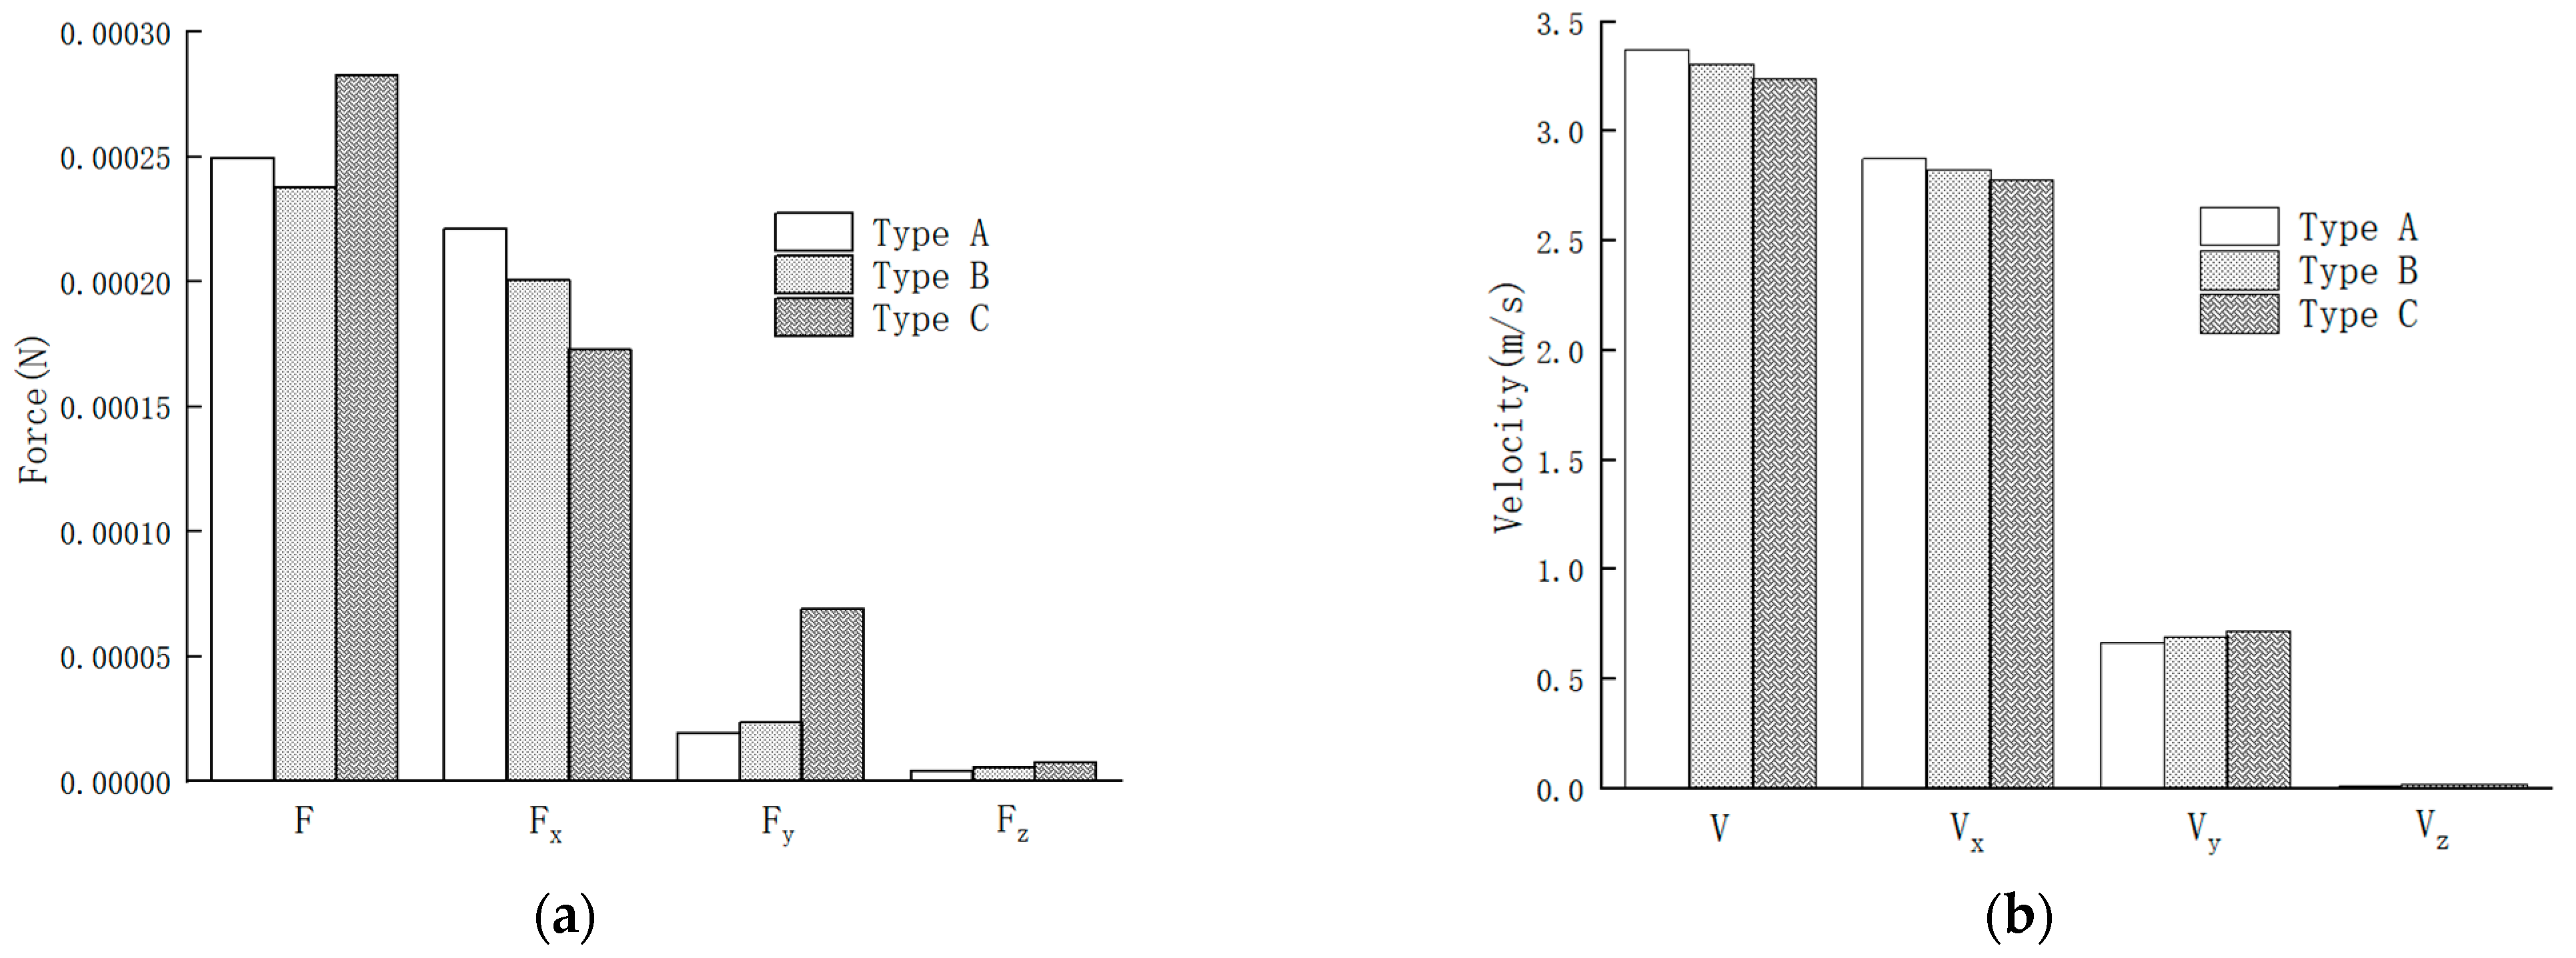
4.2.2. Influence of Structural Parameters of Diffusion Tube on Injection Performance

In order to explore the influence of the structural parameters of the diffuser tube on the working performance of the Venturi ejector, the air pressure and velocity characteristics of the three pipes A, B, and C at 1 s and the force and motion characteristics of the seed particles within 0~1 s were compared and analyzed. As shown in Figure 13, Figure 14 and Figure 15. It can be seen from Figure 13 that the airflow pressure and velocity inside the pipeline change significantly. In the contraction section, the static pressure of airflow decreases rapidly and the flow velocity rises rapidly. The static pressure and flow velocity of the airflow at the throat nozzle reach the lowest and highest values, respectively. With the increase in the inner diameter, the static pressure of the airflow gradually increased and the flow velocity gradually decreased, and then both tended to be stable in the mixing section. The distribution of air pressure in the three pipes (Figure 14) shows that the dynamic pressure at the nozzle of the A-type injector is the highest, the air pressure changes in the diffusion section and the mixing section are relatively slow, the pressure distribution is uniform, the area of the high pressure area is the largest and the overall pressure loss is the smallest. The dynamic pressure at the nozzle of the C-type injector is the smallest, the pressure gradient in the diffusion section is the largest and the distribution is uneven, and the pressure loss is the largest. The distribution of air velocity in the three pipes (Figure 15) shows that the air velocity at the nozzle of the A-type injector and the outlet is the highest, the area of the high-speed area is the largest, and the velocity gradient is the smallest; the air velocity at the nozzle of the C-type injector and the outlet is the lowest, and the diffusion of the velocity gradient of the segment is the largest, and local eddy currents appear at the junction of the diffusion segment and the mixing segment, which can easily disturb the movement trajectory of the seed particles, reduce the particle movement speed, and then affect the uniformity and efficiency of the ejector seed supply.
In EDEM software, the average force and speed of the seeds were obtained within 0~3 s, as shown in Figure 16. The seeds are mainly affected by air drag in the X direction, gravity and buoyancy in the Y direction, and the resistance caused by the collision with the pipe wall in the Z direction. The higher the movement speed, the higher the ejector seeding efficiency. It can be seen from Figure 16a that the air drag force on the particles in the A-type ejector is the largest. Under the same conditions of gravity and air buoyancy, the wall resistance is the smallest, which indicates that the number of collisions between the particles and the pipeline is the least, and the particles are evenly distributed; the particles in the C-type injector are subjected to the largest forces in the Y and Z directions, indicating that they have the most collisions with the wall surface. In addition, it also verifies the negative effect of the local eddy current on the population movement trajectory and the uniformity of the injector seed supply in Figure 15c. influences. It can be seen from Figure 16b that the horizontal movement speed of seeds in the A-type injector is the highest, and its seed supply efficiency is the highest. In summary, the A-type Venturi ejector has the smallest pressure loss, the largest outlet airflow velocity, the best seed supply uniformity, and the highest seed supply efficiency.

5. Optimization Test of Working Parameters of Venturi Ejector

5.1. Orthogonal Design

In order to seek the optimal combination of working parameters of the Venturi ejector and optimize the uniformity of seed supply, the inlet air pressure and particle feeding efficiency are used as the test factors, and the ejector displacement variation and washing number are used as the test indicators to carry out two factors and five levels of full factors test. In the experiment, the variation range of inlet air pressure was set to be 0.8~2.4 kPa, and the variation range of the alfalfa seed feeding efficiency was 0.6~2.2 g/s. When the air pressure and particle feeding efficiency were stable, the outlet collection of the Venturi ejector was recorded every 5 s. The particle mass of each experiment was repeated 3 times to take the average value, and the outlet displacement variation was calculated. The factor level table is shown in Table 4.

5.2. Analysis of Test Results

The smaller the coefficient of variation of the Venturi ejector’s seeding rate, the better the seeding uniformity. The results of its range analysis (Table 5) show that the primary and secondary order of the influence of each factor on the coefficient of variation is A × B > A > B, and the optimal working parameter combination is A4B3. Analysis of variance was performed on the test results, as shown in Table 6, it can be seen that the inlet air pressure A and the particle feeding efficiency B have a significant effect on the coefficient of variation (p < 0.05), while the interaction term A × B has no significant effect on the coefficient of variation (p > 0.05).

6. Conclusions

A type of horizontal screw conveyor with a seed stirring function was designed to improve the uniformity of air-conveyed alfalfa seed collection and exhaust. EDEM software and Fluent software were used to jointly simulate the seed feeding process of the Venturi injector. The influence of the structure parameters of the diffuser on the working performance of the ejector was analyzed based on the changes in the pressure and velocity of the flow field inside the pipe and the velocity and force of the seed particles. The results showed that when the diffusion angle was 5°, the length of the diffusion section was 200 mm, the length of the mixing section was 50 mm, the pressure loss of the Venturi ejector was the minimum, the outlet air velocity was the maximum, the uniformity of seed supply was the best, and the seed supply efficiency was the highest. With the inlet air pressure and particle feeding efficiency as the test factors, and the coefficient of variation of the ejector discharge as the test index, a two-factor five-level all factor test was conducted, and the range and variance analyses were conducted. The results showed that the seed feeding rate and the inlet wind pressure had significant effects on the coefficient of variation (p < 0.05), while the interaction between them had no significant effect on the coefficient of variation (p > 0.05). Compared with the particle feeding efficiency, the inlet air pressure has a more significant effect on the coefficient of variation of the displacement. The optimal working parameter combination is an inlet air pressure of 1.6 kPa and a particle feeding efficiency of 1.8 g/s.

Author Contributions

Conceptualization, C.J.; methodology, W.M.; validation, W.M. and S.Z.; investigation, W.M. and X.Y.; resources, L.Z.; writing—original draft preparation W.M.; writing—review and editing, S.Z.; supervision, G.Z.; project administration, X.Y.; funding acquisition, C.J. All authors have read and agreed to the published version of the manuscript.

Funding

This research was funded by Shandong University of Technology Doctoral Research Startup Fund, grant number 4041/422015, and the National Key Research and Development Program of China, grant number 2021YFD2000502.

Institutional Review Board Statement

Not applicable.

Informed Consent Statement

Not applicable.

Data Availability Statement

Data sharing not applicable.

Conflicts of Interest

The authors declare no conflict of interest.

References

  1. He, W.T.; Brian, B.G.; Ward, N.S. Assessing alfalfa production under historical and future climate in eastern Canada: DNDC model development and application. Environ. Model. Softw. 2019, 122, 104540. [Google Scholar] [CrossRef]
  2. Omid, G.; Shahin, R.; Mohammad, S. Quantifying the environmental impacts of alfalfa production in different farming systems. Sustain. Energy Technol. Assess. 2018, 27, 109–118. [Google Scholar]
  3. Lu, C.Y.; Jing, Y.Y.; Zhang, H. Biohydrogen production through active saccharification and photo-fermentation from alfalfa. Bioresour. Technol. 2020, 304, 123007. [Google Scholar] [CrossRef] [PubMed]
  4. Zhao, C.H.; Liu, H.W.; Shi, S.L. Design and experiment research of small-scale mountain Alfalfa Seed drill. Appl. Mech. Mater. 2014, 488–489, 1100–1103. [Google Scholar] [CrossRef]
  5. Zhai, G.X.; Bao, D.S.; Wang, Z.J.; Yang, L.; Wang, Z.H.; Li, F.M. Design for Metering Device Key Parts of Pneumatic Grass Seeder. Trans. Chin. Soc. Agric. Mach. 2014, 45, 47–51. [Google Scholar]
  6. Yin, M.G.; Zhang, S.M.; Liu, C.L.; Wen, Q. Design and Experimental Analysis of New-type Force Feed for Alfalfa Sowing. J. Agric. Mech. Res. 2014, 1, 161–164. [Google Scholar]
  7. Zhao, T.; Zhao, C.H. Design and test research of small-scale alfalfa precision drill seeder for mountain. J. Gansu Agric. Univ. 2014, 49, 165–169. [Google Scholar]
  8. Mei, Z.X.; Xia, J.F.; Zhang, J.M.; Du, J.; Yang, Q.; Hu, M.J.; Luo, S.C.; Liu, Z.Y.; Li, Z.Y. Seeding performance of seed metering device with spiral tube scooping for rice and wheat. J. Huazhong Agric. Univ. 2020, 39, 136–146. [Google Scholar]
  9. Pan, X.J.; Dong, Z.Y.; Li, Y.; Li, C.; Bai, M.C.; Yang, S. Design and optimization of rice spiral groove seed metering device. Jiangsu Agric. Sci. 2020, 48, 233–239. [Google Scholar]
  10. Wu, Z.Y.; Cheng, Y.Y.; Gao, M.Y.; Zhang, Y.X.; Zhang, Z.X. Performance Analysis of Grain Vertical Screw Conveyor Based on EDEM. Sci-Tech Innov. Prod. 2022, 3, 62–64. [Google Scholar]
  11. Guo, C.; Pu, X.L. Numerical Simulation Analysis for Screw Conveyor Based on EDEM. J. Yanbian Univ. (Nat. Sci.) 2018, 44, 179–182. [Google Scholar]
  12. Yang, Q.L.; Li, H.W. Numerical analysis of particle motion in pneumatic centralized fertilizer distribution device based on CFD-DEM. Trans. Chin. Soc. Agric. Mach. 2019, 50, 81–89. [Google Scholar]
  13. Han, D.D.; Zhang, D.X.; Yang, L.; Li, K.H.; Zhang, T.L.; Wang, Y.X.; Cui, T. EDEM-CFD simulation and experiment of working performance of inside-filling air-blowing seed metering device in maize. Trans. Chin. Soc. Agric. Eng. 2017, 33, 23–31. [Google Scholar]
  14. Ding, L.; Yang, L.; Zhang, D.X.; Cui, T.; Gao, X.J. Design and Experiment of Seed Plate of Corn Air Suction Seed Metering Device Based on DEM-CFD. Trans. Chin. Soc. Agric. Mach. 2019, 50, 50–60. [Google Scholar]
  15. Siamak, A.; Mehdi, B.; Majid, R. CFD-DEM approach to investigate the effect of drill pipe rotation on cuttings transport behavior. J. Pet. Sci. Eng. 2015, 127, 229–244. [Google Scholar]
  16. Gao, X.J.; Zhou, Z.Y.; Xu, Y. Numerical simulation of particle motion characteristics in quantitative seed feeding system. Powder Technol. 2020, 67, 643–658. [Google Scholar] [CrossRef]
  17. Zhang, D.H. The Optimization Research of Screw Conveyor; Dalian University of Technology: Dalian, China, 2006. [Google Scholar]
  18. Hu, K.J. The Research on Venturi Feeder in Pneumatic Conveying System; Qingdao University of Science & Technology: Qingdao, China, 2013. [Google Scholar]
  19. Gao, X.J.; Xu, Y.; Yang, L. Simulation and Experiment of Uniformity of Venturi Feeding Tube Based on DEM-CFD Coupling. Trans. Chin. Soc. Agric. Mach. 2018, 49, 92–100. [Google Scholar]
  20. Wang, Q.L.; Wang, Z.H.; Wu, W.Y. Structure optimization of contrsction and diffusion section of venturi fertillizer based on CFD. Water Sav. Irrig. 2019, 9, 46–52. [Google Scholar]
  21. Ma, W.P.; You, Y.; Wang, D.C. Parameter Calibration of Alfalfa Seed Discrete Element Model Based on RSM and NSGA-Ⅱ. Trans. Chin. Soc. Agric. Mach. 2020, 51, 136–144. [Google Scholar]
  22. Xia, R.X. The Research on Mining Truck Loading Process Using EDEM and ADAMS Joint Solution; Northeastern University: Shenyang, China, 2015. [Google Scholar]
  23. Wang, S.Y.; Hu, Z.C.; Peng, B.L. Simulation of Auto-follow Row Detection Mechanism in Beet Harvester Based on ADAMS. Trans. Chin. Soc. Agric. Mach. 2013, 44, 62–67. [Google Scholar]
  24. Lei, X.L. Design and Working Mechanism of Air-Assisted Centralized Metering Device for Rapeseed and Wheat; Huazhong Agricultural University: Wuhan, China, 2017. [Google Scholar]
Figure 1. Alfalfa Pneumatic Collector: (a) General Assembly Diagram, and (b) Disassembly Diagram 1. Fan. 2. Air valve. 3. Venturi ejector. 4. Conveying elbow. 5. Bellows. 6. Conical distribution head. 7. Seed guide. 8. Horizontal screw conveyor. 9. Seed drop. 10. Front screw cap. 11. Front end stop. 12. Seed box. 13. End stop. 14. End screw cap. 15. Seed stirring wheel. 16. Seed stirring rod. 17. Auger.
Processes 10 02281 g001
Figure 2. Seed stirring mechanism of seed feeder: 1. Auger. 2. Seed stirring wheel. 3. Seed stirring rod.
Processes 10 02281 g002
Figure 3. Seed particle velocity decomposition diagram.
Processes 10 02281 g003
Figure 4. Venturi ejector: 1. Air inlet. 2. Shrinking tube. 3. Throat tube. 4. Feeding tube. 5. Diffusion tube. 6. Mixing tube.
Processes 10 02281 g004
Figure 5. Alfalfa seed model.
Processes 10 02281 g005
Figure 6. Discrete element model of screw conveyor: (a) conveyor model with a seed stirring mechanism, and (b) conveyor model without a seed stirring mechanism.
Processes 10 02281 g006
Figure 7. Virtual prototype model of the horizontal screw conveyor.
Processes 10 02281 g007
Figure 8. Seed velocity distribution in horizontal screw conveyor: (a) there is a stirring mechanism; (b) there is no stirring mechanism.
Processes 10 02281 g008
Figure 9. Comparative analysis of seed movement characteristics: (a) variation of population linear velocity with time, (b) variation of population angular velocity with time, (c) variation of the compressive force on the population with time, and (d) variation of the seed mass flow rate with time.
Processes 10 02281 g009
Figure 10. Grid structure of the Venturi injector.
Processes 10 02281 g010
Figure 11. Coupled model validation test bench: 1. Fan. 2. Air valve. 3. Rack. 4. Venturi. 5. Seed drop. 6. Alfalfa seeds. 7. Motor. 8. Controller. 9. Seed stirring wheel. 10. Seed stirring rod. 11. Horizontal screw conveyor.
Processes 10 02281 g011
Figure 12. Comparison of bench test and simulation test results.
Processes 10 02281 g012
Figure 13. Characteristics of flow field in jet pipe: (a) axial static pressure change and (b) variation of axial velocity.
Processes 10 02281 g013
Figure 14. Dynamic pressure field nephogram: (a) type A, (b) type B, and (c) type C.
Processes 10 02281 g014
Figure 15. Velocity field nephogram: (a) type A, (b) type B, and (c) type C.
Processes 10 02281 g015
Figure 16. Force and motion characteristics of particles: (a) particle stress and (b) particle velocity. Notes: F is the combined force of the seeds; F x is the force in the X direction of the seed; F y is the force in the X direction of the seed; F z is the force in the Z direction of the seed; V is the combined velocity of the seeds; V x is the speed of the seed in the X direction; V y is the speed of the seed in the Y direction; V Z is the speed of the seed in the Z direction.
Processes 10 02281 g016
Table 1. Parameters of discrete element model for alfalfa seeds.
ParameterNumerical Value
Seed density/kg·m31231
Poisson’s ratio0.50
Seed–plastic collision recovery factor0.50
Seed–plastic coefficient of static friction0.50
Seed–plastic coefficient of rolling friction0.25
Interspecies collision recovery factor0.47
Interspecies static friction coefficient0.24
Interspecies rolling friction coefficient0.08
Table 2. Seed motion characteristic parameters.
ParameterThere Is a Stirring MechanismNo Stirring Mechanism
Average linear velocity/m·s−10.012360.01195
Linear velocity coefficient of variation0.062630.11808
Average angular velocity/rpm71.0882774.28534
Variation coefficient of angular velocity0.043550.11241
Average compressive force/N0.003940.00616
Compression force variation coefficient0.114980.46277
Mass flow rate average/g·s−16.529754.95369
Mass flow rate coefficient of variation0.297150.32284
Table 3. Different diffusion angles correspond to structural parameters.
TypeDiffusion
Angle β
Diffuser
Length   L 1 /mm
Mixing   Tube   Length   L 2 /mm
A20050
B10°100150
C15°65185
Table 4. Experimental factors and levels.
LevelFactor
Inlet Air Pressure/Pa Alfalfa   Seed   Feeding   Efficiency / g s 1
110000.6
212001.0
314001.4
416001.8
518002.2
Table 5. Test design scheme and results.
Serial NumberFactorCoefficient of Variation of Seed Quantity/%
ABNullA×BNullNull
11111118.03
21222227.09
31333338.21
41444418.11
51555558.19
62123458.14
72234517.63
82345128.27
924512310.05
1025123410.14
113135247.55
123241357.43
133352416.82
143413527.31
153524135.24
164142535.01
174253144.01
184314253.72
194425318.26
204531424.36
215154325.85
225215435.44
235321548.51
245432159.58
255543218.78
Coefficient of variationk17.937.04 7.73
k28.856.32 7.29
k36.877.11 6.11
k45.078.66 7.54
k57.637.34 1.62
R3.782.34 7.73
Table 6. Variance analysis of test: “**” indicates extremely significant, and “*” indicates significant.
Test IndexSource of VarianceSum of Squared DeviationsDegrees of FreedomMean SquareFpSalience
Displacement Coefficient of VariationModel65.34324125.445275.3175850.0035**
A36.2864949.0716238.8589040.0014*
B16.1885544.0471383.9522380.0285*
A × B10.6795742.6698932.6072870.0889
residual12.28814121.024012
sum77.6313824
Publisher’s Note: MDPI stays neutral with regard to jurisdictional claims in published maps and institutional affiliations.

