1. Introduction
Therapeutic Fc-fusion proteins are produced by binding the Fc region of a monoclonal antibody to the protein sequence of desired proteins and are becoming increasingly important as a type of antibody derivative. Since therapeutic proteins with molecular weights less than approximately 60 kDa, such as cytokines, enzymes, and active peptides, are removed as a result of excretion and metabolism, there have been many attempts to combine the protein with the antibody Fc fragment to extend its half-life [
1,
2]. These fused polypeptides have high value as good therapeutic agents and can be used as compounds with various structural features [
3,
4,
5]. The protein of interest can be fused to both the amino terminus (N-terminus) or carboxyl terminus (C-terminus) of the Fc region and is typically expressed in mammalian cell systems such as Chinese hamster ovary cells (CHO cells). In this case, the proteins of interest and the Fc region are both glycosylated [
6]. A polypeptide fused to both amino terminals of the Fc region can be called a bivalent Fc-fusion protein [
7,
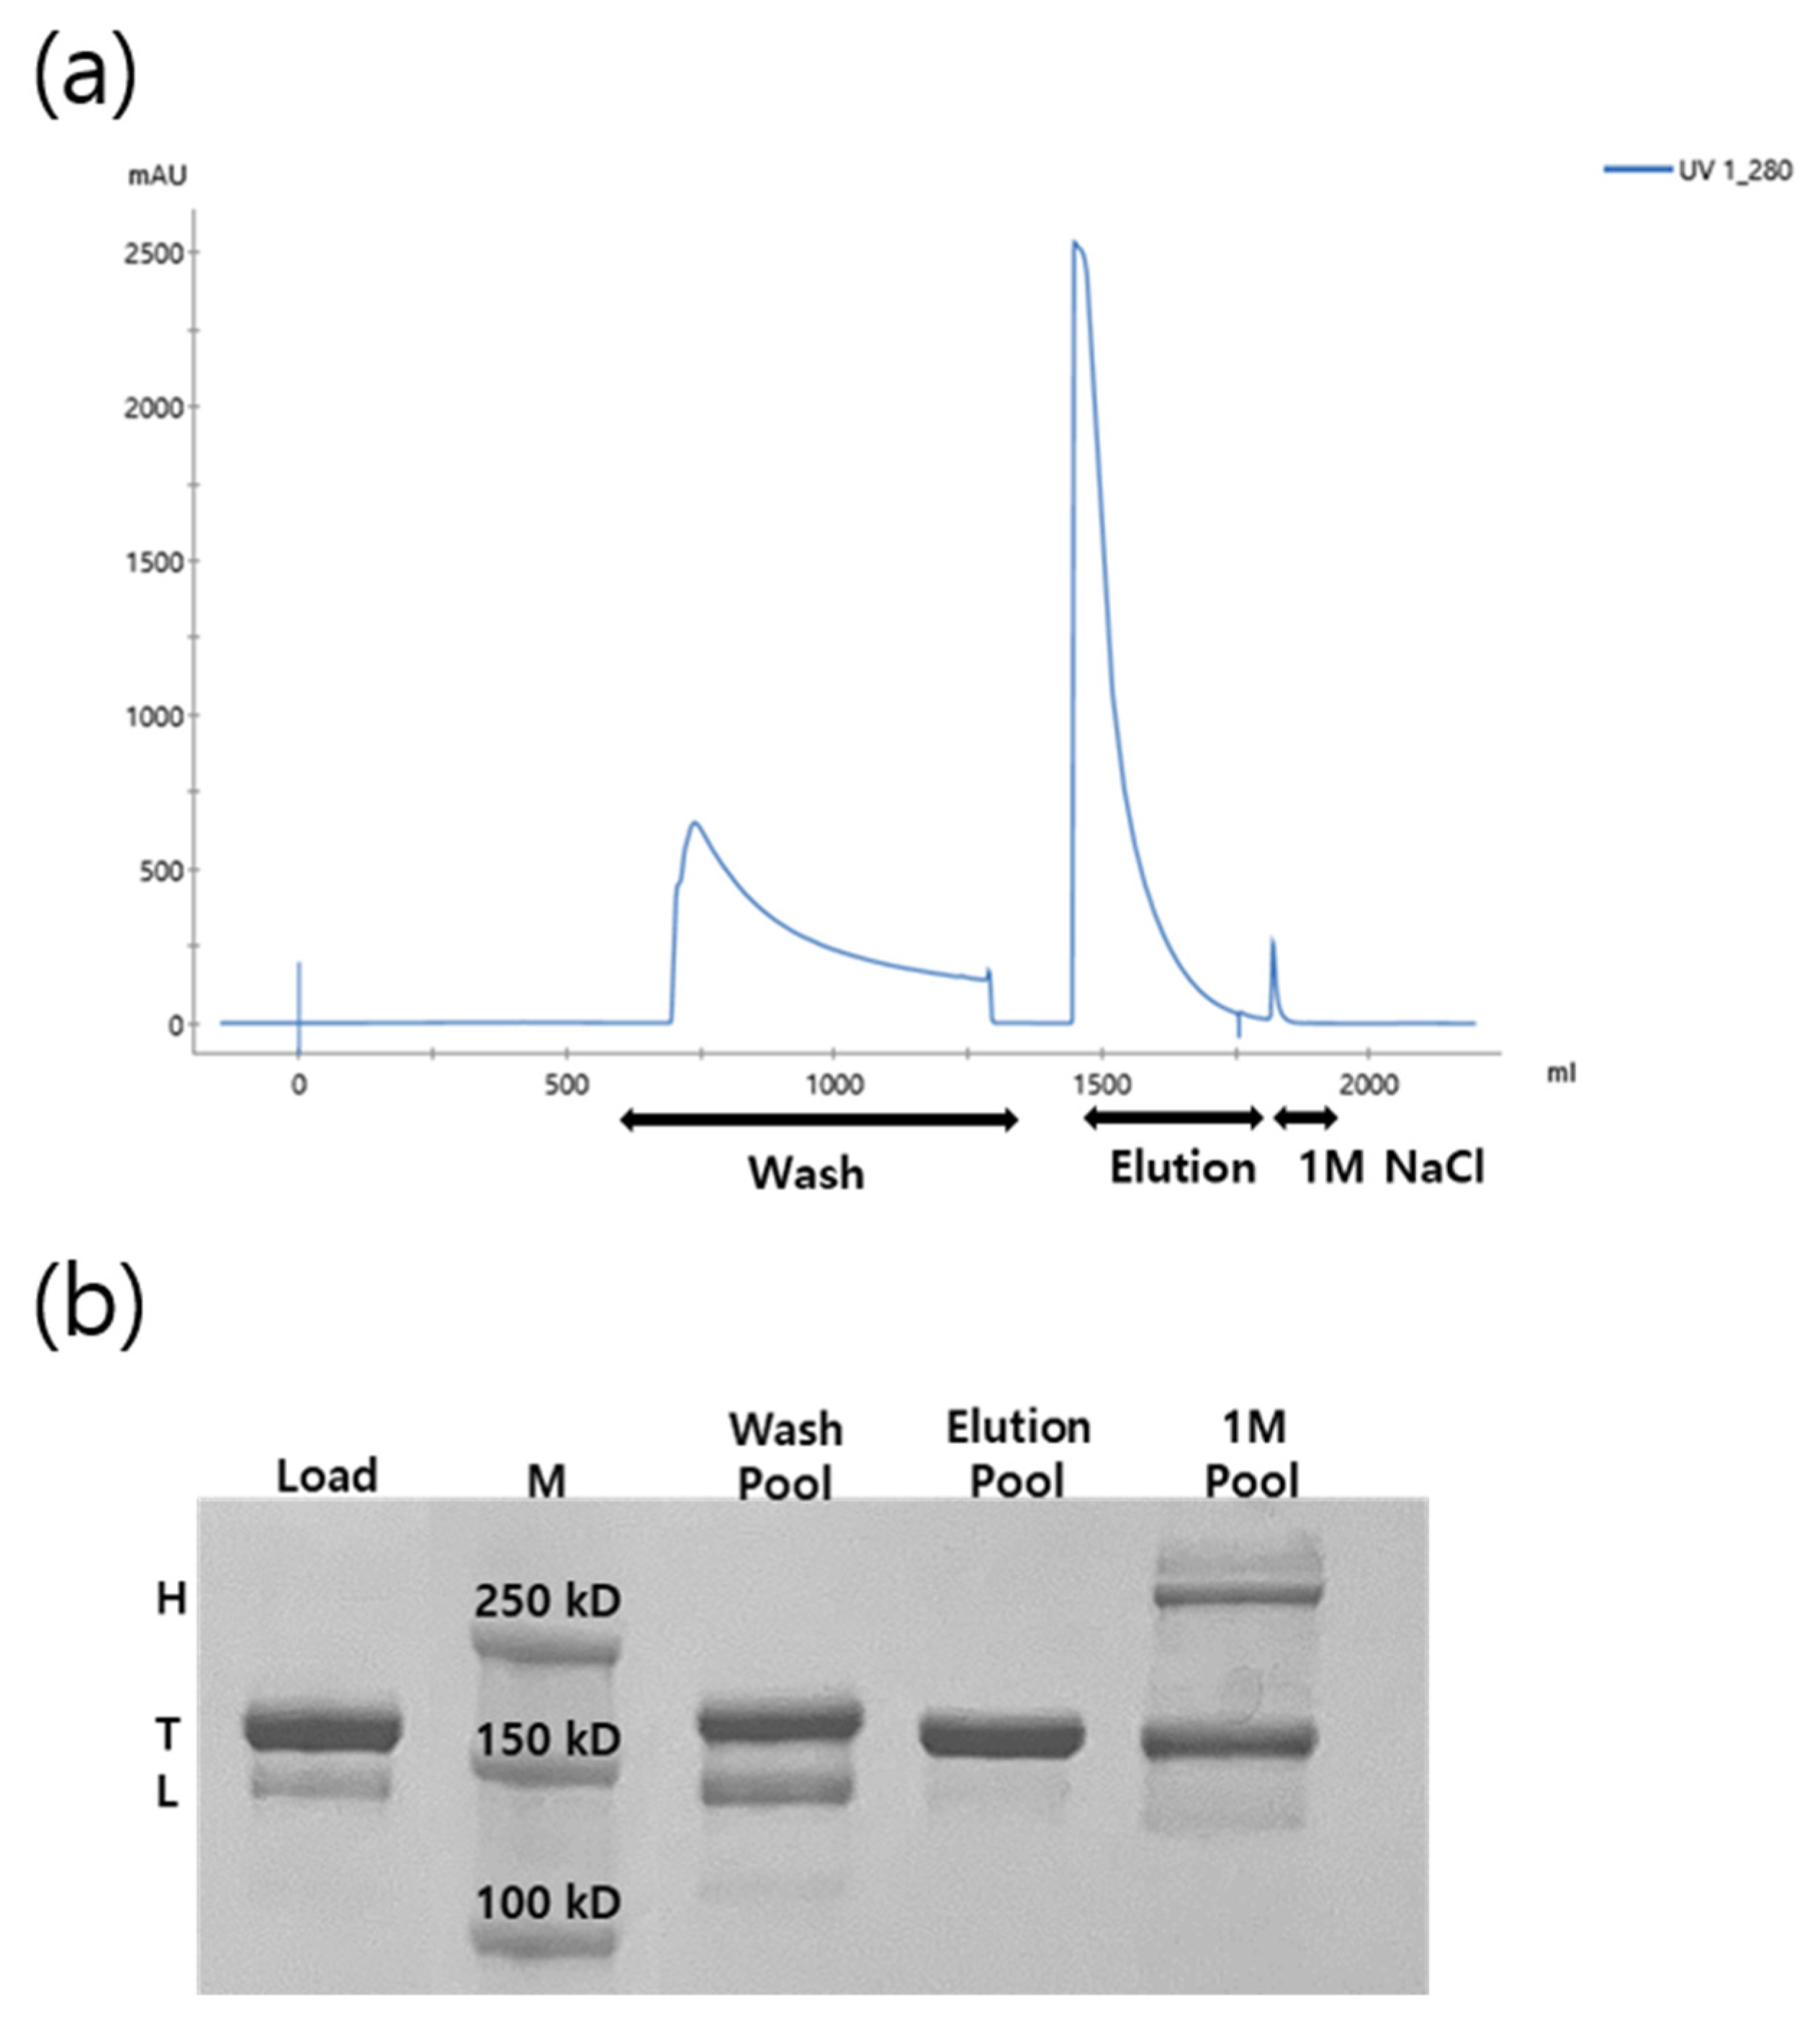
8], and the Fc region is recognized by staphylococcal protein A, meaning that the Fc-fusion protein can be easily recovered, even at low concentrations, via protein A affinity chromatography (
Figure 1a).
For proteins with large domain structures, genetic engineering of Fc-fusion proteins is often required to reduce technical problems, such as stability and solubility [
9,
10]. Nevertheless, because the Fc-fusion protein is designed by connecting proteins that do not naturally bind, physical instability can occur owing to the interactions between domains [
11]. Fc-fusion proteins are made using a peptide linker (e.g., GGGGS) at the N-terminus or C-terminus of the Fc region of human IgG. These altered structures can generate product-related impurities such as a high molecular weight (HMW), truncated form, or low molecular weight (LMW), which occur frequently during cell culture [
12,
13]. In addition, HMW is caused by high sensitivity to low pH following the purification process of protein A chromatography [
14]. There are at least three possible solutions to overcome these difficulties: (1) in the case of using peptide linkers, the length or sequence of the linker can be optimized to improve the stability of the fusion protein [
15,
16]; (2) identifying and engineering the cleavage site of the protein to be fused so that it can be attached to the Fc region; (3) identifying conditions that can minimize HMW or LMW proteins in the cell culture and purification process during the process development stage [
14,
17,
18].
Perfusion cell culture can lower product-related impurities, especially the LMW protein ratios [
19]. However, it is not easy to eliminate the HMW and LMW proteins during the purification of Fc-fusion proteins while maintaining acceptable process yields under normal bind-elute mode conditions. Anion exchange chromatography is generally known to remove residual protein A, host cell protein (HCP), host cell DNA (HCD), endotoxin, and viruses and is not effective in eliminating HMW and LMW proteins, which are frequently observed in Fc-fusion proteins [
20,
21,
22]. Cation-exchange chromatography is more effective in purifying product-related impurities for target proteins with basic properties (pI > 7) [
23,
24]. Additional removal of HCP is possible depending on the operating pH of the cation-exchange chromatography [
25]. Therefore, more studies should be conducted on the separation of product/process-related impurities in peptide Fc-fusion proteins using cation exchange chromatography. In this study, CHO cells were cultured and purified by affinity chromatography to produce peptide Fc-fusion proteins. For further purification, strong cation exchange chromatography was performed using Capto
TM SP ImpRes, Fractogel
® EMD SO
3− (M) resin under various salt and pH conditions to establish parameters for the efficient separation of product/process-related impurities. Based on these results, the design of experiments (DoE) was used to confirm the conditions for the appropriate recovery and purity of the target protein. Finally, the robustness of the investigated parameters was confirmed by producing two (2) batches using a scaled up column.
2. Materials and Methods
2.1. Materials
Sodium acetate, sodium citrate, sodium phosphate dibasic, sodium phosphate mono-basic, Tris(hydroxymethyl) aminomethane, sodium chloride, Fractogel® EMD SO3− (M), and depth filter (D0SP) were purchased from Merck KGaA (Darmstadt, Germany). The CaptoTM SP ImpRes was purchased from Cytiva (Uppsala, Sweden). An analytical size-exclusion column (TSK gel G3000, 0008541) was purchased from TOSOH Bioscience (Tokyo, Japan). The 4–12% Bis-Tris gel NuPAGE®, MES SDS running buffer, SeeBlue® plus2 molecular weight marker protein mix, iBlot ® 2 PVDF mini stack, iBlot ® 2 gel transfer device, and goat anti-rabbit IgG-AP conjugate were purchased from Invitrogen. 1-StepTM NBT/BCIP was purchased from Thermo Scientific (Rockford, IL, USA). The third-generation Chinese hamster ovary 3rd generation HCP kit was purchased from Cygnus (Southport, NC, USA). The peptide Fc-fusion protein was expressed in engineered CHO cells using perfusion culture at GI-Cell (Gyeonggi-Do, Korea).
2.2. Expressions of the Peptide Fc-Fusion Protein in CHO Cells Using Perfusion Culture
In all experiments, the peptide Fc-fusion protein-producing CHO cell line was used. Research Cell Bank (RCB) was manufactured in consideration of quality and culture titer at GI-Cell, Co., and 1 mL cryo vials containing frozen CHO cells were thawed at 37 °C and inoculated into 10 mL of a serum-free medium. The BalanCD cell culture medium was used for perfusion cell culture. CHO cells were initially passaged every 3 days in a shake flask at 37 °C, 100 rpm, and 5% CO2 and subsequently transferred to a 2 L bioreactor (Sartorius). The 2 L bioreactor was equipped with a single-use ATF system (Repligen, Waltham, MA, USA) connected to a 0.22 µm hollow fiber cartridge. The set-point for pH, temperature, and DO were 7.2, 32 °C, and 30%, respectively. Three days after inoculation, perfusion culture was initiated at 1 vessel volume per day (vvd). The cell viability of harvested cell culture fluid (HCCF) was more than 95%, and cells were cultured for 20 days. HCCF was filtered using a 0.22 µm microfilter and was loaded onto the Protein A column for 48 h after storage at 4–8 °C. Cell density and viability were measured using VI-Cell XR (Beckman Coulter, CA). HCCF were stored at 2–8 °C, and protein A chromatography was performed within 72 h. The total molecular weight of the peptide Fc-fusion protein was 150 kDa and the calculated pI was 9.18.
2.3. Analytical Size Exclusion Chromatography
A TSK G3000SWxL (7.8 mm × 30 cm, 5 µm) size-exclusion column was used to measure the monomer and HMW content. A sample of 0.5–1 g/L was loaded onto a Waters e2695 HPLC instrument (Waters Corporation, Milford, MA, USA) at a flow rate of 0.5 mL/min, and the mobile phase used was 200 mM Na-phosphate, 500 mM NaCl, pH 6.7.
2.4. N-Terminal Sequencing (Edman Sequencing)
Protein samples were subjected to SDS-PAGE for N-terminal sequencing. Protein samples were transferred from SDS-PAGE to a PVDF membrane, and then the bands were cut and sent for N-terminal sequencing. After treatment with Phenylisothiocyanate (PITC) and cleavage with acid, the resulting phenylthiohydantoin (PTH) derivative was identified after treatment with phenylisothiocyanate and cleavage with acid. The amino acid sequence was sequentially confirmed by injection into HPLC using a PTH-C18 column.
2.5. SDS-PAGE and Western Blot Analysis
SDS-PAGE (non-reduced) was performed using NuPAGE® 4–12% Bis-Tris gels (Invitrogen, CA, USA). MES SDS running buffer was used and transferred to a PVDF membrane for Western blot analysis. To detect each fragment in the N-terminus, rabbit target protein antibodies were incubated with the PVDF membrane. Goat anti-rabbit IgG-AP conjugate was added and visualized using 1-StepTM NBT/BCIP.
2.6. HCP ELISA
Host cell proteins were detected using a commercial plate ELISA specific to the CHO cell line. The samples were diluted with dilution buffer and analyzed according to the Cygnus standard assay protocol. Absorbance (OD) was measured at 450 nm/650 nm using an ELISA reader (SpectraMax iD3 Multi-Mode Microplate Reader). The HCP reduction rate was calculated using Equation (1) as follows:
2.7. Protein A Chromatography
HCCF was loaded onto the Protein A column (MabselectTM PrismA) at 30 g protein/L of resin. The column was washed with a buffer containing 1 M NaCl and elution was performed using a low-pH glycine buffer. The pH was further lowered for the elution pool for virus inactivation and adjusted with 0.5 M Tris buffer for neutralization. The HCCF titer was measured using an analytical protein A column. The protein concentration from the protein A elution pool to the cation exchange (CEX) elution pool was measured at 280 nm using a GENESYS 180 spectrophotometer (GENESYS 1XX, Thermo Scientific).
2.8. Cation Exchange Chromatography
The separation of product/process-related impurities by cation exchange chromatography was investigated using two strong cation resins (CaptoTM SP ImpRes, Fractogel® EMD SO3− (M)). The starting material used for the experiment was the eluted pool from the protein A chromatography, followed by inactivation and neutralization steps. pH adjustment for different loading conditions into the CEX column during the neutralization step was done using a 0.5 M Tris buffer. The AKTA Avant 150 system (Cytiva, Uppsala, Sweden) and Tricon 10/150 column (Cytiva) were used for purification. Each resin was packed into a bed of height 14 cm (10.99 mL), and the resin was used for DoE.
As an initial evaluation test to remove product/process-related impurities, the level of removal ability under various pH and salt conditions was evaluated. The experiments were performed using a 1M NaCl linear gradient (20 CV) at pH 5, 6, 7, and 8, using a flow rate of 200 cm/h (residence time:4.2 min), and each elution fraction was analyzed and evaluated. The target proteins were loaded onto the column with 10 g/L resin. Based on the analyzed results, a gradient elution profile was obtained and a step gradient mode was applied as an additional strategy to simultaneously remove product/process-related impurities. The wash step condition was 10 CV cycles with 50 mM sodium citrate, conductivity 50 mS/cm, pH 6. The elution step conditions were 50 mM sodium citrate, conductivity of 60 mS/cm, pH of 6. In addition, the effect of each factor was confirmed by changing the DBC loading to 10, 20, and 30 g/L of resin.
2.9. Design of Experiments (DoE)
Design of experiments (DoE) conditions were set up to optimize the removal of HMW proteins and additional HCP in the elution step. The process parameters for the DoE were selected as dynamic binding capacity (DBC), wash step length, and elution conductivity. A total of 17 runs (center point: three runs) were performed with a composite central face (CCF) design on the response surface model (RSM), and the effect of each factor on the quality of the elution pool was evaluated. Statistical analysis was performed using the JMP® (Version 15.1.0) software to confirm the significance of the mode and process parameters.
2.10. Confirmation of Process Robustness
Process robustness was confirmed by scaling up the washing and elution conditions. After purification of Fc-fusion proteins using protein A chromatography, the virus inactivation and neutralization steps were performed. In addition, depth filtration was performed to remove precipitation that occurred as the pH increased. This material was loaded onto the Fractogel® EMD SO3− (M) resin at 21 g/L (column 2.6 cm diameter × 15 cm height). The column was equilibrated with 50 mM sodium citrate buffer (pH 6.0) and the sample was loaded. In the wash step, LMW protein was removed using 50 mM sodium citrate, conductivity 50 mS/cm, pH 6.0, and then elution was performed with 50 mM sodium citrate, conductivity 64 mS/cm, pH 6.0 buffer to remove HCP and HMW proteins. Two (2) batches were produced to check the removal level of the product/process-related impurities.
3. Results and Discussion
3.1. Identification of Product-Related Impurities in Peptide Fc-Fusion Protein
An Fc-fusion protein with a theoretical molecular weight of 150 kDa and pI value of 9.18 was prepared by adding the target peptide to the N-terminus and C-terminus, respectively. Product-related impurities were identified during the fed-batch culture of CHO cells, and approximately 7–8% of HMW appeared on the 12th day of cell culture. In addition, it was confirmed that the molecular stability decreased when the culture period exceeded five days, and the ratio of LMW proteins increased with time. It was determined that these product-related impurities could not be minimized with fed-batch culture; therefore, the cell culture process was developed using perfusion culture. To check the level of product-related impurities in the peptide Fc-fusion protein, the eluted pool from protein A chromatography purification of the perfusion culture HCCF (harvested cell culture fluid (HCCF) was used. For clear identification of product-related impurities, such as HMW and LMW proteins, the protein A elution pool was stored at room temperature for 4 days and then analyzed. Size-exchange chromatography-high-performance liquid chromatography (SEC-HPLC), SDS-PAGE, Western blotting, and N-terminal sequencing were performed for analysis.
As a result of SDS-PAGE and Western blotting to check product-related impurities, HMW was found to be approximately 300 kDa, the main band around 170 kDa (glycosylation consideration), and LMW around 145 kDa. The same band sizes were detected using SDS-PAGE and Western blotting (
Figure 2a,b). For further analysis of LMW proteins, N-terminal sequencing was performed to confirm the cleavage site in the protein sequence. Protein samples of the main band and LMW band were developed by SDS-PAGE and then transferred to a PVDF membrane, after which N-terminal sequencing was performed. Based on this analysis, the N-terminal amino acid sequence of the main band was confirmed to be the same as the expected sequence (RSKQR). In contrast, it was confirmed that peptide linker sequences, such as SGGGG or GGGS, were present on the N-terminal side of the target protein (
Figure 2d). According to the SDS-PAGE results, the main band and the LMW band seemed to have a difference of approximately 25–30 kDa, and it can be assumed that the LMW protein was cleaved to a size similar to that of the peptide designed on one arm of the N-terminal side (
Figure 1b).
In addition, because HMW protein is a major impurity causing immunogenicity among the purity items of biopharmaceuticals, appropriate controls are needed. To remove HMW proteins in this study, CEX was used as the first polishing step, and the HMW protein ratio in the Protein A elution pool, which was used as the starting material of CEX, was confirmed by SEC-HPLC. It was confirmed that approximately 3–5% of HMW proteins were present in the protein A pool.
3.2. Initial Screening Using Linear Gradient Mode for Impurity Clearance
Physical instability of Fc-fusion proteins appears especially during cell culture, and the problem of the formation of product-related impurities must be addressed. Additionally, it is necessary to evaluate chromatography, which can remove as much process-related impurities as possible. If several impurities can be removed simultaneously in the first polishing step, the burden of impurity removal in the second polishing step can be reduced, and a relatively simple process can be performed. The use of a strong cation exchange resin in the first polishing step is known to successfully reduce the level of HMW proteins. However, LMW is structurally similar to the target protein, with a difference of approximately 25–30 kDa, and may need to give up a considerable level of yield for its removal. Two strong cation exchange resins (CaptoTM SP ImpRes, Fractogel® EMD SO3− (M)), pH, and conductivity were selected and evaluated to confirm the conditions that can simultaneously reduce HMW and LMW proteins.
Both strong cation-exchange resins are advantageous in that a high flow velocity is possible, with only differences in the matrix and particle size. CaptoTM SP ImpRes consists of agarose with an average particle size of 36–44 µm, whereas Fractogel® EMD SO3− (M) consists of crosslinked polymethacrylate with an average particle size of 40–90 µm. Unlike cation-exchange resins of other particle sizes that require processing at a low linear flow rate, both resins can be processed at a linear flow rate of 200 cm/h or higher, thereby shortening the processing time.
For the evaluation of product/process-related impurity resolution, buffer A was set to several mobile phase pH conditions (pH 5, 6, 7, and 8), and buffer B was given for 20 CV cycles in linear gradient mode by adding 1M NaCl to buffer A. After equilibrium was achieved with each mobile phase pH buffer (pH 5, 50 mM sodium acetate, pH 6, 50 mM sodium citrate, pH 7, 50 mM sodium phosphate, pH 8, 50 mM Tris), the sample was loaded at a flow rate of 200 cm/h with 10 g/L of resin. Because all pH conditions were lower than the molecular pI value, the sample was positively charged, resulting in almost no protein loss during the loading step. As a result of performing a NaCl linear gradient of 20 CV for the two resins and checking the elution peak, three peaks were confirmed for Capto
TM SP ImpRes and one peak was confirmed for Fractogel
® EMD SO
3− (M). From the actual UV peak shape, it was expected that impurities such as HMW and LMW proteins would be better separated on the Capto
TM SP ImpRes; however, based on SDS-PAGE analysis, it was found that the separation was remarkably better in Fractogel
® EMD SO
3− (M). From this result, it can be predicted that on the Capto
TM SP ImpRes resin, the target protein and LMW proteins were eluted together, resulting in considerable yield loss. In terms of HMW protein removal ability, it was confirmed that Fractogel
® EMD SO
3− (M) was more efficient when comparing fractions #5–6 of Capto
TM SP ImpRes resin to fractions #6–7 of Fractogel
® EMD SO
3− (M) (
Figure 3a–d). This appears to be because the resin has greater selectivity for HMW protein removal owing to non-specific hydrophobic interactions with the backbone [
26].
All mobile phase pH buffers using Fractogel
® EMD SO
3− (M) resin showed similar resolution and SDS-PAGE results but showed different trends in the HCP profile.
Figure 3e shows the gradient elution and fractionation, and the corresponding HCP and HMW levels for each fraction. Because some HCPs are eluted at the beginning of Fc-fusion protein elution, it is possible to maximize the purity and yield by optimizing the peak collection considering both ends of the elution peak. It was confirmed that HCP and HMW proteins eluted more widely around the main peak at pH 5 and 6 than at pH 7 and 8. However, because elution at pH 5 requires higher conductivity, pH 6 was used, considering the increase in the dilution buffer of the loading sample before the second polishing step. Therefore, we continued our efforts to improve the process by using Fractogel
® EMD SO
3− (M) resin in step gradient mode under pH 6 conditions.
3.3. Purification Development Using Step Gradient Mode for Impurity Clearance
Selectivity is tested in linear gradient mode, but the process operation is usually performed in step gradient mode for simplicity of manufacturing. Based on the results of a purification run using a linear gradient mode, the step gradient mode can be optimized to separate LMW and HMW proteins from the target protein. The conductivity required for the washing step to remove LMW proteins was investigated using the previously selected Fractogel
® EMD SO
3− (M) in buffer pH 6. The truncated form, such as the LMW protein, eluted earlier than the target protein, and the LMW protein was removed at approximately 48–50 mS/cm. In particular, the shape of the wash peak showed a tendency for the UV to rise and fall again within the initial 3 CV washes, and it was confirmed that most of the LMW proteins were removed from the raised UV peak (
Figure 4). Although LMW separation was sufficiently achieved with the high-conductivity wash step of the step gradient, it was necessary to confirm whether additional HCP could be removed with an increase in the wash CV. In the elution step, HMW proteins were attached to the column, and only the desired target protein was separated. When elution was performed at approximately 60 mS/cm, a purity greater than 98.5% was obtained. Under these conditions, the yield was 45–50%, but it was clear that the separation of LMW and HMW proteins from the target protein was more effective with Fractogel
® EMD SO
3− (M) resin.
Additional experiments were performed to evaluate the LMW and HMW resolutions depending on the column loading capacity (10 g/L, 20 g/L, and 30 g/L of resin). As a result of proceeding under the conditions previously confirmed above (wash step:50 mS/cm, elution step:60 mS/cm), the yield was similar to 45% under the loading capacity conditions of 10 and 20 g/L of resin, whereas for 30 g/L of resin, the wash peak showed a higher height than the elution peak, and the yield decreased to approximately 35% (
Table 1). Based on this result, it can be speculated that with 30 g/L of resin, the material was overloaded onto the Fractogel
® EMD SO
3− (M) resin, and the amount of partially attached target protein increased. Through the wash step pool of SDS-PAGE for each DBC condition, it was confirmed that the ratio of the target protein increased as the DBC increased (
Figure 5).
3.4. Elution Optimization Using Design of Experiments (DoE)
The DoE method was applied to optimize the yield and purity of the peptide Fc-fusion proteins in CEX. It is important to design the experimental conditions to select the factors affecting yield and purity. For the removal of LMW proteins, we fixed the wash conductivity at 50 mS/cm, the condition found in the step gradient mode, and focused on finding elution conditions that could maximize the removal of HMW proteins and HCP. Although DBC is not a frequently used factor in DoE design, the DBC 30 g/L of resin in step-gradient experiments affected the overall yield reduction. When considering the cost of goods (CoG), the step yield must be at least 55% to maintain an appropriate overall yield using the F/T mode in the second polishing step. It was determined that a proper range could be obtained between 20 and 30 g/L of resin, and DBC was set as a design factor. Additionally, it was necessary to determine how washing the CV affected the yield and HCP removal rate. Experiments were performed with a wash CV range set from 6 to 10 CV. Finally, elution conductivity is known to be a critical factor that ensures a high yield and purity of the target proteins in CEX. In preliminary studies, when the elution conductivity was 63 mS/cm, the yield was over 55%; however, when proceeding with a higher conductivity, the ratio of HMW proteins and HCP increased. We attempted to check the level of impurity removal by setting the elution conductivity range to 55–69 mS/cm (
Table 2). The linear flow rate for all chromatography steps, including binding, washing, and elution, was maintained at 200 cm/h, as this was not observed to be an important factor for the yield and purity.
Composite central face (CCF) design could provide more satisfactory results in achieving the proposed goal than other optimization designs, such as Box–Behnken [
27]. The responses chosen for this optimization were the yield, purity (monomer content), and HCP reduction rate. After setting the factor range, the peptide Fc-fusion protein purification strategy was optimized using CCF design (
Table 3). The ranges chosen for the three factors were set appropriately, considering that they were sensitive enough to the chosen elution conductivity, especially for HMW protein removal under broad ranges. Statistical analysis was performed using JMP
® (Version 15.1.0) software. As a result of analysis using the least squares fit algorithm, an excellent model was obtained for yield (R
2 = 0.98, R
2Adj = 0.96, ANOVA model
p-value < 0.0001) and purity (monomer contents) (R
2 = 0.97, R
2Adj = 0.93, ANOVA model
p-value 0.0001). However, for the HCP reduction rate (R
2 = 0.71, R
2Adj = 0.34, ANOVA model
p-value 0.2004), the R
2 value was less than 0.8, and the ANOVA model
p-value was relatively high, making it difficult to judge whether the model was properly established. For purity (monomer content) and yield, both DBC and elution conductivity were found to be important factors (main effect) with statistically significant
p-values (
p < 0.05). In terms of the HCP reduction rate, only DBC (
p < 0.05) was applicable (
Table 4).
The prediction profile of the model shows that the yield is affected by elution conductivity, but the yield decreases as the DBC rises above 20 g/L of resin. An increase in DBC results in the loss of many target proteins in the washing step, which is likely related to the HCP reduction rate.
Figure 3e shows the impurity level of each fraction; a high UV peak in the wash step can further remove HCP present in front of the main UV peak. Considering both the yield and the HCP reduction rate, a suitable range for DBC is expected to be approximately 20 g/L of resin. The purity (monomer content) is most affected by the elution conductivity. At high conductivity, the monomer content tends to decrease, and it is important to find a condition in which a high monomer content is maintained after the column is scaled-up. Wash CV had no significant
p-value in all responses, and there was no change under different conditions in the prediction profile, so the process was fixed to 8 CV (
Figure 6).
An important part of the development of separation processes is the design of a robust process that can remove impurities. In other words, the range of factors in which impurities can be removed should be appropriately set. The range was confirmed using the contour profile of the model set for the yield, purity (monomer content), and HCP reduction rate. The limited criteria for the response were determined through statistical analysis of several experiments, and the yield was >55%, purity (monomer content) was >98.2%, and HCP reduction rate was >27%. When the statistically insignificant wash CV value was fixed at 8 CV and limiting criteria were imposed, as shown in
Figure 7, the desired operating range appeared in the white area. After further discussion, the DBC was determined to be 20–23 g/L of resin, and the elution conductivity was 63–66 mS/cm.
3.5. Process Robustness
To remove product/process-related impurities in CEX, experiments were repeatedly performed using set points in the determined range. Reproducibility was confirmed by evaluating whether the column showed a similar chromatographic profile in a scaled-up environment in terms of LMW and HMW protein removal. Two batches were produced using Fractogel
® EMD SO
3− (M) resin with a 200 cm linear flow rate (residence time: 4.5 min) in a column with a diameter of 2.6 cm and 15 cm height. Protein A chromatography elution pool that had undergone inactivation and neutralization along with depth filtration was used as the loading material. The results are presented in
Table 5. Both batches met the targets of >55% yield, >98.2% purity, and >27% HCP reduction rate. In the chromatography profile, LMW protein was removed in the washing step, and a peak capacity exceeding the target yield is shown (
Figure 8).
4. Conclusions
The removal of product/process-related impurities from peptide Fc-fusion proteins produced by CHO cells was confirmed by observing the separation of two powerful cation-exchanger resins. Fractogel® EMD SO3− (M) resin was used in linear gradient and step gradient modes and showed a high degree of separation for LMW and HMW proteins. This resin appears to be particularly efficient in removing LMW proteins, which has a small difference of 25–30 kDa from the target protein. The process ranges required for the elimination of HMW proteins and HCP while maintaining the target yield value were established through DoE. A scaled-up column was used to evaluate the fixed conditions, and its reproducibility was highly satisfactory. Thus, a CEX column for facilitating peptide Fc-fusion protein production was established.
However, while the quality of the CEX pool elution, such as the monomer content, was satisfactory, a secondary polishing step was required to further remove additional impurities, such as HCD, residual protein A, endotoxin, and viruses. The CEX process used as the first polishing step has the disadvantage that the conductivity of the elution pool is very high. To move onto the next process, such as anion exchange chromatography (AEX) or multimodal chromatography (e.g., MMX), a pre-treatment to lower the conductivity is required. Because the dilution method requires a large amount of buffer, the concentration and dilution of the target protein using single-pass UF/DF can minimize the amount of buffer required for pre-treatment.


