Abstract
The oil industry generates a high number of by-products which have the potential to be used in food formulation after they are properly treated. The aim of this study was to evaluate the nutritional potential of 14 different vegetable by-products from the oil industry (flour, meals, and groats) in terms of fatty acid composition and to investigate the effect of theoretical fortification of the bakery products with by-products high in ω-3. Results showed that some of the analyzed samples contain significant amounts of polyunsaturated fatty acids. Organic walnut flour and grape seed flour had a linoleic acid content higher than 60%. By-products obtained from thistle and sesame had a linoleic acid content ranging between 47.32% and 54.72%. Higher linolenic content was obtained for hemp flour (33.22%), red grape seeds meals (33.62%), and golden flax meals (64.65%). By theoretical fortification of wheat and wholemeal flours with high ω-3 by-products in a proportion of 5, 10, and 15%, the ω-3 content increased (2.2- to 22-fold higher) while the ω-6/ω-3 ratio decreased from 5.22 to 0.52–2.86 for wheat flour, and from 16.80 to 0.81–5.53 for wholemeal flour. These vegetable by-products from the oil industry could represent valuable sources of essential fatty acids for the food application, representing valuable ingredients that could be added for the production of functional foods.
Keywords:
valorization; linoleic acid; linolenic acid; by-products; groats; meals; flours; fortification; functional foods 1. Introduction
Lately, the increase of food waste requires additional ways to reduce it. The waste management principles presented in Directive 2008/98/EC [1] include a five-step “waste hierarchy”: prevention, preparing for re-use, recycling, recovery, and disposal. The effectiveness of any food waste step depends on the type of intervention, but implementing food waste preventions actions should be the best waste mitigation process [2]. The industrial by-products resulted after applying new processes and methodologies in order to reduce food waste can be re-used by valorization [3]. The main organic waste is generated from three industrial sectors: food, agriculture, and oil industry [4]. In the oil crops industry, 36% from the total oil crops available is waste, with most of it being produced during processing and manufacturing [3]. After oil extraction, the resulting press cake can be transformed in flour by milling [5,6], and into meals and groats by drying and molded into two forms [7]. These by-products from the oil industry are important due to their high value-added substances, and their extraction can convert them into excellent sources of bioactive compounds which are valuable for their use and exploitation [8,9]. The content of macromolecules found in by-products depends on the raw material used and the extraction method [10]. The by-products are sources that can be recovered and valorized as valuable ingredients [8].
These by-products resulting from the edible oil industry are considered economic resources which have attracted interest in making functional products with a higher nutritional value, satisfying consumer demand for such products [8]. The use of these by-products will be efficient for the circular economy perspective [4]. In order to avoid their impact on the environment and increase the profitability of plant resources, it is necessary to find alternative strategies for the use of such wastes and by-products [8].
The composition of vegetable seeds and by-products obtained from the oil industry is generally characterized in terms of protein and fiber content, amino acids, and antioxidants. Hempseed cake and flours [11,12], walnut flour [5,13,14], grape seeds [15], and sunflower oilcakes [7] have a high content of protein, crude fiber, and amino acids. Also, a high content of protein is presented in rapeseed meal [16] and flaxseed [17].
Additionally, the by-products resulting from oil industry are valuable sources of phenolic compounds, with antioxidant activity like polyphenols, tocopherols, flavonoids, and phenolic acids. Multescu et al. [18] studied the lipid-soluble antioxidant capacity of 14 different by-products (flour, meals, and groats) from the vegetable oil industry and it showed that these products can be valuable sources of phenolic compounds. Other studies have shown that sea buckthorn berries [19], hempseed cakes and flours [11,12], walnut flour [5,13,14], grape seed flour [15], rapeseed meal [18,20], sesame seeds [21,22], coriander seeds [23,24], and thistle seeds [25,26,27] are sources of natural antioxidants.
Health concerns determined the consumers demand for foods with a high content of health promoting biomolecules. Vegetable oils, implicitly by-products obtained after oil processing, provide a high content of polyunsaturated fatty acids (PUFA) which are required in a good balanced diet. From the PUFA category, ω-3 and ω-6 are the most known, these acids being considered essential fatty acids as they cannot be synthesized by humans; α-linolenic acid (C18:3n3; ALA) is the most known essential ω-3 PUFA, while linoleic acid (C18:2n6; LA) is the most known essential ω-6 PUFA. ALA is transformed after ingestion into docosahexaenoic (C22:6n3; DHA) and eicosapentaenoic (C20:5n3; EPA) acids, ω-3 fatty acids, while LA is converted to arachidonic acid (C20:4n6), another ω-6 acid [28,29]. Both LA and ALA are found in seeds and vegetable oils, but ALA is found in a lower proportion. One of the richest plant sources of essential fatty acids, especially ALA, is flaxseed [17,30,31,32]. Rapeseed oil also has a high content ALA [33]. Besides these vegetable seeds, walnut flour is an important source of ALA [5,13,14].
The by-products obtained after sunflower processing are rich in essential fatty acids, especially LA (32.81% for cake and 65.88% for pellets) [7]. Grape seed flours [34], sesame seeds [22,35,36,37], and thistle seeds [27,38] are also important sources of LA, but it also contains a high amount of oleic acid (C18:1n9). This ω-9 acid is known for its beneficial effect on total blood cholesterol and LDL cholesterol [39].
Even though the by-products have a high content of PUFA, it is considered that the health effects of ω-6 and ω-3 PUFA are opposite. ω-6 PUFA are pro-inflammatory mediators, however, ref. [28] concluded that an intake of a diet with ω-6 PUFA does not increase the concentrations of many inflammatory markers. A diet with a high content of ALA is essential to lower inflammation, decrease the risk for total cardiovascular disease, reduce total and LDL cholesterol, triglycerides, and blood pressure, and reduce the risk for diabetes [40].
Compared to the vegetable oil by-products presented above, coriander oil has the particularity to be rich in petroselinic acid (C18:1n12), an uncommon isomer of oleic acid, important in renewing the building block [24,41]. This oil is considered a novel food ingredient to be used in food supplements [42]. Another important source of unsaturated fatty acids (UFA) [43], particularly ω-7 fatty acids [44], is sea buckthorn berries.
Lately, by-products resulted from oil industry due to their high content in bioactive compounds have been used in different food applications [45], especially bakery products, in order to increase their nutritional content, being used as alternative ingredients in the production of functional foods. Different products obtained by fortification have been reported, such as breads fortified with grape seed flour [15], flaxseed cake [46], and hemp flour [11,47], cookies fortified with raw or roasted hemp flour [48], sea buckthorn flour [19,49], and macarons fortified with walnut oilcake [13]. The interest in these ingredients increased recently due to the fact that cost of these by-products is low compared to the one of the raw materials from which they are obtained. The addition percentages vary for each category of product, by-products having an effect on the nutritional and sensory properties of end products [11,13,15,19,46,47,48,49].
The nutritional potential of by-products can be underestimated; therefore, the objective of this study was to investigate the quality of by-products from the flour, meals, and groats category obtained from the oil industry in terms of fatty acid composition. To establish the discrimination between samples from the same category of by-products and samples obtained from the same type of raw material, principal component analysis (PCA) was performed.
Another aim of this study was to show the theoretical valorization potential of by-products analyzed by replacing the wheat flour (white and wholemeal flour) with a proportion of 5, 10, and 15% of by-products with a higher ω-3 content in order to increase its percent in bakery products and also to obtain a better ω-6/ω-3 ratio.
2. Materials and Methods
2.1. Samples
Three different types of by-products from the vegetable oil industry were analyzed: flour (n = 4), meals (n = 6), and groats (n = 4), which were supplied by five local oil production units (Table 1). A total of 14 samples were analyzed which were kept in the original packaging and stored at room temperature, in dry and dark conditions, until analysis.

Table 1.
Vegetable oil industry by-product samples.
White wheat flour and wholemeal flour were also analyzed in order to study the theoretical valorization potential of by-products high in ω-3 by replacing these flours.
2.2. Reagents and Standards
F.A.M.E. Mix, C4-C24 (mixture of 37 fatty acid methyl esters (FAME), Bellefonte, PA, USA), and SRM®2377 (mixture of 26 FAME, NIST certified, Gaithersburg, MD, USA) were used. For the preparation and analysis of FAME, analytical grade solvents and reagents, specially for chromatography, were used: 5.4 M methanolic solution of sodium hydroxide (Across, Fair Lawn, NJ, USA), 14% methanolic solution of boron trifluoride (Sigma Aldrich, Saint Louis, MO, USA), sodium chloride (Sigma Aldrich, Saint Louis, MO, USA), methanol picograde, and 2,2,4-trimethylpentane (isooctane) picograde (LGC Standards GmbH, Wesel, Germany).
2.3. Determination of Fatty Acid Methyl Esters
In order to be determined, fatty acids were converted to FAME by transesterification of the fat extracted through the Soxhlet method from the analyzed by-products and flour samples. The FAME content of the studied samples was determined according to ISO 12966–2:2017 [50] by using the transmethylation procedure with boron trifluoride (BF3) catalyst and ISO 12966–4:2015 method [51], with modifications as described by Mihai et al. [52]. Calibration solutions and FAME extracts from the studied samples were analyzed using a gas chromatograph (Trace GC Ultra) coupled with a mass spectrometer (TSQ Quantum XLS) from Thermo Fisher Scientific (San Jose, CA, USA). The analyses were performed in the positive electronic ionization mode (EI+) in the “Selected Ion Monitoring—SIM” mode, by using 23 segments. A high-polarity capillary column, TR-FAME, with a stationary phase consisting of 70% cyanopropyl and 30% polysilphenylene-siloxane (60 m × 25 mm × 0.25 µm) from Thermo Fisher Scientific (USA), was used as the stationary phase. As a mobile phase, He of 99.9995% purity (5.0), with a constant flow of 1 mL/min, was used. A volume of 0.5 µL of extract was injected at a temperature of 240 °C, in split mode, with a split ratio of 1:50 and a split flow rate of 50 mL/min. The total analysis time for a sequence was 85.20 min. Instrument control, data acquisition, and processing were performed using the Xcalibur Program.
FAME identification in the analyzed samples was performed both by comparison with the retention times of the FAME components in the reference standards used, and by the m/z ratios specific for each FAME component.
The method allows the determination of the relative concentration (mass %) of 40 FAME, by using experimentally established correction factors, using the two reference standards. The results are expressed as mass percentage (%).
Mass percentages per 100 g fat and 100 g product were calculated for FAME individually determined from the total FAME, saturated fatty acids (SFA), monounsaturated fatty acids (MUFA), PUFA, ω-3, ω-6, and ω-9 content. The ω-6/ω-3 ratio was also calculated.
2.4. Theoretical Valorization Potential of High ω-3 By-Products
Based on the fatty acid composition and the PCA analysis, the by-products high in ω-3 were selected. Their theoretical valorization potential in bakery products was investigated by replacing wheat and wholemeal flours in a proportion of 5, 10, and 15% with these by-products in order to obtain a product enriched with ω-3 fatty acids. The influence of different percentages of addition of selected by-products on the fatty acid composition of wheat flour and wholemeal flour was evaluated by using the mean values expressed at 100 g product based on the fat content of each sample. Additionally, the ω-3 content and the ω-6/ω-3 ratio of 100 g wheat flour, of which 5, 10, and 15 g were replaced with the by-products rich in ω-3 PUFA, were evaluated.
2.5. Statistical Analysis
All samples were analyzed in duplicate, and results were expressed as mean ± standard deviation (SD). In order to evaluate if the by-products obtained from the same category of by-products and from the same raw material have a similar composition, the data of SFA, MUFA, PUFA, ω-3, and ω-6 content were subjected to PCA by using Minitab statistical software version 20.
3. Results and Discussion
All by-product samples analyzed in this study were obtained after cold pressing of oil seed crops to extract the oil. In order to obtain the flour, the oil cake remaining after oil pressing were milled. To obtain the meals and groats, the press cake was dried and then it was molded in forms. The fatty acid composition of all by-products analyzed can vary based on the crop oil variety, growing conditions, and processing steps of the raw materials.
3.1. FAME Composition of the Flour Samples
From the flour by-products category, four samples were analyzed in terms of fat content and fatty acid composition: organic sea buckthorn, hemp, organic walnut, and organic grape seeds flours (Table 2).
Table 2.
Fatty acid methyl esters content of flour samples.
The fat content was higher for organic sea buckthorn flour (15.56%) and organic walnut flour (12.39%). Hemp flour had a fat content of 6.90% lower than the one reported by Mikulec et al. [11] and Pojić et al. [47], of 9.10% and 9.89%, respectively. Organic grape seed flour had a fat content of 5.63%, comparable with the one reported by Oprea et al. [15] of 5.92%.
In terms of individual SFA, these flours had a high content of palmitic (C16:0) and stearic (C18:0) acids. The highest content of palmitic acid was recorded in the organic sea buckthorn flour (38.93%), followed by the hemp flour (15.13%). Compared to these flours, the organic walnut flour and grape seed flour showed a lower content of palmitic acid (about 5%). The stearic acid content varied between 1.15% (sea buckthorn flour) and 5.72% (hemp flour). Additionally, in hemp flour, the highest content of arachidic acid (2.52%) was found.
The SFA content of flour samples varied between 6.88% and 40.81%. The lowest SFA content was determined in organic walnut and grape seed flours (<10%), while the highest content was found in organic sea buckthorn flour.
In terms of individual MUFA composition, these flours were characterized by a high content of oleic acid (C18:1n9) and cis-vaccenic acid (C18:1n11). The analyzed flour samples were characterized by an oleic acid content ranging between 19% and 27%. The hemp flour sample contained the highest content of oleic acid (26.56%), an ω-9 fatty acid which presents health benefits on metabolic syndrome [53]. This flour also presented a content of gondolic acid (C20:1n9) of about 1%, higher than the one obtained in the other flour samples. Organic sea buckthorn flour had the smallest content of oleic acid (18.93%), and the highest content of cis-vaccenic acid (3.87%), along with a considerable percentage (22.12%) of palmitoleic acid (C16:1n7), compared to the other samples (0.05–0.26%). This ω-7 fatty acid is very uncommon being found rarely in plants, so it is difficult to be introduce to human diet [44]. It was shown that this fatty acid reduces inflammation, the risk of diabetes, and cardiovascular diseases [54]. In the study realized by Burčová et al., it was shown that the palmitoleic content of sea buckthorn peels (28.6%) was higher than the one of tea (16.2%), leaves (1.5%), and seeds (0.9%) [43].
In the analyzed flour samples, the MUFA content varied between 20.58% (organic grape seed flour) and 45.09% (organic sea buckthorn flour). Additionally, the other flour samples (hemp, organic walnut flour) were characterized by a MUFA content in the range of 24–30%.
In terms of PUFA composition, organic sea buckthorn flour was characterized by a content of LA and ALA of 8.52% and 5.58%, respectively. A similar composition was reported by Burčová et al. [43] for sea buckthorn peels, the content of LA and ALA being 8.8% and 4.4%, respectively.
Compared to the other samples, hemp flour contained the highest percent of ALA (33.22%), an ω-3 acid, and the lowest content of LA (6.66%). Additionally, hemp flour was characterized by the presence of γ-linolenic acid (C18:3n6; GLA—5.28%), and dihomo-γ- linolenic acid (C20:3n6; DGLA—0.11%). Similar results were reported by Pojić et al. [55], who studied the fatty acid composition of different fractions of hemp seed meal and found a GLA content ranging between 2.61–2.75%, while Occhiuto et al. [12] found a content of 1.95–2.60% in hempseed meal. It is known that GLA is metabolized by the body to DGLA and then to arachidonic acid [56], and the intake of this ω-3 PUFA is associated with anti-cancer activities [57]. This acid might be a ligand to modulate the transforming growth factor beta in glomerulosclerosis [58].
Walnut flour is an important source of PUFA and UFA, presenting a content of LA and ALA of 61.60% and 7.87%, respectively, while the oleic content was 22.16%. Similarly, Burbano and Correa [5] and Pop et al. [13] determined in walnut flour and walnut oilcake a high content of LA of 59.80% and 54.43%, respectively, while the ALA content was 14.80 and 10.64%, respectively, higher than the one obtained in our study. In the study realized by Burbano and Correa [5], it was reported that walnut oil and the press cake obtained after oil extraction contain a high content of UFA of almost 90%. The PUFA content of walnut flour was 74.60% compared to the one of walnut oil of 72.98%. Additionally, when Iordanescu et al. [59] studied the fatty acid composition of twenty types of walnuts from Romania they obtained a content of UFA higher than 80%, having a high content of LA (43.45–49.97%), ALA (14.85–19.18%), and oleic acid (15.00–21.03%). The LA content reported was lower than the one obtained in our study, while the ALA content was higher.
The grape seed flour showed the highest content of LA (69.80%), and implicitly of PUFA (70.16%) and a content of oleic acid of 19.60%. Similarly, Lucarini et al. [60] showed that grape seeds have a high content of LA (59.02–63.71%) and oleic acid (17.87–23.09%). Milinčić et al. [34] analyzed seven grape seeds flours obtained from different varieties of grapes and found that these by-products from grape seed processing are rich in UFA, presenting a content of PUFA of 65.39–84.71%, LA being the major PUFA, and a content of MUFA of 7.01–12.97%, oleic acid being the most abundant acid from this category of UFA.
The PUFA content of flour samples varied considerably from 14.10% to 70.16%. The highest PUFA content was determined in organic grape seed flour, followed by organic walnut flour (69.48%). The UFA content of walnut and grapeseed flours was higher than 90%.
From the flour samples, a lower ratio of ω-6/ω-3 of 0.37, 1.53, and 7.83 was obtained for hemp, sea buckthorn, and organic walnut flours, respectively.
3.2. FAME Composition of the Meal Samples
In the meals category of by-products, six samples were analyzed: rapeseed, sunflower, black sesame, red grape seeds, golden flax, and thistle meals. The fat and fatty acid content of these samples is presented in Table 3.
Table 3.
Fatty acid methyl esters content of meal samples.
The fat content varied between 7.42% for red grape seeds meals and 16.7% for black sesame meals.
In terms of individual SFA, the meal samples showed a high content of palmitic and stearic acids. The palmitic acid content ranged between 5.08% (sunflower meals) and 7.34% (thistle meal). Thistle meals were also characterized by the highest stearic acid content (4.74%), followed by the samples of black sesame (4.27%) and red grape seeds meals (4.13%). The other samples registered lower values (1.67–3.35%).
With the exception of thistle meal, which had a SFA content of 18.96%, the other analyzed meals had a SFA content of about 10%.
Analyzing the samples in terms of individual MUFA, samples were characterized by a high content of oleic and cis-vaccenic acids. The oleic acid content ranged between 14.65% and 82.95%. The sunflower meal had the highest oleic acid content. Sunflower oil is one of the most consumed oils in Romania, and during its processing it generates a high amount of oilcakes, which are rich in oleic acid.
Based on the content of oleic acid, the sunflower oil is divided in three categories: a traditional sunflower oil (14.0–39.4%), mid-oleic acid sunflower oil (43.1–71.8%), and high oleic acid sunflower oil (75.0–90.7%) [61]. According to the results, the sunflower meal analyzed in this study was obtained from a high-oleic sunflower type, containing a percent higher than 75% of total fatty acids. The fatty acid composition of sunflower meal was similar to the one reported by Romanić and Lužaić [62], who found an oleic acid content of 78.00% and a LA content of 11.06% for a high-oleic sunflower oil.
Additionally, oleic acid was found in a high percent in the rapeseed meal (52.76%) and the black sesame meal (34.33%). A lower oleic acid content of about 15% was determined in the golden flax and red grape seeds meals. Similar results were reported in the study realized by Mihai et al. [33], who studied the fatty acid composition of eight pressed cold oils and determined a 63.66%, 35.65%, and 15.29% oleic acid content for rapeseed, sesame, and flaxseed oils, respectively.
Rapeseed meals contained the highest content of cis-vaccenic acid (4.60%) compared to the other samples, which had a content below 1%. Erucic acid (C22:1n9), an ω-9 acid, was identified in rapeseed and thistle meals in a small percentage of 0.04%. This fatty acid is known for having a harmful effect on human health, with the heart being the principal target organ for the toxic effects after exposure [63], but the percent found in these meals was under the maximum level of 5% set by the European Commission [64]. Considering that the rapeseed meal had a content of erucic acid lower than 2% from the total of fatty acids, this meal was obtained from a low-erucic acid rapeseed oil [61].
Compared to the other samples, the rapeseed and thistle meals had a content of 1% gondoic acid, and a small content of nervonic acid (C24:1n9), other ω-9 acids. The results for rapeseed meal are in accordance with the ones reported by Mihai et al. [33] for cold-pressed rapeseed oil.
The MUFA content of the analyzed meal samples varied considerably between 15.29% and 83.89%. The highest percentage was recorded by sunflower meals, followed by rapeseed meals (59.06%). Black sesame and thistle meals had a content of MUFA of 31–35%.
In terms of individual PUFA, black sesame meal contained the highest content of LA (54.72%), and the lowest content of ω-3 from all the meal samples analyzed. The LA content was higher than the one reported for sesame oils in other studies, where a content ranging between 27.62% and 47.44% was determined [22,35,36,37].
Thistle meal was characterized by a high content of LA of 49.75%, while the ALA content was small (0.4%). The fatty acid composition of thistle meal is similar with the composition of the thistle oil reported in other studies [27,38,65]. Our results are in accordance with the ones obtained by Ciocarlan et al. [38], Zhang et al. [27], and Karaiskou et al. [65], who determined a LA content ranging between 45.83% and 48.88% in thistle oil, while Dhouibi et al. [26] determined a content of 59.64%, higher than the one determined in our study. Additionally, these authors found a low content of ALA in thistle oils analyzed, varying between 0.19% and 1.14%, respectively.
The fatty acid composition of red grape seeds meals was different than the one of grape seed flour analyzed in this study. This meal had a SFA and a MUFA content similar with the one of grape seed flour, but when it comes to PUFA content, the proportion of LA and ALA was different. This sample had a high content of LA (39.90%) and ALA (33.62%).
The rapeseed meal was characterized by a content of LA of 21.65%, while the ALA content was 9.62%. Compared to the other meal samples, rapeseed meal had traces amounts of γ–linolenic acid (0.01%), an ω-6 acid, while golden flax meals had trace amounts of eicosatrienoic acid (ETE).
Among ω-3 acids, ALA was found in a high proportion in the sample of golden flax meals (64.65%), flax seeds being considered the most important natural sources of ω-3 PUFA. Due to the nutritional potential and health benefits, the interest in consuming food products with a high content of ω-3 fatty acids increased in the last years, with golden flax seed being an important source to ensure the ω-3 intake [66]. A higher ALA content in diets increases the concentration of ω-3 PUFA in the blood, reducing the risk of coronary heart disease and metabolic syndrome [67]. ALA intake has a beneficial effect on maintaining a healthy blood pressure, reducing the blood cholesterol concentrations [68]. The other meal samples analyzed showed an ALA content below 0.5%.
The sunflower meals sample showed the lowest percentage (6.17%) of PUFA content, while the rest of the samples recorded values ranging between 31.32% and 75.89%. The highest PUFA content was recorded in the sample of golden flax meals, followed by the sample of red grape seed meals (73.52%). Similarly, Panaite et al. [69] and Olteanu et al. [70] determined a high percentage of PUFA for flax meal (70.23% and 75.76%) and grape seed meal (64.71% and 67.02%).
From this category of by-products, rapeseed, red grape seed, and golden flax meals had an optimal ω-6/ω-3 ratio of 2.26, 1.19, and 0.17, respectively.
3.3. FAME Composition of the Groat Samples
From the groat by-products category, four samples were analyzed: sesame, organic thistle, coriander, and sunflower groats. Table 4 presents the fat content and the fatty acid composition of these by-products.
Table 4.
Fatty acid methyl esters content of groat samples.
During oil processing, fat was extracted, but a high content of fat remained in the groats. From all analyzed groat samples, the sesame groat had the highest fat content (23.90%). Melo et al. [6] reported a fat content of 53% for the sesame seeds, while the pressed cake resulted after oil extraction had a content of 32%. The fat content of by-products obtained from sesame was higher than the one of the by-products obtained from black sesame. Similar results were reported by Agidew et al. [22], who showed that the variety of sesame determines the oil content of seeds. White sesame seeds had a higher oil content than black sesame variety. The fat content of thistle groats was comparable with the one of thistle meals. The lowest fat content was determined for sunflower groats (0.65%).
The groat samples had a palmitic acid content ranging between 3.02% (coriander groat) and 6.97% (organic thistle groat), while the stearic acid content ranged between 0.93% (coriander groat) and 4.44% (organic sesame groat). Thistle groat, like thistle meal, had a higher content of arachidic (2.10%) and behenic (1.18%) acids than the other samples.
The SFA content varied between 4.54% (organic coriander groat) and 15.47% (organic thistle groat). Sunflower and sesame seeds groats had a SFA content of around 11%.
From the category of individual MUFA, oleic acid was quantified in higher proportions in sunflower groats. Based on the results, the sunflower groat was obtained from a mid-oleic acid sunflower type [61], having an oleic content of about 60%. Additionally, organic sesame (40.30%) and organic thistle groats (31.81%) had a high content of oleic acid.
An isomer of oleic acid was detected only in coriander meal, in a high percentage (74.75%), identified in the chromatogram of coriander meal between trans-vaccenic acid (C18:1n11t) and oleic acid. Taking in consideration that according to European Commission [42], coriander seed oil contains cis-petroselinic acid (C18:1n12) in a percentage of 60–75%, we considered that this fatty acid is the unidentified compound based on our instrumental method. Additionally, according to the results reported by Kiralan et al. [71] and Uitterhaegen et al. [41], petroselinic acid has the highest proportion (72.32–77.10%) in coriander seeds and oils and coriander fruits. In other study, the fatty acid composition of different parts of coriander fruits was analyzed and petroselinic acid was found to be the major fatty acid [23]. The content was higher in seeds and whole fruits (around 76%), while in the pericarp the content was lower (42.20%). In the coriander groat, another ω-6 acid was also identified and quantified in a small percentage (0.04%)—γ -linolenic acid.
In the groat samples, palmitoleic, cis-vaccenic, gondoic, and erucic acids were also identified and quantified in small percentages, below 1%.
Coriander and sunflower groats had a high content of MUFA of 75.82% and 60.80%, while thistle and sesame groats registered a content of 33.48%, and 40.99%, respectively.
In terms of individual PUFA, the groat samples were characterized by a high content of ω-6 acids and a lower percentage of ω-3 acids. The highest percentage of LA was determined in the organic thistle groats (50.72%). The fatty acids composition of thistle groat was comparable with the one of thistle meal analyzed in this study. Organic sesame groat also had a high content of LA of 47.32%, while sunflower and organic coriander groats recorded a lower content. The fatty acid composition of sesame groat was similar with the one reported by Melo et al. [6] for cold-pressed sesame oil who found an oleic content of 42.66% and a LA content of 41.25%, while for the sesame seeds and cake obtained from pressing, the PUFA content was higher, with the LA content being 42%, while the oleic acid content was 41%. Compared to black sesame meal, sesame groats have a lower content of LA, while the oleic acid content was higher.
In the category of ω-3 fatty acids, the sunflower groats sample had the highest content of ALA (2.05%), while the other groat samples had a content below 0.5%.
The highest PUFA content was found in thistle (51.05%) and sesame groats (47.80%). The coriander and sunflower groats were characterized by a lower content of PUFA.
These by-products from the oil industry had a high ω-6/ω-3 ratio, with the lowest ratio being obtained for sunflower groats (13.02), while the highest was obtained for organic thistle groats (163.68).
3.4. FAME Composition of the Wheat Flour Samples
The fat content and fatty acid composition of wheat and wholemeal flours is presented in Table 5.
Table 5.
Fatty acid methyl esters content of wheat flour samples.
Wheat and wholemeal flours were characterized by a fat content of 1.04% and 1.22%, respectively.
The wheat flour had a SFA content of 35.87%, with the main fatty acids being palmitic (32.16%), stearic (1.09%), and lignoceric (0.96%) acids. The main MUFA present in wheat flour were oleic acid (6.36%), gondolic acid (1.74%), and cis-vaccenic acid (1.48%). This sample had a high content of LA (45.34%), and a small content of ALA (8.25%).
The wholemeal flour was characterized by a SFA content of 15.86%, with the main acid being palmitic acid. This sample had a MUFA content of 11.35%, with the predominant acids being oleic and gondolic acids. The wholemeal flour had a high content of LA of 68.52%, higher than the one of wheat flour, and a small content of ALA (4.13%), lower than the one of wheat flour sample. Similarly, Waters et al. [72] reported a high LA content of 60.83% for wholemeal wheat flour, and a low ALA content of 5.06%.
The ω-6/ω-3 ratio for wheat and wholemeal flours were 5.53 and 16.64, respectively.
3.5. Principal Component Analysis
Multivariance statistical analysis by PCA was applied for by-products analyzed in order to verify the discrimination according to the category of by-products and to the type of raw material from which the by-product was obtained. Figure 1 shows the discrimination between samples.
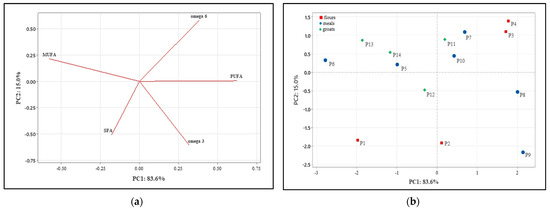
Figure 1.
Principal component analysis: (a) score plot of first and second principal component (PC1 and PC2) describing the variability among the by-products analyzed; (b) loading plot of PC1 and PC2 describing the variation between the fatty acid composition of by-products.
By using PCA we obtained a good separation, with 83.6% of the variation for the PC1 and 15% for PC2, respectively.
The first component was positively correlated with ω-3, ω-6, and PUFA content and inversely correlated with SFA and MUFA. The second component was positively correlated with MUFA, PUFA, and ω-6, and inversely correlated with SFA and ω-3. The discrimination between samples was assessed based on the raw material from which the by-product was obtained, and not the category of the by-product. The by-products obtained from the same type of raw material are situated in the same quadrans or closely: by-products obtained from grape seeds (P4–P8), thistle (P10–P12), sunflower (P6–P14), and sesame (P7–P11). From Figure 1b, it can be noticed that walnut flour (P3), grape seed flour (P4), black sesame meals (P7), thistle meals (P10), and sesame groats (P11) are characterized by a high amount of ω-6 PUFA. From all analyzed by-products, hemp flour (P2), red grape seed meals (P8), and golden flax meals (P9) are characterized by a high amount of ω-3 fatty acids.
3.6. Theoretical Valorization Potential of High ω-3 By-Products in Bakery Products
Most of the food products have a low content of essential ω-3 fatty acids, therefore a way to increase the consumption of these essential fatty acids is the fortification of the most consumed products [29,30]. EFSA [73] set an adequate intake for ALA of 0.5% of energy. In order to be considered a source or being high in ω-3 fatty acids, a food product should contain at least 0.3 or 0.6 g ALA/100 g per 100 kcal [74]. To maintain the normal blood cholesterol, a food product should contain at least 15% of the proposed labelling reference value of 2 g ALA/day [68].
The valorization potential of the by-products analyzed was shown by replacing a part of the wheat flour and wholemeal flour from a bakery products recipe in order to increase the ω-3 content and to decrease the ω-6/ω-3 ratio of food products.
Based on the results obtained from PCA, hemp flour, golden flax meal, and red grapeseed meal are important sources of ω-3 fatty acids. These by-products were further studied for their theoretical valorization potential in bakery products with the aim to increase the nutritional quality of end-products.
For this purpose, wheat flour and wholemeal flour were replaced in a proportion of 5, 10, and 15% with the selected by-products (Table 6 and Table 7).
Table 6.
Influence of different percentages of hemp flour, golden flax meals, and red grape seeds meals addition on the ω-3 and ω-6 fatty acids of wheat flour.
Table 7.
Influence of different percentages of hemp flour, golden flax meals, and red grape seeds meals addition on the ω-3 and ω-6 fatty acids of wholemeal flour.
By replacing the wheat flour and wholemeal flour with 5, 10, and 15% hemp flour, the ω-3 content of 100 g product increased with the increase of the addition percentage from 0.09 g/100 g for wheat flour to 0.42 g/100 g product and from 0.05 g/100 g for wholemeal flour to 0.39 g/100 g product. The ω-3 content was between 2.2- and 4.7-fold higher compared to the wheat flour, and between 3.2- and 7.8-fold higher compared to whole-meal flour. The ω-6/ω-3 ratio decreased with the increase of hemp flour percentage; the 15% addition determined a ratio of 1.24 for wheat flour and 2.13 for wholemeal flour, better than the ratio of wheat and wholemeal flours of 5.22 and 16.80, respectively. Other studies showed that by replacing wheat flour with raw and toasted hemp flour in a proportion of 5–20% in cookies, the protein content, the antioxidant activity, and total phenolic content increased with the increase of the addition of this ingredient [48]. Similarly, when hemp flour was used in the bread formulation, the protein, polyphenols, iron content, and redness of bread increased, while the lightness decreased [11,47].
In the case of golden flax meals, by replacing the wheat flour with 5, 10, and 15% by-product, the ω-3 content increased to 1.13 g/100 g product for wheat flour and to 1.10 g/100 g product for wholemeal flour. This increase was between 4.8- and 12.6-fold higher than the content of wheat flour, and between 8- and 22-fold higher than the one of wholemeal flour for 5% and 15% addition. Better ω-6/ω-3 ratios were obtained by fortifying wheat and wholemeal flours with golden flax meals as a function of addition percentage. The ratio decreased to 0.52 for wheat flour fortified, and to 0.81 for wholemeal flour fortified when 15% by-product was added. Similarly, Taglieri et al. [42] showed that by incorporating flaxseed cake in bread in a proportion of 5, 7.5, and 10%, the ω-6/ω-3 ratio decreased in a dose-dependent manner. The lowest ratio was obtained at the highest cake fortification amount, reaching the ratio of 1.89 and 1.69, respectively, when sourdough and baker’s yeast were used in the formulation recipe. By adding flaxseed cake in bread, the total phenols, total flavonoids, and anti-radical activity of bread was improved, these parameters increasing with the addition percentage.
In the case of red grape seeds meals, the ω-3 content increased in a dose-dependent manner compared to wheat and wholemeal flours, obtaining a content of 0.45 and 0.42, respectively, for 15% addition. The ω-3 content was between 2.3- and 5-fold higher compared to wheat flour, and between 3.4- and 8.4-fold higher compared to wholemeal flour.
A better ω-6/ω-3 ratio was obtained than in the case of wheat and wholemeal flours, with a 15% fortification determining a decrease of this ratio to 1.89 and 2.76, respectively. Besides the effect of the fatty acid content of bakery products, this by-product has an influence on the composition and sensory attributes of end-products. Oprea et al. [15] showed the possibility to add grape seed flour in bakery products in a percent of 3% and 5% in order to obtain a product acceptable from the sensorial point of view. By adding this flour, the fiber content, protein content, and minerals content in potassium, magnesium, calcium, and copper increased. It was also shown that by increasing the grape seed flour addition percentage, the rheological parameters were deteriorated, and the bread volume and texture characteristics were lower [15].
From all the by-products analyzed in order to theoretically increase the ω-3 content in bakery products, the best results were obtained for golden flax meals. As expected, when using 15% addition of by-products, a higher ω-3 content was obtained.
Even though the ALA content increased by replacing the wheat and wholemeal flour with by-products high in ω-3, the bakery products that can be obtained from these flours cannot ensure the adequate intake of ALA. Consumption of other food products which contain ω-3 fatty acids is necessary.
The ω-6/ω-3 ratio for the fortified wheat flour was improved, ranging between 0.52 and 2.86 compared to wheat flour which had a ratio of 5.22. In the case of wholemeal flour fortified with by-products rich in ω-3, the ω-6/ω-3 ratio decreased from 16.80 for wholemeal flour to a ratio ranging between 0.81 and 5.53.
4. Conclusions
The results of this study showed that vegetable oil by-products have a high content of ω-3 and ω-6 fatty acids, PUFA with high nutritional potential. From all the analyzed by-products, walnut and grape seed flours, black sesame, thistle meals, and sesame groats presented a high content of ω-6 fatty acids, ranging between 47.34% and 69.81%, with the main fatty acid being LA. Hemp flour, golden flax meals, and red grape seed meals had a high content of ω-3 fatty acids, especially ALA, ranging between 33.22% and 64.65%.
It was also found that by-products rich in ω-3 acids have a high theoretical valorization potential, estimated to improve the nutritional quality of end-products in terms of ω-3 content and ω-6/ω-3 ratio. A higher content of ω-3 was obtained after replacing wheat flour and wholemeal flour with 5, 10, and 15% hemp flour, golden flax meals, and red grape seed meals. The ω-6/ω-3 ratio decreased with the increase of addition percentage of by-product.
This study shows that by-products are sources of sustainable and natural ingredients that can be used in the bakery industry, improving the fatty acid composition of products. The oil industry by-products can be valorized by being incorporating in novel foods, in accordance with a circular economy perspective.
Author Contributions
Conceptualization, A.L.M. and M.N.; methodology, A.L.M., M.N. and G.-A.H.; software, A.L.M. and M.N.; validation, A.L.M. and M.N.; formal analysis, A.L.M., M.N. and G.-A.H.; investigation, A.L.M. and M.N.; resources, N.B.; data curation, A.L.M., M.N., N.B.; writing—original draft preparation, A.L.M.; writing—review and editing, A.L.M., M.N.; visualization, A.L.M., M.N., N.B.; supervision, M.N. and N.B.; project administration, N.B., A.L.M.; funding acquisition, N.B. All authors have read and agreed to the published version of the manuscript.
Funding
This work was supported by a grant from the Romanian National Authority for Scientific Research and Innovation, CCDI-UEFISCDI, project number: ERANET-COREORGANIC & SUSFOODPROVIDE-1, within PNCDI III, contract no. 184/2020.
Data Availability Statement
Data is contained within the article.
Conflicts of Interest
The authors declare no conflict of interest.
References
- Directive 2008/98/EC Directive 2008/98/EC of the European Parliament and of the Council of 19 November 2008 on Waste and Repealing Certain Directives. J. Off. Union Eur. 2008, 9, 1–59.
- FAO. Societal Costs and Benefits; FAO: Rome, Italy, 2014; ISBN 9789251085103. [Google Scholar]
- Socas-Rodríguez, B.; Álvarez-Rivera, G.; Valdés, A.; Ibáñez, E.; Cifuentes, A. Food By-Products and Food Wastes: Are They Safe Enough for Their Valorization? Trends Food Sci. Technol. 2021, 114, 133–147. [Google Scholar] [CrossRef]
- Sharma, P.; Gaur, V.K.; Gupta, S.; Varjani, S.; Pandey, A.; Gnansounou, E.; You, S.; Ngo, H.H.; Wong, J.W.C. Trends in Mitigation of Industrial Waste: Global Health Hazards, Environmental Implications and Waste Derived Economy for Environmental Sustainability. Sci. Total Environ. 2022, 811, 152357. [Google Scholar] [CrossRef] [PubMed]
- Burbano, J.J.; Correa, M.J. Composition and Physicochemical Characterization of Walnut Flour, a By-Product of Oil Extraction. Plant Foods Hum. Nutr. 2021, 76, 233–239. [Google Scholar] [CrossRef] [PubMed]
- Melo, D.; Álvarez-ortí, M.; Nunes, M.A.; Costa, A.S.G.; Machado, S.; Alves, R.C.; Pardo, J.E.; Oliveira, M.B.P.P. Whole or Defatted Sesame Seeds (Sesamum Indicum L.)? The Effect of Cold Pressing on Oil and Cake Quality. Foods 2021, 10, 2108. [Google Scholar] [CrossRef] [PubMed]
- Petraru, A.; Ursachi, F.; Amariei, S. Nutritional Characteristics Assessment of Sunflower Seeds, Oil and Cake. Perspective of Using Sunflower Oilcakes as a Functional Ingredient. Plants 2021, 10, 2487. [Google Scholar] [CrossRef]
- Gullón, P.; Gullón, B.; Astray, G.; Carpena, M.; Fraga-Corral, M.; Prieto, M.A.; Simal-Gandara, J. Valorization of By-Products from Olive Oil Industry and Added-Value Applications for Innovative Functional Foods. Food Res. Int. 2020, 137, 109683. [Google Scholar] [CrossRef]
- Leyva-l, N.; Liz, C.E.; Hern, C.; Erika, Y.S. Exploitation of Agro-Industrial Waste as Potential Source of Bioactive Compounds for Aquaculture. Foods 2020, 9, 843. [Google Scholar] [CrossRef]
- Sagar, N.A.; Pareek, S.; Sharma, S.; Yahia, E.M.; Lobo, M.G. Fruit and Vegetable Waste: Bioactive Compounds, Their Extraction, and Possible Utilization. Compr. Rev. Food Sci. Food Saf. 2018, 17, 512–531. [Google Scholar] [CrossRef]
- Mikulec, A.; Kowalski, S.; Sabat, R.; Skoczylas, Ł.; Tabaszewska, M.; Wywrocka-Gurgul, A. Hemp Flour as a Valuable Component for Enriching Physicochemical and Antioxidant Properties of Wheat Bread. LWT 2019, 102, 164–172. [Google Scholar] [CrossRef]
- Occhiuto, C.; Aliberto, G.; Ingegneri, M.; Trombetta, D.; Circosta, C.; Smeriglio, A. Comparative Evaluation of the Nutrients, Phytochemicals, and Antioxidant Activity of Two Hempseed Oils and Their Byproducts after Cold Pressing. Molecules 2022, 27, 3431. [Google Scholar] [CrossRef]
- Pop, A.; Paucean, A.; Socaci, S.A.; Alexa, E.; Man, S.M.; Muresan, V.; Chis, M.S.; Salanta, L.; Popescu, I.; Berbecea, A.; et al. Quality Characteristics and Volatile Profile of Macarons Modified Withwalnut Oilcake By-Product. Molecules 2020, 25, 2214. [Google Scholar] [CrossRef]
- Chamorro, F.; Carpena, M.; Lourenço-Lopes, C.; Taofiq, O.; Otero, P.; Cao, H.; Xiao, J.; Simal-Gandara, J.; Prieto, M.A. By-Products of Walnut (Juglans regia) as a Source of Bioactive Compounds for the Formulation of Nutraceuticals and Functional Foods. Biol. Life Sci. Forum 2022, 12, 35. [Google Scholar] [CrossRef]
- Oprea, O.B.; Popa, M.E.; Apostol, L.; Gaceu, L. Research on the Potential Use of Grape Seed Flour in the Bakery Industry. Foods 2022, 11, 1589. [Google Scholar] [CrossRef]
- Ivanova, P.; Chalova, V.; Uzunova, G.; Koleva, L.; Manolov, I. Biochemical Characterization of Industrially Produced Rapeseed Meal as a Protein Source in Food Industry. Agric. Agric. Sci. Procedia 2016, 10, 55–62. [Google Scholar] [CrossRef]
- Trela, A.; Silska, G.; Chyc, M.; Latowski, D.; Kruk, J.; Szymańska, R. Tocochromanols and Fatty Acid Composition in Flax (Linum usitatissimum L.) Accessions. Acta Soc. Bot. Pol. 2019, 88, 3636. [Google Scholar] [CrossRef]
- Multescu, M.; Marinas, I.C.; Susman, I.E.; Belc, N. Byproducts (Flour, Meals, and Groats) from the Vegetable Oil Industry as a Potential Source of Antioxidants. Foods 2022, 11, 253. [Google Scholar] [CrossRef]
- Ghendov-Mosanu, A.; Cristea, E.; Patras, A.; Sturza, R.; Padureanu, S.; Deseatnicova, O.; Turculet, N.; Boestean, O.; Niculaua, M. Potential Application of Hippophae rhamnoides in Wheat Bread Production. Molecules 2020, 25, 1272. [Google Scholar] [CrossRef]
- Szydłowska-Czerniak, A.; Amarowicz, R.; Szłyk, E. Antioxidant Capacity of Rapeseed Meal and Rapeseed Oils Enriched with Meal Extract. Eur. J. Lipid Sci. Technol. 2010, 112, 750–760. [Google Scholar] [CrossRef]
- Ji, J.; Liu, Y.; Shi, L.; Wang, N.; Wang, X. Effect of Roasting Treatment on the Chemical Composition of Sesame Oil. LWT 2019, 101, 191–200. [Google Scholar] [CrossRef]
- Agidew, M.G.; Dubale, A.A.; Atlabachew, M.; Abebe, W. Fatty Acid Composition, Total Phenolic Contents and Antioxidant Activity of White and Black Sesame Seed Varieties from Different Localities of Ethiopia. Chem. Biol. Technol. Agric. 2021, 8, 14. [Google Scholar] [CrossRef]
- Sriti, J.; Talou, T.; Wannes, W.A.; Cerny, M.; Marzouk, B. Essential Oil, Fatty Acid and Sterol Composition of Tunisian Coriander Fruit Different Parts. J. Sci. Food Agric. 2009, 89, 1659–1664. [Google Scholar] [CrossRef]
- Uitterhaegen, E.; Sampaio, K.A.; Delbeke, E.I.P.; De Greyt, W.; Cerny, M.; Evon, P.; Merah, O.; Talou, T.; Stevens, C.V. Characterization of French Coriander Oil as Source of Petroselinic Acid. Molecules 2016, 21, 1202. [Google Scholar] [CrossRef] [PubMed]
- Zarrouk, A.; Martine, L.; Grégoire, S.; Nury, T.; Meddeb, W.; Camus, E.; Badreddine, A.; Durand, P.; Namsi, A.; Yammine, A.; et al. Profile of Fatty Acids, Tocopherols, Phytosterols and Polyphenols in Mediterranean Oils (Argan Oils, Olive Oils, Milk Thistle Seed Oils and Nigella Seed Oil) and Evaluation of Their Antioxidant and Cytoprotective Activities. Curr. Pharm. Des. 2019, 25, 1791–1805. [Google Scholar] [CrossRef] [PubMed]
- Dhouibi, I.; Jridi, M.; Flamini, G.; Jabeur, H.; Masmoudi, M.; Bouaziz, M. Volatile and Phenolic Contents and Antioxidant and Antibacterial Properties of Tunisian Milk Thistle and Mastic Oils. Euro-Mediterr. J. Environ. Integr. 2020, 5, 59. [Google Scholar] [CrossRef]
- Zhang, Z.S.; Wang, S.; Liu, H.; Li, B.Z.; Che, L. Constituents and Thermal Properties of Milk Thistle Seed Oils Extracted with Three Methods. LWT 2020, 126, 109282. [Google Scholar] [CrossRef]
- Innes, J.K.; Calder, P.C. Omega-6 Fatty Acids and Inflammation. Prostaglandins Leukot. Essent. Fat. Acids 2018, 132, 41–48. [Google Scholar] [CrossRef]
- Patel, A.; Desai, S.S.; Mane, V.K.; Enman, J.; Rova, U.; Christakopoulos, P.; Matsakas, L. Futuristic Food Fortification with a Balanced Ratio of Dietary ω-3/ω-6 Omega Fatty Acids for the Prevention of Lifestyle Diseases. Trends Food Sci. Technol. 2022, 120, 140–153. [Google Scholar] [CrossRef]
- Saini, R.K.; Keum, Y.S. Omega-3 and Omega-6 Polyunsaturated Fatty Acids: Dietary Sources, Metabolism, and Significance—A Review. Life Sci. 2018, 203, 255–267. [Google Scholar] [CrossRef]
- Romanić, R.S.; Lužaić, T.Z.; Radić, B. Enriched Sunflower Oil with Omega 3 Fatty Acids from Flaxseed Oil: Prediction of the Nutritive Characteristics. LWT 2021, 150, 112064. [Google Scholar] [CrossRef]
- Joshi, A.; Hegde, M.; Zanwar, A. Flaxseed Oil and Palm Olein Blend to Improve Omega-6: Omega-3 Ratio. J. Food Sci. Technol. 2022, 59, 498–509. [Google Scholar] [CrossRef]
- Mihai, A.L.; Negoiţă, M.; Horneţ, G.-A. Nutritional Potential of Some Cold Pressed Vegetable Oils in Terms of Fatty Acids. Curr. Trends Nat. Sci. 2020, 9, 104–116. [Google Scholar] [CrossRef]
- Milinčić, D.D.; Kostić, A.; Špirović Trifunović, B.D.; Tešić, Ž.L.J.; Tosti, T.B.; Dramićanin, A.M.; Barać, M.B.; Pešić, M.B. Grape Seed Flour of Different Grape Pomaces: Fatty Acid Profile, Soluble Sugar Profile and Nutritional Value. J. Serb. Chem. Soc. 2020, 85, 305–319. [Google Scholar] [CrossRef]
- Shi, L.; Zheng, L.; Zhang, Y.; Liu, R.; Chang, M.; Huang, J.; Jin, Q.; Zhang, H.; Wang, X. Evaluation and Comparison of Lipid Composition, Oxidation Stability, and Antioxidant Capacity of Sesame Oil: An Industrial-Scale Study Based on Oil Extraction Method. Eur. J. Lipid Sci. Technol. 2018, 120, 1800158. [Google Scholar] [CrossRef]
- Mohamed Ahmed, I.A.; Aljuhaimi, F.; Özcan, M.M.; Ghafoor, K.; Şimşek, Ş.; Babiker, E.E.; Osman, M.A.; Gassem, M.A.; Salih, H.A.A. Evaluation of Chemical Properties, Amino Acid Contents and Fatty Acid Compositions of Sesame Seed Provided from Different Locations. J. Oleo Sci. 2020, 69, 795–800. [Google Scholar] [CrossRef]
- Khayambashi, S.; Asadi-gharneh, H.A. Evaluation of Morphological and Fatty Acid Composition of Different Sesame Cultivars. J. Med. Plants By-Prod. 2020, 1, 87–96. [Google Scholar]
- Ciocarlan, A.; Dragalin, I.; Aricu, A.; Ciocarlan, N.; Stavarache, C.; Deleanu, M. Chromatographic Analysis of Silybum marianum (L.) Gaertn. Fatty Oil. Chem. J. Mold. 2018, 13, 63–68. [Google Scholar] [CrossRef]
- EFSA Panel on Dietetic Products, Nutrition and Allergies (NDA). Scientific Opinion on the Substantiation of Health Claims Related to Oleic Acid Intended to Replace Saturated Fatty Acids (SFAs) in Foods or Diets and Maintenance of Normal Blood LDL-Cholesterol Concentrations (ID 673, 728, 729, 1302, 4334) and Maintenanc. EFSA J. 2011, 9, 2043. [Google Scholar] [CrossRef]
- Sala-Vila, A.; Fleming, J.; Kris-Etherton, P.; Ros, E. Impact of α-Linolenic Acid, the Vegetable ω-3 Fatty Acid, on Cardiovascular Disease and Cognition. Adv. Nutr. 2022, 13, 1584–1602. [Google Scholar] [CrossRef]
- Uitterhaegen, E.; Nguyen, Q.H.; Sampaio, K.A.; Stevens, C.V.; Merah, O.; Talou, T.; Rigal, L.; Evon, P. Extraction of Coriander Oil Using Twin-Screw Extrusion: Feasibility Study and Potential Press Cake Applications. J. Am. Oil Chem. Soc. 2015, 92, 1219–1233. [Google Scholar] [CrossRef]
- European Commission. Commission Implementing Regulation (EU) 2019/2165 of 17 December 2019 Authorising the Change of the Specifications of the Novel Food Coriander Seed Oil from Coriandrum sativum under Regulation (EU) 2015/2283 of the European Parliament and of the Council A. Off. J. Eur. Union 2019, L328. [Google Scholar]
- Burčová, Z.; Kreps, F.; Schmidt, Š.; Jablonský, M.; Ház, A.; Sládková, A.; Šurina, I. Composition of Fatty Acids and Tocopherols in Peels, Seeds and Leaves of Sea Buckthorn. Acta Chim. Slovaca 2017, 10, 29–34. [Google Scholar] [CrossRef]
- Marsiñach, M.S.; Cuenca, A.P. The Impact of Sea Buckthorn Oil Fatty Acids on Human Health. Lipids Health Dis. 2019, 18, 145. [Google Scholar] [CrossRef] [PubMed]
- Reguengo, L.M.; Salgaco, M.K.; Sivieri, K.; Marostica Junior, M.R. Agro-Industrial by-Products: Valuable Sources of Bioactive Compounds. Food Res. Int. 2022, 152, 110871. [Google Scholar] [CrossRef] [PubMed]
- Taglieri, I.; Sanmartin, C.; Venturi, F.; Macaluso, M.; Zinnai, A.; Tavarini, S.; Serra, A.; Conte, G.; Flamini, G.; Angelini, L.G. Effect of the Leavening Agent on the Compositional and Sensorial Characteristics of Bread Fortified with Flaxseed Cake. Appl. Sci. 2020, 10, 5235. [Google Scholar] [CrossRef]
- Pojić, M.; Dapčević Hadnađev, T.; Hadnađev, M.; Rakita, S.; Brlek, T. Bread Supplementation with Hemp Seed Cake: A By-Product of Hemp Oil Processing. J. Food Qual. 2015, 38, 431–440. [Google Scholar] [CrossRef]
- Ertaş, N.; Aslan, M. Antioxidant and Physicochemical Properties of Cookies Containing Raw and Roasted Hemp Flour. Acta Sci. Pol. Technol. Aliment. 2020, 19, 177–184. [Google Scholar]
- Gani, A.; Jan, R.; Ashwar, B.A.; ul Ashraf, Z.; Shah, A.; Gani, A. Encapsulation of Saffron and Sea Buckthorn Bioactives: Its Utilization for Development of Low Glycemic Baked Product for Growing Diabetic Population of the World. LWT 2021, 142, 111035. [Google Scholar] [CrossRef]
- ISO 12966-2:2017; Animal and Vegetable Fats and Oils—Gas Chromatography of Fatty Acid Methyl Esters—Part 2: Preparation of Methyl Esters of Fatty Acids. International Organization for Standardization: Geneva, Switzerland, 2017; 15p.
- ISO 12966-4:2015; Animal and Vegetable Fats and Oils—Gas Chromatography of Fatty Acid Methyl Esters—Part 4: Determination by Capillary Gas Chromatography. International Organization for Standardization: Geneva, Switzerland, 2015; 21p.
- Mihai, A.L.; Negoita, M.; Belc, N. Evaluation of Fatty Acid Profile of Oils/Fats by GC-MS through Two Quantification Approaches. Rom. Biotechnol. Lett. 2019, 24, 973–985. [Google Scholar] [CrossRef]
- Pastor, R.; Bouzas, C.; Tur, J.A. Beneficial Effects of Dietary Supplementation with Olive Oil, Oleic Acid, or Hydroxytyrosol in Metabolic Syndrome: Systematic Review and Meta-Analysis. Free Radic. Biol. Med. 2021, 172, 372–385. [Google Scholar] [CrossRef]
- Hu, W.; Fitzgerald, M.; Topp, B.; Alam, M.; O’Hare, T.J. A Review of Biological Functions, Health Benefits, and Possible de Novo Biosynthetic Pathway of Palmitoleic Acid in Macadamia Nuts. J. Funct. Foods 2019, 62, 103520. [Google Scholar] [CrossRef]
- Pojić, M.; Mišan, A.; Sakač, M.; Dapčević Hadnađev, T.; Šarić, B.; Milovanović, I.; Hadnađev, M. Characterization of Byproducts Originating from Hemp Oil Processing. J. Agric. Food Chem. 2014, 62, 12436–12442. [Google Scholar] [CrossRef]
- Lyashenko, S.; González-Fernández, M.J.; Borisova, S.; Belarbi, E.H.; Guil-Guerrero, J.L. Mertensia (Boraginaceae) Seeds Are New Sources of γ-Linolenic Acid and Minor Functional Compounds. Food Chem. 2021, 350, 128635. [Google Scholar] [CrossRef]
- Xu, Y.; Qian, S. Anti-Cancer Activities of ω-6 Polyunsaturated Fatty Acids. Biomed. J. 2014, 37, 112–119. [Google Scholar] [CrossRef]
- Prabhu, Y.D.; Bhati, M.; Vellingiri, B.; Gopalakrishnan, A.V. The Effect of γ-Linolenic Acid on Polycystic Ovary Syndrome Associated Focal Segmental Glomerulosclerosis via TGF-β Pathway. Life Sci. 2021, 276, 119456. [Google Scholar] [CrossRef]
- Iordanescu, O.A.; Radulov, I.; Buhan, I.P.; Cocan, I.; Berbecea, A.A.; Popescu, I.; Posta, D.S.; Camen, D.; Lalescu, D. Physical, Nutritional and Functional Properties of Walnuts Genotypes (Juglans regia L.) from Romania. Agronomy 2021, 11, 1092. [Google Scholar] [CrossRef]
- Lucarini, M.; Durazzo, A.; Kiefer, J.; Santini, A.; Lombardi-Boccia, G.; Souto, E.B.; Romani, A.; Lampe, A.; Nicoli, S.F.; Gabrielli, P.; et al. Grape Seeds: Chromatographic Profile of Fatty Acids and Phenolic Compounds and Qualitative Analysis by FTIR-ATR Spectroscopy. Foods 2020, 9, 10. [Google Scholar] [CrossRef]
- CXS 210-1999; Codex Alimentarius. Standard for Named Vegetable Oils. Codex Alimentarius Commission: Rome, Italy, 2021; 14p.
- Romanić, R.S.; Lužaić, T.Z. Dehulling Effectiveness of High-Oleic and Linoleic Sunflower Oilseeds Using Air-Jet Impact Dehuller: A Comparative Study. Food Sci. Technol. 2022, 42, e58620. [Google Scholar] [CrossRef]
- EFSA Panel on Contaminants in the Food Chain (CONTAM); Knutsen, H.K.; Alexander, J.; Barregård, L.; Bignami, M.; Brüschweiler, B.; Ceccatelli, S.; Dinovi, M.; Edler, L.; Grasl-Kraupp, B.; et al. Erucic Acid in Feed and Food. EFSA J. 2016, 14, e04593. [Google Scholar] [CrossRef]
- European Commission. Commission Regulation (EU) No 696/2014 of 24 June 2014 Amending Regulation (EC) No 1881/2006 as Regards Maximum Levels of Erucic Acid in Vegetable Oils and Fats and Foods Containing Vegetable Oils and Fats. Off. J. Eur. Union 2014, 184, 20–30. [Google Scholar]
- Karaiskou, C.; Kasapidou, E.; Michailidis, G.; Markantonatos, X.; Basdagianni, Z. Effect of Dietary Milk Thistle (Silybum marianum L.) Oil Supplementation on Animal Performance and Milk Fatty Acid Composition in Dairy Ewes. Small Rumin. Res. 2021, 203, 106493. [Google Scholar] [CrossRef]
- Khattab, R.Y.; Zeitoun, M.A. Quality Evaluation of Flaxseed Oil Obtained by Different Extraction Techniques. LWT 2013, 53, 338–345. [Google Scholar] [CrossRef]
- Jang, H.; Park, K. Omega-3 and Omega-6 Polyunsaturated Fatty Acids and Metabolic Syndrome: A Systematic Review and Meta-Analysis. Clin. Nutr. 2020, 39, 765–773. [Google Scholar] [CrossRef] [PubMed]
- EFSA Panel on Dietetic Products, Nutrition and Allergies (NDA). Opinion on the Substantiation of Health Claims Related to Alpha Linolenic Acid and Maintenance of Normal Blood Cholesterol Concentrations (ID 493) and Maintenance of Normal Blood Pressure (ID 625) Pursuant to Article 13(1) of Regulation (EC) No 1924/2006. EFSA J. 2009, 7, 1252. [Google Scholar] [CrossRef]
- Panaite, T.D.; Criste, R.D.; Ropota, M.; Criste, V.; Vasile, G.; Olteanu, M.; Mitoi, M.; Socoliuc, R.; Vlaicu, A. Determination of the Feeding Value of Food Industry By-Products. Lucr. Ştiinţifice Ser. Zooteh. 2016, 66, 196–201. [Google Scholar]
- Olteanu, M.; Criste, R.D.; Panaite, D.T.; Turcu, R.P.; Ropota, M.; Vlaicu, P.A.; Soica, C.; Mitoi, M. Antioxidant Role of the Grape Seeds Meal in Preventing the Degradation of Fatty Acids-High Diet Formulations for Broilers. Sci. Pap. Ser. D Anim. Sci. 2018, 61, 61–67. [Google Scholar]
- Kiralan, M.; Calikoglu, E.; Ipek, A.; Bayrak, A.; Gurbuz, B. Fatty Acid and Volatile Oil Composition of Different Coriander (Coriandrum sativum) Registered Varieties Cultivated in Turkey. Chem. Nat. Compd. 2009, 45, 100–102. [Google Scholar] [CrossRef]
- Waters, D.M.; Jacob, F.; Titze, J.; Arendt, E.K.; Zannini, E. Fibre, Protein and Mineral Fortification of Wheat Bread through Milled and Fermented Brewer’s Spent Grain Enrichment. Eur. Food Res. Technol. 2012, 235, 767–778. [Google Scholar] [CrossRef]
- EFSA Panel on Dietetic Products, Nutrition and Allergies (NDA). Scientific Opinion on Dietary Reference Values for Fats, Including Saturated Fatty Acids, Polyunsaturated Fatty Acids, Monounsaturated Fatty Acids, Trans Fatty Acids, and Cholesterol. EFSA J. 2010, 8, 1461. [Google Scholar] [CrossRef]
- European Commission. Commission Regulation (EU) No 116/2010 of 9 February 2010 Amending Regulation (EC) No 1924/2006 of the European Parliament and of the Council with regard to the list of nutrition claims. Off. J. Eur. Union 2010, 37, 16–18. [Google Scholar]

Publisher’s Note: MDPI stays neutral with regard to jurisdictional claims in published maps and institutional affiliations. |
© 2022 by the authors. Licensee MDPI, Basel, Switzerland. This article is an open access article distributed under the terms and conditions of the Creative Commons Attribution (CC BY) license (https://creativecommons.org/licenses/by/4.0/).