Article

Analysis of Collected Data and Establishment of an Abnormal Data Detection Algorithm Using Principal Component Analysis and K-Nearest Neighbors for Predictive Maintenance of Ship Propulsion Engine

Division of Marine Engineering, Mokpo National Maritime University, Mokpo 58628, Korea
*
Author to whom correspondence should be addressed.
Processes 2022, 10(11), 2392; https://doi.org/10.3390/pr10112392
Submission received: 10 October 2022 / Revised: 1 November 2022 / Accepted: 7 November 2022 / Published: 14 November 2022
(This article belongs to the Section Process Control and Monitoring)

Abstract

:
Because ships are typically operated for more than 25 years after construction, they can be considered mobile factories that require economic maintenance before being scrapped. Therefore, for stable and efficient ship operation, continuous maintenance systems and processes are required. Ships cannot be operated when defects or failures occur in any of the numerous systems configured in them, and research is urgently needed to apply predictive maintenance to propulsion engines with high maintenance costs using machine learning. Therefore, this study analyzes the operation and control characteristics of the propulsion engine, acquires engine data from the alarm monitoring system of the ship in operation, and then preprocesses the data by constructing a data preprocessing algorithm that incorporates the engine control characteristics. In addition, principal component analysis and K-nearest neighbors were used to check whether preprocessing data were classified based on engine control characteristics, and an algorithm capable of detecting abnormal data was built and verified to lay the foundation for predictive maintenance of ship propulsion engines using machine learning.

1. Introduction

A ship is a watercraft for transporting cargo and passengers through the sea, rivers, and waterways. It is a complex plant comprising cargo loading and unloading systems, a navigation system, and a system that operates engine room machinery, among other things. In addition, ships are usually operated for more than 25 years after construction and are considered mobile factories that require economic maintenance before being scrapped [1]. Therefore, continuous maintenance systems and processes are needed for stable and efficient ship operations [2,3,4,5,6,7,8].
Because ships sail far from land, the maritime environment, such as weather conditions, has a significant impact on them. The number of sailors operating them is also limited, making immediate response difficult when ships and machines are damaged, and immediate land support during emergencies is also limited. The failure of major systems, such as the ship’s propulsion engine, requires stopping the ship’s operation and repairing or replacing it. This not only delays the voyage, but maintenance work in the sea, where the ship fluctuates, can also result in casualties. In addition, companies responsible for ship maintenance have poor access to ships, and an immediate supply of related equipment and materials, which also require high costs, is difficult [9].
To improve economic feasibility and operational efficiency, time-based maintenance (TBM) and corrective maintenance methods, which are commonly used for ship maintenance, must be enhanced. Therefore, studies are being conducted to introduce predictive maintenance (PdM) by diagnosing machine and system conditions and failures to improve the operational efficiency of ships.
Michala et al. (2015) and Lazakis et al. (2016) applied a machinery risk assessment (MRA) that diagnoses conditions and failures by calculating failure rates, mean time between failures, and probability of failure based on current and historical data. Decision support systems using MRA were combined with a ship monitoring system to support maintenance prediction and maintenance decisions of ship machinery to improve and optimize the energy efficiency of ship machinery [2,10]. Liu et al. (2022) measured marine environment data of wind and waves and performance data such as engine speed, output, and ship speed. They calibrated the impact of the marine environment data on the collected performance data. In addition, the ship’s acceleration and deceleration, route change, and wave conditions are filtered hydrodynamically. The filtered data were derived as an actual propulsion performance curve of engine power-RPM, and a methodology for predicting the ship’s condition according to the fouling of the ship’s hull and propeller was presented by comparing it with the design performance curve of the engine. A study was conducted to support a prediction-based maintenance and repair system to reduce exhaust gas emissions from ships, such as greenhouse gases, and to increase operational efficiency [7].
Notably, research to improve maintenance efficiency is being conducted; however, due to the operational characteristics of the ship, and the difficulty in securing valid data classified according to the characteristics of the machine and system, many studies are not being conducted.
If a defect or breakdown occurs in one of the numerous systems configured in a ship, the ship cannot be operated, and research that can realistically utilize PdM for propulsion engines that have a high maintenance cost burden is urgently needed. Machine learning, a branch of artificial intelligence, is being used as a technology to implement PdM through the condition monitoring of devices and systems [11].
To derive reliable results from machine learning, large amounts of normal and abnormal state data are required, as well as data classification based on the engine’s and each machine system’s control and operational characteristics. However, securing abnormal operation data for ships is difficult because of engine abnormalities when applying TBM-based preventive maintenance, and ship data fluctuate frequently due to control characteristics. In addition, owing to the wide range of steady states of the engine, securing an effective learning database for PdM remains challenging, implying that many limitations exist when implementing the PdM of the engine using machine learning.
Therefore, this study analyzes the operation and control characteristics of the propulsion engine, acquires engine data from the alarm monitoring system (AMS) of the ship in operation, and develops a data preprocessing algorithm that considers the engine control characteristics for data preprocessing. Principal component analysis (PCA) and K-nearest neighbors (KNN), which belong to machine learning algorithms, are used to check whether preprocessing data is classified according to engine control characteristics. By building and verifying an algorithm that can detect abnormal data, a valid learning database necessary for PdM is secured. In addition, an algorithm for detecting the abnormal operation state of an engine is constructed and verified. Thus, the basis of the ship propulsion engine PdM using machine learning is established.

2. Materials and Methods

2.1. Research Target Ship and Data

The ship used to collect operational data was a training ship with a total length of 133 m, a total tonnage of 9196 tons, a cruising distance of 14,500 nmi, and a sailing speed of 17.7 knots, sailing on the coast and an ocean. The ship was equipped with a controllable pitch propeller (CPP) with one thruster each at the fore and aft. It was also equipped with a dynamic positioning system installed to maintain the ship’s position by controlling the surge, way, and yaw among the six degrees of freedom of the ship using the engine, thruster, and CPP.
The research target ship was a vessel equipped with the latest machinery and system to be applied to general ships, such as merchant ships, in the future, and acquiring the data necessary for future PdM technology supply in advance is possible. The established AMS was also selected as a collection ship for operational data because it can acquire more data types than existing ships. Table 1 lists the specifications of ship details.
AMS is a system that monitors, controls, and manages navigation equipment on a ship, such as radar, GPS, and steering systems; cargo equipment that monitors, loads, and unloads cargo; and engine room equipment, such as propulsion and generator engines. The propulsion engine data used in the study only included numerical data for each system in AMS that can determine the engine state. The 104 selected data were acquired during the 8th voyage (Voyage No. 21071, 21081, 21091, 21101, 21102, 21112, 21121, and 21122) and used for the study.

2.2. Ship Propulsion Engine Control Characteristics

The propulsion engines of research target ships and medium and large ships are generally applied with two-stroke diesel engines that have advantages in output (torque), structure, and weight considering the ship size. The propulsion engine under consideration has a rated power of 6618 kW and is a six-cylinder engine, as detailed in Table 2.
In general, unlike automobile engines, ship propulsion engines lack idling that operates without a load, as the engine and propeller are directly connected to the shaft without a transmission or are connected to the propeller shaft through a reducer. However, for a special ship equipped with CPP, such as the research target ship, the idling operation is possible through propeller pitch control.
The ship’s propulsion engine is controlled by the engine telegraph, which immediately starts the engine with compressed air to move forward and backward at the engine stop state, but the CPP-type ship operates in the engine idling state. Engine control is classified into a maneuvering mode that can quickly and flexibly change engine load according to operating and maritime conditions, such as entry, departure, and anchoring, and a cruising mode for constant-speed operation according to the operating target speed.
The maneuvering mode on the engine telegraph comprises four stages, each having stop, dead slow, slow, half, full, and ahead (forward), and astern (backward), and each control stage is sequentially controlled based on the engine speed (RPM). Table 3 lists the engine control step of the ship under study, and unlike ordinary ships, it simultaneously controls the pitch of the propeller simultaneously as the RPM. The navigation full step on the engine telegraph is configured to reach the target RPM (speed) by the logic program in cruise mode.
The load of the ship’s propulsion engine varies according to the engine telegraph operation step and the marine environment, and the operating status is changed accordingly.

2.3. Algorithm Development Tools

Python’s grammar is simple, organized, and easy, so anyone can acquire and use it in a short time. In addition, the grammar structure is simple, so the error rate due to the complex code configuration is low, the code configuration enables fast and many tasks, and the development efficiency is high because it is easy to link with other programming languages and libraries [12,13,14,15]. Furthermore, Python can be used in various open-source packages in a general-purpose program language, so developers in various fields can share libraries and source codes so that users can easily access and use them [12,13,14,15].
Python can use various machine learning libraries, such as Scikit-learn and tensorflow, and provide many standard libraries, so it is possible to quickly build the machine learning algorithms required in each field by utilizing shared libraries and source codes [12,13,14,15].
As described above, Python has the advantage of being able to utilize various libraries and source codes, including scalability and interworking. Therefore, Python 3 was used in this study to develop and verify machine learning algorithms for ship data analysis and PdM and among the Python libraries, numpy, pandas, matplotlib, and sklearn were utilized for research.

2.4. Research Utilization Algorithm

2.4.1. PCA

PCA is an algorithm that reduces data dimension and uses an orthogonal transformation to transform high-dimensional data that are correlated with each other into low-dimensional data with minimal linear correlation [16,17,18]. PCA is an analysis method for finding the weight for each variable of data in which information loss is minimized, and the conversion formula is shown in Equation (1).
x 11   x 12     x 1 p x 21   x 22     x 2 p x n 1   x n 2     x n p w 1 1   w 1 2     w 1 m w 2 1   w 2 2     w 2 m w p 1   w p 2     w p m = z 1 1   z 1 2     z 1 m z 2 1   z 2 2     z 2 m z n 1   z n 2     z n m X W = Z
In the equation, x represents measurement data, w represents weight, z represents conversion data, n represents the number of measurement data, p represents the number of characteristics, and m represents the required main component number. The individual data (X) is converted into a new dimension of data (Z) by the weight (W) calculated by the PCA. The core of PCA is to derive a weight (W) in which the transformed data (Z) may have a maximum variance.
PCA is often used when data reduction is required or when outliers are found, as well as when multicollinearity that has an inappropriate effect on data analysis occurs because some variables correlate highly with other variables [16,17,18,19,20].
Ship machinery and system-related data comprise a large amount of data comprising multiple factors, and many processes and time are required to analyze data according to the presence or absence of abnormalities in individual factors or the control characteristics. Therefore, PCA with functions such as dimension reduction and abnormal data analysis was utilized for the propulsion engine data analysis.

2.4.2. KNN

KNN is a representative classification algorithm that calculates the distance between existing data adjacent to new data and grasps the characteristics of the nearest K data to determine the type of new data.
In the KNN algorithm, the distance between data is generally defined as Equation (2) using the Euclidean distance, which obtains the shortest distance between two points in all dimensions [21,22,23,24].
d   = q 1 p 1 2 + q 2 p 2 2 + q 3 p 3 2 + + q n p n 2 = i = 1 n q i p i 2
In the equation, d is the distance between the two points p and q.
KNN is excellent in performance and suitable for analysis among data classification techniques and is effective when much learning data exist [21,22,23,24]. Therefore, KNN was used to analyze propulsion engine data with a large number of different data types and to detect abnormal data.

2.5. Propulsion Engine Data Preprocessing Algorithm

To secure the reliability of data analysis and machine learning results, abnormal data should be absent, and the data classification reflecting the characteristics of the object to be analyzed, such as the engine, should be clarified. In addition, if abnormal data or factors unrelated to the analysis target are included, the machine learning results are derived in a different direction from the goal, so securing the reliability of data preprocessing is necessary. Therefore, a data preprocessing algorithm that considers the propulsion engine control characteristics was constructed, and the collected data were preprocessed and then used for the research.
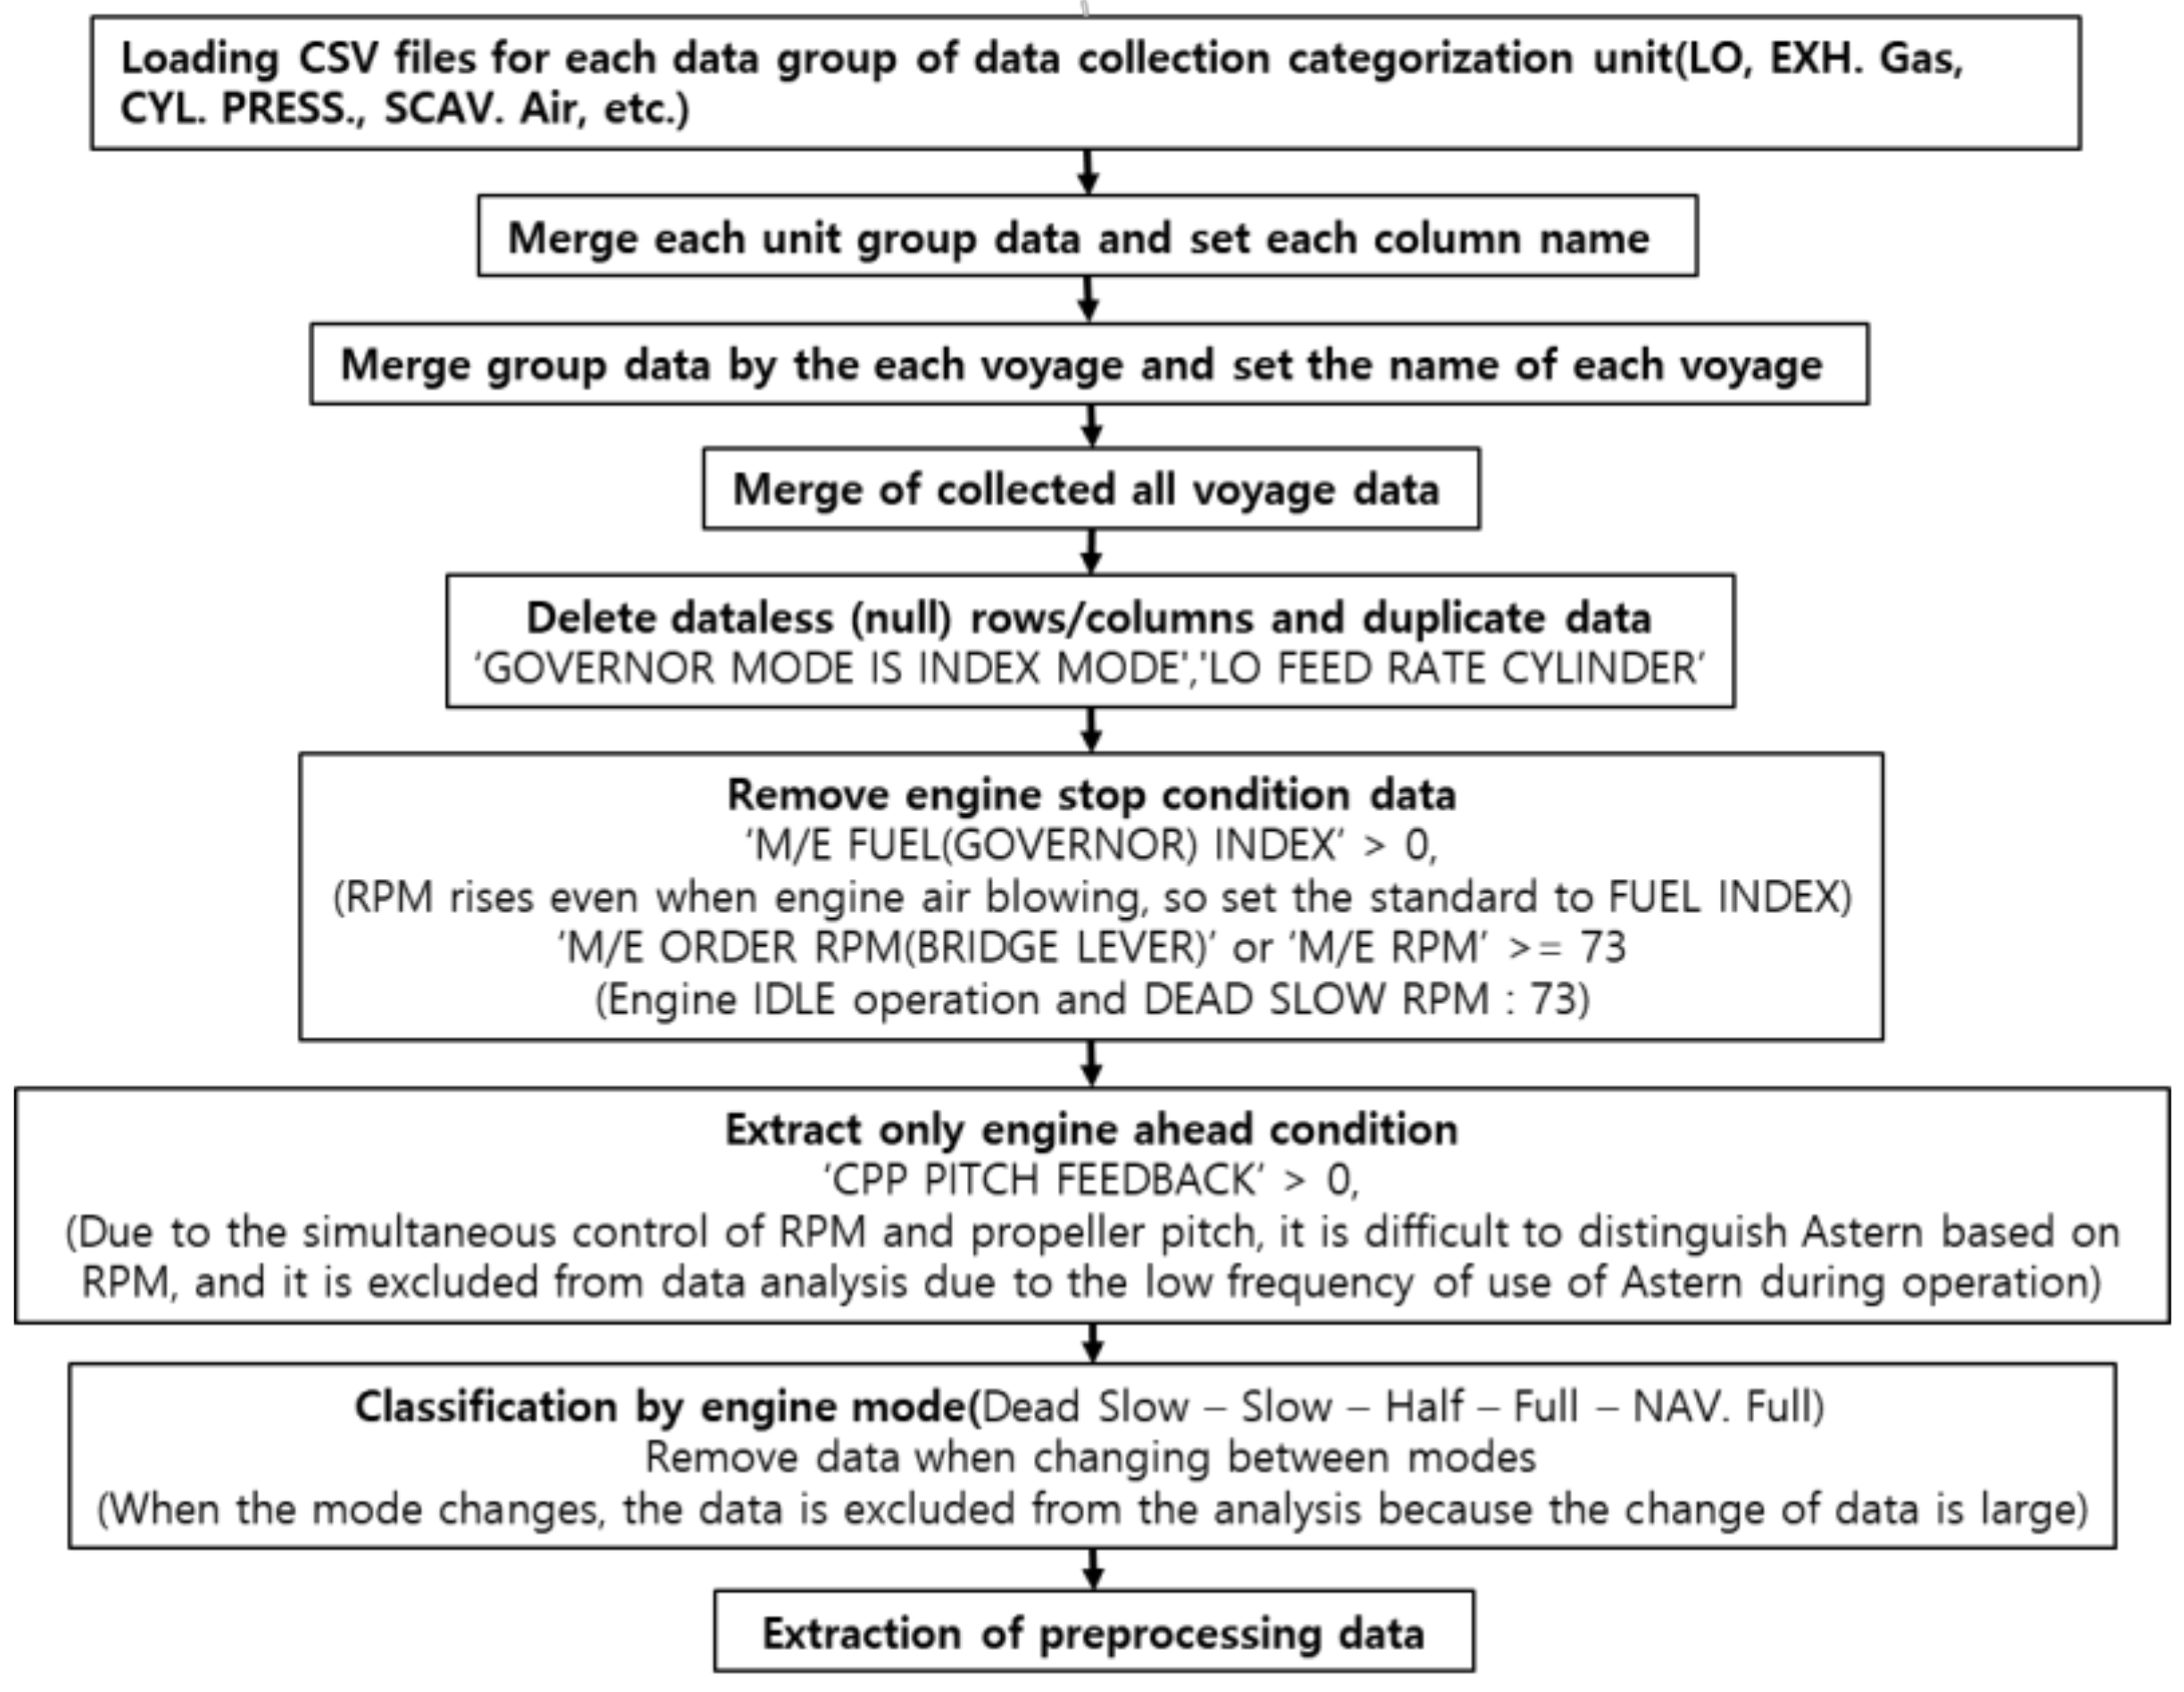
Propulsion engine data processing algorithms, such as merging data, removing abnormal data, such as null data, and classifying data based on engine control characteristics, are required to build a database for AMS data analysis and machine learning. Therefore, the propulsion engine data preprocessing algorithm was constructed, as shown in Figure 1.
The files for each data group (LO, EXH, GAS, etc.) acquired for each data extraction section in AMS were merged according to the extraction section. After setting the name of each column (factors), the data acquired by merging each voyage resulted in one data file. Null values and duplicate data that did not exist, such as LO feed rate cylinders, were deleted from the collected data, and engine non-operation and idling operation data were removed, as they were unnecessary for propulsion engine machine learning. In addition, the propulsion engine data preprocessing algorithm was constructed to extract only the engine ahead (forward) operating conditions and to classify data by engine control mode to process the data required for machine learning of the propulsion engine. The data preprocessing algorithm included CPP-related data processing procedures because the propulsion engine used in this study was equipped with a special CPP. Except for CPP-related procedures and the engine control mode setting value, the proposed algorithm can be used as an AMS data preprocessing algorithm for general ships.

2.6. Standard Data Analysis and Abnormal Operation Data Detection Algorithm

A standard data analysis and abnormal operation data detection algorithm were constructed and verified based on the propulsion engine data below.
There were 104 preprocessed propulsion engine data factors (140,176 rows × 104 columns), and it took a long time to determine whether the data for each factor was abnormal or whether the data processing results were appropriate for the engine control mode. Therefore, a standard data analysis algorithm for normal operation conditions comprising PCA and KNN was constructed to determine whether the data were effectively processed through the data preprocessing algorithm and whether they could be used as normal state data (standard data).
The preprocessing data were analyzed by reducing the data dimension through PCA based on Equations (1) and (2). In addition, abnormal data were found among the collected data by setting the standard distance and by calculating the distance between the set standard (K) data(points) using KNN. To verify data validity, such as separation and abnormal data confirmation according to data characteristics, a PCA/KNN standard data processing algorithm was constructed (Figure 2).
The K value was set through data analysis because the optimal K value varies depending on the data analysis target and data distribution. The function for extracting the abnormal data index was also included in the algorithm so that the abnormal data could be removed by optimizing the distance, which is the criterion for obtaining the outlier value by analyzing the PCA variance ratio and the distance distribution graph between the data.
The abnormal operation data detection algorithm was designed and tested to detect data generated by the engine’s abnormal operation during engine operation.
The ratio of engine operation during the entire voyage was 94% in full-navigation mode and 6% in a manning mode based on the AMS acquisition data. The maneuvering mode had an extremely small operation ratio, which was mainly low-load operating conditions of the engine, making it difficult to establish stable normal driving standards due to the large data change, depending on the driving environment, such as departure (engine cold condition) and arrival. Therefore, an algorithm was constructed to detect abnormal operation data that occurred during operation, considering only full-navigation mode operation data, except for the maneuvering mode in the abnormal operation data detection analysis.
The abnormal operating data detection algorithm also used the PCA/KNN technique shown in Figure 2 to derive the main component of the preprocessed full-navigation mode normal operation data through PCA and then analyzed the distance between the data according to the K value with KNN. The K and outlier values of the normal operation data were selected to detect abnormal operating data. The collected data were applied to the algorithm to analyze whether abnormal operating data that deviated from the outlier standard existed, and the corresponding index could be extracted when abnormal operating data were detected.

3. Results and Discussion

3.1. Standard Data Analysis Algorithm Verification Results

Figure 3 shows the PCA results of preprocessed propulsion engine data using the PCA/KNN standard data analysis algorithm, which analyzed preprocessing results and the existence of abnormal data by deriving two principal components of PC1 and PC2. The data in the circle shown in the graph are from the winter season with a low scavenging temperature, and it is the maneuvering mode data at the time of departure when the engine is started at a cold standstill. As a result, the data pattern could be confirmed, depending on the engine operating conditions.
By classifying AMS extraction data into ME ORDER RPM according to the propulsion engine telegraph control criteria, engine operation data can be found to be distributed for each propulsion engine mode, as shown in graph (a) of Figure 4. However, classifying the collected data based on the ME ORDER RPM (telegraph order basis) includes the data (unstable data for each mode) until the engine reaches each mode condition, so much data overlaps between each mode (graph (a) in Figure 4). As a result, valid steady-state data are difficult to secure because data noise occurs during the separation and securing of normal operation data between modes.
If the engine control mode is classified after setting the ME RPM area for each mode by considering load variability based on the set RPM for each mode in the telegraph with ME RPM data, which is the actual measured data of the engine speed, normal operating data can be separated and secured more clearly between each mode (Figure 4b).
As described above, standard data analysis algorithms can be used to effectively verify the validity of normal state data. Figure 5 depicts abnormal data analysis results obtained using KNN on propulsion engine PCA result data. Data excessively deviating from the data group were confirmed by analyzing the distance between the data (Figure 5a) and by setting K = 5. Accordingly, after setting the outlier value to 3, abnormal data analysis revealed two abnormal data (Figure 5b). The abnormal data were confirmed by checking the preprocessing data, indicating that the sensor value of the engine cylinder pressures was the maximum value (red box data of Figure 5c). For reference, the index of raw data and the index of the algorithm have different data sheet configurations, resulting in a two-step difference.

3.2. Abnormal Operating Data Analysis Results of the Propulsion Engine Using an Abnormal Operating Data Detection Algorithm

Among the 104 factors in preprocessed engine data, 76 major factors, including RPM, load, cylinder exhaust gas temperature, and cylinder combustion pressure of propulsion engine that can determine normal and abnormal states of the engine considering ME SHUT DOWN and SLOW DOWN factors, were selected (Figure 6).
The two types of principal components were derived as PCA to simplify the data collected in full-navigation mode, analyze the impact of each factor, and shorten the analysis time. The PCA variance ratio is an index that judges how well the two extracted principal components can explain the overall trend, and the variance of the 76 analysis factors was confirmed to be 78% [25]. Therefore, the extracted principal component was confirmed as valid data in the analysis.
Figure 7 is a PCA result graph of normal operating data in full-navigation mode of eight voyages. By confirming that the data group is evenly distributed with no large outliers, a normal data group that can be used to detect abnormal operating data has been secured.
The data were analyzed by changing the K value to establish an optimal outlier value (abnormal data criteria) to detect abnormal data through the KNN algorithm. As a result, the number of adjacent data K for calculating the average distance between data was set to 9, considering the variability of engine operation data and the characteristics of AMS data, where one data is collected per 10 s. Figure 8 shows the distance analysis results between normal operating data when K = 9. The outlier value (abnormal data criteria) was set to 1.7144, as the maximum distance was about 1.7143. If the data exceeded the outlier value, it was classified as abnormal data, and the algorithm was constructed so that the abnormal data (outlier index) was extracted. Accordingly, a normal operation database and abnormal data detection criteria for detecting engine abnormal operating data were established using the PCA/KNN technique.
The verification results of the PCA/KNN abnormal operation detection algorithm are as follows: Abnormal operation data were detected (Figure 9) by applying the abnormal operation (Voyage No. 21121) data in which the engine SHUT DOWN occurred during the full-navigation mode operation due to an abnormal control air system of the propulsion engine. The PCA results (Figure 9a) showed that some data deviated from the normal data group. In addition, distance analysis results between data revealed that the SHUT DOWN of the propulsion engine occurred five times when the number of times the data deviated from the abnormal data criteria was checked (Figure 9b), making it possible to detect abnormal data and data groups (Figure 9c).
The abnormal data (outlier index) was extracted by the algorithm (Figure 10a). The data at the time when the outlier index extracted from the algorithm and the actual engine were SHUT DOWN were found to be consistent by checking the data for the 21121 voyage (Figure 10b).
Owing to the detection of abnormal operation data using the PCA/KNN algorithm, the time point of abnormal data can be confirmed by an index outside the criterion distance between the extracted data. However, KNN demonstrated limitations in detecting overall abnormal operation data due to the nature of detecting abnormal operation data by calculating the distance between adjacent data based on a specified number of data (K value).
The abnormal operating data of the engine collected from the ship during operation can be confirmed quickly using the PCA/KNN algorithm. Therefore, the proposed algorithm can serve as a data screening algorithm for macroscopically detecting abnormal operating data during engine operation before detailed data analysis, enabling the checking of the overall normal and abnormal operating states of the engine among the collected data. If the K value and abnormal operation criteria (outlier value) suitable for setting the normal data range are optimized for each device, the proposed algorithm can be applied to mechanical systems, such as pumps and motors, other than the engine, to detect abnormal operation data.

4. Conclusions

In this study, data were collected from the operating ship’s propulsion engine, and a preprocessing algorithm was constructed by analyzing the operation and control characteristics of the propulsion engine in order to apply PdM to ship institutions using machine learning. In addition, the following results were derived by building and verifying a standard data analysis and abnormal driving data detection algorithm using PCA and KNN.
  • The analysis results of the propulsion engine data under the normal operation state using a standard data analysis algorithm, PCA/KNN, confirmed that the preprocessed data were classified based on engine control characteristics. Therefore, the composition of the preprocessing algorithm was confirmed valid.
  • The validity of the standard data analysis algorithm using PCA/KNN was confirmed by detecting error data of sensors and AMS, which were not filtered in the preprocessing, and verifying that removal was possible.
  • The PCA/KNN abnormal operation data detection algorithm was verified by applying the voyage data in which abnormal operations existed. As a result, the data of the section where the propulsion engine’s SHUT DOWN occurred due to abnormality in the control air system was detected, and the corresponding index was extracted to ensure that the reliability of the algorithm was confirmed.
  • However, due to the technique’s characteristics, the PCA/KNN algorithm was determined to be a useful algorithm for macroscopically detecting abnormal operating data during engine operation, enabling the checking of the overall operating state of the engine among the collected data.
As described above, this study established a foundation for data classification and analysis and abnormal data detection required for the PdM of ship propulsion engines using machine learning. Future research will be conducted on determining abnormality symptoms and predicting the maintenance time of propulsion engines in order to develop technologies required for the PdM of ship propulsion engines.

Author Contributions

Conceptualization, J.P.; methodology, J.O.; investigation, J.P.; data curation, J.P.; writing—original draft preparation, J.P.; writing—review and editing, J.O. All authors have read and agreed to the published version of the manuscript.

Funding

This research was supported by the Basic Science Research Program through the National Research Foundation of Korea funded by the Ministry of Education (NO. 2020R1I1A2073426).

Institutional Review Board Statement

Not applicable.

Informed Consent Statement

Not applicable.

Data Availability Statement

Not applicable.

Acknowledgments

This paper was summarized and developed from the Ph.D. thesis of the first author.

Conflicts of Interest

The authors declare no conflict of interest.

References

  1. Emre, A. The role of human factor in maritime environment risk assessment. Hum. Ecol. Risk Assess. 2018, 24, 653–666. [Google Scholar]
  2. Michala, A.L.; Lazakis, I.; Theotokatos, G. Predictive maintenance decision support system for enhanced energy efficiency of ship machinery. In Proceedings of the International Conference on Shipping in Changing Climates, Glasgow, UK, 24–26 November 2015. [Google Scholar]
  3. Park, J.H.; Jang, M.K.; Lee, G.H.; Oh, E.K.; Hur, S.W. Forecasting Algorithm for Vessel Engine Failure. J. KIIT 2016, 14, 109–117. [Google Scholar] [CrossRef]
  4. Bae, Y.M.; Kim, M.J.; Kim, K.J.; Jun, C.H.; Byeon, S.S.; Park, K.M. A Case Study on the Establishment of Upper Control Limit to Detect Vessel’s Main Engine Failures using Multivariate Control Chart. J. Soc. Nav. Archit. Korea 2018, 55, 505–513. [Google Scholar] [CrossRef]
  5. Kim, D.H.; Lee, S.B.; Lee, J.H. Anomaly detection of Vessel Main Engine Big Data using GaussianMixture Model. J. Korean Data Anal. Soc. 2020, 22, 1473–1489. [Google Scholar] [CrossRef]
  6. Kim, D.H.; Lee, J.H.; Lee, S.B.; Jung, B.K. Outlier detection of main engine data of a ship using ensemble method. J. Korean Soc. Fish. Ocean. Technol. 2020, 56, 384–394. [Google Scholar] [CrossRef]
  7. Liu, S.; Chen, H.; Shang, B.; Papanikolaou, A. Supporting Predictive Maintenance of a Ship by Analysis of Onboard Measurements. J. Mar. Sci. Eng. 2022, 10, 215. [Google Scholar] [CrossRef]
  8. Göksu, B.; Ergİnger, K. Prediction of Ship Main Engine Failures by Artificial Neural Networks. J. ETA Marit. Sci. 2020, 8, 98–113. [Google Scholar] [CrossRef]
  9. Youn, I.K.; Park, J.K.; Oh, J.M. A Study on the Concept of a Ship Predictive Maintenance Model Reflection Ship Operation Characteristics. J. Korean Soc. Mar. Environ. Saf. 2021, 27, 053–059. [Google Scholar] [CrossRef]
  10. Lazakis, I.; Dikis, K.; Michala, A.L.; Theotokatos, G. Advanced ship systems condition monitoring for enhanced inspection, maintenance and decision making in ship operations. Transp. Res. Procedia 2016, 14, 1679–1688. [Google Scholar] [CrossRef] [Green Version]
  11. Hung, Y.H. Developing an Anomaly Detection System for Automatic Defective Products’ Inspection. Processes 2022, 10, 1476. [Google Scholar] [CrossRef]
  12. Müller, A.C.; Guido, S. Introduction to Machine Learning with Python; O’Reilly Media: Newton, MA, USA, 2016. [Google Scholar]
  13. ”Python (Programming Language).” Wikipedia. Available online: https://en.wikipedia.org/wiki/Python_(programming_language) (accessed on 22 March 2022).
  14. Martelli, A.; Ravenscroft, A.; Ascher, D. Python Cookbook; O’Reilly Media: Newton, MA, USA, 2005. [Google Scholar]
  15. Srinath, K.R. Python–the fastest growing programming language. Int. Res. J. Eng. Technol. 2017, 4, 354–357. [Google Scholar]
  16. Howley, T.; Madden, M.G.; O’Connell, M.L.; Ryder, A.G. The effect of principal component analysis on machine learning accuracy with high dimensional spectral data. Knowl.-Based Syst. 2006, 19, 363–370. [Google Scholar] [CrossRef]
  17. Bro, R.; Smilde, A.K. Principal component analysis. Anal. Methods 2014, 6, 2812–2831. [Google Scholar] [CrossRef] [Green Version]
  18. Shlens, J. A tutorial on principal component analysis. arXiv 2014, arXiv:https://arxiv.org/abs/1404.1100. [Google Scholar]
  19. ”Principal Component Analysis.” Wikipedia. Available online: https://en.wikipedia.org/wiki/Principal_component_analysis (accessed on 25 February 2022).
  20. Polyak, B.T.; Khlebnikov, M.V. Principle component analysis: Robust versions. Autom. Remote Control. 2017, 78, 490–506. [Google Scholar] [CrossRef]
  21. Kramer, O. Dimensionality Reduction with Unsupervised Nearest Neighbors; Springer: Berlin/Heidelberg, Germany, 2013; Volume 51, pp. 13–23. [Google Scholar]
  22. Zhang, Z. Introduction to machine learning: K-nearest neighbors. Ann. Transl. Med. 2016, 4, 218. [Google Scholar] [CrossRef] [PubMed]
  23. Lee, Y.T.; Kim, D.H.; Sin, W.S.; Kim, C.K.; Kim, H.G.; Han, S.W. A Comparison of Machine Learning Models in Photovoltaic Power Generation Forecasting. J. Korean Inst. Ind. Eng. 2021, 47, 444–458. [Google Scholar]
  24. Kim, N.J.; Bae, Y.C. Status Diagnosis of Pump and Motor Applying K-Nearest Neighbors. J. KIECS 2018, 13, 1249–1256. [Google Scholar]
  25. Holland, S.M. Principal Components Analysis (PCA); Department of Geology, University of Georgia: Athens, GA, USA, 2008. [Google Scholar]
Figure 1. Data preprocessing algorithm for the propulsion engine.
Processes 10 02392 g001
Figure 2. PCA/KNN algorithm for standard data analysis and abnormal operation data detection.
Processes 10 02392 g002
Figure 3. PCA results of the preprocessing data of the propulsion engine.
Processes 10 02392 g003
Figure 4. PCA results according to mode classification criteria of the preprocessing data: Classification of engine control modes based on ME ORDER RPM (a) and ME RPM (b).
Processes 10 02392 g004
Figure 5. Abnormal data analysis results of a PCA/KNN algorithm: (a) Distance analysis between KNN data; (b) KNN abnormal data detection; (c) Confirmation of abnormal data among preprocessing data.
Processes 10 02392 g005
Figure 6. Data for confirmation of engine operating conditions.
Processes 10 02392 g006
Figure 7. PCA results for normal operating data.
Processes 10 02392 g007
Figure 8. KNN analysis results for normal operating data.
Processes 10 02392 g008
Figure 9. Results of abnormal operating data analysis of a PCA/KNN algorithm: (a) VOYAGE 21,122 PCA results; (b) KNN abnormal data detection; (c) Confirmation of abnormal data.
Processes 10 02392 g009
Figure 10. Confirmation of abnormal operating data by a PCA/KNN algorithm: (a) Abnormal operating data detection; (b) Confirmation of abnormal operating data among voyage 21121 data.
Processes 10 02392 g010aProcesses 10 02392 g010b
Table 1. Specifications of ship details.
Length Overall (LOA)133.0 m
Breadth19.4 m
Design Draft6.4 m
Gross Tonnage9196 ton
Speed (Design draft, 85% MCR with 15% S.M)17.7 knot
Range of Endurance14,500 nmi
Table 2. Specifications of propulsion engine.
TypeMAN B&W 6S40ME-B9.5
No. of cylinders6
DIA. of cylinder400 mm
Stroke1770 mm
Mean Effective Pressure20 bar
MAX. Cylinder Pressure185 bar
Rated output6618 kW
Turbo chargerHYUNDAI-ABB, 1 × A165L37
Table 3. Engine control stage.
StepsStopDead SlowSlowHalfFullNavigation Full
RPMAhead0738897116141
Astern0110121127135141
Pitch (%)Ahead-5065758397
Astern-−40−50−55−62−65
Publisher’s Note: MDPI stays neutral with regard to jurisdictional claims in published maps and institutional affiliations.

