
Measurement and Characterization of Yeast Cell Size Using a Digital Optical Microscope

1
Aomori Prefectural Industrial Technology Research Center, Hirosaki Industrial Research Institute, 1-1-8 Ougi-machi, Hirosaki 036-8104, Japan
2
Aomori Prefectural Industrial Technology Research Center, Hachinohe Industrial Research Institute, 1-4-43 Kita-inter-kogyodanchi, Hachinohe 039-2245, Japan
3
The United Graduate School of Agricultural Sciences, Iwate University, 3-18-8 Ueda, Morioka 020-8550, Japan
Processes 2022, 10(11), 2396; https://doi.org/10.3390/pr10112396
Submission received: 18 October 2022
/
Revised: 9 November 2022
/
Accepted: 11 November 2022
/
Published: 14 November 2022
Abstract
:Yeast produces flavor components as by-products of fermentation. Such components, which account for considerable yeast quality value, may influence cell membrane fluidity and regulate cell size. In this study, yeast cell size was measured using various methods, and cell sizes were characterized for each strain of yeast. Herein, a method for measuring the cell size and automatically acquiring the cell area was proposed using inexpensive methylene blue staining and a versatile digital microscope to automatically acquire the cell area. To evaluate the efficiency, data on cell length and area were compared using the conventional and proposed methods. Additionally, the advantages of automated measurement and the ability to count cell numbers in the future are discussed through the acquisition of cell size data, which would be required for microfabrication and cell fabrication techniques. Although there are various candidate methods for evaluating the properties of each yeast strain, the present technique may be useful for evaluating the productivity of flavor components and selecting a yeast strain for producing food and drink products with high commodity values.
1. Introduction
The cell size is a well-known, important morphological element of yeast [1] and an important parameter in cells. Rapid cell size detection can be a strong tool to determine cell population based on each property, such as flavor production of those yeasts. Until recently, the measurement method for cell size involved measuring cells individually under a microscope, which is time consuming. It was developed for the automatic measurement of the cell size as the maximum radius in the chamber using the IBM-PC program that automatically measures the maximum and minimum radii [2]. Further, similar techniques were proposed, such as a method using the free ImageJ software, which can be applied [3]; however, in this method, storing the observed image data in the PC and performing binarization and brightness setting in the software is necessary. Observations and analyses had to be performed separately, and observational data had to be re-monitored when software analysis was not suitable. Cell counts have also been performed empirically using spectrophotometric absorbance measurements [4,5], and both cell number and size have been optically measured [6]. However, cell count has been emphasized in experiments, while cell size has been largely neglected.
The proposed method combines observations and measurements for quick evaluation of cell groups. Conventional methods usually include separate processes for collecting observational data and analyzing images. Possible reasons for separating the processing steps are as follows. First, devices are more available and cheaper than in the past, enabling the acquisition of a large number of images and observation of detailed parts in high-resolution images. Second, devices can be attached with specific camera software that clarifies the image, even when the analysis functions of the measurement numerical properties, such as length, are minimal. The author’s research group mainly used two types of software for microscopic cameras: CellSence (Olympus, Tokyo, Japan) and MicroStudio (Wraymer, Osaka, Japan). These software packages are adjustable and ensure high-quality microscopic images, but cannot meet the specifications of complex analysis, such as measurements of length, area, and cell counts. Such measurements of microscope image data require new analysis programs such as ImageJ. To improve image acquisition and data analysis, conventional methods require at least two processes that include taking images and analyzing them. Microscopic data is sometimes collected in the form of movies. To obtain high-quality images from movies, brightness must be adjusted, and detailed data analysis is required [7]. Following these three steps, we can analyze the characteristics of single-cell model vesicles [7]; however, a comprehensive dataset is not always required. For example, sometimes we need only the size of the cell or the information on cell numbers.
Conventional methods require several steps to collect objective data from raw samples, such as observation, image formation, and measurement. Conventional methods must confirm the data and determine the accuracy and validity of each step, which is time consuming. The proposed method simultaneously performs observations, creates images, and performs quantitative measurements when a large amount of data is required.
Therefore, a method for rapidly measuring the cell size using a versatile microscope and accessory software has been reported. The proposed method can be used to rapidly evaluate cell groups by combining both observation and measurement for cell evaluation. To date, cell size measurements have been conducted simultaneously with cell count measurements. The proposed method is used for measuring the cell size; however, it can also be used for cell count measurements in the future. In this study, the validity of the data was first confirmed using the proposed method in comparison with the conventional methods. The data were then collected using the proposed method, and comparisons were made with data obtained using manual or conventional automated methods. Simple data and numerical values that can be obtained from the observed images while acquiring data are desirable. Therefore, as simpler data, obtaining the length of the longest part of the cell would be better; however, the system that analyzes the observation image used is a simpler operation to output the data as an area. Therefore, it is necessary to confirm whether the easily obtained area data and simpler cell-length data as cell size data are correlated. Therefore, a discussion was conducted by comparing cell length and area. Overall, the proposed method can be implemented rapidly and has an accuracy comparable to that of the conventional method. In this study, the accuracy of the proposed method was compared with that of conventional methods in terms of length and area measurements of yeast cell groups. The results were compared using statistical analysis (p value and standard deviation).
2. Materials and Methods
2.1. Materials
Dried Lalvin EC118, Lalvin QA23, Lalvin R2, and Uvaferm BC yeasts were obtained from Lallemand (Montreal, QC, Canada) and denoted as EC, QA, R2, and BC, respectively. Ammonium sulfate and glucose-free yeast nitrogen-based (YNB) media were obtained from Difco (Detroit, MI, USA). Ammonium sulfate, agar, and glucose were purchased from Wako Pure Chemical Industries (Osaka, Japan), and methylene blue (MB) was purchased from Kanto Chemical Co., (Tokyo, Japan). Ultrapure water used for cleaning and preparing glass instruments was prepared in-house using a system (Millipore, Bedford, MA, USA).
2.2. Yeast Preparation
Yeast was cultured in YNB medium, as reported in the literature [4,5], at 30 °C. After 3 days, it was plated on an agar medium and maintained at 30 °C; subsequently, it was cultured in a slant medium from single colonies. The yeast was then transferred from this slant medium back to the YNB medium and incubated for an additional 3 days at 30 °C. Successful cell cultivation was confirmed by OD 660 measurement using a UV spectrometer (UV-1800; Shimadzu, Kyoto, Japan) to reach the stationary phase. Yeast solution was prepared as previously described [8]. Although the exact cell density in the solution mentioned in an earlier study was unknown, the density in the cultured yeast solution was approximately 1 × 10⁵ cells/mL. For automated measurements, the specimens were stained with 0.002% MB and observed. MB staining can identify dead and living cells (Figure 1A).
2.3. Measurement of Cell Area and Length
The cells were automatically imaged using a digital microscope (VHX-6000; Keyence, Tokyo, Osaka, Japan). Images captured to automatically obtain the areas of cells (Figure 1A) were flipped after editing their brightness using accessory software (Figure 1B). The images produced during this editing could not be stored; therefore, they were drawn using an onscreen editing process (Figure 1B). To accurately select cell areas from the images, the images were adjusted to the appropriate brightness and flipped. These adjustments dramatically reduced the likelihood of incorrect identification of cell length and cell area. The cell area was also automatically measured using ImageJ software (https://imagej.nih.gov/ij/download.html, accessed on 14 October 2022) [3]. Image J was used only in the conventional method to measure cell length (Figure 1C) or area to elute large unbudded cells simply by physical observations of the measurements and at least 30 cells from each strain. Here, the length of the longest part of the cell was determined. The length of the cells was calculated as the length of the longest line drawn virtually in each cell at least three times. Cell area and length measurements were performed without specific noise reduction. As the cells targeted for detection and separation were stained with MB, each cell in the medium was identifiable in the images. When both types of measurements for the cell area were performed to avoid collecting incorrect data, each picture was quickly confirmed one by one for the cells. The length of the cells was acquired on a screen using accessory software. When the longest diameter of each cell was found, measurements were performed at least three times to obtain a precise result because the longest part was difficult to find. Cells were also lengthened using a cello-meter X2 (Nexcelom, Lawrence, MA, USA), an electronic cell counter based on the fluorescent imaging of each yeast cell. It can easily measure cell volumes and their distribution in culture without geometrical problems. To obtain the appropriate data, a single large cell (a typical example is shown in the upper panel of Figure 1B) was chosen randomly without budding cells or very small cells in all experiments to avoid bias in the selection of data, and a minimum of 30 specifically selected cells were enough. Yeast dilution buffer and yeast live/dead staining solution (Nexcelom, Lawrence, MA, USA) were used during the measurement, and the cellular fluid was diluted 6–20 fold. The yeast live/dead staining solution contained green fluorescent nucleic acid stain, acridine orange, red-fluorescent nucleic acid stain, propidium iodide, and a dilution buffer. Propidium iodide is a membrane exclusion dye that only enters cells with compromised membranes, whereas acridine orange penetrates all cells in a population. The nucleus exhibits both dyes; however, propidium iodide causes a reduction in acridine orange fluorescence via fluorescence resonance energy transfer (FRET). Yeast with intact membranes stained fluorescent green and were counted as live, whereas yeast with compromised membranes stained fluorescent red and were counted as dead when using the cello-meter X2 system. The fluorescence exposure time was set to 600 ms. Again, the measurements were performed without specific noise reduction because the cells targeted for detection and separation were stained with live/dead yeast staining solution. Each cell in the medium solution was identified in the images, as confirmed by monitoring with a cello-meter X2.
2.4. Statistical Analysis
T-tests in Excel and R software (http://www.r-project.org/, accessed on 14 October 2022) were used to determine whether there were statistical differences between the data.
3. Results and Discussion
3.1. Validation of the Proposed Method in Comparison with Conventional Methods
Cell staining using MB was also performed in this study [4]. MB is an inexpensive and easy-to-use chemical that can be used to evaluate the adsorptivity of carbonized fibers [9,10,11,12,13,14]. Figure 1A shows densely stained and dead cells, which are indicated by the arrows.
In the present study, conventional methods were used to evaluate the length of the cell, whereas the proposed method involved evaluating the area of each cell. The conventional method includes manual measurement of the length of each cell. First, we have to choose a cell, then draw a virtual line and measure the read length. In contrast, the proposed method can simultaneously obtain area values for approximately 30 cells. Hence, the proposed method is advantageous compared to the conventional method, as the former is less time consuming.
Devices are available for counting the number of cells. Dedicated fluorescent reagents are used to stain dead and live cells [6,15] and measure their size. However, they have mainly been used to count cell numbers to observe cell growth. In addition to MB, trypan blue has also been used [15]; it was shown that trypan blue can rapidly accelerate the influx of water into dead cells and cause the cells to disappear after death. The free ImageJ software allowed the analysis of cells in the captured microscopic images [3] and can also be used for cell counting in conventional methods. Even with conventional methods, editing of image data was necessary (Figure 1). However, using the proposed methods, the area data can be easily acquired in the observation software using an application prepared in advance. Until now, defects in the viewing image had to be handled by reacquiring observational data using conventional methods; however, the proposed method requires considerably less time. Both the focus and field of view can be selected by clicking on a mouse. The data could be moved from one field of view to another in an image within 1 s. This means that almost the same time is required in all introduction methods in the present study, although the proposed method took less time for the measurements. However, further advancement in the method is required to complete the process quickly. Because conventional methods require the opening of image-processing software for each image, the proposed method is time economical.
Therefore, an automatic method for measuring the cell area using a general-purpose microscope was proposed. First, data from two strains, EC and BC, were compared using the proposed and conventional methods (Figure 2). There was a statistically significant difference between the strains when the conventional method was used. However, the proposed method increases the standard deviations, which may affect statistical difference. In future studies, we will try various strains multiple times to verify whether the proposed method is easier to use than conventional methods. Although there is a disadvantage in that the values must be confirmed visually, and that an error may occur during this process, the fact that the area values of many cells can be obtained at the same time will lead to a speeding up of the process. However, because the proposed method can acquire data quickly, we would like to highlight the merits of quick data acquisition. Additionally, we would like to clarify whether the data are easy to spread, whether it is due to the strain or experiment used at this time, or whether the proposed method is defective. This is because using the data for the cell size difference of each cell population will be a useful tool for comparison with other populations to identify a cell population.
3.2. Measurement of Cell Area and Length
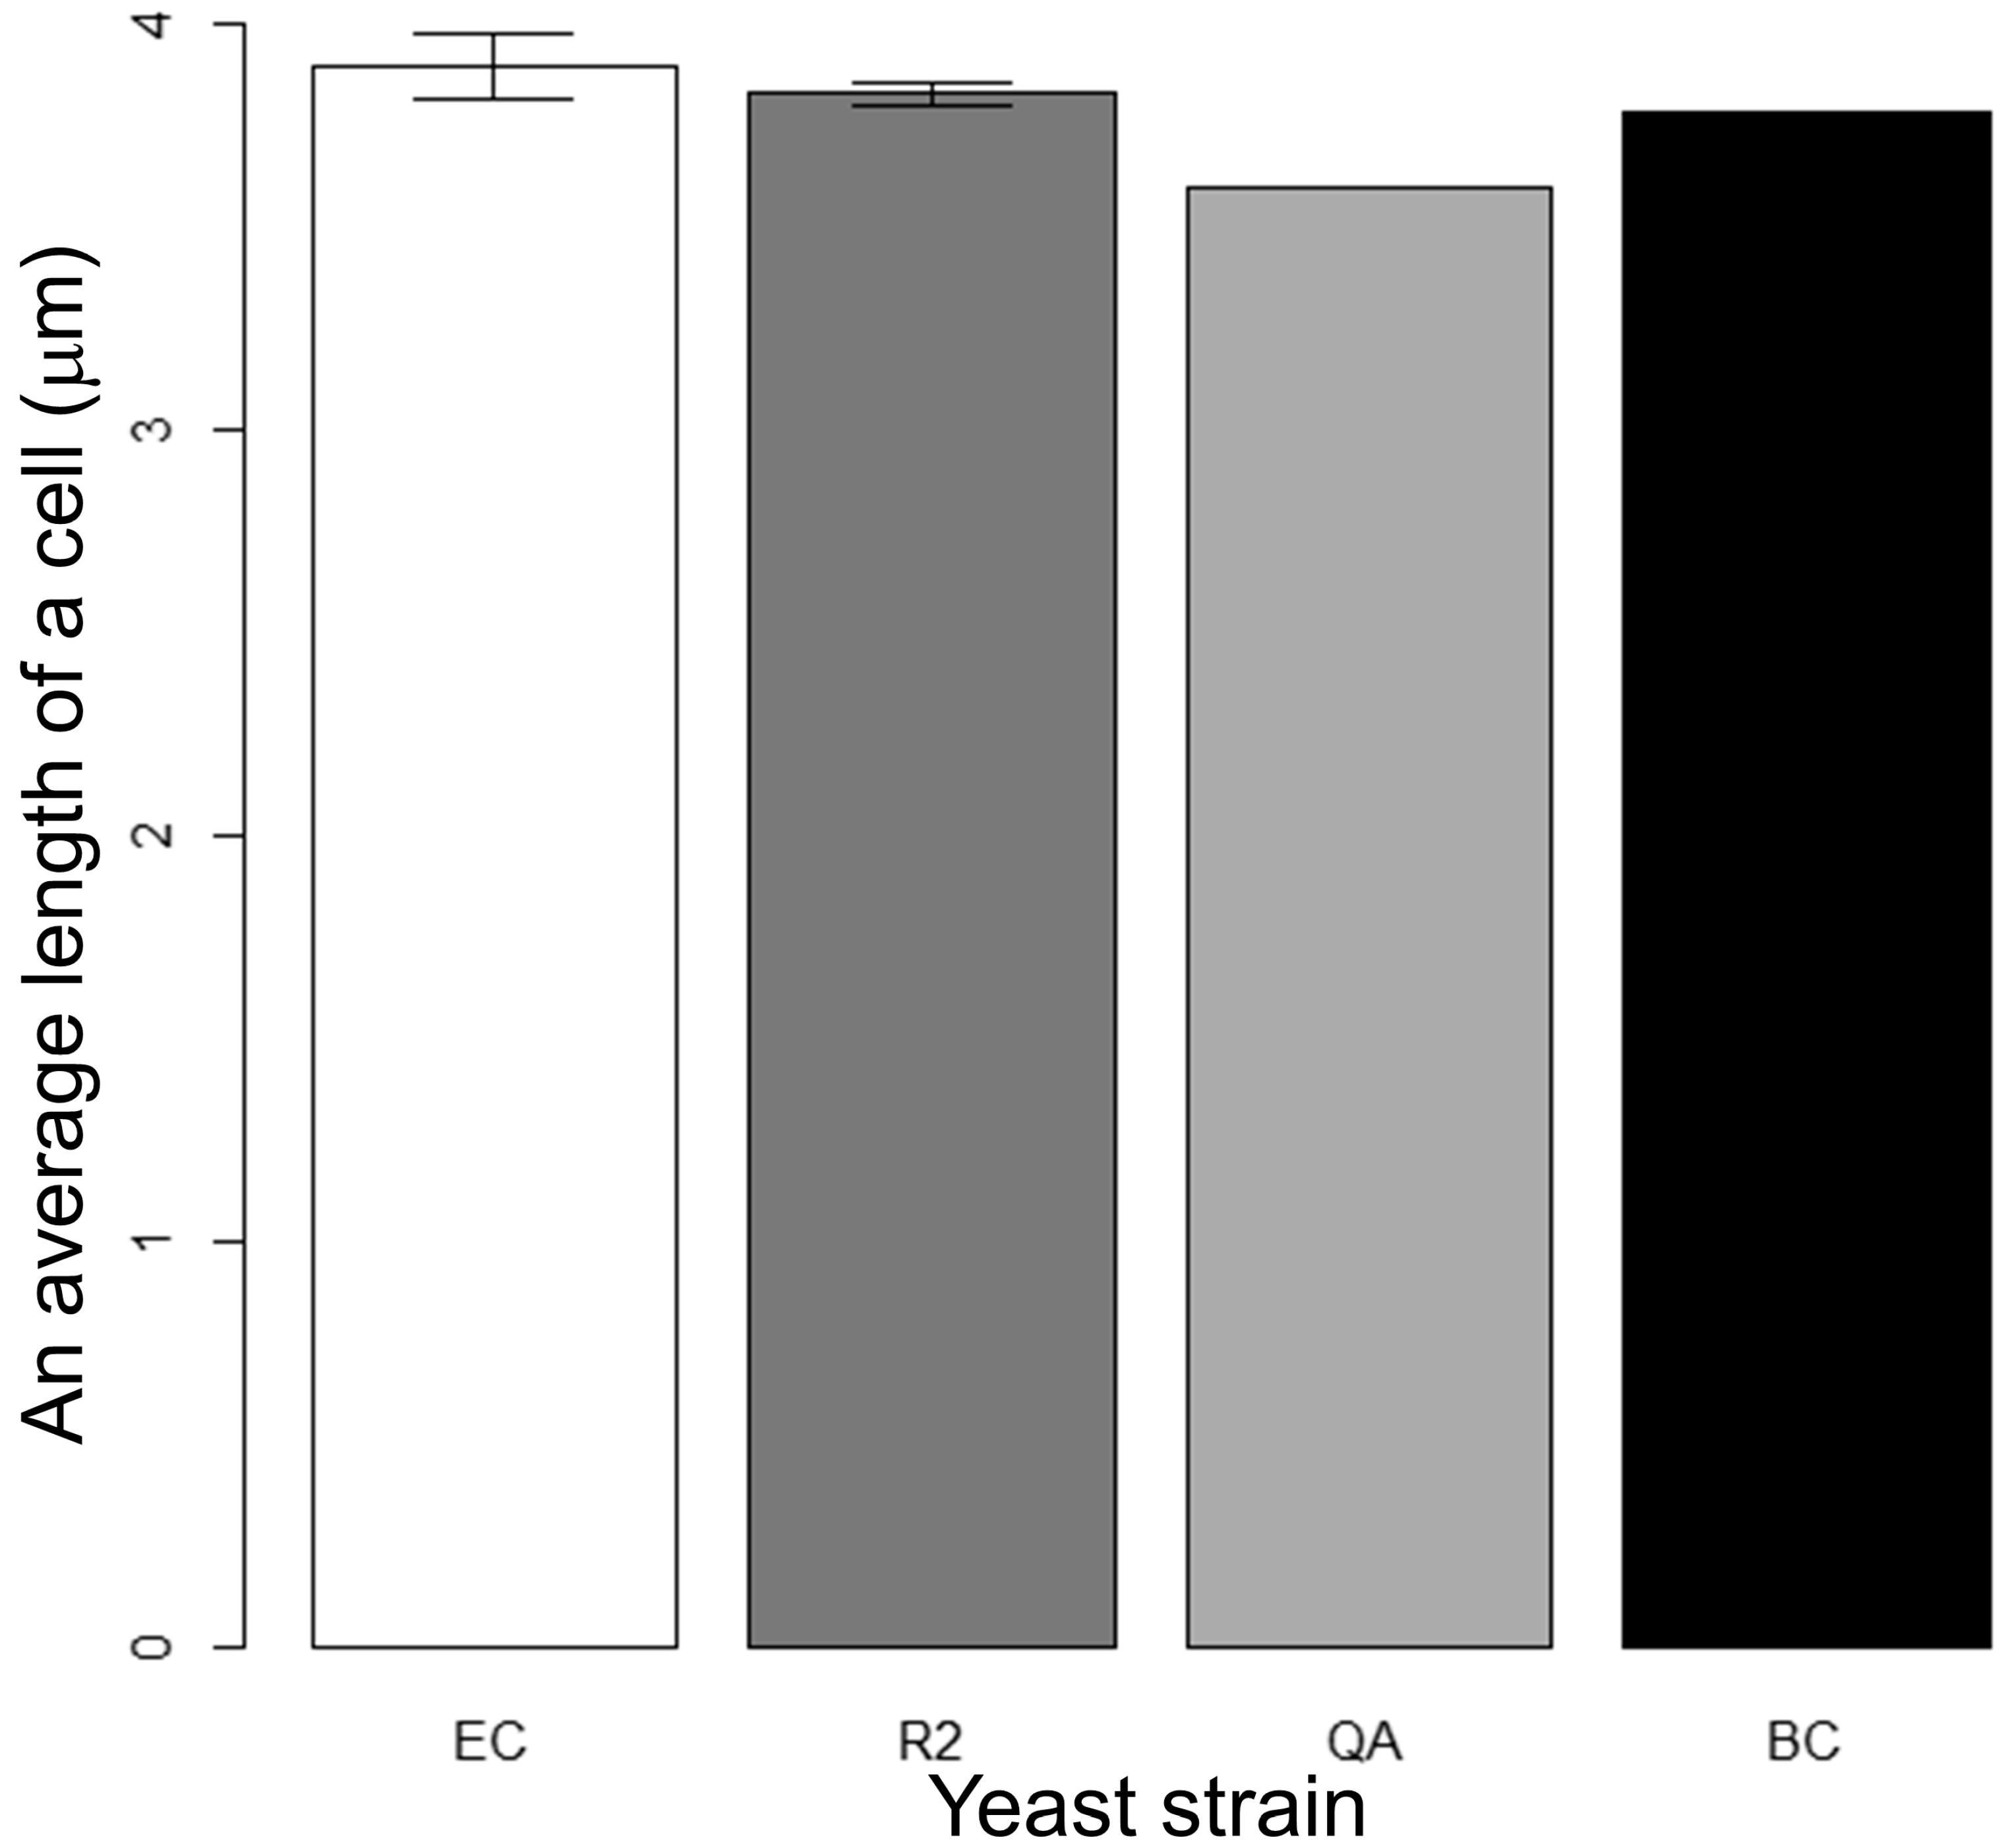
Next, four commercial yeasts commonly used in wine were cultured and their cell areas were automatically measured (Figure 3). After acquiring the images, the size of each cell was acquired in seconds by inverting and performing the automatic measurement of the area after controlling the brightness. This task required the removal of abnormal cells; however, this procedure could be completed within a minute of inclusion. Figure 4 shows the length measurements (Figure 1C), similar to the cells shown in Figure 3 using accessory software. The p-values of the data in Figure 3 are shown in Table 1. The order of size of both the cell area and length was as follows: BC, R2, QA, and EC. The length and area were plotted on the horizontal and vertical axes, respectively (for all cells (Figure 5) and for each strain (Figure 6)). As the plot was nearly linear, it was unlikely that the area value would be used as the cell size. Automatic cell length measurements by the software could be possible using the Marco language with ImageJ [16]. As shown in Figure 1C, because the longest part of the cell length must be measured at various angles, it was speculated that automatic measurements would be difficult to perform within a short time.
3.3. Results of Cell Size Obtained Using Conventional Automated Methods
The cell size was measured for the same yeast using a Cello-meter X2 specialized for measuring cell number and size. The results are shown in Figure 7. The p-values of the data in Figure 7 are listed in Table 2. The cell sizes were smaller than the values measured using the conventional and proposed methods in the observed images. Thus, the results obtained using human measurements under a microscope [4] indicated that the automated cell size measurement results [8] were also smaller in the same yeast strains. This may be because some small cells were neglected when viewed under a microscope by the human eye. Some of the excisions may not be cellular, while others may be cellular but are very small in size. The correlation coefficient between the cell size and area was calculated as 0.66 using linear and quadratic function approximations. It was calculated by dividing the four strains, 0.95, 0.95, 0.92, and 0.92, for EC, R2, QA, and BC, respectively, in the linear approximation, and 0.96, 0.95, 0.92, and 0.97 for EC, R2, QA, and BC, respectively, in the quadratic function approximation (Figure 6). Although the correlation coefficient using all data (Figure 5) was small, it was high when the same strain was used in the calculation (Figure 6). It was thought that the auto-area measurements reflected the cell length data well. The correlation coefficient obtained using quadratic function approximation was slightly greater than that obtained using linear approximation. This is because the area is proportional to the square of the length, the linear approximation, and the quadratic function approximation.
3.4. Discussion of the Results and Future Applications
In the present study, I conducted yeast cell size measurements and characterized each yeast strain, which was similar to the commercially used wine yeast strains. Although diversity in wine brewing yeast strains was discussed earlier [17], to the best of my knowledge, the actual cell size of each strain was investigated for the first time in the present study. The data from the current study suggest that the size of each strain can be characterized. Therefore, it is important to initiate studies on the diversity of wine yeast shapes.
Conventionally, the size of cells is automatically measured as the maximum radius in the chamber with the IBM-PC program that automatically measures the maximum and minimum radius as pixels [2]. In this method, to use the data, pixels should be calculated in µm [2]. Using ImageJ methods [3], the data to output can be obtained in µm. Previous methods [2,13] required additional steps to measure a certain length, whereas the automated measurement showed a micrometer scale without specific calculation, and this procedure needs to be confirmed. Additional steps include acquiring the image data and moving to another computer for data processing to measure the scale. The previous data and the data obtained using the automatic functions were similar. Therefore, these methods can combine data acquisition and processing and simultaneously process the length and area of image data. Automated measurement functions are not very different; thus, the process could be omitted, which is advantageous. Automated measurements using the same type of microscope have been performed in various studies [6,7]. In particular, this technique seems to be a powerful tool for self-assembly evaluation of inorganic substances and measurement of the conformation of the surfaces of inorganic substances [18,19]. Previously, significant efforts were made to measure single cells using quantitative phase imaging with digital holographic microscopy (DHM) to analyze cell-mass [20,21,22]. These methods can measure single-cell growth over each phase of the cell cycle [20,21] and provide sophisticated quantification of cell culture [22]. Recent studies have also reported better results in distinguishing cells by ultrafine processing [23] and using devices that allow the yeast shape to be remembered and automatically selected [24]. In our previous studies, we reported that flavor may regulate the fluidity of lipid membranes, which affects cell size [4,8]. In these previous studies, we measured the fluidity of artificial flavor-containing cell membranes using Laurdan as a fluorescence probe. The results obtained using artificial cell membrane systems indicated that vesicular size and fluidic properties were correlated. We also found that yeast cell size corresponded to flavor production using the relative strain of yeast. The yeast strain that produced a good flavor was smaller (5.7 μm) than the strain that produced standard flavors (6.3 μm) in the stationary phase, and larger (4.6 μm) than the normal strain (4.2 μm) in the log phase [8]. Recently, another group reported similar results using a genome-edited yeast strain. The group reported that the cell size was larger in genome-edited strains for good flavor production than in base strains in the lag phase [25]. These results are consistent with those of our previous report [4]. The relationship between cell size and flavor production using small-scale brewing with large yeast strains will be investigated to clarify this mechanism. It is necessary to conduct exhaustive research using a large number of yeast strains and small-scale brewing because the proposed method consumes less time. One advantage of the proposed method over conventional methods is the reduction in human bias due to the reduced number of processes. We found that cell size was different even within the same cell population at each growth stage [5,6]. This study focused on cell size and area; however, the precise growth stage for the accurate measurement of the cell population could not be determined. Although this study has good potential, the size of cells in a population depends on the stage of cell growth. Determining the appropriate timing, that is, the growth stage and cell population, will be investigated in future studies. In the future, combination with other parameters of cells, such as cell mass, cell volume, and cell size or cell-area will provide more characteristic biophysical information on cell conditions. Additionally, various strains will be investigated.
When constructing a microfabrication system for distinguishing cells or allowing cells of a certain type, cell size must be measured in advance. At such times, the proposed technique may be helpful. In the conventional method, information can be acquired by combining free software and microimage data. The reported integration of attached applications with a microscope allows faster and more accurate data acquisition. Yeast is also used for fermentation; thus, it has potential applications in characterizing flavor production. A method for rapid cell measurement has prospective applications in determining how cell size is involved in important value assessments of food and drink products [6].
However, there are some challenges. Smaller cells have been counted using machines that simultaneously measure many cells but not by humans. To date, it is not well understood which measurement is correct or yields errors. Resolving these questions represents a future issue. However, instruments that measure the cell number and size require relatively expensive fluorescent reagents [5,15]. When label-free analysis is performed using DHM [20,21,22], the steps of cell staining can be omitted, although DHM is also an expensive instrument. It may be helpful to rapidly measure the cell size and area using inexpensive MB without a fluorescent reagent.
4. Conclusions
In summary, four pure cultured common yeast strains were automatically and rapidly measured using a general-purpose digital microscope, with size measurement as an area value. The actual cell size of each wine yeast strain was investigated in this study. The strengths and disadvantages of the proposed method are discussed. The data obtained by the proposed method can be quickly acquired and easily disseminated because it removes some steps from the observations needed to characterize cell populations. By reducing the number of steps, we reduced the likelihood of human bias degrading the data quality. Furthermore, unlike equipment that automatically measures cells, staining with MB requires no fluorescent dye and is relatively cheap, allowing the quick acquisition of cell-size data. In the future, we will clarify whether the data are easy to spread or not to try many strains multiple times for verification. The area was linear to the length of the cells under a microscope. Moreover, the importance of obtaining data for each yeast strain is discussed, although a new technology-based cell-selection system is emerging. In the future, we will measure the relationship between biomolecule production, such as flavors, with cell area and cell size.
Funding
This research was funded by the Konica Minolta Imaging Science Encouragement Award (Konica Minolta Science and Technology Foundation), Intelligent Cosmos Award (Intelligent Cosmos Foundation), a JSPS KAKENHI Grant Number JP20K19699 from the Japan Society for the Promotion of Science (JSPS), and a grant from the Research Challenge and Third Term Research Project from Aomori Prefectural Industrial Technology Research Center.
Data Availability Statement
Research data have been provided in the manuscript.
Acknowledgments
The author thanks Tomoya Akahira and Yoshiko Kimura from the Apple Research Institute, Aomori Prefectural Industrial Technology Research Center, for allowing the author to use the microscope, and Hiroshi Miyaki and Tomoaki Saito for pure culture of yeast. The author gratefully received technical support from Akira Ogura for critical reading at the Hirosaki Industrial Research Institute Aomori Prefectural Industrial Technology Research Center.
Conflicts of Interest
The author declares no conflict of interest.
References
- Turner, J.J.; Ewald, J.C.; Skotheim, J.M. Cell size control in yeast. Curr. Biol. 2012, 22, R350–R359. [Google Scholar] [CrossRef] [PubMed] [Green Version]
- Cruz, J.M.; Garcia-Diego, F.J. Dielectrophoretic force measurements in yeast cells by the Stokes method. In Proceedings of the 1997 IEEE Industry Applications Conference Thirty-Second IAS Annual Meeting, New Orleans, LA, USA, 5–9 October 1997; Volume 2012–2018. [Google Scholar] [CrossRef]
- ImageJ. Wo Tsukatta Saibou Su No Keisoku. Available online: https://slideshowjp.com/doc/1559964/imagej-%E3%82%92%E4%BD%BF%E3%81%A3%E3%81%9F%E7%B4%B0%E8%83%9E%E6%95%B0%E3%81%AE%E8%A8%88%E6%B8%AC (accessed on 14 October 2022).
- Yoda, T.; Ogura, A.; Saito, T. Influence of ethyl caproate on the size of lipid vesicles and yeast cells. Biomimetics 2020, 5, 16. [Google Scholar] [CrossRef] [PubMed]
- Katakura, Y.; Ohmasa, T.; Naganuma, T.; Ono, H. Yuyo-Biseibutsu-No-Iroha [ABC of Useful Microorganisms]; NTS Ltd.: Tokyo, Japan, 2016. (In Japanese) [Google Scholar]
- Chan, L.L.; Lyettefi, E.J.; Pirani, A.; Smith, T.; Qiu, J.; Lin, B. Direct concentration and viability measurement of yeast in corn mash using a novel imaging cytometry method. J. Ind. Microbiol. Biotechnol. 2011, 3, 1109–1115. [Google Scholar] [CrossRef] [PubMed]
- Yoda, T. Quality evaluation of drinks based on liposome shape changes induced by flavor molecules. ACS Omega 2022, 7, 5679–5686. [Google Scholar] [CrossRef]
- Yoda, T.; Saito, T. Size of cells and physicochemical properties of membranes are related to flavor production during sake brewing in the yeast Saccharomyces cerevisiae. Membrane 2020, 10, 440. [Google Scholar] [CrossRef]
- Kaewprasit, C.; Hequet, E.; Abidi, N.; Gourlot, J.P. Application of methylene blue adsorption to cotton fiber specific surface area measurement: Part I. Methodology. J. Cotton Sci. 1998, 2, 164–173. Available online: https://www.cotton.org/journal/1998-02/4/upload/jcs02-164.pdf (accessed on 14 October 2022).
- Yoda, T.; Shibuya, K.; Miura, K.; Myoubuddani, H. Characterization of the adsorption ability of silk-derived activated carbon fibers using X-ray analysis and camera imaging methods. Measurement 2017, 101, 103–110. [Google Scholar] [CrossRef]
- Yoda, T.; Shibuya, K.; Myoubudani, H. Preparation of activated carbon fibers from mixtures of cotton and polyester fibers. Measurement 2018, 110, 572–576. [Google Scholar] [CrossRef]
- Yoda, T.; Shibuya, K.; Myoubudani, H. Preparation of activated carbon fibers from fiber mixtures. J. Text. Sci. Fash. Technol. 2018, 1, JTSFT.MS.ID.000510. [Google Scholar] [CrossRef]
- Yoda, T.; Shibuya, K.; Miura, K.; Myoubudani, H. Effects of two-step heat treatment on the structure of cotton-derived activated carbon fibres. Int. J. Mater. Struct. Integr. 2020, 14, 33–43. [Google Scholar] [CrossRef]
- Chen, W.; Qian, J.; Zhang, M.; Lu, W.; Zhang, S.; Xu, H. Recycle of cotton waste by hard templating with magnesium acetate as MgO precursor. Environ. Sci. Pollut. Res. 2019, 26, 29908–29916. [Google Scholar] [CrossRef] [PubMed]
- Chan, L.L.Y.; Rice, W.L.; Qiu, J. Observation and quantification of the morphological effect of trypan blue rupturing dead or dying cells. PLoS ONE 2020, 15, e0227950. [Google Scholar] [CrossRef] [PubMed] [Green Version]
- ImageJ for Image Resolution by Marco Language. Available online: https://lp-tech.net/articles/paDGX (accessed on 5 February 2022).
- Ohnuki, S.; Okada, H.; Friedrich, A.; Kanno, Y.; Goshima, T.; Hasuda, H.; Inahashi, M.; Okazaki, N.; Tamura, H.; Nakamura, R.; et al. Phenotypic diagnosis of lineage and differentiation during sake yeast breeding. G3 2017, 7, 2807–2820. [Google Scholar] [CrossRef] [Green Version]
- Biggemann, J.; Diepold, B.; Pezoldt, M.; Stumpf, M.; Greil, P.; Feyet, T. Automated 3D assembly of periodic alumina-epoxy composite structures. J. Am. Ceram. Soc. 2018, 101, 3864–3873. [Google Scholar] [CrossRef]
- Leksycki, K.; Królczyk, J.B. Comparative assessment of the surface topography for different optical profilometry techniques after dry turning of Ti6Al4V titanium alloy. Measurement 2020, 169, 108378. [Google Scholar] [CrossRef]
- Rappaz, B.; Cano, E.; Colomb, T.; Kuhn, J.; Depeursinge, C.D.; Simanis, V.; Magistretti, P.J.; Marquet, P.P. Noninvasive characterization of the fission yeast cell cycle by monitoring dry mass with digital holographic microscopy. J. Biomed. Opt. 2009, 14, 034049. [Google Scholar] [CrossRef]
- Mir, M.; Wang, Z.; Shen, Z.; Bednarz, M.; Bashir, R.; Golding, I.; Prasanth, S.G.; Popescu, G. Optical measurement of cycle-dependent cell growth. Proc. Natl. Acad. Sci. USA 2011, 108, 13124–13129. [Google Scholar] [CrossRef] [Green Version]
- Kastl, L.; Isbach, M.; Dirksen, D.; Schnekenburger, J.; Kemper, B. Quantitative phase imaging for cell culture quality control. Cytom. Part A 2017, 91A, 470–481. [Google Scholar] [CrossRef] [Green Version]
- Jo, M.C.; Liu, W.; Gu, L.; Dang, W.; Qin, L. High-throughput analysis of yeast replicative aging using a microfluidic system. Proc. Natl. Acad. Sci. USA 2015, 112, 9364–9369. [Google Scholar] [CrossRef] [Green Version]
- Isozaki, A.; Mikami, H.; Tezuka, H.; Matsumura, H.; Huang, K.; Akamine, M.; Hiramatsu, K.; Iino, T.; Ito, T.; Karakawa, H.; et al. Intelligent image-activated cell sorting 2.0. Lab Chip 2020, 20, 2263–2273. [Google Scholar] [CrossRef]
- Chadani, T.; Ohnuki, S.; Isogai, A.; Goshima, T.; Kashima, M.; Ghanegolmohammadiet, F.; Nishi, T.; Hirata, D.; Watanabe, D.; Kitamoto, K.; et al. Genome editing to generate sake yeast strains with eight mutations that confer excellent brewing characteristics. Cells 2021, 10, 1299. [Google Scholar] [CrossRef] [PubMed]
Figure 1.
Image analysis of cells. (A) shows the overall image. The arrow indicates densely stained and dead cells (B) is an enlargement of a portion of (A) surrounded by a dotted line. The image is inverted after adjusting the image brightness (C) shows the length scale in this magnified section. The fine length l is the longest part of the cell.

Figure 2.
Automatically measured areas using conventional software methods ((right) EC and BC) and proposed methods ((left) EC and BC). More than 30 cells are measured for each yeast strain, and the results are presented as means with standard deviations and error bars. The proposed method detected no significant difference between EC and BC (p = 0.21 > 0.05), whereas the conventional method found a significant difference between the two strains (p = 2.2 × 10⁻⁴ < 0.05).
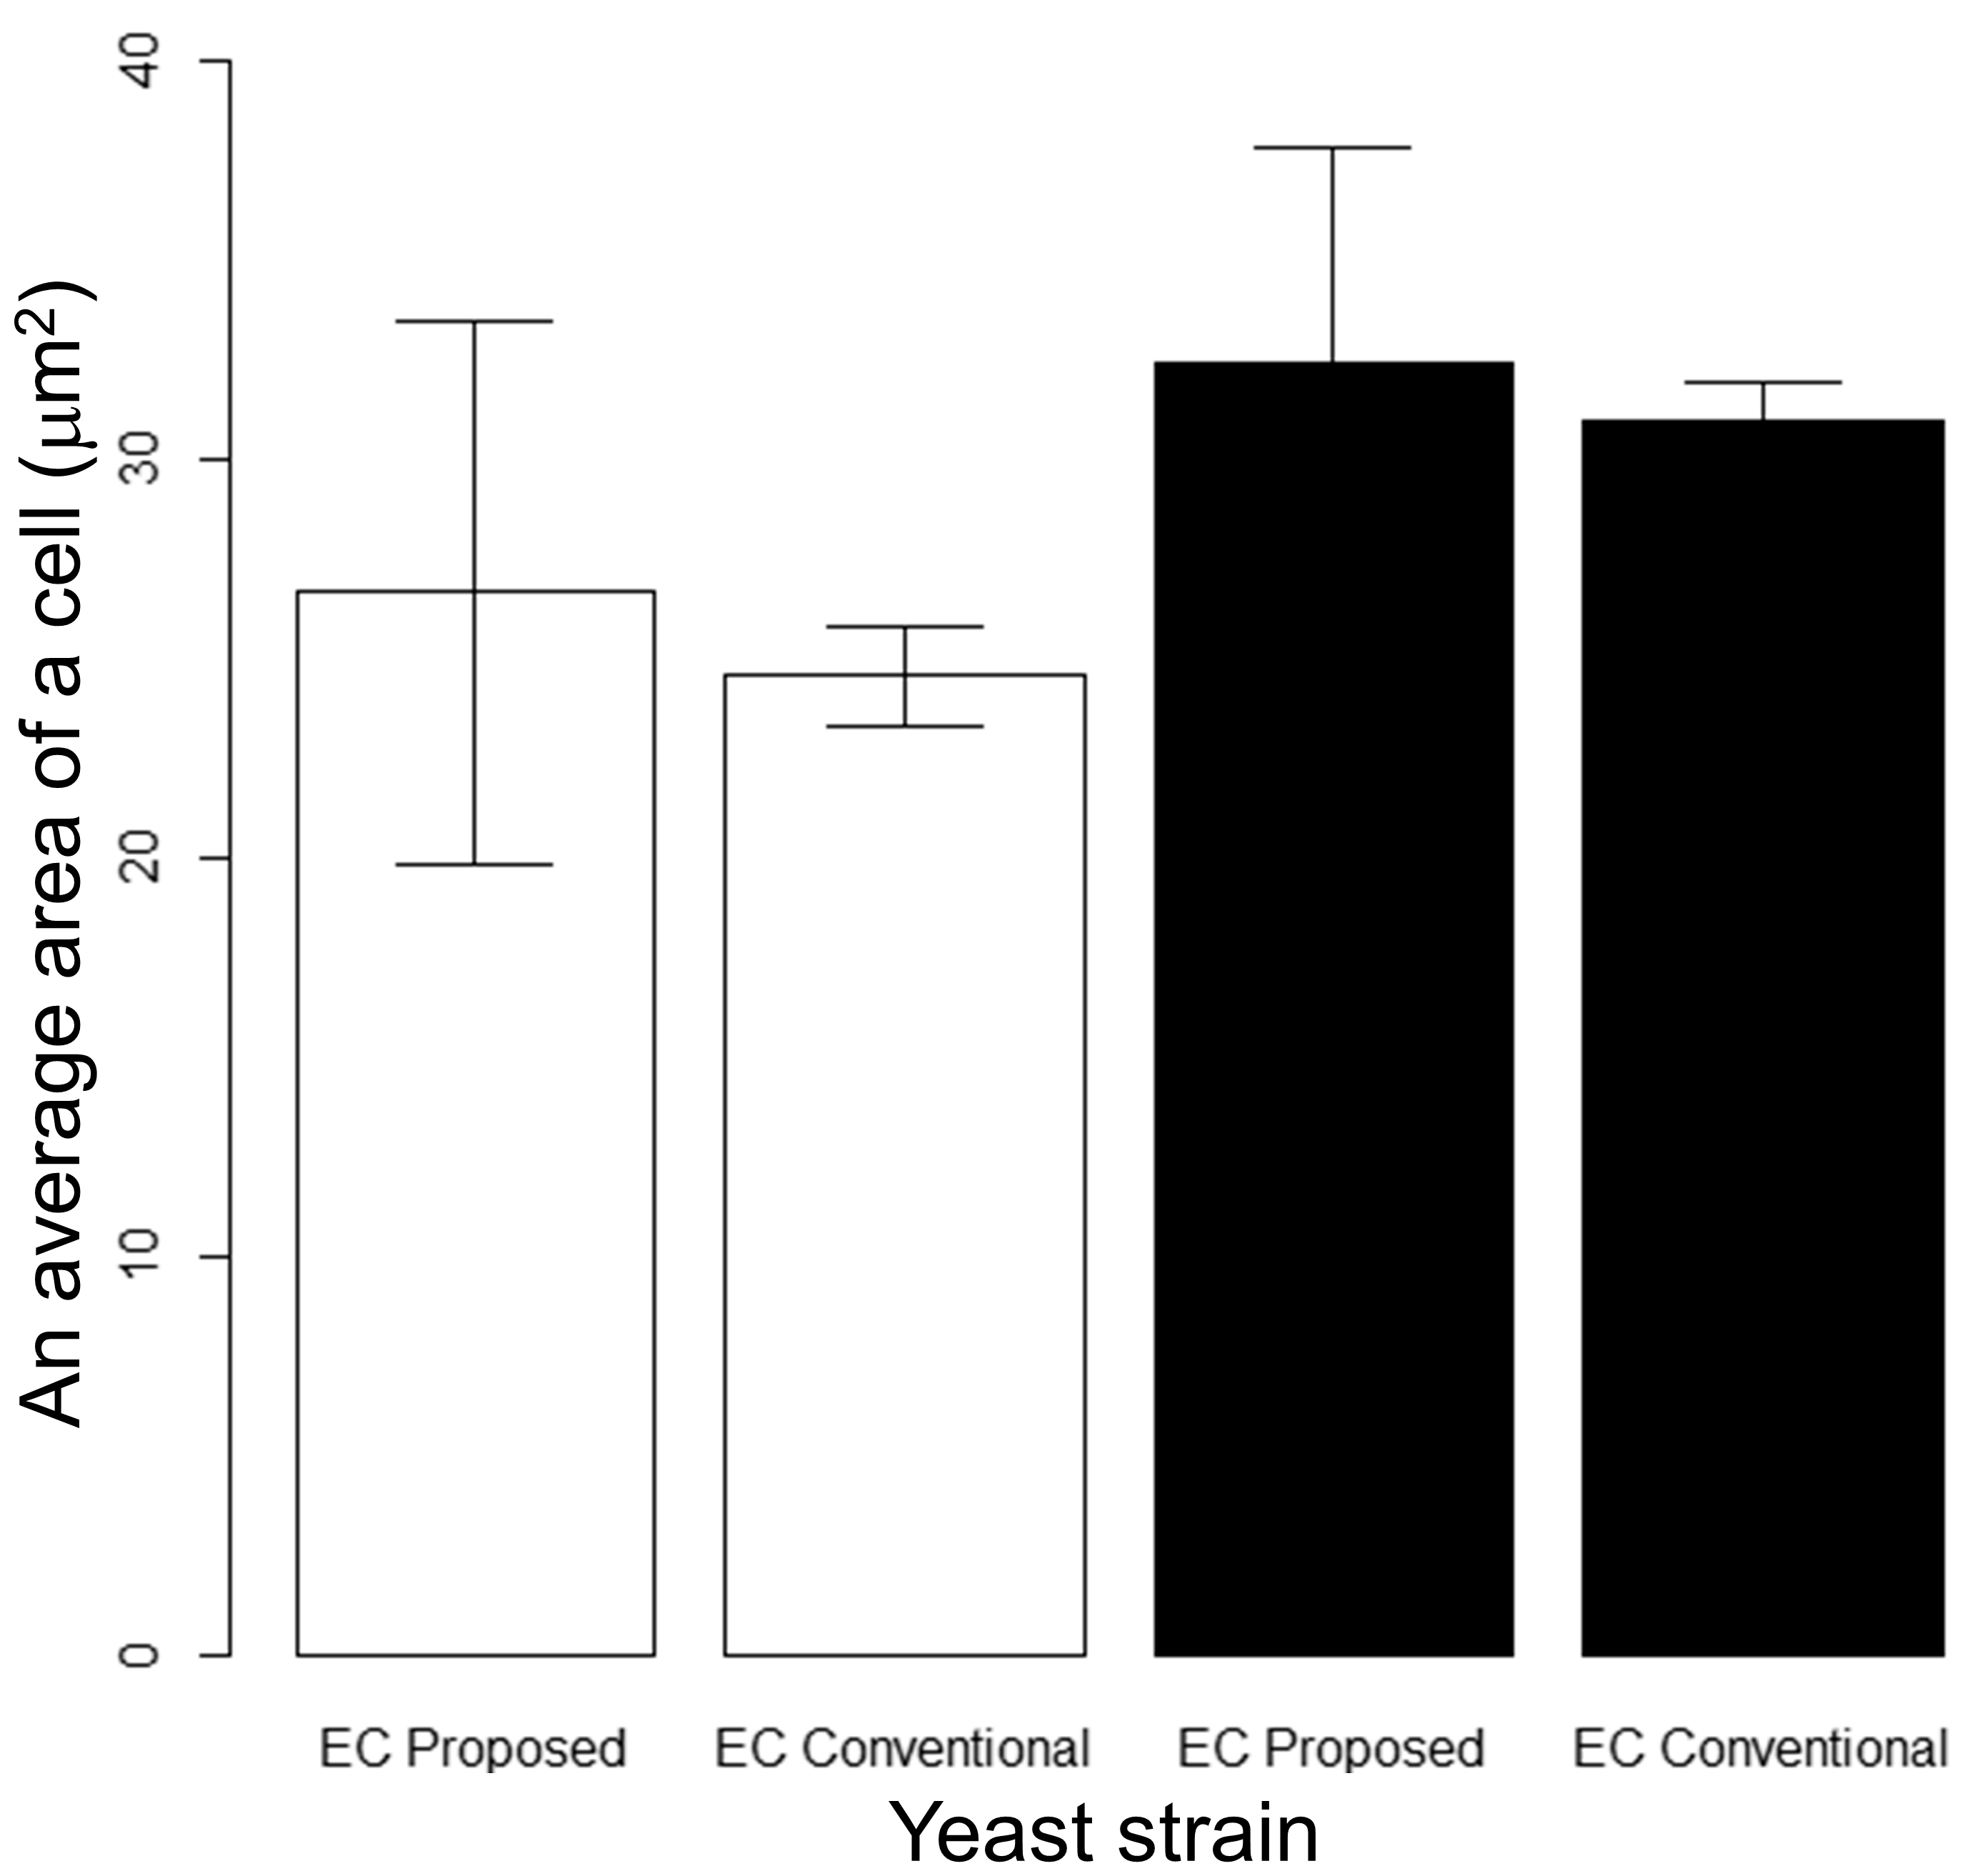
Figure 3.
Automatically measured area results. More than 30 cells are measured for each yeast strain. The results are presented as means with standard deviations and error bars. Significant differences were observed between EC with R2 and R2 with QA (both p-values were 0.001 < 0.05). No significant differences were observed between EC with QA, EC with BC, R2 with BC and QA with BC (p-values were 0.08, 0.21, 0.74, and 0.33, respectively).
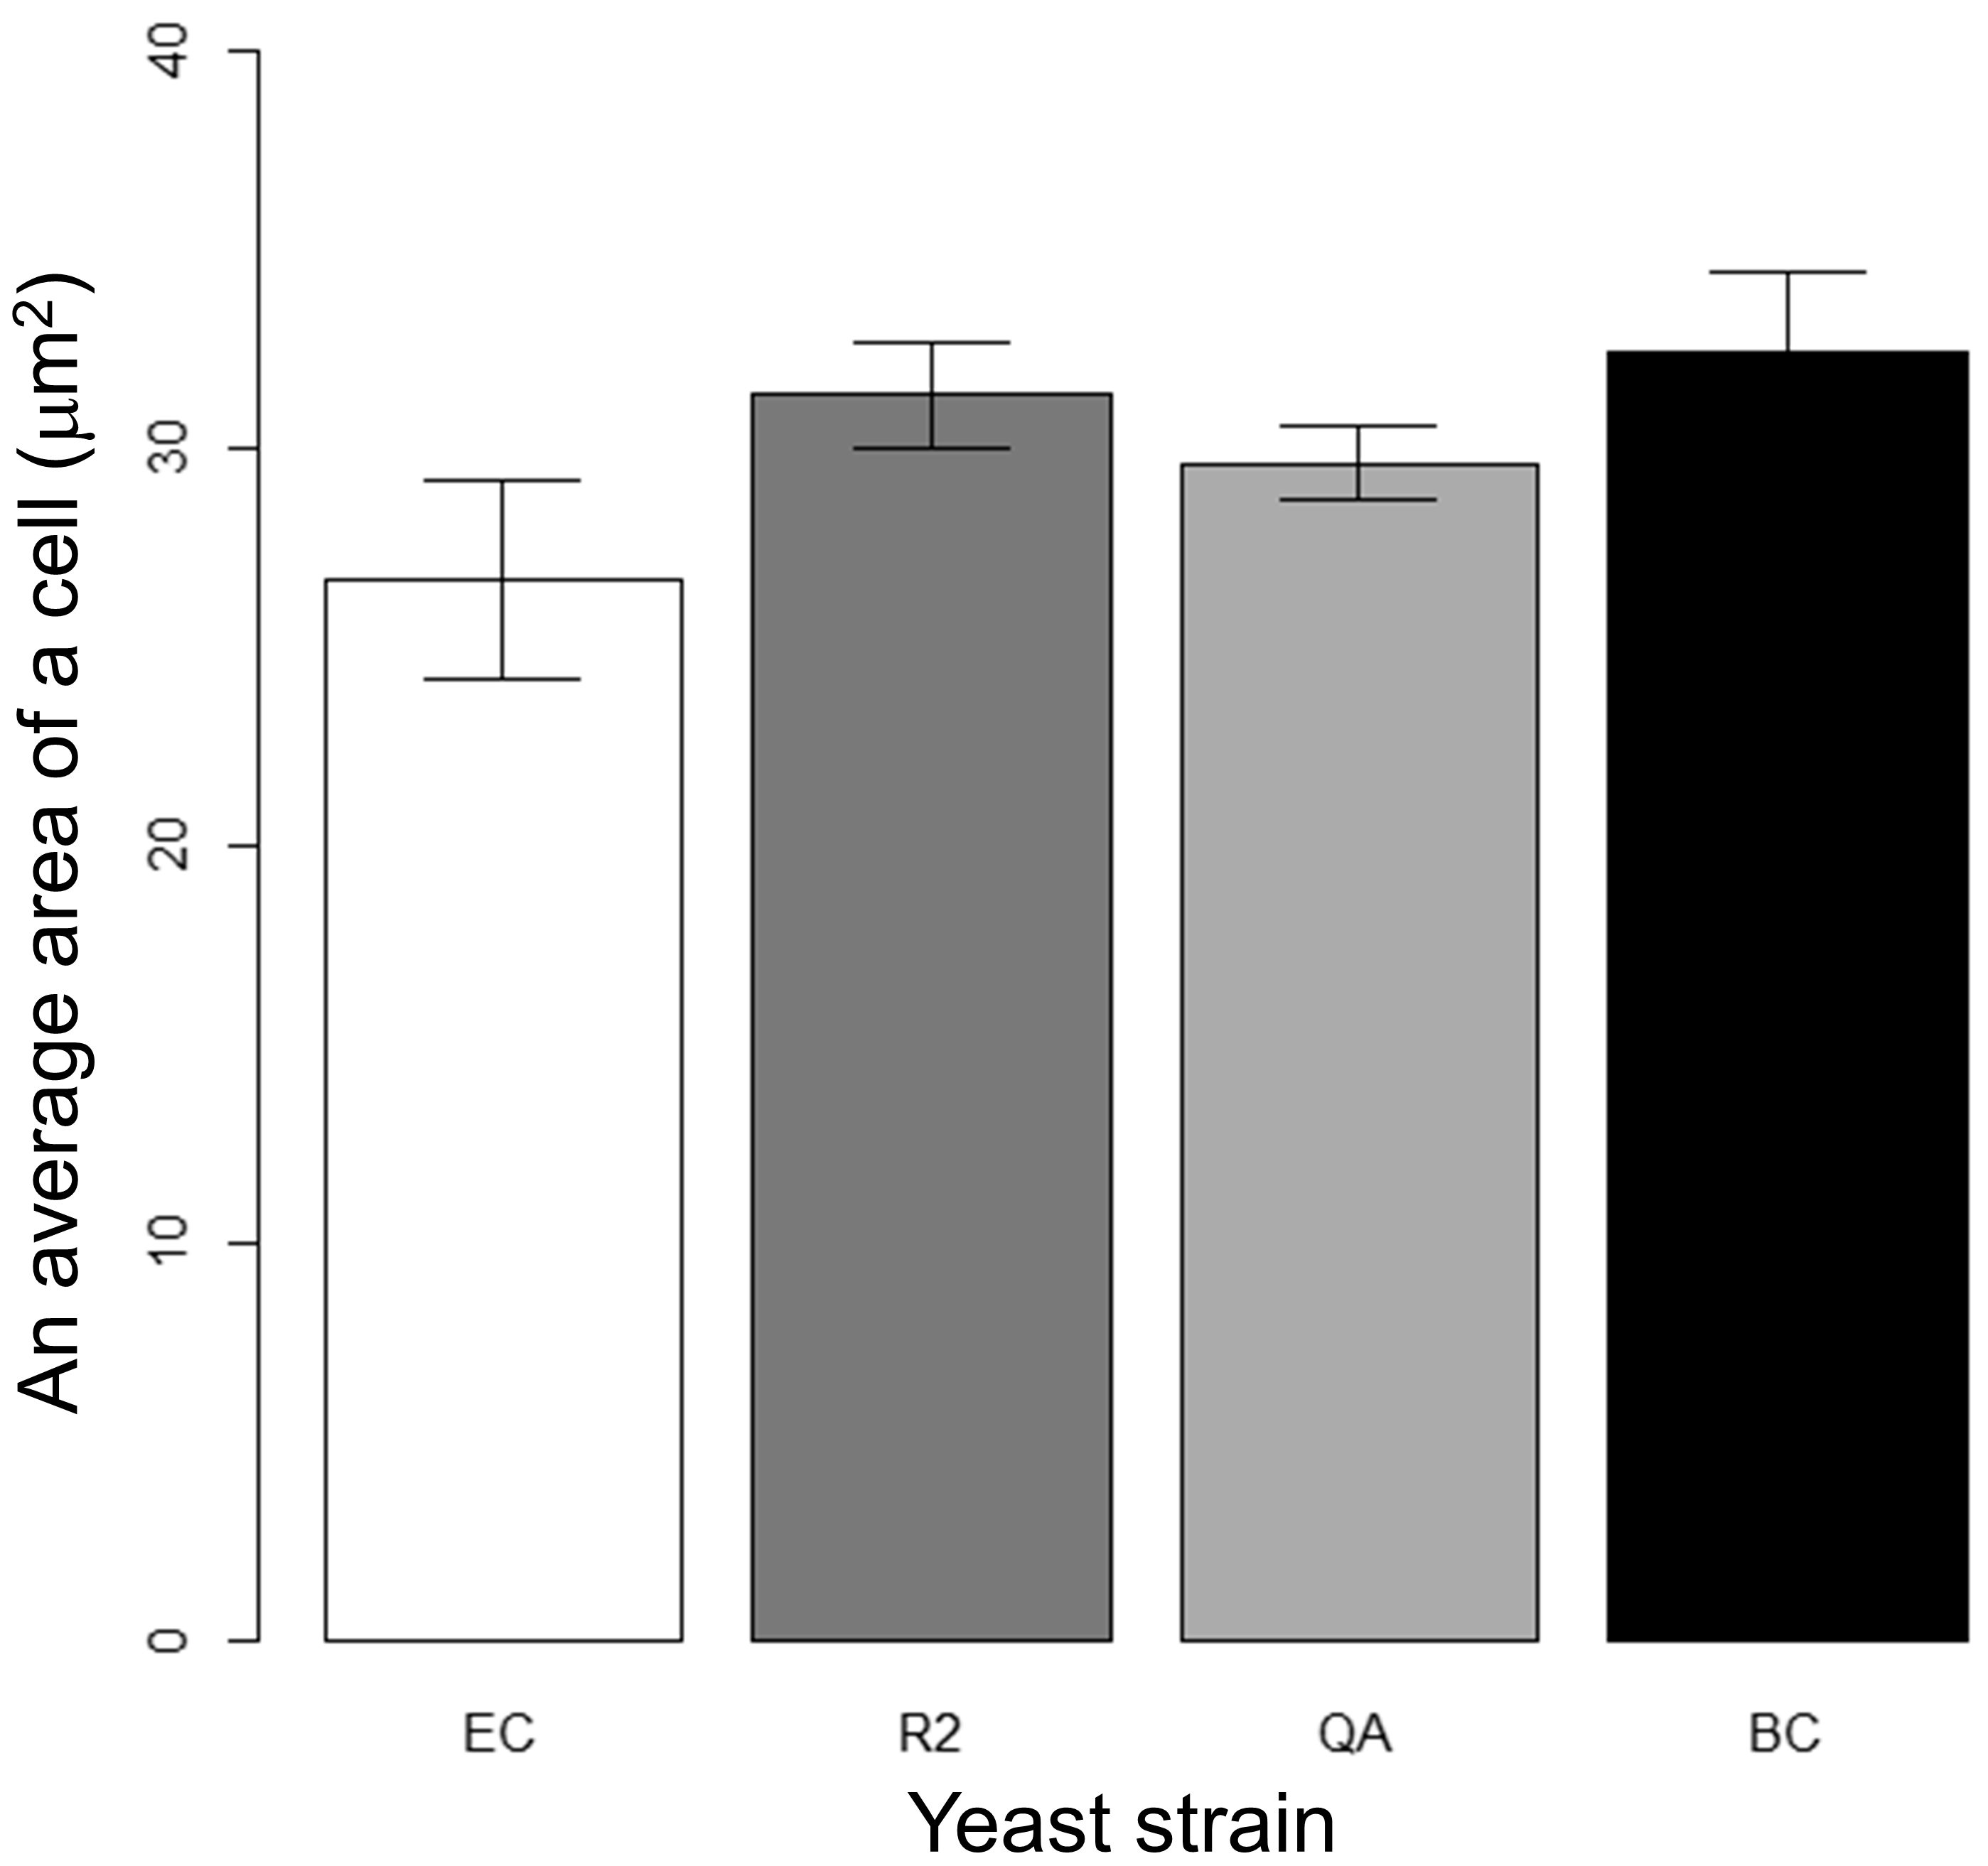
Figure 4.
Cell length results using the proposed method of the present study (using a digital microscope). More than 30 cells are measured for each yeast strain. Results are presented as means and standard deviations with error bars. Significant differences were observed between EC with R2, EC with BC, R2 with QA and QA with BC (p-values were 9.7 × 10⁷, 0.04, 5.9 × 10¹⁵ and 0.01, respectively, these values are smaller than 0.05). No significant differences were observed between EC with QA and R2 with BC (p-values were 0.28, and 0.55, respectively; these values are greater than 0.05).

Figure 5.
Automatically measured cell area vs. cell length.

Figure 6.
Automatically measured cell area vs. cell length for each strain. More than 30 cells are measured for each yeast strain (EC (A), R2 (B), QA (C), and BC (D)).
Figure 6.
Automatically measured cell area vs. cell length for each strain. More than 30 cells are measured for each yeast strain (EC (A), R2 (B), QA (C), and BC (D)).
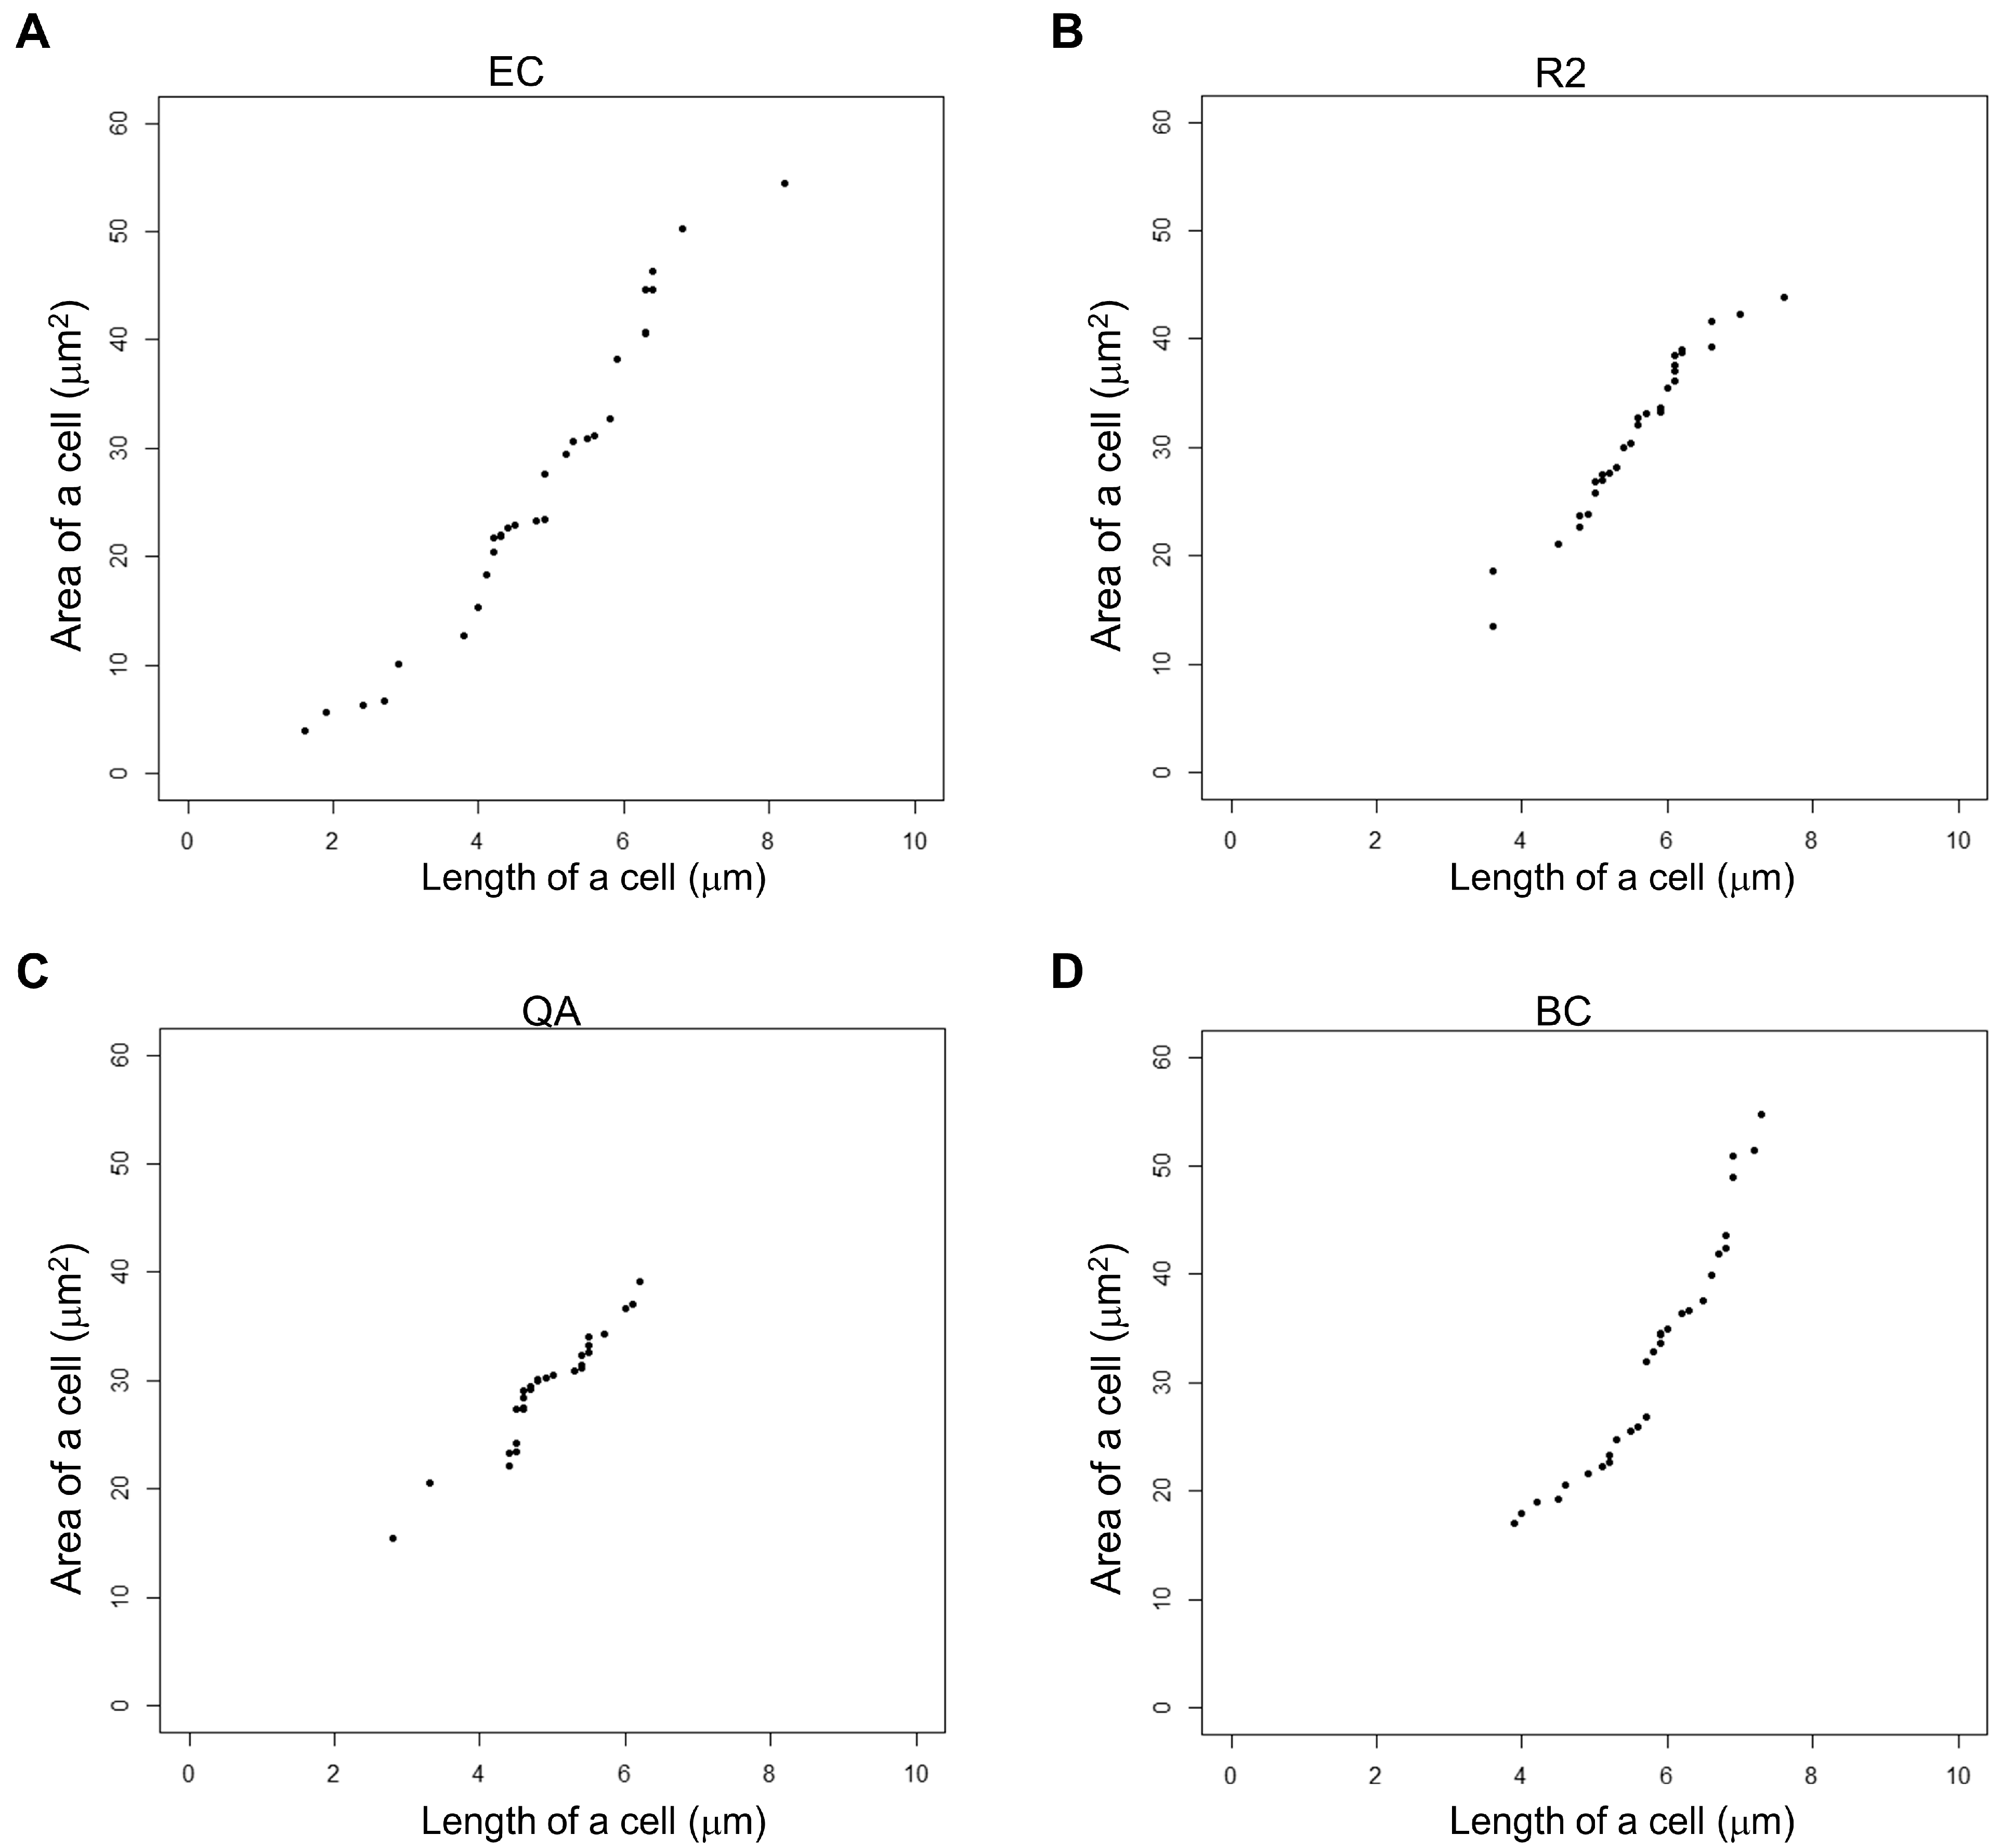
Figure 7.
Lengths of cells measured using the cell count machine [6]. The experiment is performed a minimum of three times, and more than 90 cells are measured for each value. Means and standard deviations are presented with error bars. Significance differences were observed between R2 and QA as well as QA and BC (p-values were 0.02 and 0.01, respectively, <0.05). No significant differences were observed between EC and R2, EC and QA, and EC and BC (p-values were 0.67, 0.10, and 0.42, respectively, >0.05). Notably, the p-value between R2 and BC could not be calculated.

Table 1.
p-value for statistical differences evaluation.
| Pairs for Strains | p-Values (Area) for t-Test | ||
|---|---|---|---|
| Proposed Measurements for Area | Proposed Measurements for Length | ||
| EC | R2 | 0.001 | 9.7 × 10⁻⁷ |
| EC | QA | 0.08 | 0.28 |
| EC | BC | 0.21 | 0.04 |
| R2 | QA | 0.001 | 5.9 × 10⁻¹⁵ |
| R2 | BC | 0.74 | 0.55 |
| QA | BC | 0.33 | 0.01 |
Table 2.
p-value for statistical differences evaluation.
| Pairs for Strains | p-Values (Length) for t-Test | |
|---|---|---|
| EC | R2 | 0.67 |
| EC | QA | 0.10 |
| EC | BC | 0.42 |
| R2 | QA | 0.02 |
| R2 | BC | Uncalculated |
| QA | BC | 0.01 |
The data corresponds to Figure 7 (length of cells measured using the cell counting machine).
Publisher’s Note: MDPI stays neutral with regard to jurisdictional claims in published maps and institutional affiliations. |
© 2022 by the author. Licensee MDPI, Basel, Switzerland. This article is an open access article distributed under the terms and conditions of the Creative Commons Attribution (CC BY) license (https://creativecommons.org/licenses/by/4.0/).
Share and Cite
MDPI and ACS Style
Yoda, T. Measurement and Characterization of Yeast Cell Size Using a Digital Optical Microscope. Processes 2022, 10, 2396. https://doi.org/10.3390/pr10112396
AMA Style
Yoda T. Measurement and Characterization of Yeast Cell Size Using a Digital Optical Microscope. Processes. 2022; 10(11):2396. https://doi.org/10.3390/pr10112396
Chicago/Turabian StyleYoda, Tsuyoshi. 2022. "Measurement and Characterization of Yeast Cell Size Using a Digital Optical Microscope" Processes 10, no. 11: 2396. https://doi.org/10.3390/pr10112396
Note that from the first issue of 2016, this journal uses article numbers instead of page numbers. See further details here.