Article

Revealing Impact Characteristics of the Cassava Dust Explosion Process: Experimental and Numerical Research

1
School of Resources, Environment and Materials, Guangxi University, Nanning 530004, China
2
School of Environment and Resources, Xiangtan University, Xiangtan 411105, China
*
Author to whom correspondence should be addressed.
Processes 2022, 10(11), 2419; https://doi.org/10.3390/pr10112419
Submission received: 20 September 2022 / Revised: 5 November 2022 / Accepted: 11 November 2022 / Published: 16 November 2022

Abstract

:
The combustion and explosion characteristics of cassava starch and the dispersive physical motion law of dust were systematically studied using a 20 L (=0.02 m3) spherical explosive test device and the numerical simulation method. The experimental results show that the explosion pressure first increases and then decreases with increasing ignition delay time, dust concentration, and spray pressure in the dust storage tank. The maximum explosion pressure was obtained with a dust concentration of 750 g/m3, while the maximum rate of pressure increase was obtained when the concentration was 250 g/m3. The calculated maximum explosion index was 22.3 MPa∙m∙s−1. The simulation results show that the physical movement law of the dust was as follows: high initial velocity → gradual decrease in diffusion velocity → upward linear movement of dust → outward diffusion motion → continuous disorder motion → free settlement → gradual reduction and disorder state → finally, complete settlement. With a powder diffusion time of 120 ms, the dust distribution in the round sphere was the most uniform, which was consistent with the experimental results. After dust ignition, the temperature first gradually increased and then decreased due to heat dissipation. The maximum pressure in the vessel was 46.7 MPa, and the turbulence was the most intense close to the ignition point.

1. Introduction

Cassava starch is an important component in production and trade in the economies of South China and the ASEAN region. Cassava starch can be divided into native starch and modified starch [1]. The yield of cassava starch in China is second only to corn starch [2,3]. Cassava starch is one of the dust types that is most prone to dust explosion. The risk of dust explosion threatens all aspects related to cassava starch production, and can result in serious explosion accidents [4].
Due to the serious consequences of major dust explosion accidents [5], scholars from various countries have carried out research related to dust explosions [6]. The existing research on the parameters influencing dust explosions includes studies of dust combustion characteristics, as well as the characteristics of the dust, its flame propagation mechanism and law, etc. [7,8]. Dust explosion characteristics are generally measured using a 20 L spherical tank explosion test device and a sealed Hartman tube, ASTME 1226-19. This standard constitutes a test procedure for the evaluation of dust explosion parameters in a 20 L explosive ball, making it possible to study the explosiveness of dust and its influencing factors [9]. Cao and Xu et al. studied the influence of dust concentration and ignition delay on dust explosion using a 20 L explosion vessel, revealing the thermal propagation effect of coal dust, leading them to propose a new thermal radiation kinetic model of dust explosion parameters [10,11,12,13]. Yu [14] et al. studied the combustion behavior of dust with different particle sizes. Studies have shown that the smaller the particle size, the more thorough the reaction.
Despite the limitations of real experimental equipment preventing the acquisition of large amounts of experimental data, remarkable achievements have been made in the field of dust explosion research as a result of the efforts of experts and scholars in various countries. At the same time, the development of computer technology has greatly promoted the development of research into dust explosions, especially computational fluid dynamics technology, on the basis of which numerical simulations can be used to further study the phenomenon of dust explosion. Zhong [15,16] established a two-dimensional model to describe dust explosions, described using the Euler two-phase combustion flow Lagrangian method, and simulated the initiation process for corn starch. Wang et al. [17,18] explained flow field and dust concentration distribution by establishing a simulation model for a 20 L explosion sphere, assuming conditions of a 60 ms ignition delay, a stable turbulence level in the ball, and well-diffused dust. Before and after the ignition delay, the dust is affected by turbulence and gravity, resulting in a decrease in explosion intensity. Jing et al. [19,20,21,22,23] discussed the explosion parameters of corn starch/methane/air mixture in a 20 L ball using numerical simulation, and revealed the promoting effect of each component in the three-component system, and their competitive effect with respect to oxygen.
Due to the poor visibility of the experimental process when using a 20 L spherical tank explosion test device, most existing experimental and simulation studies have focused on the explosion characteristics of corn starch. At the same time, the dust diffusion before the combustion and explosion of cassava starch need to be studied, as well as the flame spread and changes in turbulence, temperature, dust density, and pressure after diffusion. Combining the respective advantages of the experimental method with those of numerical simulation, we explore the dust diffusion before the combustion and explosion of cassava starch, along with the flame spread and changes in turbulence, temperature, dust density and pressure after ignition. This serves to provide basic experimental data acting as a reference for cassava starch for the prevention of fires and explosions during the production process.

2. Experiment on Explosion Characteristics

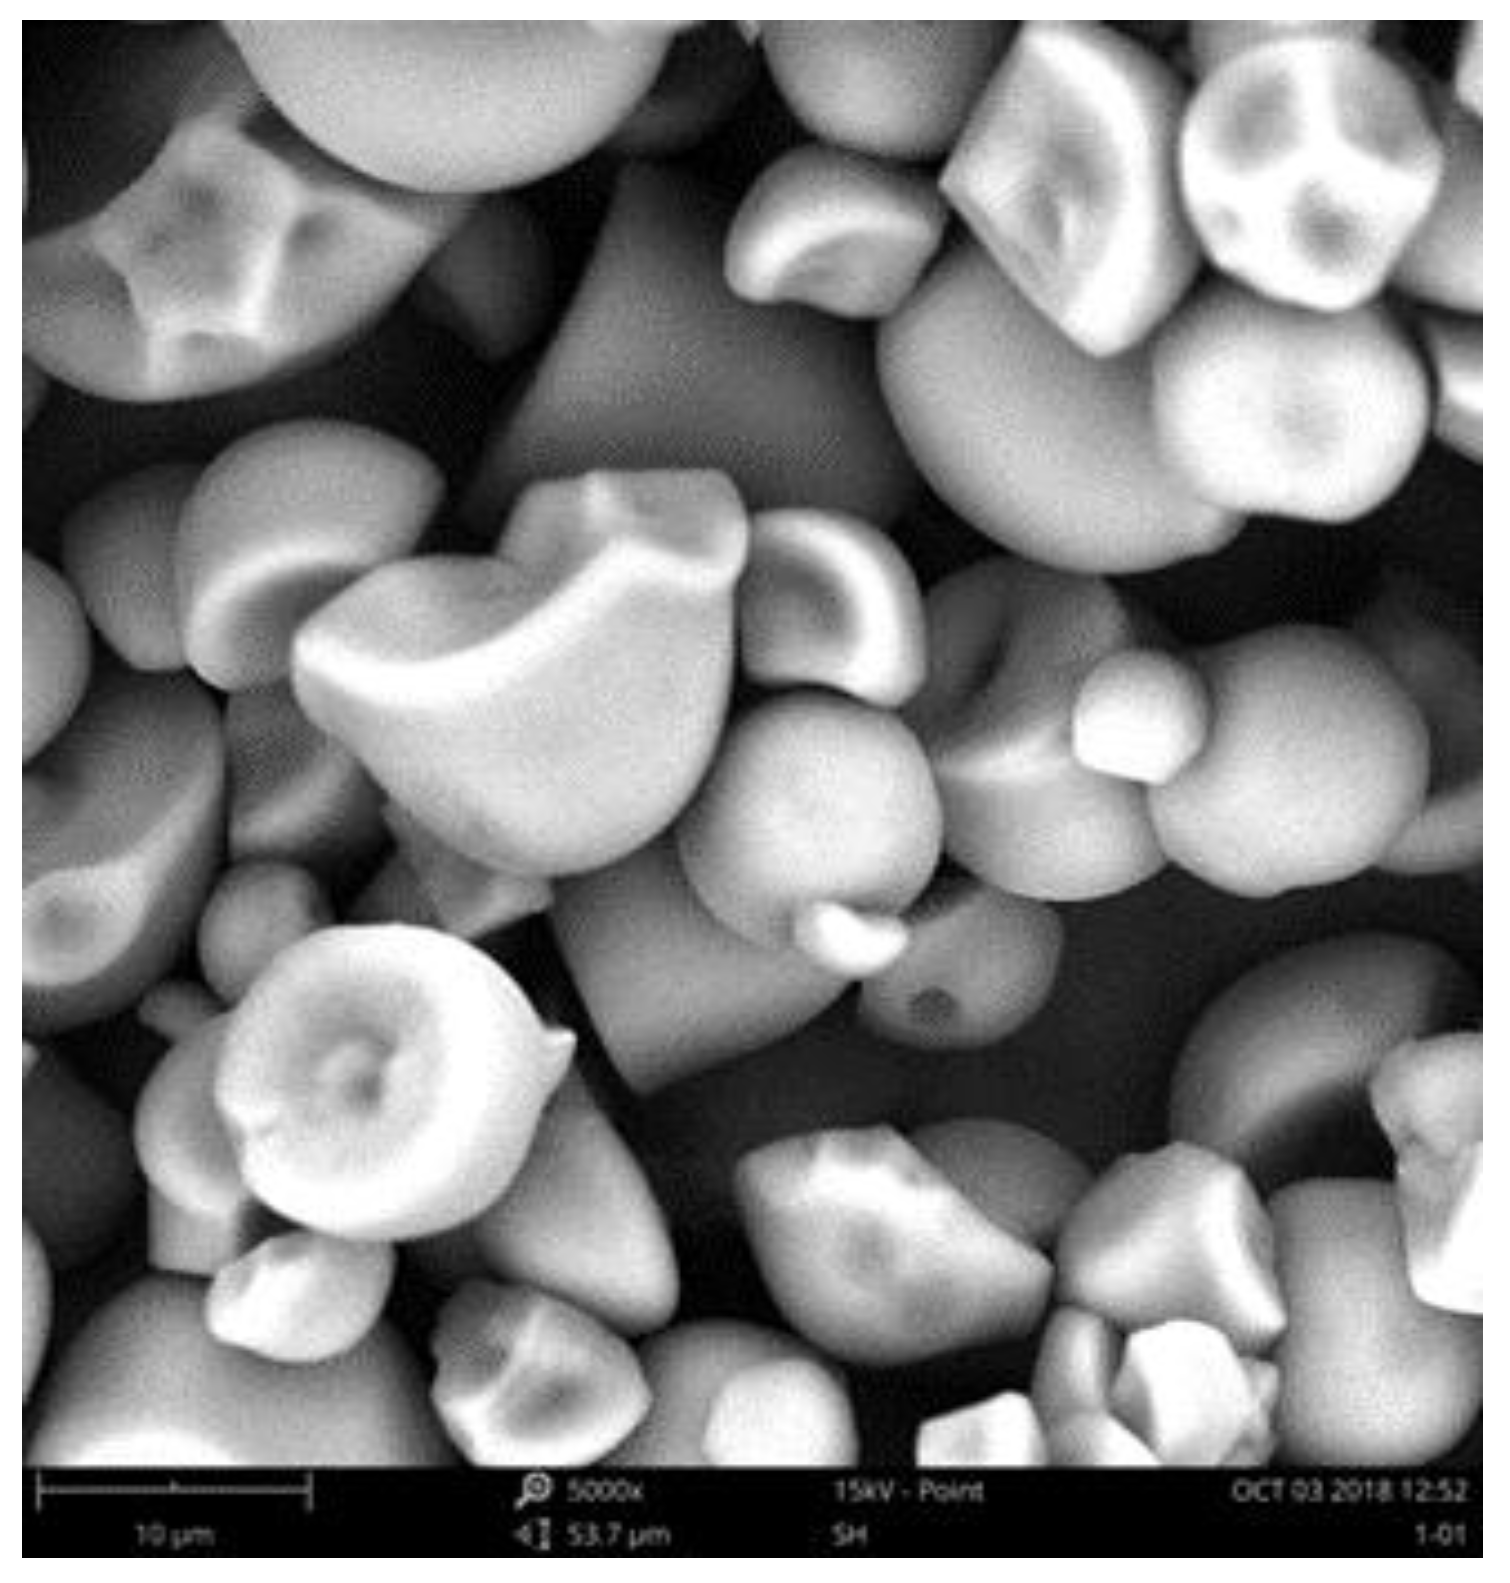
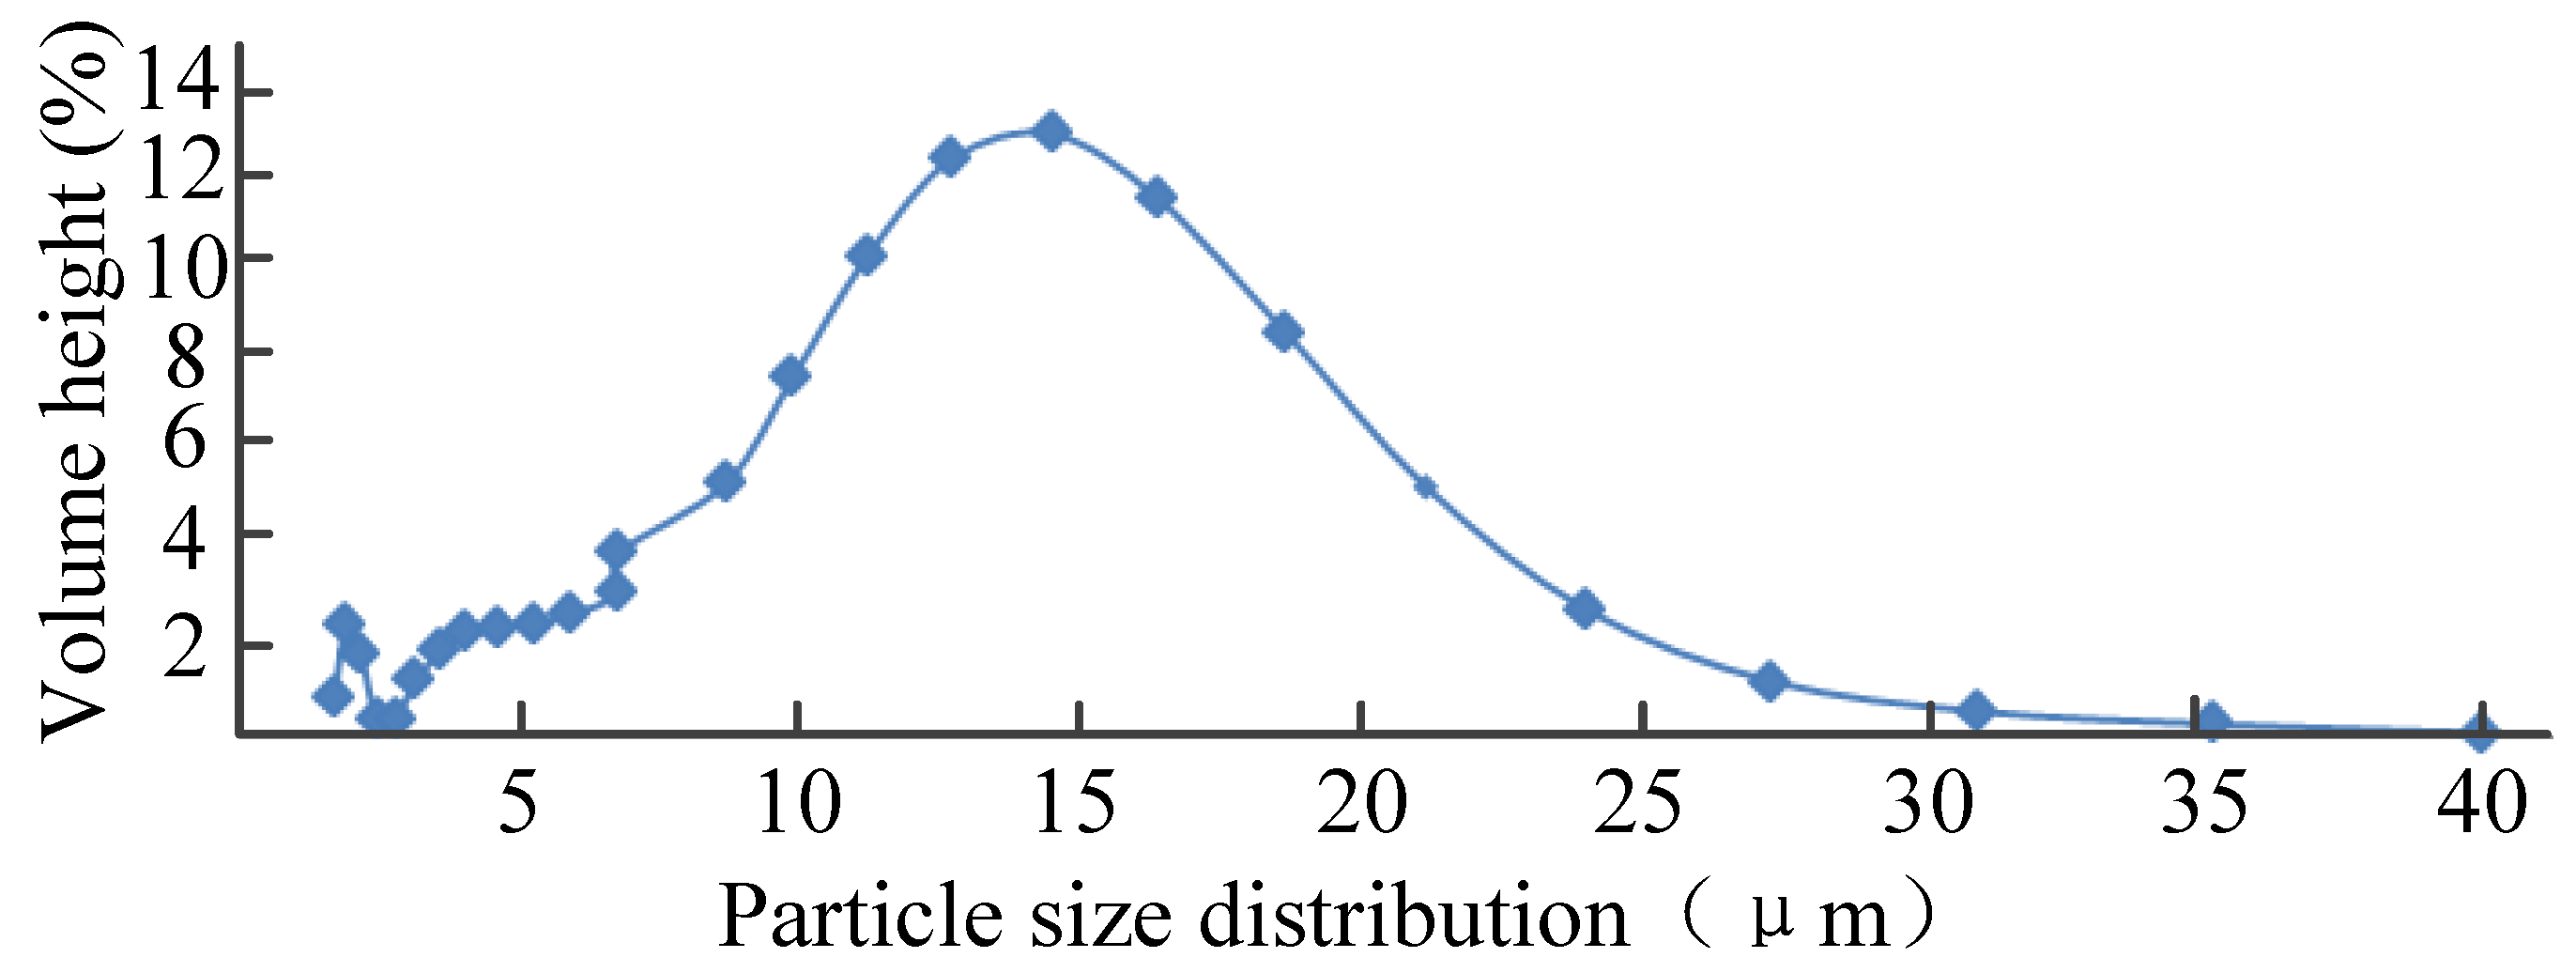
2.1. Experimental Samples and Conditions

The sample was provided by Guangxi Ming yang Starch Chemical Co., Ltd (Located in Guangxi Zhuang Autonomous Region, Nanning, China). Photographic and electron microscopy images of the sample are shown in Figure 1 and Figure 2, respectively.
The experiment was carried out under the following conditions: the laboratory humidity was 40~60%, and the temperature was 20~32 °C. The cassava starch was dried in an oven at 60 °C for 24 h before the experiment, as shown in Figure 3.

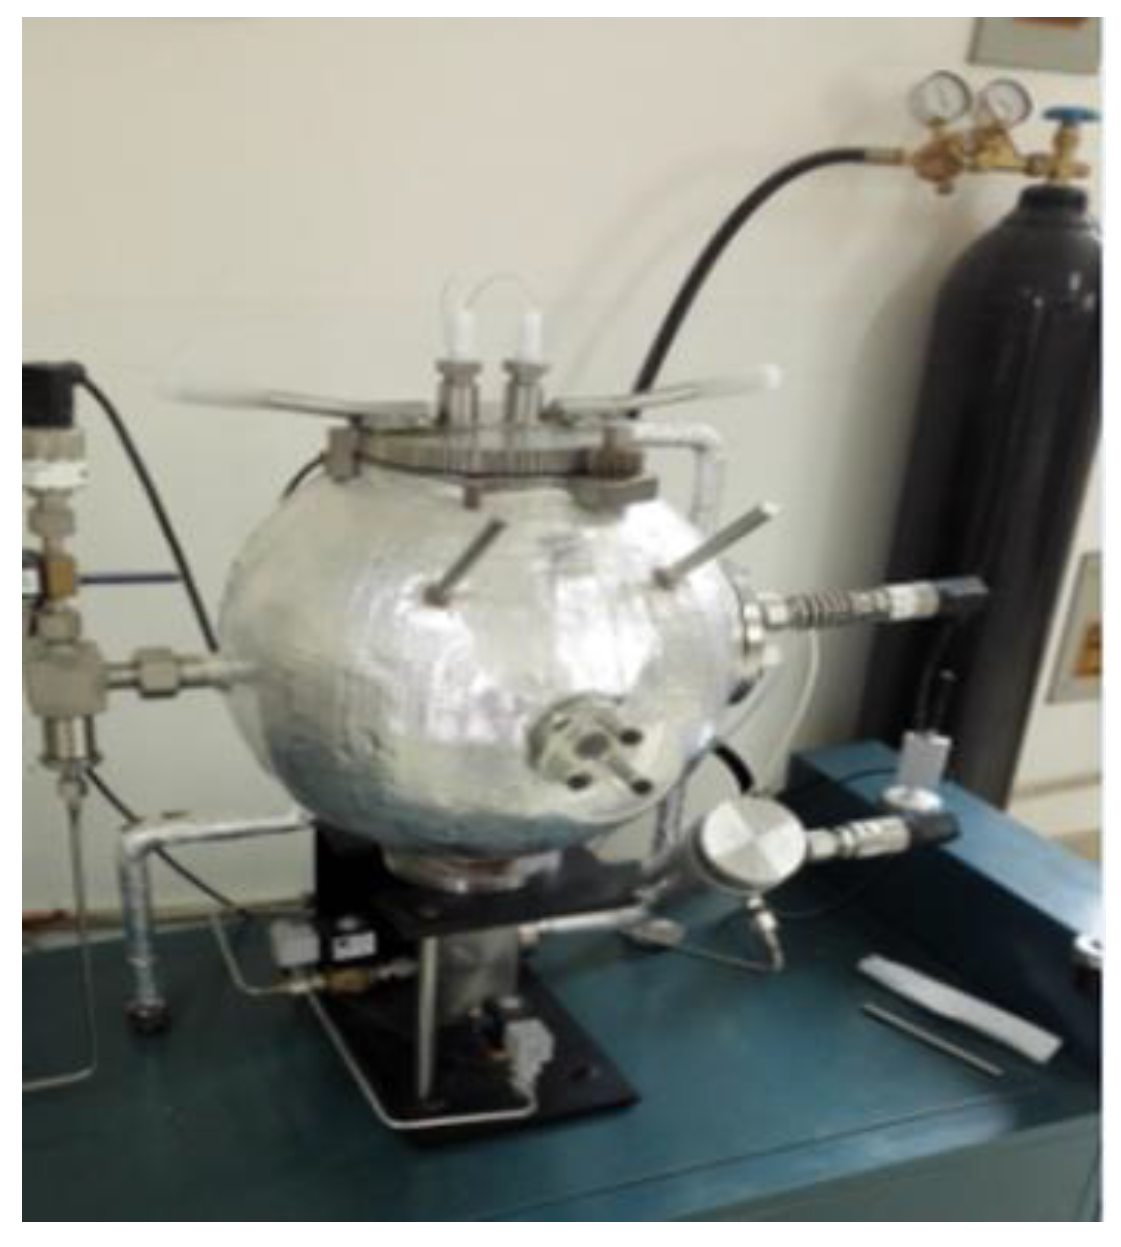
2.2. Experimental Device

A 20 L HY16426C spherical gas–dust–liquid mist explosion parameter test device was used under special conditions, depicted in Figure 4. The ignition energy of the ignition head was 10 J.

2.3. Experimental Procedure

The experimental procedure was as follows:
First, select ‘dust experiment’ and ‘chemical ignition’ in the system. Secondly, input the set parameters in the ‘set control parameters’ interface. Then, click the ‘sure’ button to start the experiment. After the data transmission is completed, the computer operation process is as follows: (1) detect the warehouse pressure; (2) execute the vacuum operation; (3) after vacuum has been achieved, the air balances; (4) fill the sample chamber according to the set pressure; (5) proceed with the automatic ignition experiment; (6) after ignition, obtain pressure data. After the experiment, the dust is released (rubber ring displacement when the dust cover is open should be avoided, as this will result in the device not being able to be sealed when tightened, resulting in leakage), and then click the cleaning item to clean the dust explosion tank. According to the set concentration, pressure, and delay time, carry out each experiment three times under the same experimental conditions, take the maximum explosion pressures and the maximum explosion indexes, and record the results. According to the set parameters, change the corresponding variables to complete all of the experiments, and record and save the relevant data.
During the experiment, we determined whether the maximum explosion pressure was greater than 0.15 MPa in order to determine whether the cassava dust had been successfully detonated. The maximum explosion pressure and the maximum rate of increase in explosion pressure were recorded. The maximum explosion index was calculated on the basis of the maximum rate of increase in explosion pressure and Formula (1), with a spherical volume V = 0.02 m3.
Kmax = (dp/dt)max × V1/3 (MPa·m·s−1)
To ensure the repeatability of the experiment, three dust explosion tests were performed in parallel under each experimental condition. The data used were the average of the data obtained from three successful explosions.

2.4. Analysis of Results

(1)
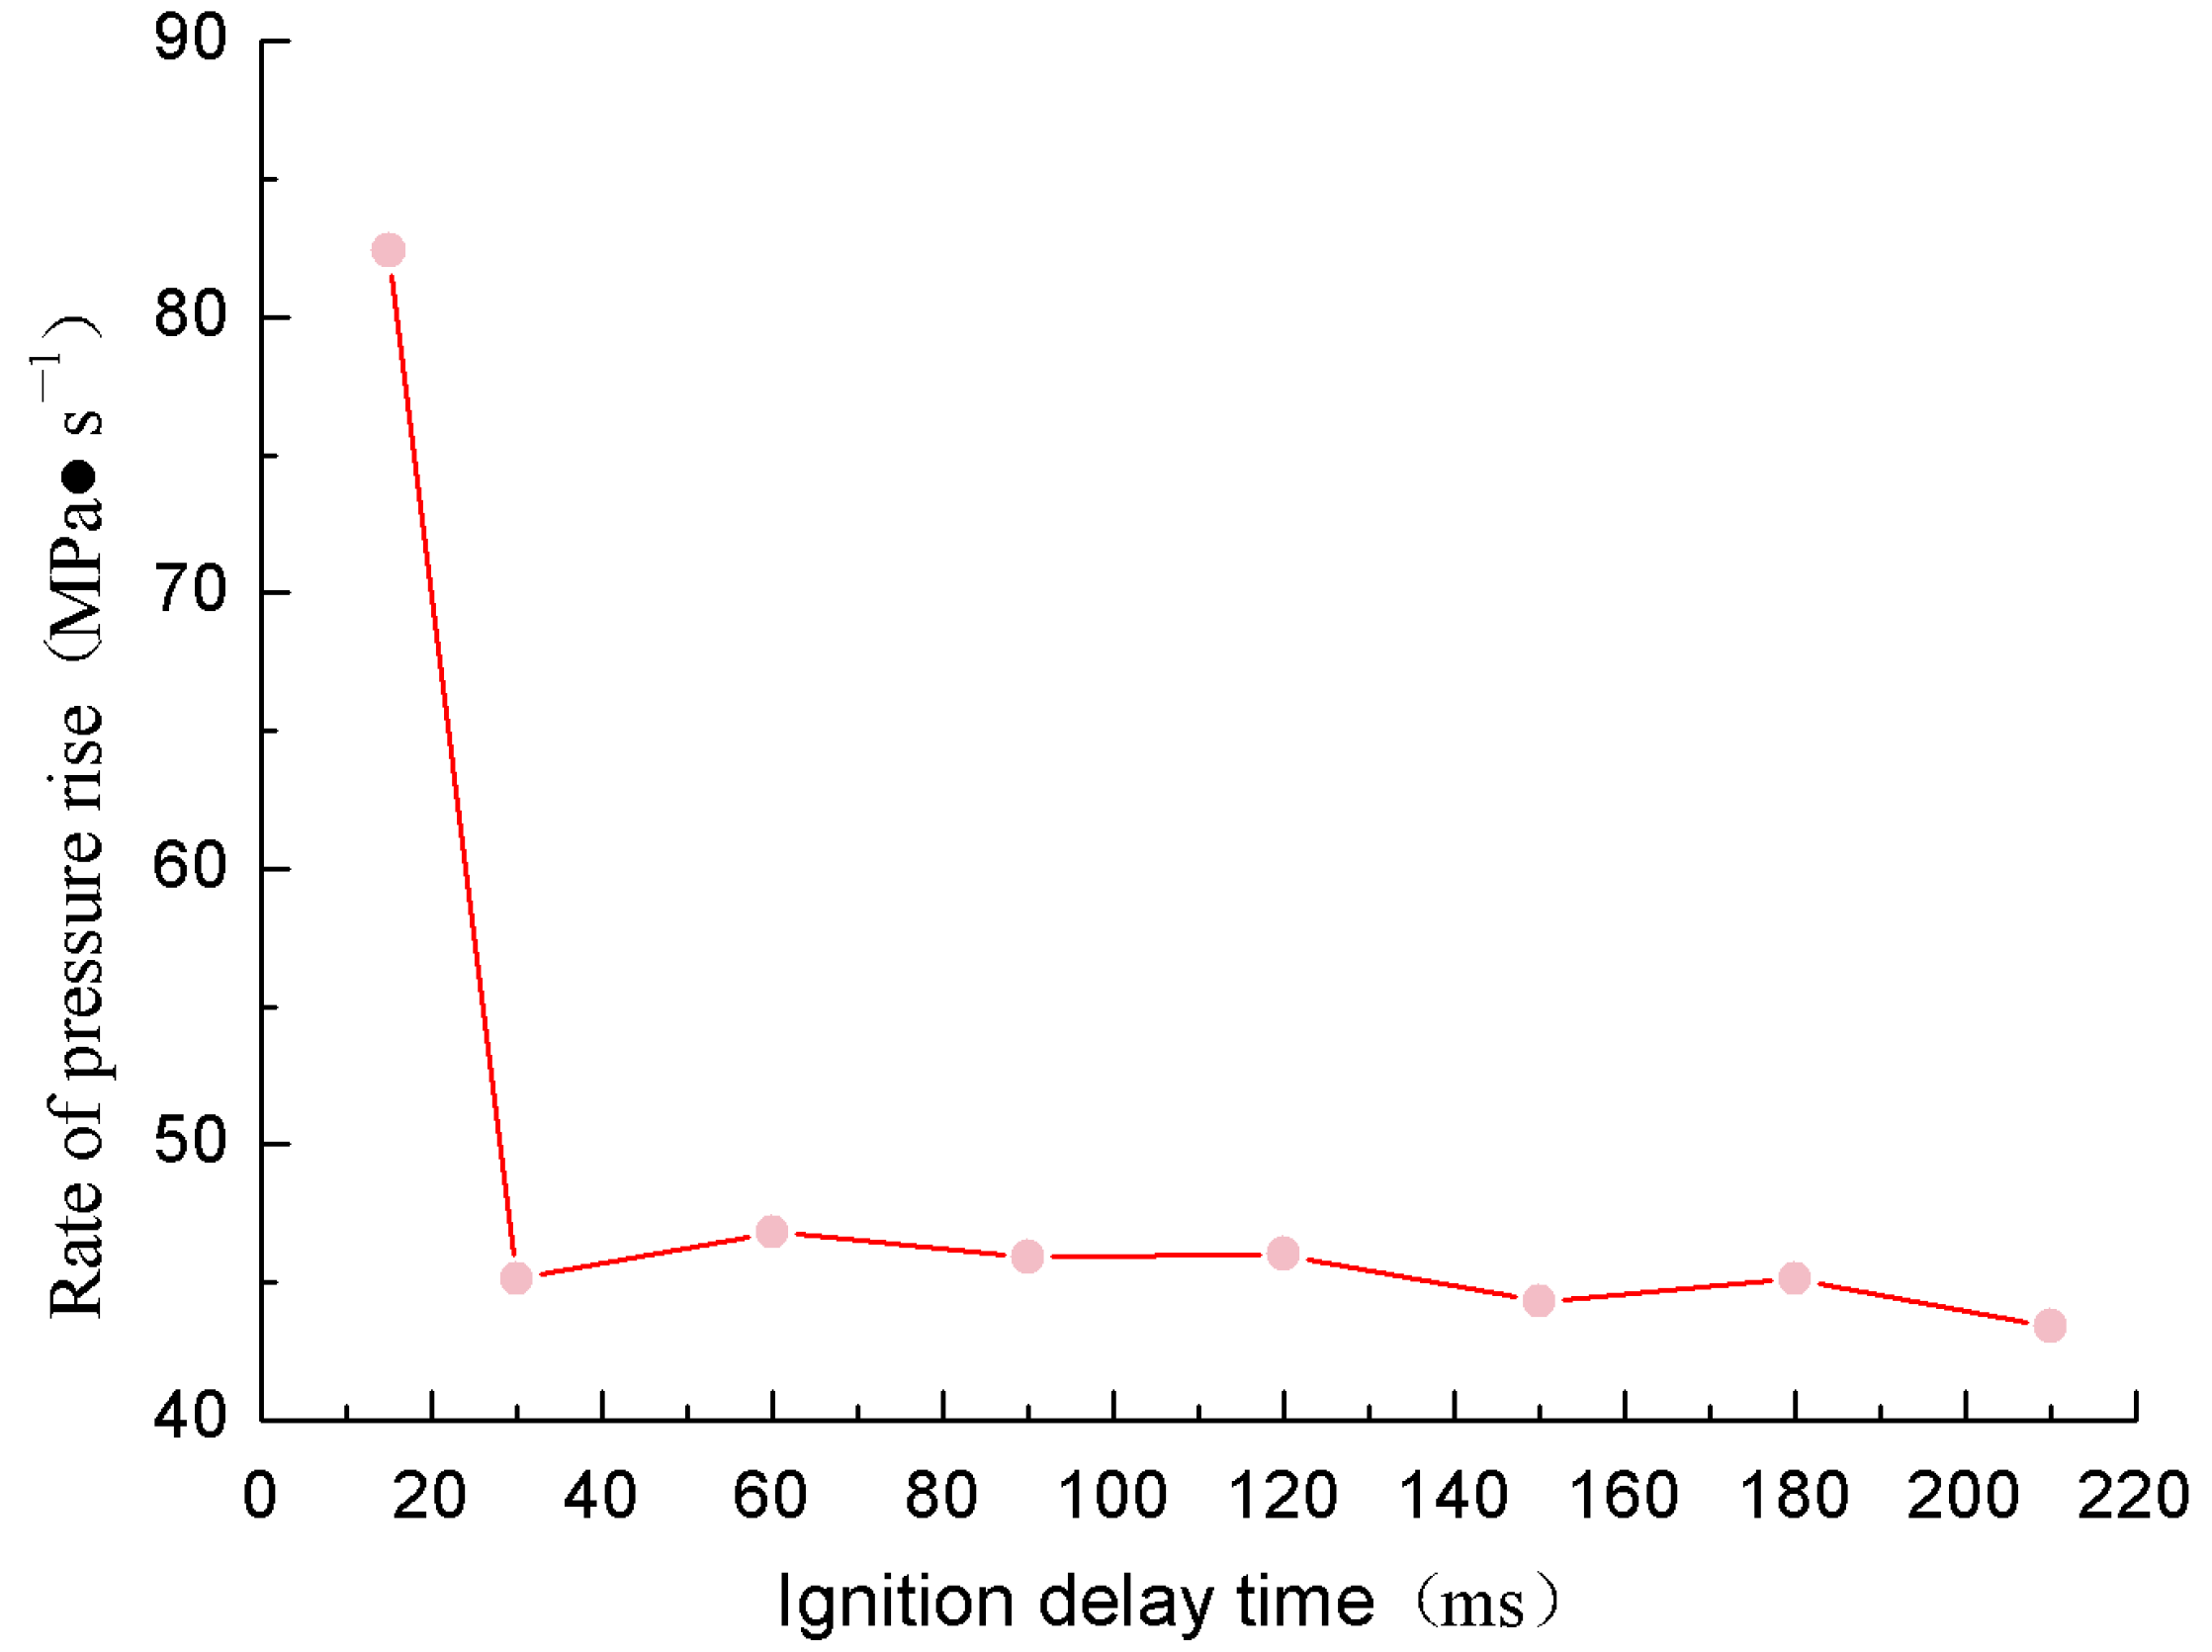
The effect of ignition delay time on the explosion of cassavas
After the dust is sprayed and dissipated, for time t, representing a very short period of time, there is a relatively uniform dust concentration at each height within the sphere. With the passage of time, due to the action of gravity, the dust falls, and the concentration in the top part of the sphere begins to decrease. The concentration decreases at the top and moves downward; at time point t1, another relatively uniform dust concentration is formed, and over time, another decrease and downward movement process occurs, until all of the dust is settled on the bottom of the sphere. Different ignition delay times result in different concentrations as a result of the uniformity of the dust clouds around the ignition head and in the tank.
Amounts of 2, 3, 4 and 5 g of cassava starch were adopted for testing. The test rules are as follows: test from small to large, and if the sample does not explode, go to the next sample. Of the four samples, only the 5 g cassava starch samples were tested at three consecutive time points. For fire and explosion testing, 5 g was fixed for the value of mass, and the value of ignition delay time was changed in order to analyze the relative relationship between the ignition time and the explosion pressure; the ignition delay time was set to 15 ms, 30 ms, 60 ms, 90 ms, 120 ms, 150 ms, 180 ms and 210 ms, and the dust pressure (dust tank pressure) was set to 1.3 MPa.
From Table 1, it can be seen that, with increasing ignition delay time, there is a gradual increase in explosion pressure until reaching a peak at a maximum value of 0.476 MPa, with an ignition delay time of 120 ms. Then, with a further increase in ignition delay time, the explosion pressure increases and then gradually decreases. In the process of increasing the ignition delay time from 0 to 120 ms, the effective explosion concentration and the uniformity of the scattered cassava dust cloud gradually increases to its maximum value, and the explosion pressure gradually increases to its maximum value. At an ignition delay time of 120 ms, the uniform dust cloud concentration on the ignition ball reaches its maximum value, and the explosion reaction is the most complete and the pressure is the highest at this time. Under the action of gravity, at ignition delay times longer than 120 ms, the dust cloud that can be effectively burned in the ball gradually decreases. Heat and strength are reduced, and there is also a decrease in the resulting explosion pressure.
On the basis of Figure 5, it can be observed that when the ignition delay time is 15 ms, the maximum rate of increase in explosion pressure is 82.4 MPa∙s−1, and at at delay times from 30 to 210 ms, the rates of increase in explosion pressure are 45.1, 46.8, 45.9, 46, 44.3, 45.1 and 43.4 MPa∙s−1. The value changes smoothly, and the difference between the maximum value and the minimum value is less than 10%. The ignition time point at which the maximum explosion pressure rate occurs is random, and it does not necessarily occur at the same time as the maximum explosion pressure, but the most suitable dust concentration area during the explosion process with increasing values of maximum explosion pressure rate, and detonation occurs rapidly when it catches fire. A large amount of heat and shock waves are released in a short period of time, and there is a rapid increase in pressure, resulting in the highest rate of increase in explosion pressure being achieved. At this time, (dp/dt)m = 82.4 MPa∙s−1, which is substituted into Formula (1), Kst ≈ 22.37 MPa∙m∙s−1. The maximum explosion index can be obtained at this time.
(2)
Effect of Dust Concentration on Cassava Starch Explosion
From Table 2, the fixed injection pressure is set to 1.3 MPa, the ignition delay time is 120 ms, and the dust quality is changed in order to evaluate the effects of changes on the dust explosion pressure.
It can be seen from Figure 6 that, with increasing dust concentration, the dust explosion pressure first increases and then gradually decreases after reaching its maximum value. When the mass concentration of cassava is 750 g∙m−3, the explosion pressure is 0.695 MPa. The maximum heat is composed of two parts: (1) the heat (Q1) of the explosion of the ignition head; (2) the heat (Q2Mar) released by the maximum mass of the dust matched by the most complete combustion of oxygen and cassava starch in the sphere. The pressure in the sphere reaches its maximum value when Q1 and Q2Mar are both accounted for. When the concentration exceeds 750 g∙m3, the explosion pressure gradually decreases, tending to be roughly the same. Regarding the explosion of dust in the sphere, within a certain mass range, as long as the injection pressure is appropriate, the mass concentration of the dust will be proportional to the explosion pressure (of course, this is also related to the uniformity of dust dispersion and the limit ratio of oxygen and dust), which is the essence of dust explosions. Starch is transformed into heat energy, and the heating caused by the heat energy increases the temperature of the air in the sphere, meaning that the more mass there is, the more heat will be released, the higher the temperature will rise, and the greater the pressure of the dust explosion will be. Energy in the explosion process is composed of two aspects: the heat (Q1) of the explosion of the ignition head and the heat (Q2 < Q2Ma) released by the insufficient combustion of the cassava starch. The heat acting on the gas in the sphere is the total heat minus the burning fire mass that did not burn due to lack of oxygen. The heat absorbed by the dust particles is heated. Obviously, the greater the amount of dust particles not burned in the burning fire mass, the less heat there will be acting on the gas in the sphere, thus lowering the explosion pressure, effectively dissipating the dust mass into a dust cloud. There is a limit; that is, there is a limit to the amount of dust not being burned in the burning fire mass. When the dust quality reaches a certain quality limit, the explosion pressure tends to be the same. At 500 g∙m−3, 1000 g∙m−3 and 1250 g∙m−3, the maximum rate of increase in explosion pressure is the same, at 51 MPa∙s, kst’ ≈ 13.84 MPa∙m∙s−1.
(3)
Influence of dusting pressure on explosion pressure of cassava dust
The mass of the cassava dust is fixed at 5 g, the ignition delay time is 120 ms, and the injection pressure is changed to examine the impact of changes in dust explosion pressure. The pressure–time numerical results are shown below.
It can be seen from Table 3 that when the injection pressure is increased from 0.9 MPa to 1.3 MPa, the explosion pressure increases from 0.403 MPa to 0.4763 MPa, and when the injection pressure is increased from 1.3 MPa to 1.9 MPa, the explosion pressure decreases from 0.476 MPa to 0.34 MPa. Due to the fixed mass, the injection pressure increases within a certain range, and the greater the initial acceleration of the dust, the more uniform the dust dispersion. When it reaches a certain value of injection pressure, the dust reaches its maximum uniform value, and the explosion is the largest at this time. A sufficient value of injection pressure is required for the explosion pressure to reach its maximum. When the injection pressure exceeds a certain value: (1) the injection pressure blows dust directly into the sphere; (2) small dust particles collide, combining into larger dust particles, which only burn or settle directly with some difficulty; (3) after the air flow formed by the blowing pressure reaches the top, it is blown back, and the dust is burned to the bottom, meaning that the upper part of the dust is not able to participate in combustion. Therefore, the amount of dust participating in combustion decreases, gradually decreasing the explosion pressure of the dust, with this phenomenon becoming more obvious with increasing injection pressure. On the basis of the experimental data, of all of the injection pressures, the rate increase in pressure of 45.96 MPa∙s−1 was the largest. Kst” ≈ 12.47 Mpa∙m∙s−1. Therefore, the maximum explosion index Kstmax was determined to be 22.37 MPa∙m∙s−1, as shown in Table 4. Kstmax = 22.37 MPa∙m∙s−1, that is, 223.7 bar∙m∙s−1. Obviously, 200 bar∙m∙s−1 < 223.7 bar∙m∙s−1 < 300 bar∙m∙s−1, which belongs to the St2 level, and the explosion danger linked to cassava dust is high [24].

3. Numerical Simulation of Cassava Starch Explosion

Using the computational fluid dynamics simulation software ANSYS·FLUENT 17.0, the process undergone by cassava starch in the explosion container was simulated as follows: (1) the dispersion of cassava starch in the sphere was simulated at different dusting pressures; (2) the dispersion of cassava starch in the sphere as a result of flame spread, turbulence changes, temperature changes, dust density changes and pressure changes following ignition were simulated [25].

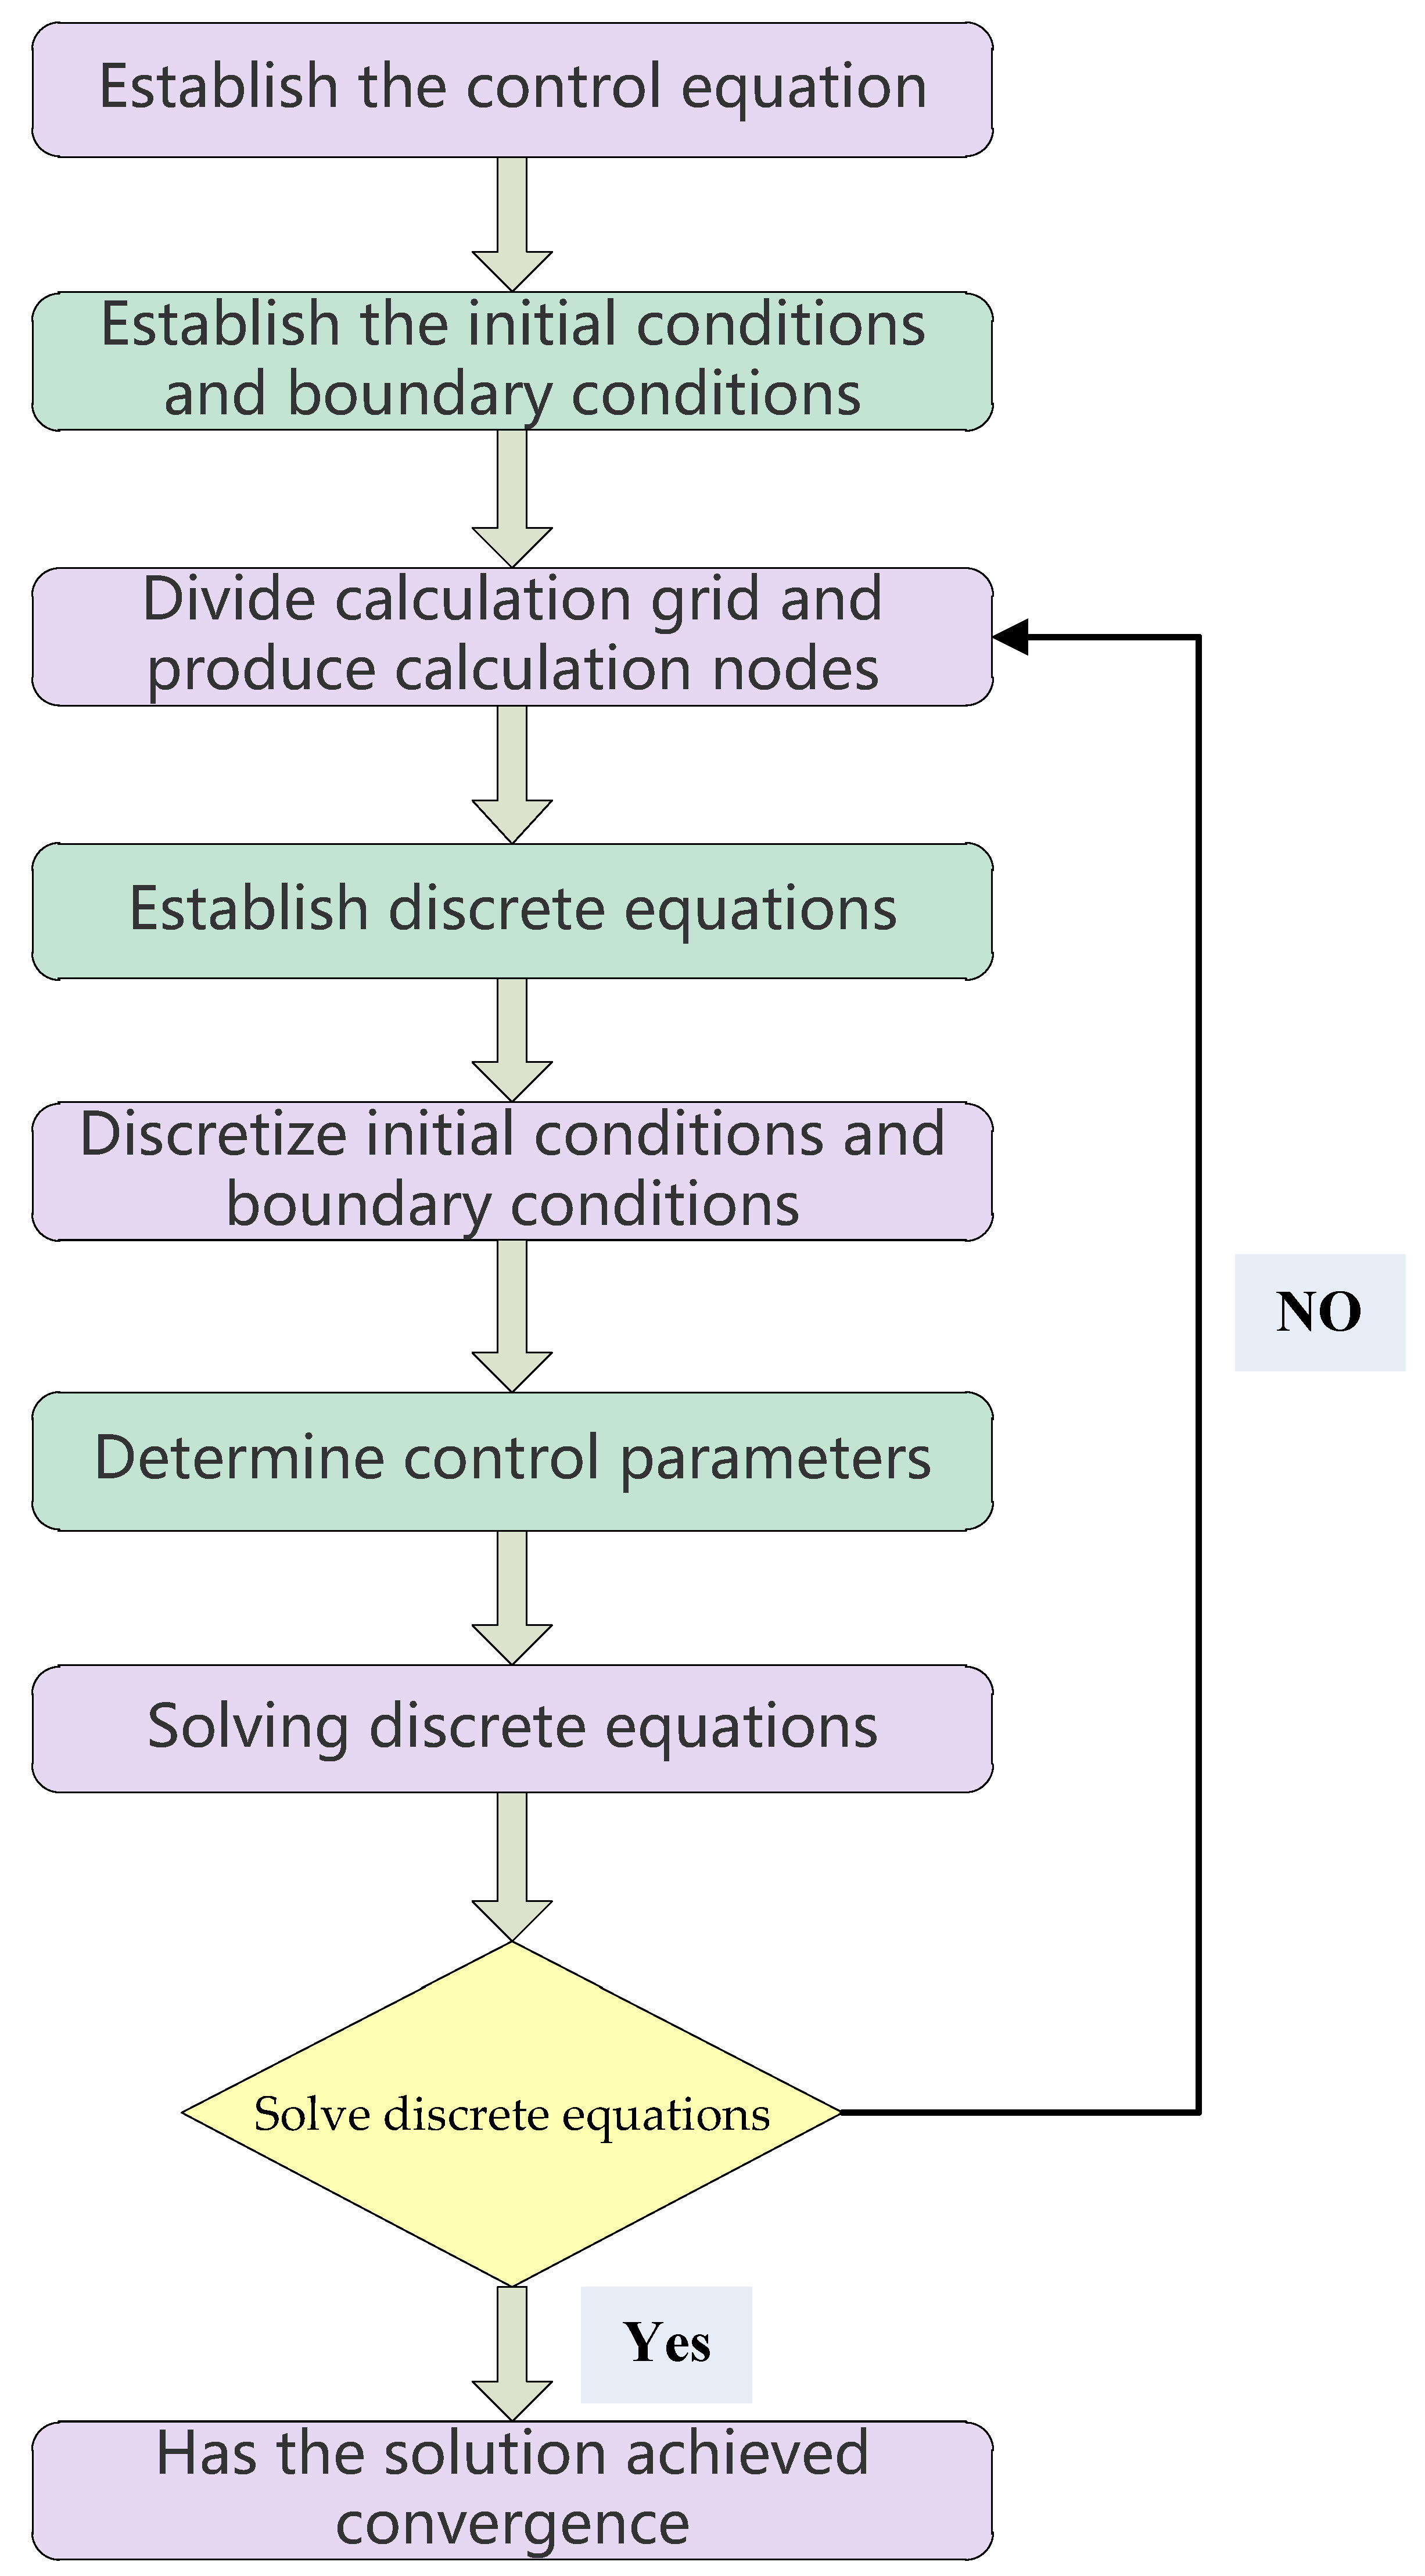
3.1. Simulation Procedure

ANSYS·FLUENT numerical simulation software was employed, integrating a preprocessor, a solver, and a postprocessor. Firstly, the geometry of the numerical simulation area was drawn using CAD/CAE software or the preprocessor [26]. Secondly, the Tgrid or Gambit preprocessor was used to mesh the region and define the boundary conditions. Then, the solver was used to solve the numerical simulation of the grid area. The principle of the solution method was to use a simple function to approximately express the variables to be solved. This approximate relationship is substituted into the control equation to form a discrete set of equations, and this algebraic equation set is solved in order to obtain the values of the variables. The solution process includes establishing the control equation, the determination of the boundary conditions and initial conditions, the determination of the control equation and parameters, the iterative calculation, the judgment of convergence, the display and output of the calculation results, and other steps. Finally, after using the Tecplot postprocessor to process the specific format data exported by the solver, visual results were obtained. The process for solving the computational fluid dynamics is summarized in Figure 6.

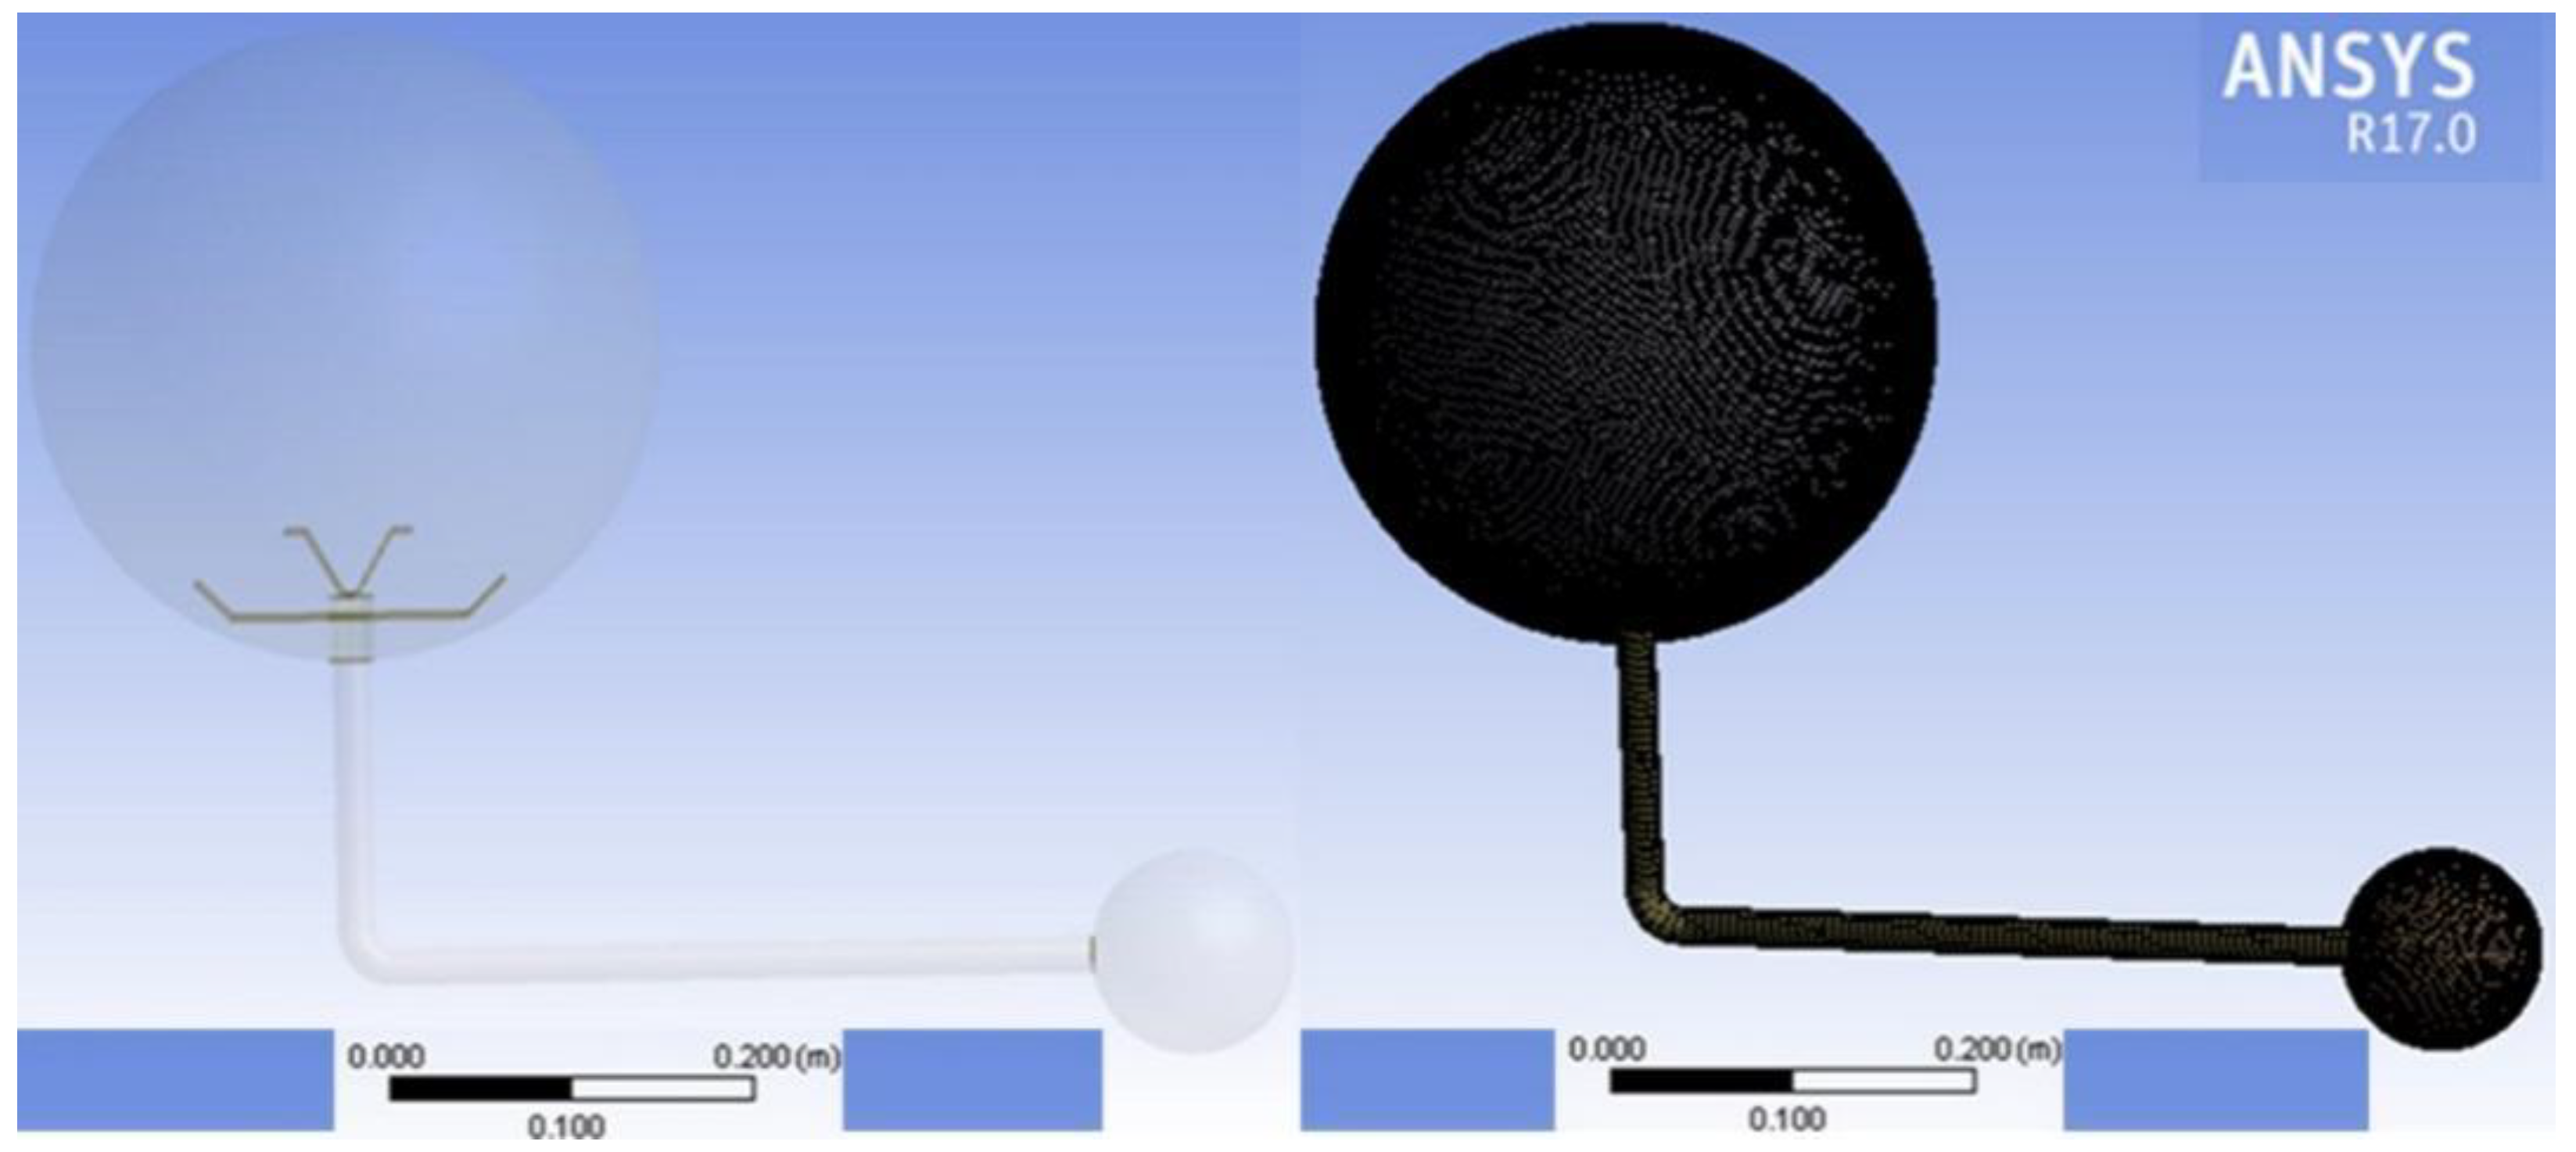
3.2. Partitioning Computational Grids and Models

On the basis of the 20 L spherical device, a three-dimensional model of the 20 L spherical explosion container was established at a scale of 1:1, including the sphere, the powder storage bin, the diffusion nozzle, and the connecting pipe. The geometry of the 20 L spherical container was meshed with a hybrid mesh, and 987,758 meshes were obtained with 204,805 nodes; the minimum mesh volume was 2.7 × 10⁻¹¹ m3. The definition boundary condition was set to the wall, and the corresponding DPM boundary condition was set to reflect. The meshing results are shown in Figure 7.

3.3. Numerical Simulation Analysis

Assuming that the test conditions reflected those of a dust explosion test with an ideal state, the power source used for dust dispersion was compressed air in the powder storage tank, which was able to satisfy the ideal gas state equation [27]. The numerical simulation process started from the ejection of the cassava starch from the nozzle and ended with the stable movement of dust in the explosion container [28]. The numerical simulation process aimed at simulating the movement process of an aerosol system composed of 2 g of raw spherical cassava dust and air with particle sizes of 13 μm in a 20 L spherical explosion container. The powder spraying pressure was 0.8 MPa, and the nozzle was closed after 400 ms. Before the test, the explosion container exhibited a certain degree of vacuum. When the cassava starch powder was ejected from the nozzle, the explosion container was maintained at standard atmospheric pressure. During the whole numerical simulation process, the walls of the explosion container were at a constant temperature of 25 °C and were adiabatic [29].
The time 0 (t = 0) was set when the dust began to be ejected from the nozzle, and a repost tentative velocity–time contour diagram was created. The ejection and diffusion of the dust can be observed in Figure 8. Then, it was necessary to wait for the movement process to take place.
(1)
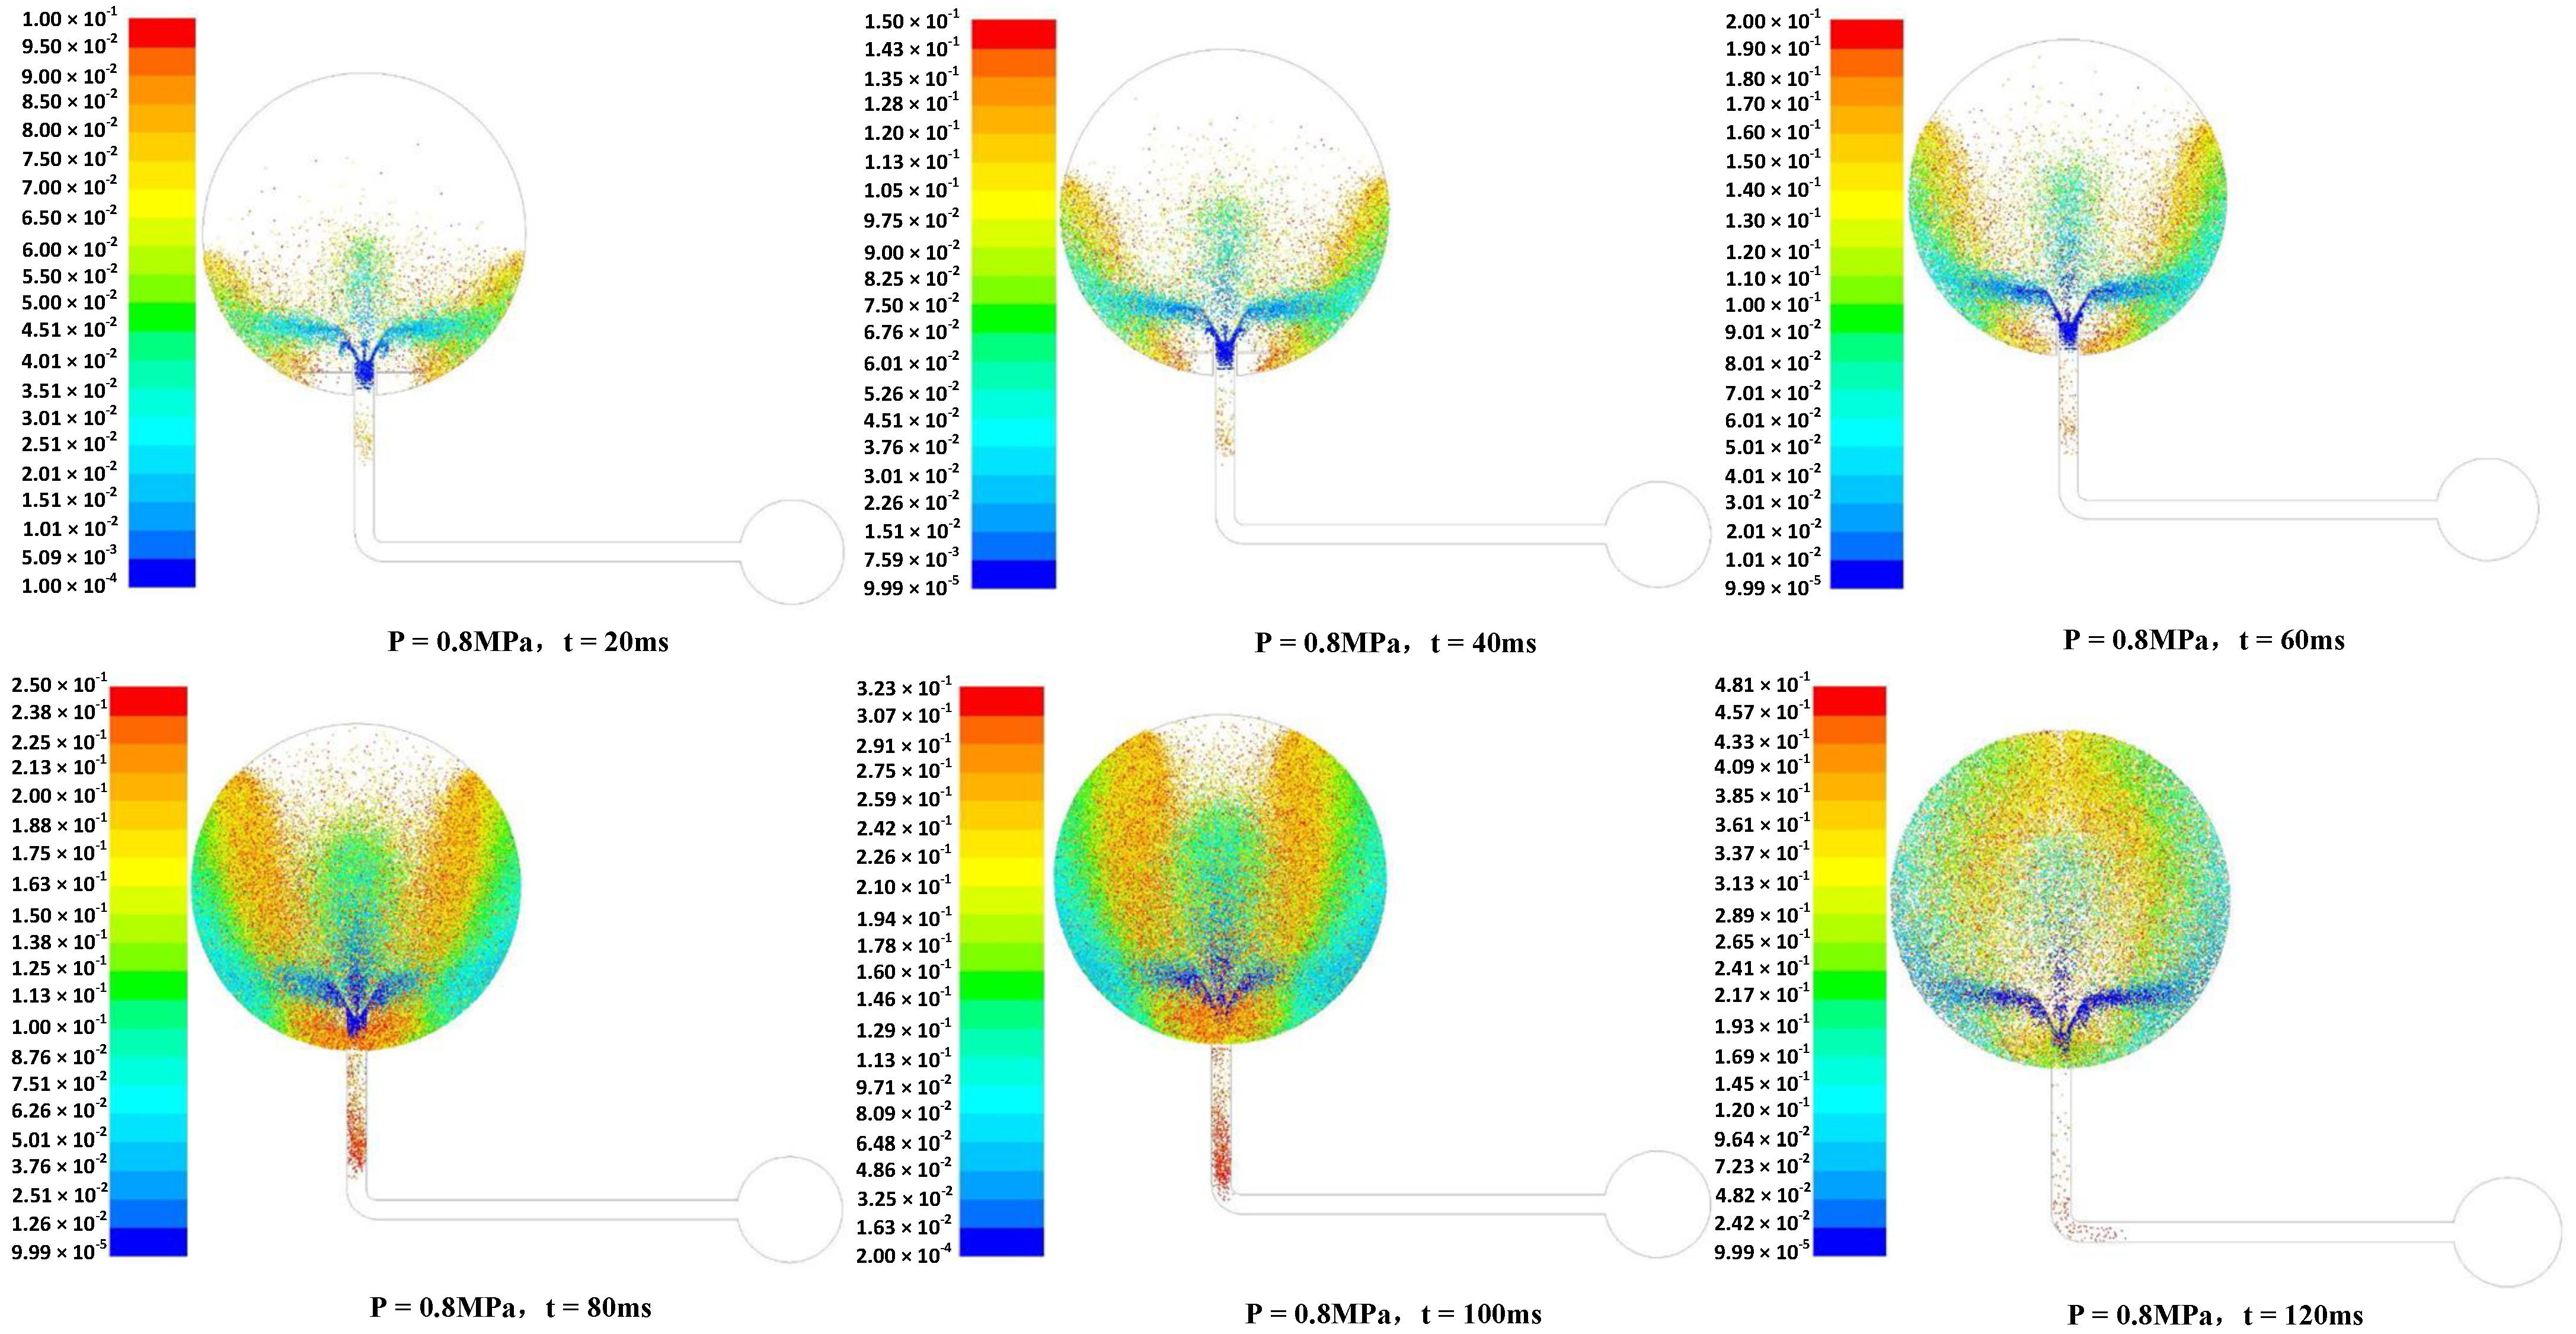
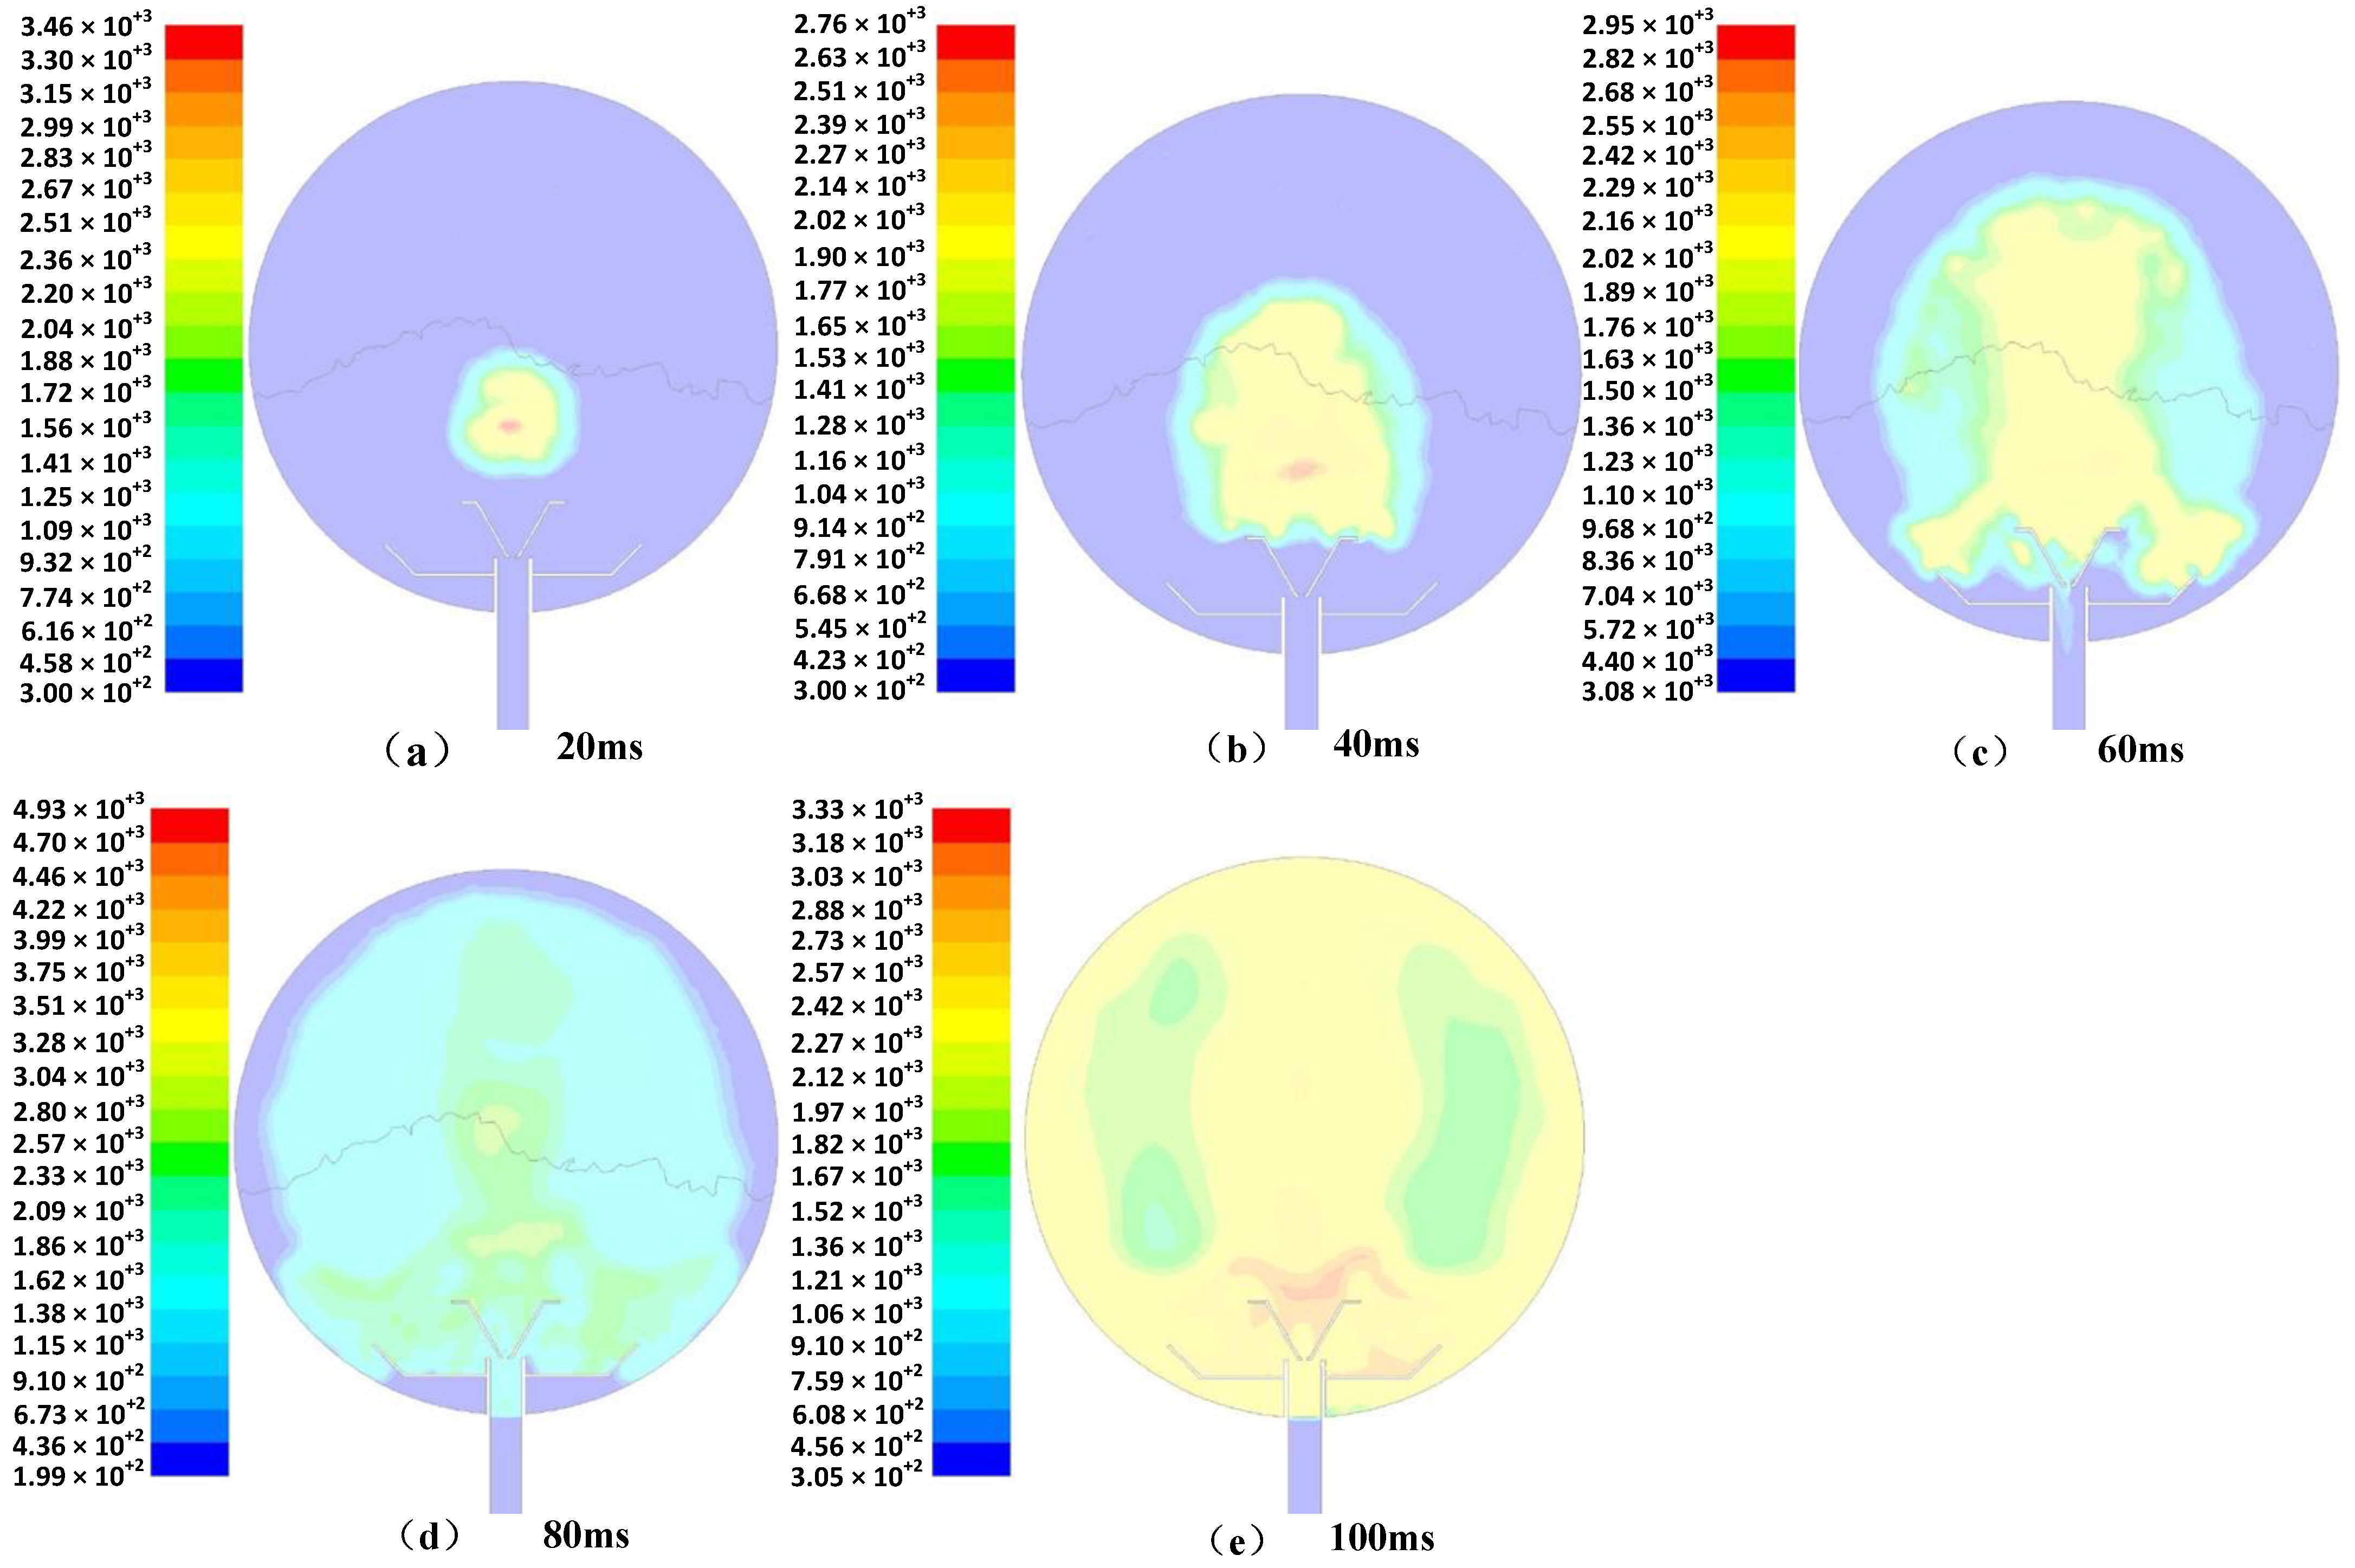
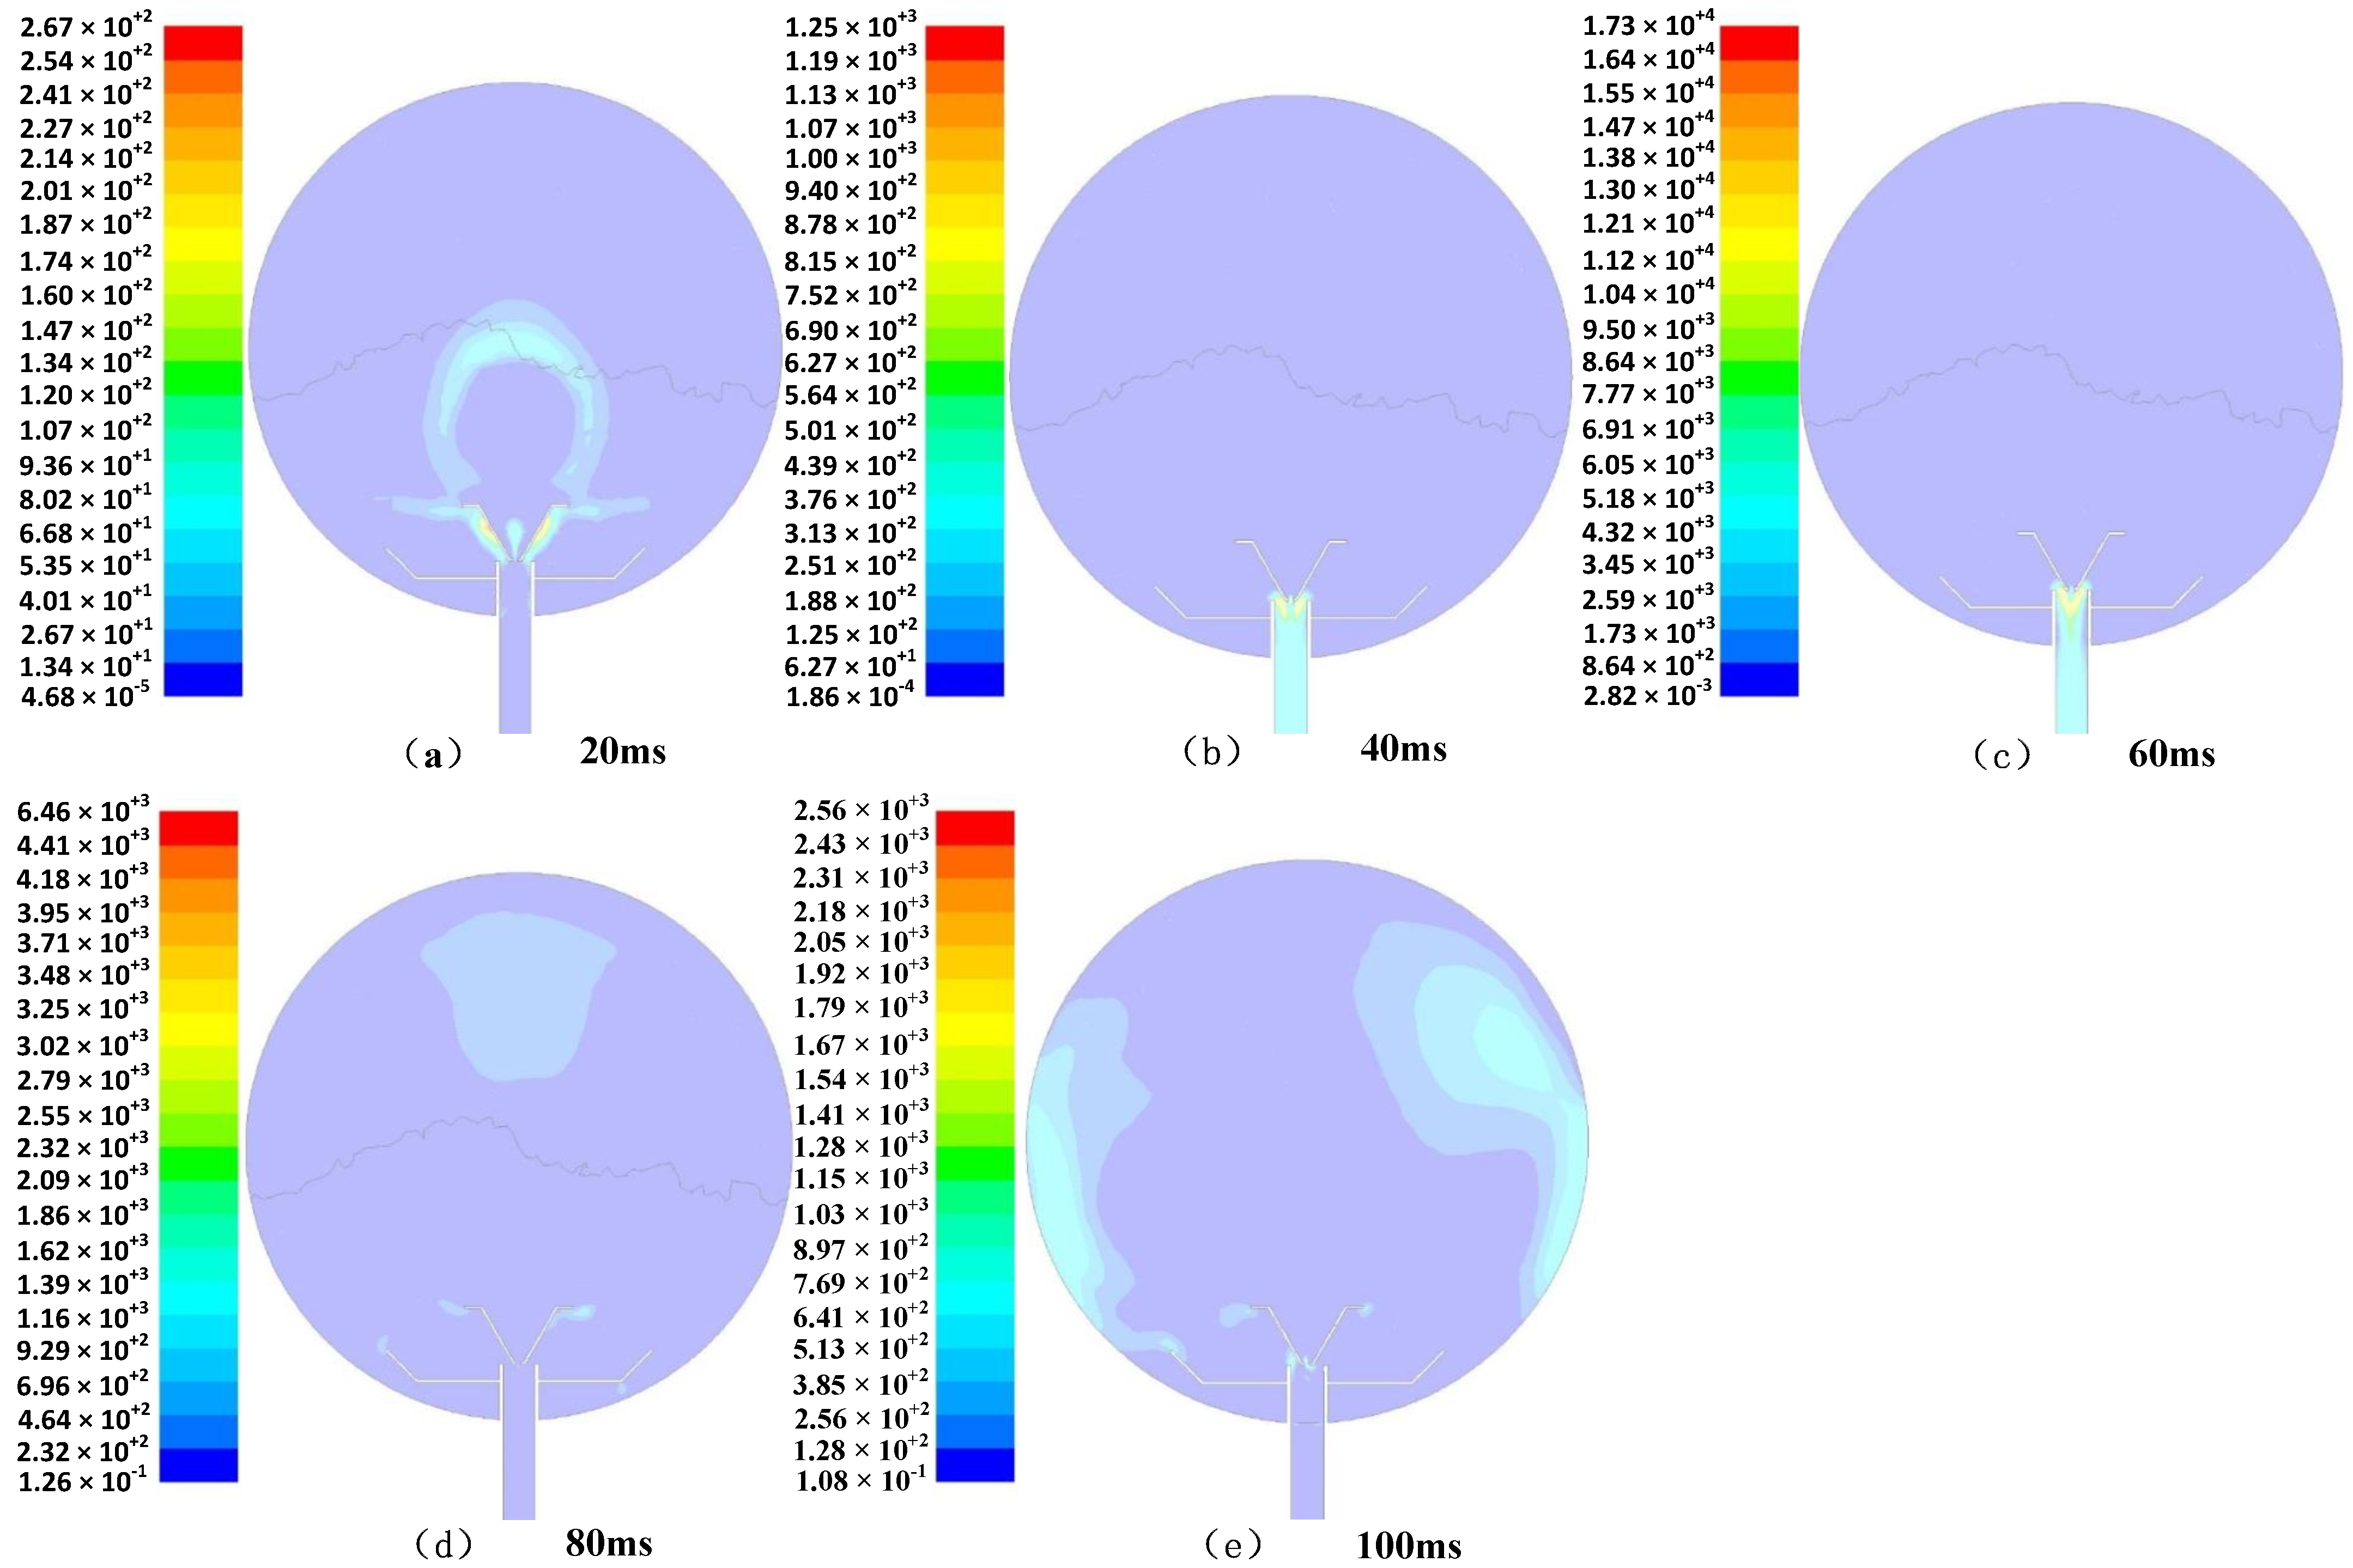
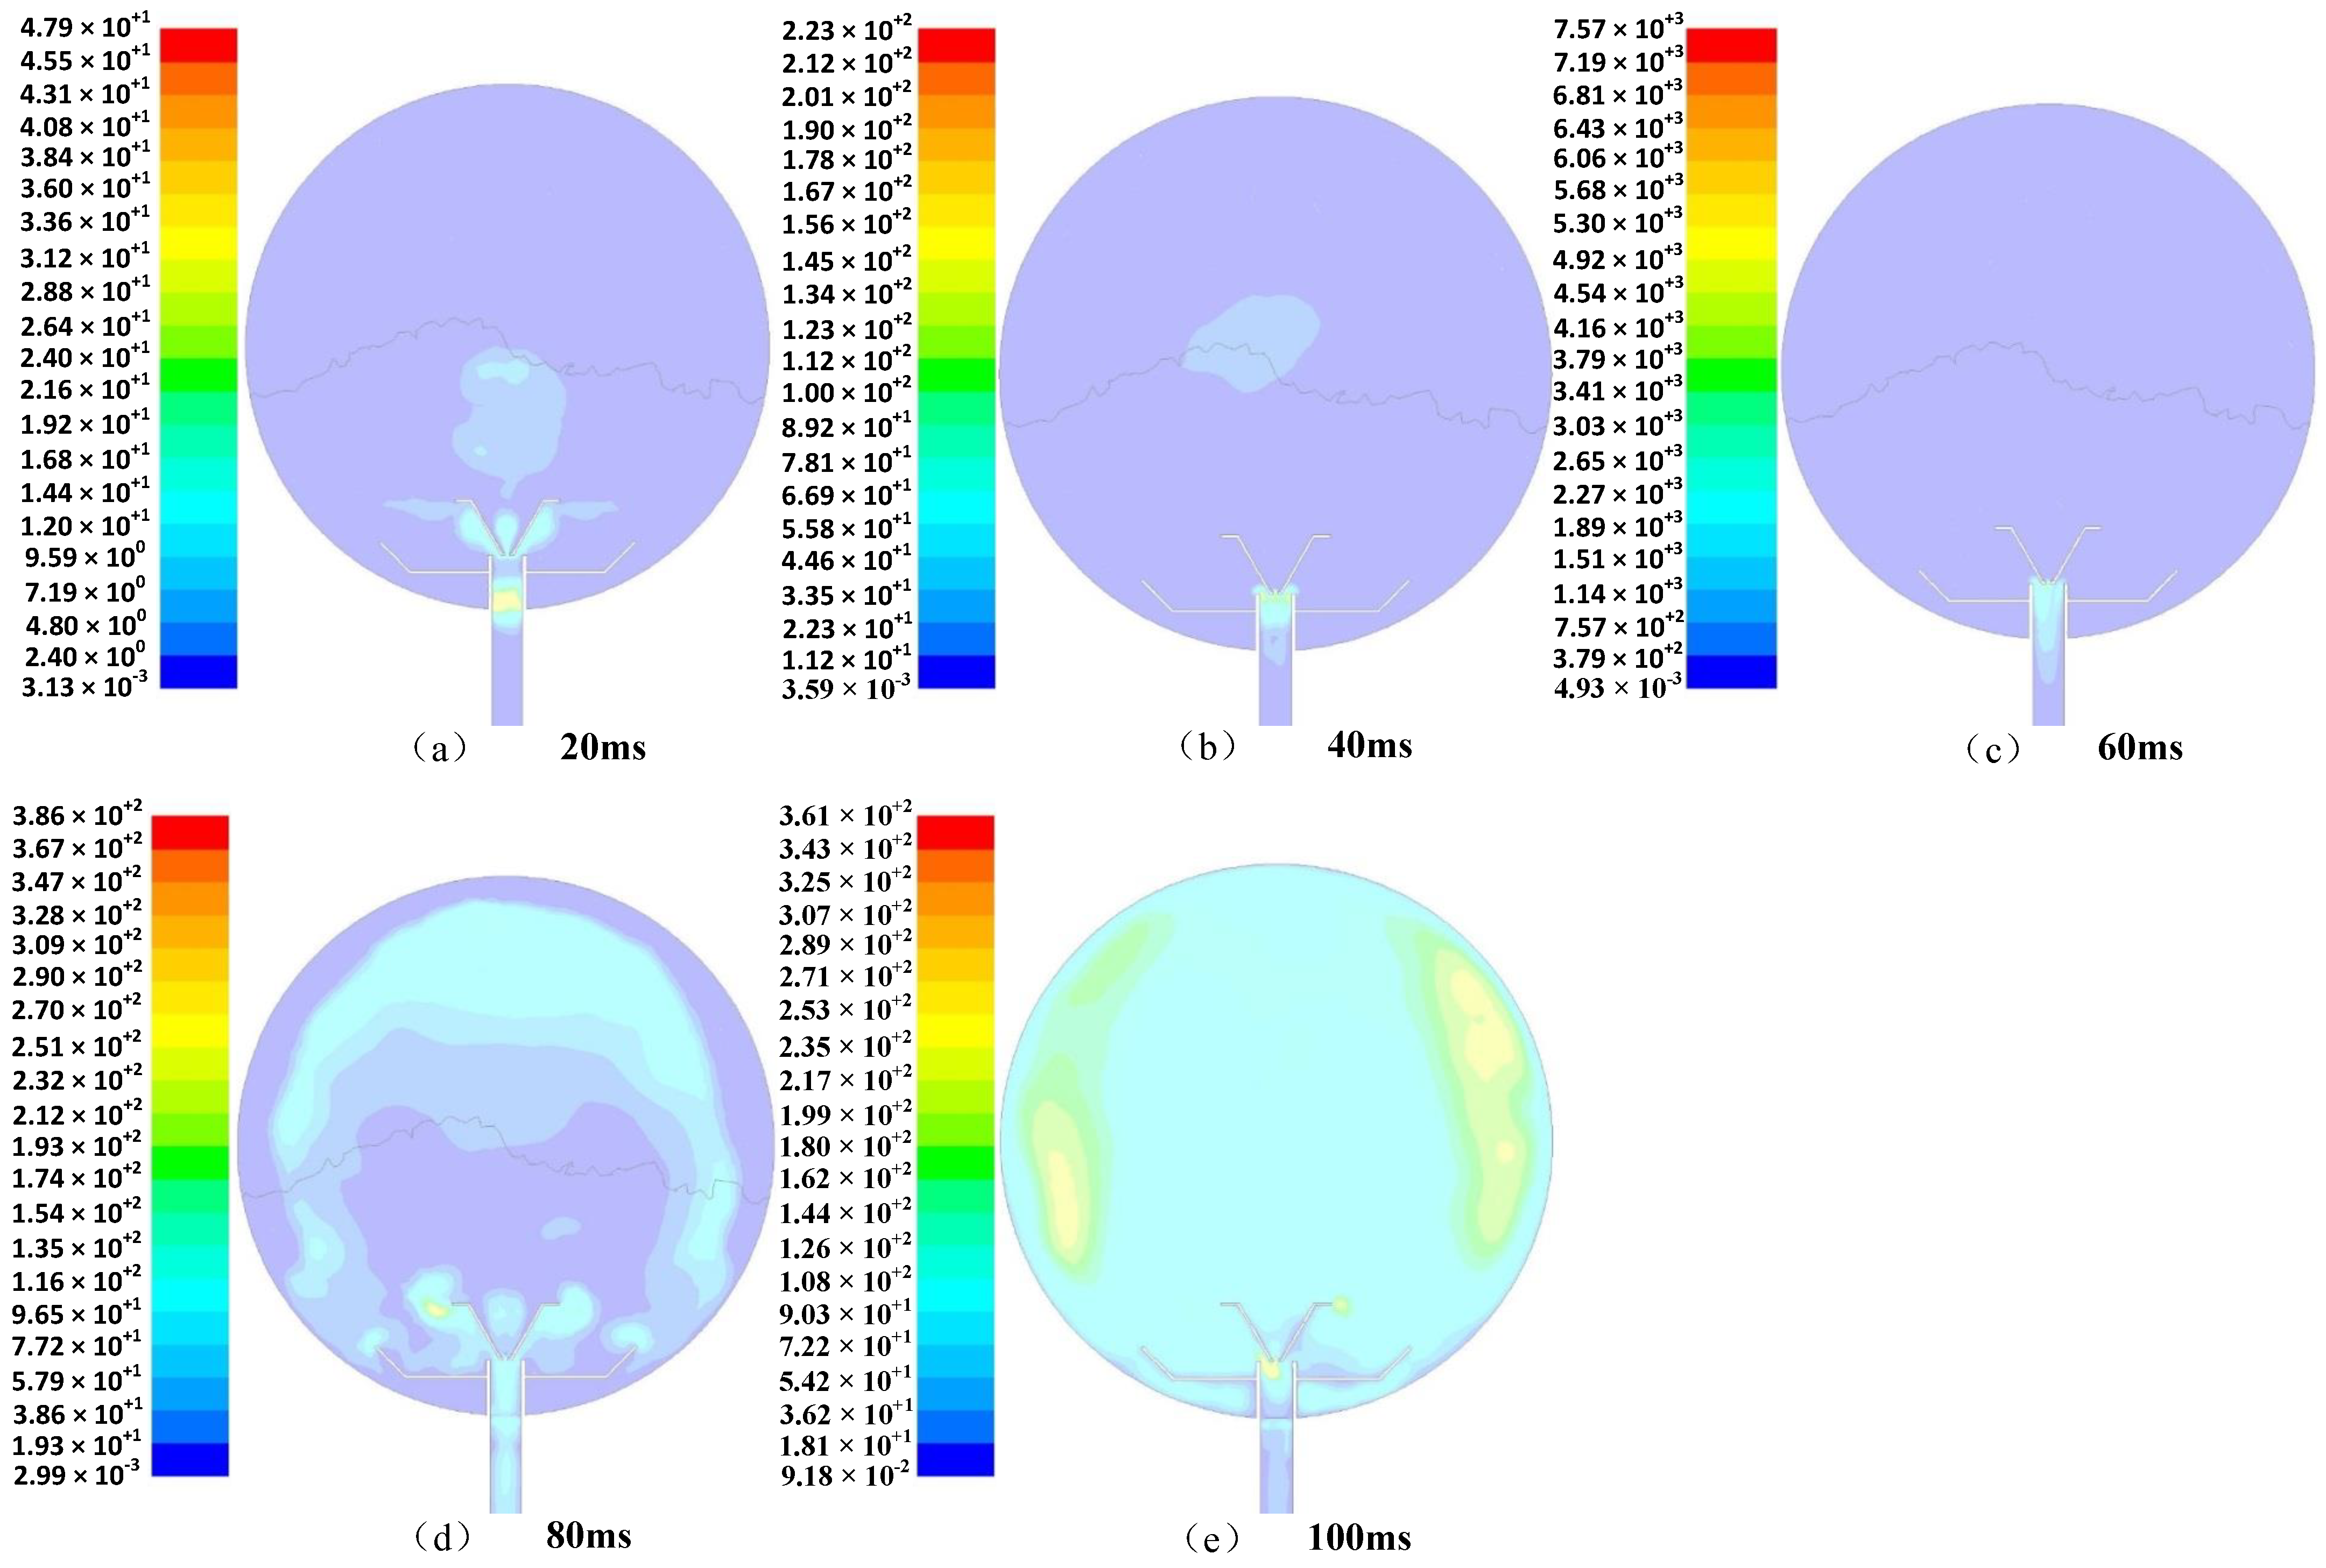
When the dust was ejected from the nozzle at a certain pressure, the dust had a large initial velocity under the action of the powder spraying pressure, and mainly scattered as a result of the two horizontal changes in the diffusion nozzle and the downward diffusion. With increasing time, the dust spread upward along the wall of the sphere and toward the center of the sphere. Due to the conversion of kinetic energy into potential energy, and also due to the friction between the particles, there was a decrease in the movement speed of the overall upward and center diffusion of the dust. The entrainment effect of airflow on particles decreased, and the time and quantity of the dust particles remaining at the center of the sphere increased.
(2)
After the dust was ejected from the nozzle, the dust mass first moved upward in a straight line for a certain period of time, and during this time, a small vortex could have formed in the side of the aerosol. When the clump of dust continued to move, the outer part of the dust group spread out and moved continuously in the inner space of the explosion container at a certain speed. When the dust reached the top, most of the dust was blocked by the top of the container and moved downward, and the gas dust spread into the space of the explosion container and continued to move in a disordered manner at a certain speed within the sphere.
(3)
With the passage of time, gravity gradually came to play a major role, and the dust particles began to settle freely under the action of mutual collision. The amount of dust floating in the sphere gradually decreased, and the descending trajectory of the particle group remained in a disordered state until the energy had been exhausted, and ultimately all of the dust settled.
(4)
The distribution of dust in the sphere was the most uniform at a dusting diffusion time of 120 ms, which is consistent with the actual experiment, in which the explosion pressure was very high with an ignition delay time of 130 ms, which was the best delay time.

3.4. Ignition and Explosion Simulation

(1)
Basic governing equations
The CFD software FLUENT was used to carry out a three-dimensional numerical simulation study on the combustion process of clouds of cassava flour. The simulation process assumed that the cassava flour was a regular spherical particle, and was based on chemical reaction kinetics and fluid mechanics with respect to mass conservation, energy conservation, momentum conservation and chemical aspects. The basic governing equations were established, starting from the reaction equilibrium, with the main equations being presented as Equations (2) to (5).
Mass conservation equation:
ρ t + ρ u i x i = 0
Energy conservation equation:
ρ h t + y x ( ρ u j μ e σ h h x j ) = dP dt + S h
Momentum conservation equation:
ρ u i t + x i ( ρ u i u j - u e u i x j ) = ρ x i + x j ( u e u j x j ) 2 3 x j [ δ ij ( ρ k + u e u k x k ) ]
Chemical reaction equilibrium equation:
( ρ Y f u ) x + x j ( ρ u j Y fu - μ e σ fu Y fu x j ) = 0
where P—pressure (MPa); t—time (s); ρ—density (kg/m3); Yƒu—combustion chemical reaction rate (mol·L−1·s−1); ui—velocity (m·s−1); μ—dynamic viscosity (N·s·m−2); k—turbulent kinetic energy (m2·s−2).
(2)
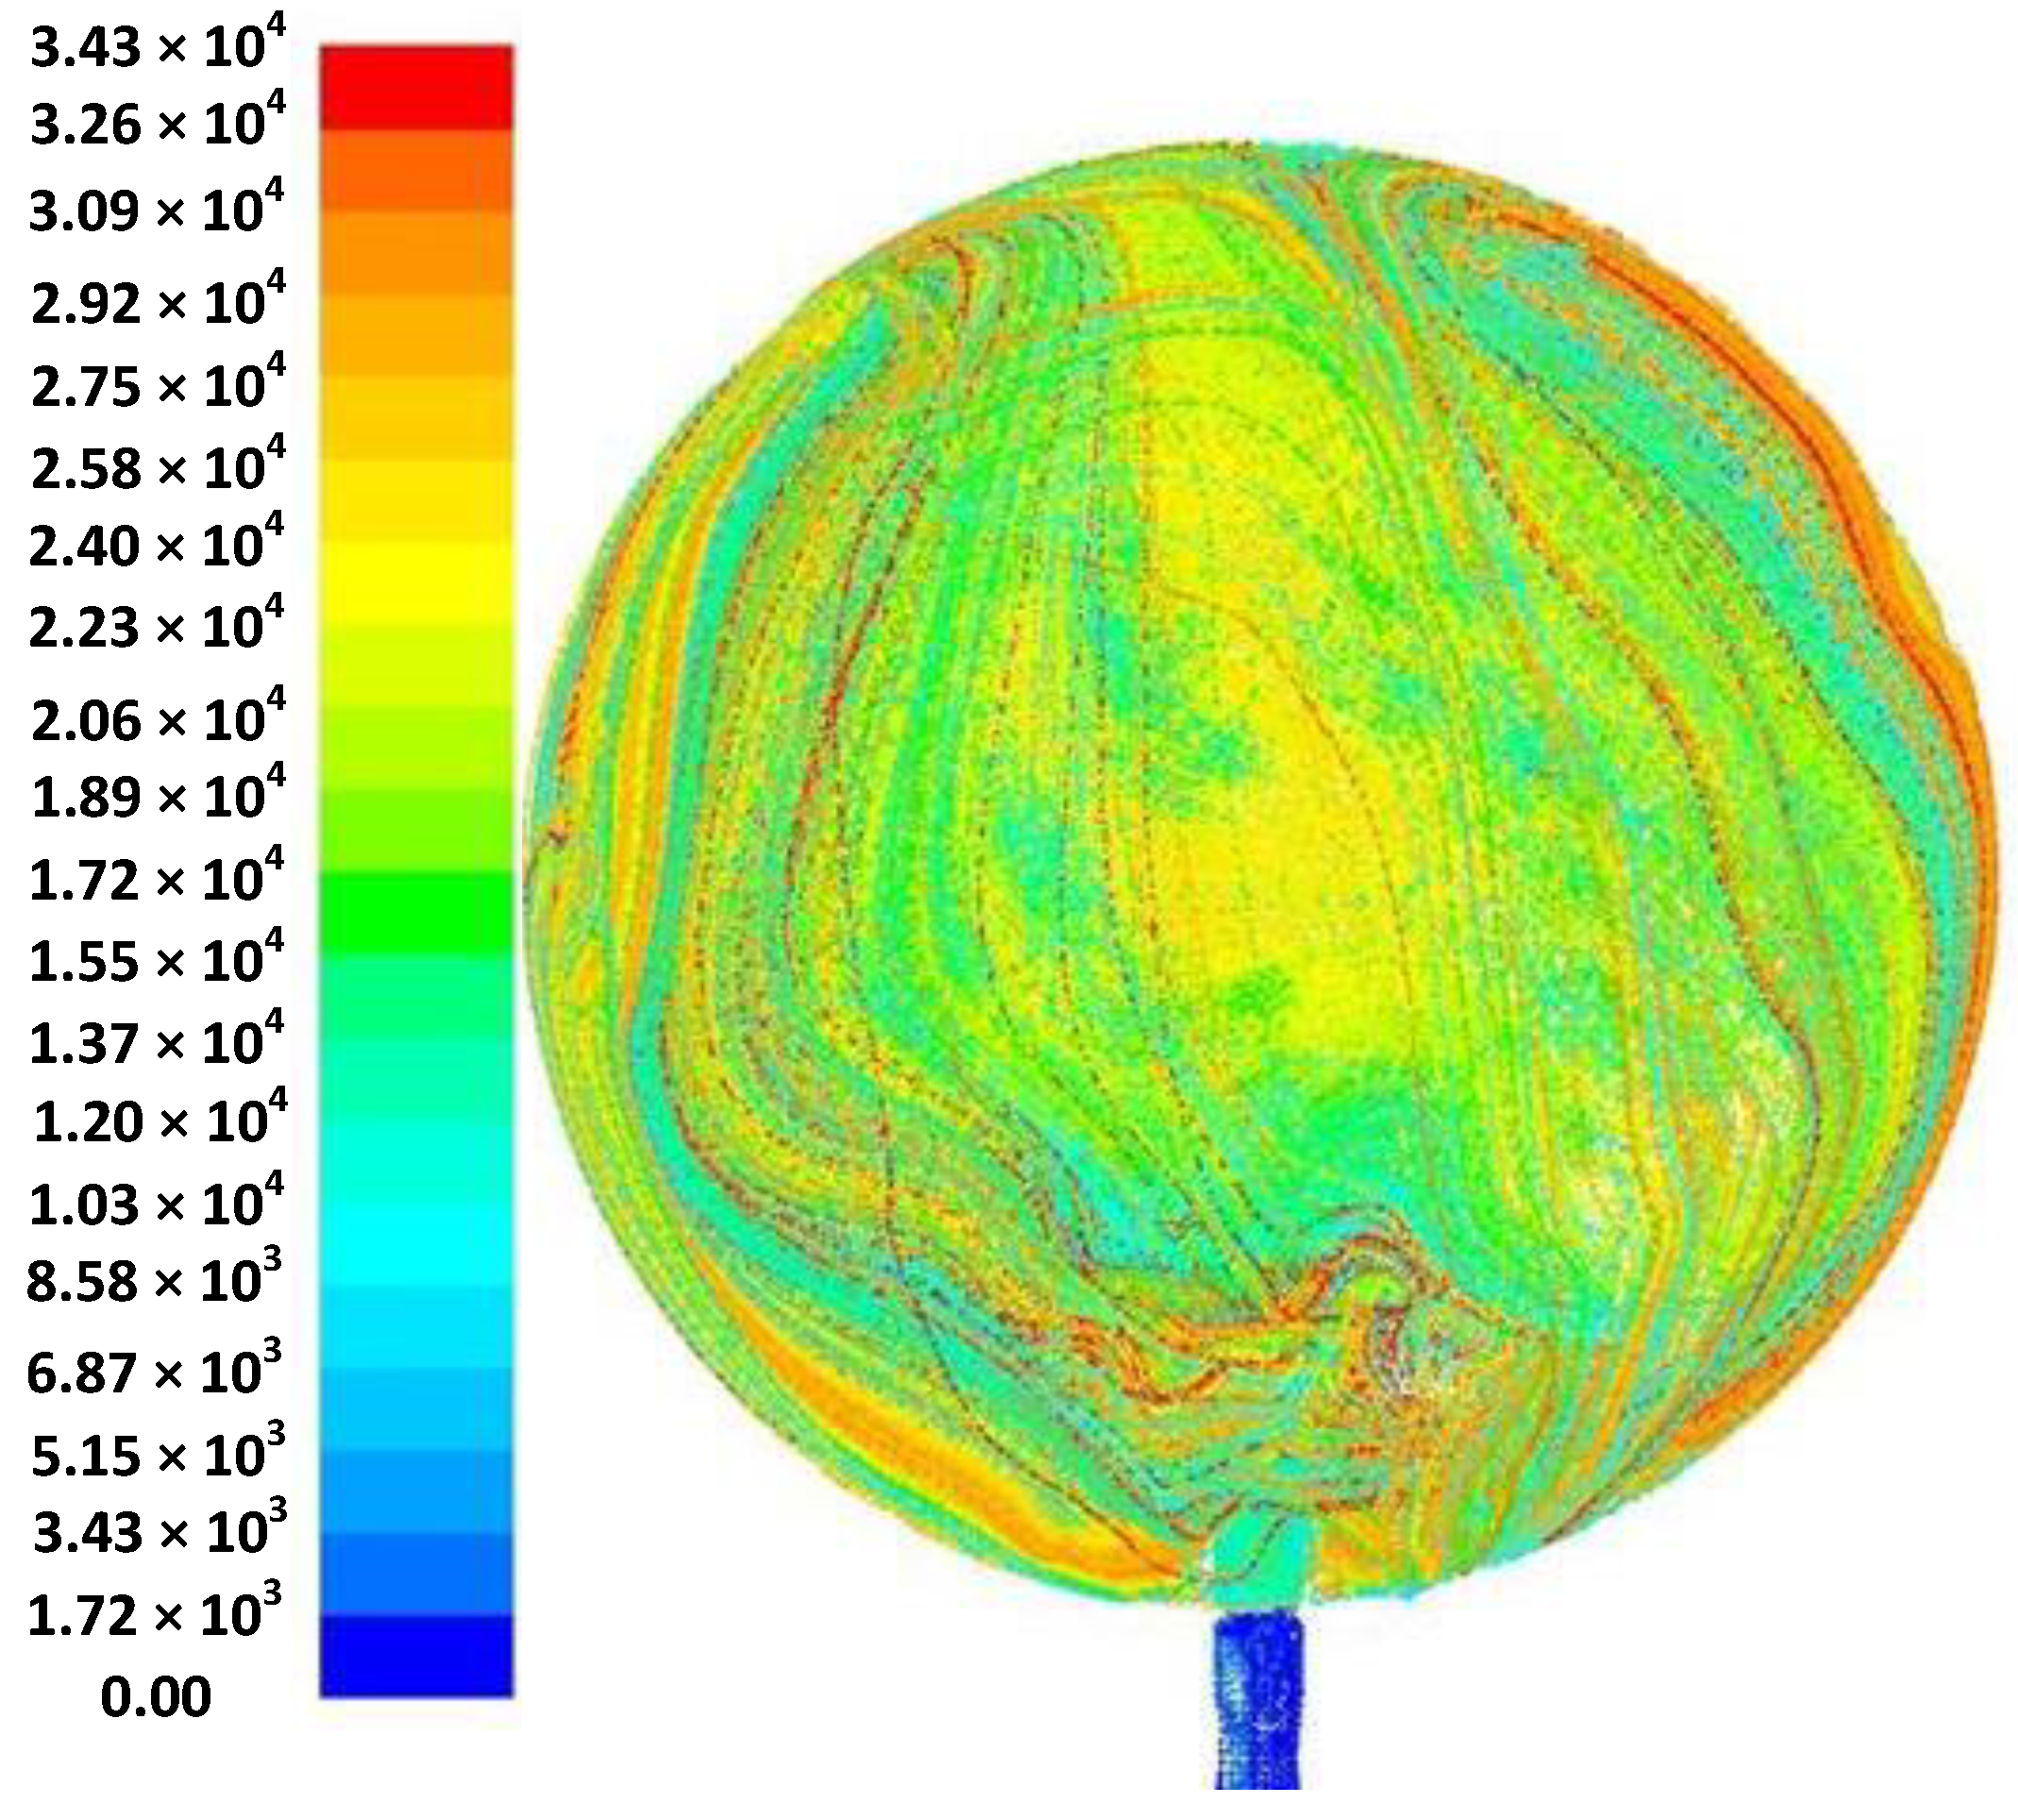
Simulation results and analysis of the ignition and deflagration process
After ignition, the dust continued to move upward due to inertia, causing the flame to move upward. On the other hand, due to gravity, a portion of the particles moved to the bottom of the tube, leading to incomplete combustion of the dust, as shown in Figure 8.
It can be seen in Figure 9 that the electrochemical ignition simulated deflagration following powder spraying and premixing for 120 ms. The calculation area of the simulation included the internal flow field area of the 20 L spherical tank. At the initial moment, the flame rapidly developed in front of the ignition position to the surrounding area, with an approximately spherical shape. The area with the highest dust concentration was slightly cooler in other areas. After the area in front of the flame, the incompletely burned dust continued to react until the reaction was terminated, and the temperature continuously gradually increased and then decreased due to heat dissipation.
It can be seen in Figure 10 that after the cassava flour was ignited, the temperature increased sharply, and the pressure increased until it reached its maximum value. The combustion of cassava flour is a typical deflagration process. The pressure in the container was uniform at a very fast speed, meaning that the pressure on each point of the container was basically the same, and the maximum explosion pressure was 46.7 MPa. Deflagration manifested as pressure waves propagating in front of the flame front, or the pressure uniformity was so fast that the pressure on all points in the container was basically the same.
It can be seen from Figure 11 that the dynamic pressure spreads to the surrounding area after powder spraying and then decreases to nothing. After ignition, the dynamic pressure spreads violently to the surrounding area, with the final dynamic pressure mainly acting on the wall of the sphere.
As shown in Figure 12, the degree of turbulence at the inlet was the greatest at the initial moment, and with increasing dusting time, the turbulence was the most intense in the area close to the ignition point, with turbulence intensity have a large gradient. After ignition, the gradient of turbulence intensity decreased sharply, and the turbulent gradient increased again at the end of deflagration. This is mainly due to the molecular activity of the gas mixture of the sphere reaching the highest peak at the highest temperature, and the turbulent kinetic energy also reaching its maximum value at this time.
As shown in Figure 13, at the initial moment of dust dispersion, the velocity of the flow field gradually increased and then decreased. When the dust was ignited, the temperature increased sharply, and the velocity of the flow field increased sharply until reaching its maximum value. Burning dust consumes the kinetic energy of the dust as a result of gravity and mutual friction. Therefore, after the dust moves to the top of the container, it continues to repeat the process of rising–falling–rising movement until the work of gravity has consumed all of the kinetic energy of the dust. The flow field velocity decreased relatively slowly.
As shown in Figure 14, the density decreased rapidly in the ignition area, and as combustion progressed, the low-density area gradually increased until it possessed a circular shape, and finally, at the end of the deflagration, the density gradually became lean and uniform.

4. Conclusions

The explosion characteristics of cassava starch and the physical movement of the dust both before and after explosion was systematically studied using a 20 L spherical explosion test device and a numerical simulation method within ANSYS.FLUENT software R17.0. The conclusions are as follows:
(1)
With increasing ignition delay time, the explosion pressure gradually increased towards a peak, reaching a maximum value of 0.476 MPa at a corresponding ignition delay time of 120 Ms. At this time, the uniform dust in the ball was effectively ignited, and the cloud concentration reached its maximum value. The explosion reactions were also the most favorable, and the resulting pressure reached its maximum value. When the ignition delay time was greater than 120 Ms, the dust cloud that could effectively be burned in the ball gradually decreased, the heat and intensity of the combustion process decreased, and the explosion pressure also decreased. The relationship between time point of ignition and the increase in the maximum explosion pressure rate was random, and the maximum explosion index was 22.37 MPa∙M∙s−1.
(2)
With increasing dust concentration, the explosion pressure increased until reaching its maximum value, and then gradually decreased; within a certain range of dust quality, with appropriate injection pressure, the dust concentration was found to be proportional to the explosion pressure. The more unburned particles of dust there were in the combustion pellets, the less heat there was in the sphere, resulting in a lower explosion pressure due to the absorption of a lot of the heat by the unburned particles. The maximum rate of increase in explosion pressure was 13.84 MPa∙M∙s−1.
(3)
With increasing injection pressure, the initial acceleration in the dust became greater, and the diffusion dust became more uniform. When the pressure reached a certain value, the dust reached its maximally uniform value, the explosion was the most extensive, and the explosion pressure reached its highest value. However, when the pressure exceeded a certain value, acceleration increased, and the dust diffusion began to become uneven.
(4)
The numerical simulation was able to reflect the physical movement law of dust diffusion in a 20 L spherical tank, as well as the whole process of temperature, pressure and turbulence from ignition to explosion and extinction.

Author Contributions

Conceptualization, R.Z. and C.X.; methodology, R.Z.; software, R.Z.; validation, C.X.; formal analysis, R.Z.; investigation, R.Z.; resources, C.X.; data curation, R.Z.; writing—original draft preparation, R.Z.; writing—review and editing, C.X.; visualization, R.Z.; supervision, C.X.; project administration, C.X.; funding acquisition, C.X. All authors have read and agreed to the published version of the manuscript.

Funding

This research was funded by the Hunan Province Science Foundation, grant number “2021JJ30679”.

Institutional Review Board Statement

Not applicable.

Informed Consent Statement

Not applicable.

Data Availability Statement

Not applicable.

Conflicts of Interest

The authors declare no conflict of interest.

References

  1. Tan, B.; Shao, Z.; Xu, B.; Wei, H.; Wang, T. Analysis of explosion pressure and residual gas characteristics of micro-nano coal dust in confined space. J. Loss Prev. Process Ind. 2020, 64, 104056. [Google Scholar] [CrossRef]
  2. Saha, L.K.; Bala, S.K.; Roy, N.C.; Molla, M. Numerical simulation of natural convection of dusty nanofluids within a curve-shaped enclosure. AIP Adv. 2020, 10, 105304. [Google Scholar] [CrossRef]
  3. Huang, L.; Zhang, X.; Xu, M.; An, S.; Li, C.; Huang, C.; Chai, K.; Wang, S.; Liu, Y. Dietary fibres from cassava residue: Physicochemical and enzymatic improvement, structure and physical properties. AIP Adv. 2018, 8, 105035. [Google Scholar] [CrossRef] [Green Version]
  4. Zhang, X.; Pan, Y. Preparation, Properties and Application of Gel Materials for Coal Gangue Control. Energies 2022, 15, 557. [Google Scholar] [CrossRef]
  5. Yang, L.G.; Yuan, H.X.; Eckhoff, R.K. A catastrophic aluminium-alloy dust explosion in China. J. Loss Prev. Process. Ind. 2016, 39, 121–130. [Google Scholar] [CrossRef]
  6. Wang, S.; Shi, Z.; Peng, X.; Zhang, Y.; Cao, W.; Chen, W.; Jun, L. Effect of the ignition delay time on explosion severity parameters of coal dust/air mixtures. Powder Technol. 2018, 342, 509–516. [Google Scholar] [CrossRef]
  7. Han, F.; Zhang, J.; Zhao, Y.; Han, J. Experimental investigation on the interaction process between coal particles and foam. AIP Adv. 2019, 9, 015023. [Google Scholar] [CrossRef] [Green Version]
  8. Stahmer, K.-W.; Gerhold, M. Study of the explosion reactions of sucrose, activated charcoal, polyethylene and lignite part 2: Study of the gas phase following the explosion reaction. J. Loss Prev. Process Ind. 2017, 48, 216–222. [Google Scholar] [CrossRef]
  9. ASTM E1226-12a; Standard Test Method for Explosibility of Dust Clouds. ASTM International: West Conshohocken, PA, USA, 2020; pp. 1–15.
  10. Cao, W.; Gao, W.; Liang, J.; Xu, S.; Pan, F. Flame-propagation behavior and a dynamic model for the thermal-radiation effects in coal-dust explosions. J. Loss Prev. Process Ind. 2014, 29, 65–71. [Google Scholar] [CrossRef]
  11. Cao, W.; Cao, W.; Peng, Y.; Qiu, S.; Miao, N.; Pan, F. Experimental study on the combustion sensitivity parameters and pre-combusted changes in functional groups of lignite coal dust. J. Powder Technol. 2015, 283, 512–518. [Google Scholar] [CrossRef]
  12. Cao, W.; Qin, Q.; Cao, W.; Lan, Y.; Chen, T.; Xu, S.; Cao, X. Experimental and numerical studies on the explosion severities of coal dust/air mixtures in a 20-L spherical vessel. Powder Technol. 2017, 310, 17–23. [Google Scholar] [CrossRef]
  13. Xu, S.; Wang, J.; Wang, H.; Jiang, R.; Zhang, Y.; Zhao, M.; Li, Y.; Shi, T.; Cao, W. Hazard evaluation of explosion venting behaviors for aluminum powder/air fuels using experimental and numerical approach. J. Powder Technol. 2020, 364, 78–87. [Google Scholar] [CrossRef]
  14. Yu, J.; Zhang, X.; Zhang, Q.; Wang, L.; Ji, K.; Peng, L.; Gao, W. Combustion behaviors and flame microstructures of micro- and nano-titanium dust explosions. Fuel 2016, 181, 785–792. [Google Scholar] [CrossRef]
  15. Zhong, S.; Deng, X. Modeling of maize starch explosions in a 12 m3 silo. J. Loss Prev. Process Ind. 2000, 13, 299–309. [Google Scholar] [CrossRef]
  16. Zhong, S.; Teodorczyk, A.; Deng, X.; Dang, J. Modeling and simulation of coal dust explosions. J. Phys. Colloq. 2002, 12, 141–147. [Google Scholar] [CrossRef]
  17. Ren, J.; Chang, C.; Rao, G.; Bai, C.; Jing, Q.; Peng, X.; Xiao, Q. Experimental and numerical simulation study on the effect of ignition delay time on dust explosion in the 1 m3 vessel. Journal of Loss Prevention in the Process Industries. 2022, 78, 104801. [Google Scholar] [CrossRef]
  18. Wang, D.; Qian, X.; Wu, D.; Ji, T.; Zhang, Q.; Huang, P. Numerical study on hydrodynamics and explosion hazards of corn starch at high-temperature environments. Powder Technol. 2019, 360, 1067–1078. [Google Scholar] [CrossRef]
  19. Jing, Q.; Wang, D.; Liu, Q.; Shen, Y.; Wang, Z.; Chen, X.; Zhong, Y. Transient reaction process and mechanism of cornstarch/air and CH4/cornstarch/air in a closed container: Quantitative research based on experiments and simulations. J. Hazard. Mater. 2020, 409, 124475. [Google Scholar] [CrossRef]
  20. Jing, Q.; Wang, D.; Liu, Q.; Chen, X.; Shen, Y.; Wang, Z.; Zhong, Y. Inhibition effect and mechanism of ultra-fne water mist on CH4/air detonation: Quantitative research based on CFD technology. J. Process Saf. Environ. Protect. 2021, 148, 75–92. [Google Scholar] [CrossRef]
  21. Jing, Q.; Huang, J.; Liu, Q.; Wang, D.; Chen, X.; Wang, Z.; Liu, C. The flame propagation characteristics and detonation parameters of ammonia/oxygen in a large-scale horizontal tube: As a carbon-free fuel and hydrogen-energy carrier. Int. J. Hydrogen Energy 2021, 46, 19158–19170. [Google Scholar] [CrossRef]
  22. Jing, Q.; Wang, D.; Liu, Q.; Ren, L.; Wang, Y.; Liu, C.; Shen, Y.; Wang, Z. Study on transient reaction mechanism and explosion intensity parameters of micron-sized flake aluminum dust in air. Chem. Eng. Sci. 2021, 246, 116884. [Google Scholar] [CrossRef]
  23. Jing, Q.; Wang, D.; Liu, Q.; Liu, C.; Wang, Z.; He, Z.; Yang, Z. Deflagration evolution characteristic and chemical reaction kinetic mechanism of JP-10/DEE mixed fuel in a large-scale tube. Fuel 2022, 322, 124238. [Google Scholar] [CrossRef]
  24. Huang, L. Study on Dust Explosion Characteristics of Lycopodium Powder. Doctoral Dissertation, Nanjing University of Science and Technology, Nanjing, China, 2014. [Google Scholar]
  25. Xie, C.; Xiong, G.; Chen, Z. Using CFD to Simulate the Concentration of Polluting and Harmful Gases in the Roadway of Non-Metallic Mines Reveals Its Migration Law. Sustainability 2022, 14, 13349. [Google Scholar] [CrossRef]
  26. Cao, J.; Xie, C.; Hou, Z. Ecological evaluation of heavy metal pollution in the soil of Pb-Zn mines. Ecotoxicology 2022, 31, 259–270. [Google Scholar] [CrossRef] [PubMed]
  27. Li, H.; Chen, X.; Deng, J.; Shu, C.-M.; Kuo, C.-H.; Yu, Y.; Hu, X. CFD analysis and experimental study on the effect of oxygen level, particle size, and dust concentration on the flame evolution characteristics and explosion severity of cornstarch dust cloud deflagration in a spherical chamber. Powder Technol. 2020, 372, 585–599. [Google Scholar] [CrossRef]
  28. Di Sarli, V.; Russo, P.; Sanchirico, R.; Di Benedetto, A. CFD simulations of dust dispersion in the 20 L vessel: Effect of nominal dust concentration. J. Loss Prev. Process Ind. 2013, 27, 8–12. [Google Scholar] [CrossRef]
  29. Xie, C.; Nguyen, H.; Choi, Y.; Armaghani, D.J. Optimized functional linked neural network for predicting diaphragm wall deflection induced by braced excavations in clays. Geosci. Front. 2022, 13, 101313. [Google Scholar] [CrossRef]
Figure 1. Photograph of native cassava starch.
Processes 10 02419 g001
Figure 2. Electron microscope scan of native cassava starch.
Processes 10 02419 g002
Figure 3. Particle size distribution of starch.
Processes 10 02419 g003
Figure 4. A 20 L, HY16426C ball-type dust explosion parameter testing device.
Processes 10 02419 g004
Figure 5. Correspondence between the maximum rate of pressure increase and ignition delay time.
Processes 10 02419 g005
Figure 6. Numerical simulation solution flowchart.
Processes 10 02419 g006
Figure 7. Geometric model and meshing diagram of 20 L spherical explosion container.
Processes 10 02419 g007
Figure 8. Aerosol velocity–time contour maps at different time points (20 ms, 40 ms, 60 ms, 80 ms, 100 ms, 120 ms) at a powder injection pressure of 0.8 MPa.
Processes 10 02419 g008
Figure 9. Traces of dust activity before ignition and explosion.
Processes 10 02419 g009
Figure 10. Temperature change after ignition.
Processes 10 02419 g010
Figure 11. Dynamic pressure evolution before and after ignition and explosion.
Processes 10 02419 g011
Figure 12. Evolution of turbulent kinetic energy (m2/s2).
Processes 10 02419 g012
Figure 13. Velocity evolution of flow field.
Processes 10 02419 g013
Figure 14. Change in density.
Processes 10 02419 g014
Table 1. Explosion pressure of cassava starch dust under different ignition delay times.
Ignition Delay Time (ms)Explosion Pressure (MPa)
1st2nd3rdAverage Value
150.3810.3450.4290.385
300.3650.4950.3340.398
600.3450.3960.3290.428
900.4570.4780.4510.462
1200.4120.5600.4580.476
1500.4590.3980.4060.421
1800.4310.3610.4350.409
2100.3310.3340.1920.285
Table 2. Explosion pressure of cassavas dust under different dust concentrations.
Dust Concentration
(g∙m−3)
Explosion Pressure (MPa)
1st2nd3rdAverage Value
2000.2650.2610.1930.380
2500.4120.5600.4580.476
4000.5850.6070.6430.611
5000.6340.6850.6270.649
7500.6960.6890.6990.695
10000.6660.6680.6480.661
12500.6300.6800.6720.660
Table 3. Explosion pressure of cassava dust under different dusting pressures.
Dust Pressure (MPa)Explosion Pressure (MPa)
1st2nd3rdAverage Value
0.90.4420.3900.3780.403
1.10.3870.4980.4120.432
1.30.4120.560.4580.476
1.50.3960.5200.4880.467
1.70.5040.4390.3410.428
1.90.3690.2890.3640.340
Table 4. Risk classification of explosive dust.
Explosive Index RangeExplosion Hazard Class
Kst max     200   bar · m / s
200   bar · m / s   <   Kst max     300   bar · m / s
St1
St2
Kst max   >   300   bar · m / s St3
Publisher’s Note: MDPI stays neutral with regard to jurisdictional claims in published maps and institutional affiliations.

