Article

Ultrasound-Assisted Extraction of Polyphenols from Olive Pomace: Scale Up from Laboratory to Pilot Scenario

by
Óscar Rodríguez
1,*,
Sergio Bona
1,
Andreas Stäbler
2 and
Laura Rodríguez-Turienzo
1
1
IRIS Technology Solutions, Sl. Crta D’esplugues 39-41, 08940 Cornellà De Llobregat, Spain
2
Fraunhofer-Institute for Process Engineering and Packaging, Giggenhauser Str. 35, 85354 Freising, Germany
*
Author to whom correspondence should be addressed.
Processes 2022, 10(12), 2481; https://doi.org/10.3390/pr10122481
Submission received: 31 October 2022 / Revised: 11 November 2022 / Accepted: 18 November 2022 / Published: 23 November 2022
(This article belongs to the Special Issue Non-thermal Technologies in Food Science)

Abstract

:
Power ultrasound application has been proven to intensify the extraction of biocompounds from plant materials. In this work, the ultrasound-assisted extraction (UAE) of polyphenols from olive pomace (OP) has been studied at three different scales: laboratory (batch, 400 W, 0 barg), medium (continuous, 1000 W, 1.0 barg), and pilot (continuous, 2000 W, 1.0 barg) taking into consideration the influence of technological parameters: extraction time (s), solvent to solid ratio (mL/g), mixture pH, and acoustic parameters: amplitude (µm), intensity (W/cm2), and applied energy (Wh). A central composite design was used to optimize the UAE at laboratory scale (0.2 kg). The optimal conditions were: time: 490 s; ratio: 2.1 mL H2O/g OP; pH: 5.6 at an acoustic amplitude of 46 µm for a maximum extraction yield of 3.6 g GAE/L of extract. At medium scale (2.2 kg) the UAE was carried out using amplitudes from 41 to 57 µm. The effect of the pressure (1.0 barg) on the UAE was positive, in terms of higher extraction yield (2.9 g GAE/L) and faster extraction rates compared to the non-pressurized UAE (2.5 g GAE/L), however, the extraction yield was lower than the one observed at laboratory scale. At pilot scale (120 kg), the UAE involved different ultrasound constellations (booster + sonotrode) to deliver the ultrasound energy at different acoustic intensities from 23 to 57 W/cm2. The acoustic intensity (W/cm2) exerts an important effect on the extraction yield, and should be tailored to each process scale. The highest yield obtained at pilot-scale was 3.0 g GAE/L, and it was 58% higher than the one observed in the conventional extraction without ultrasound assistance (stirring and heating). In all tests, regardless of the scale, higher yields were observed between 80 and 85 °C. The application of this technology at the industrial scale to evaluate if the improvement of the extraction caused by the application of ultrasound could is still important when other operations like centrifugation, ultrafiltration, and reverse osmosis are included in the system and to evaluate its techno-economic feasibility.

1. Introduction

The food-processing industry produces large volumes of waste, both solids and liquids, generated from the production, preparation, and consumption of food. In the European Union, the generation of organic waste related to human activity reaches 1.3 billion tons per year, which means 3.5 tons of solid waste per capita [1]. EU producing countries account for 70 to 75 % of the global production of olive oil, and more than one third of table olives. Olive-based products are primary elements in the agricultural economy of the EU’s southern countries, with about 5 million hectares of plantations and more than €7000 million in production value every year [2]. Both cultivation and processing of olive oil and table olives generates an enormous quantity of solid wastes (4.7 million tons) and liquid effluents (8.9 million tons), with few practical uses; they are usually disposed in nature, creating major environmental problems [3].
The main residue of the olive oil extraction process is olive pomace. It is the remaining pulpy material after removing most of the oil from the olive paste and it consists of pieces of skin, pulp, stone, and olive kernel, and corresponds to almost 80% of the weight [4]. Most of the phenolic compounds present in the olive fruit are not transferred to the olive oil, leaving a high amount of biocompounds (>95%) in the pomace, which, when disposed in nature, exerts a negative effect in the ecosystem [5,6]. Despite the existence of legislation that limits the disposal of these by-products on soil, there is no a specific guideline regarding the olive mill waste waters [7]. Hence, each country has developed its own national legislation. The amount of waste release ranges from 30 m3 ha/year in Italy and Spain to 80 m3/ha per year in Portugal. Regarding Greece, the law establishes a monthly average limit of 5 kg of product for suspended solids as limit value, and in Cyprus this value depends on the process used for oil extraction, up to 360 m3/ha per year [8].
The EU funded project AGRIMAX (GA 720719) aims to combine affordable and flexible processing technologies, such as solvent extraction, for the valorization of side streams from the horticultural activities and food processing industry to be used in a cooperative approach by local stakeholders. Depending on the nature of the material and the target compounds to be recovered, different conventional extraction techniques can be used [4], but solvent extraction including Generally Recognized as Safe (GRAS) solvents is widely used, although long extraction times are required (±48 h) together with high temperatures (>80 °C) that could denature or degrade those compounds [9,10]. This drawback can be overcome by the application of ultrasound power during extraction [11]. Ultrasound-assisted extraction (UAE) relies on the cavitation effect, which promotes the damage of the cell walls of the plant material, therefore easing the release of the bioactive compounds into the solvent [12,13].
In terms of extraction yield, UAE has been proved beneficial, however, different factors should be considered during UAE like extraction temperature, ratio of solvent to material, extraction time, additional stirring, as well as the acoustic energy applied, frequency, acoustic amplitude, and acoustic intensity [14,15]. Despite the multiple benefits of UAE, the scalability of this technology for commercial use is under development and represents an interesting challenge that must be tailored to each application in the industry [16].
Therefore, the main objective of this study was to evaluate the scalability of the UAE from laboratory-scale (0.2 kg) through medium-scale (2.2 kg) to pilot-scale (120 kg) by using the phenolic extraction yield as the main response. In all stages, the effect caused by acoustic parameters such as: amplitude, intensity, and specific energy, together with technological aspects such as extraction time, temperature, pH, and ratio solvent/solid were considered toward an efficient management of olive pomace that could minimize the pollution hazard.

2. Materials and Methods

2.1. Sample Preparation

Olive pomace (OP) was obtained after the olive (Olea europaea L cv. Arbequina) oil extraction was collected and provided by Indulleida S.A (Lleida, Spain). The moisture content of the OP (AOAC, N° 934.06) was of 72.1 ± 3.1%. The OP was stored at −18 °C and shipped to IRIS Technology Solutions, SL (Cornellà, Catalonia, Spain) for the laboratory and medium-scale experiments, and to the Fraunhofer-Institute for Process Engineering and Packaging (Freising, Bavaria, Germany) for the pilot-scale experiments. The OP was kept frozen at −18 °C until its use. Before the experiments, the OP was thawed at room temperature and immediately used for the extraction process.

2.2. Ultrasound-Assisted Extraction

2.2.1. Laboratory-Scale: Batch

UAE of polyphenols from OP was conducted in batch mode using an UP400St (400 W, 24 kHz) ultrasonicator (Hielscher, Teltow, Germany). The acoustic energy was delivered using a titanium probe at fixed amplitude of 46 µm. Distilled water (0.15 L) and OP were mixed in a 250 mL glass beaker in different ratios. The UAE started at room temperature (20 ± 1 °C), however, because of the ultrasound application, a rise in the temperature (ΔT) of the mixture was observed and recorded in Table 1.
With the aim of identifying the effects of the UAE variables (factors) and their interactions on the UAE yield (response) while minimizing the number experiments, a central composite design circumscribed: 23 + star was used [10]. Factors considered were: mixture pH: 3.5–6.4; ratio mL of water/g of OP: 3.0–8.0; and extraction time (s): 90–430. Seventeen experiments, including three replicates at the center point, were performed. The UAE response was the total polyphenol content in the liquid extract expressed as g gallic acid equivalent (GAE)/L. The detailed experimental design is shown in Table 1, together with the responses observed.
Experimental response was expressed as mean value ± standard deviation of three measurements. Statistical analysis on the means was carried out using the ANOVA (p < 0.05) procedure of the Statgraphics centurion v.17 (Statgraphics Technologies, The Plains, VA, USA).

2.2.2. Medium-Scale: Continuous

Medium-scale UAE of polyphenols was carried out using a UIP1000hdT (1000 W, 20 kHz) ultrasonicator (Hielscher, Teltow, Germany). The acoustic energy was delivered by using different constellations (sonotrode-booster) in order to test acoustic amplitudes from 41 to 57 µm. For each trial, 0.75 kg of OP were mixed with 1.5 L of distilled water. The mixture was manually homogenized before the extraction and poured in a 5 L feed tank (without stirring). The initial temperature of the mixture was 20 ± 1 °C. The mixture was pumped through the jacketed flow cell by means of a fluid pump (InoxMIM Group, Girona, Spain).
Chilled water (6 °C) was used as cooling mechanism in order to slow down the heating of the sample during the UAE. Tests were carried out at 0 and 1.0 barg in order to increase the ultrasonic intensities delivered into the system.

2.2.3. Pilot-Scale: Continuous

Pilot-scale UAE was carried out at Fraunhofer-Institute for Process Engineering and Packaging (Freising, Germany) by using a UIP2000hdT (2000 W, 24 kHz) ultrasonicator (Hielscher, Teltow, Germany). The acoustic energy was delivered by using different constellations (cascatrode-booster) in order to test acoustic amplitudes from 30 to 42 µm.
The acoustic energy was applied using a jacketed flow cell. Therefore, the mixture was pumped through the flow cell by means of a fluid pump (InoxMIM Group, Girona, Spain). Chilled water (6 °C) was used as cooling mechanism in order to slow down the heating of the sample during the UAE. Previous test carried out at the Pilot plant suggested the reduction of the ratio H2O/OP to 1.4 mL/g and the adjustment of the mixture’s pH to 7.0. Therefore, for each trial, 50 kg of OP were mixed with 70 L of distilled water; (120 kg) in a 300 L doubled jacketed reactor equipped with stirrer and the pH was adjusted to 7.0 using a 10% NaOH solution. The initial temperature of the mixture was 20 ± 1 °C Tests were carried out at 0 and 1.0 barg in order to increase the ultrasonic intensity delivered into the system.

2.2.4. Total Polyphenol Content (TPC) Determination

The TPC of the liquid extract was determined according to the methodology described by Şahin & Şamli [3] with some modifications. The total polyphenol content was expressed in gallic acid equivalent per L of extract (g GAE/L) and per kg of dried OP (g GAE/kg OP)

3. Results and Discussion

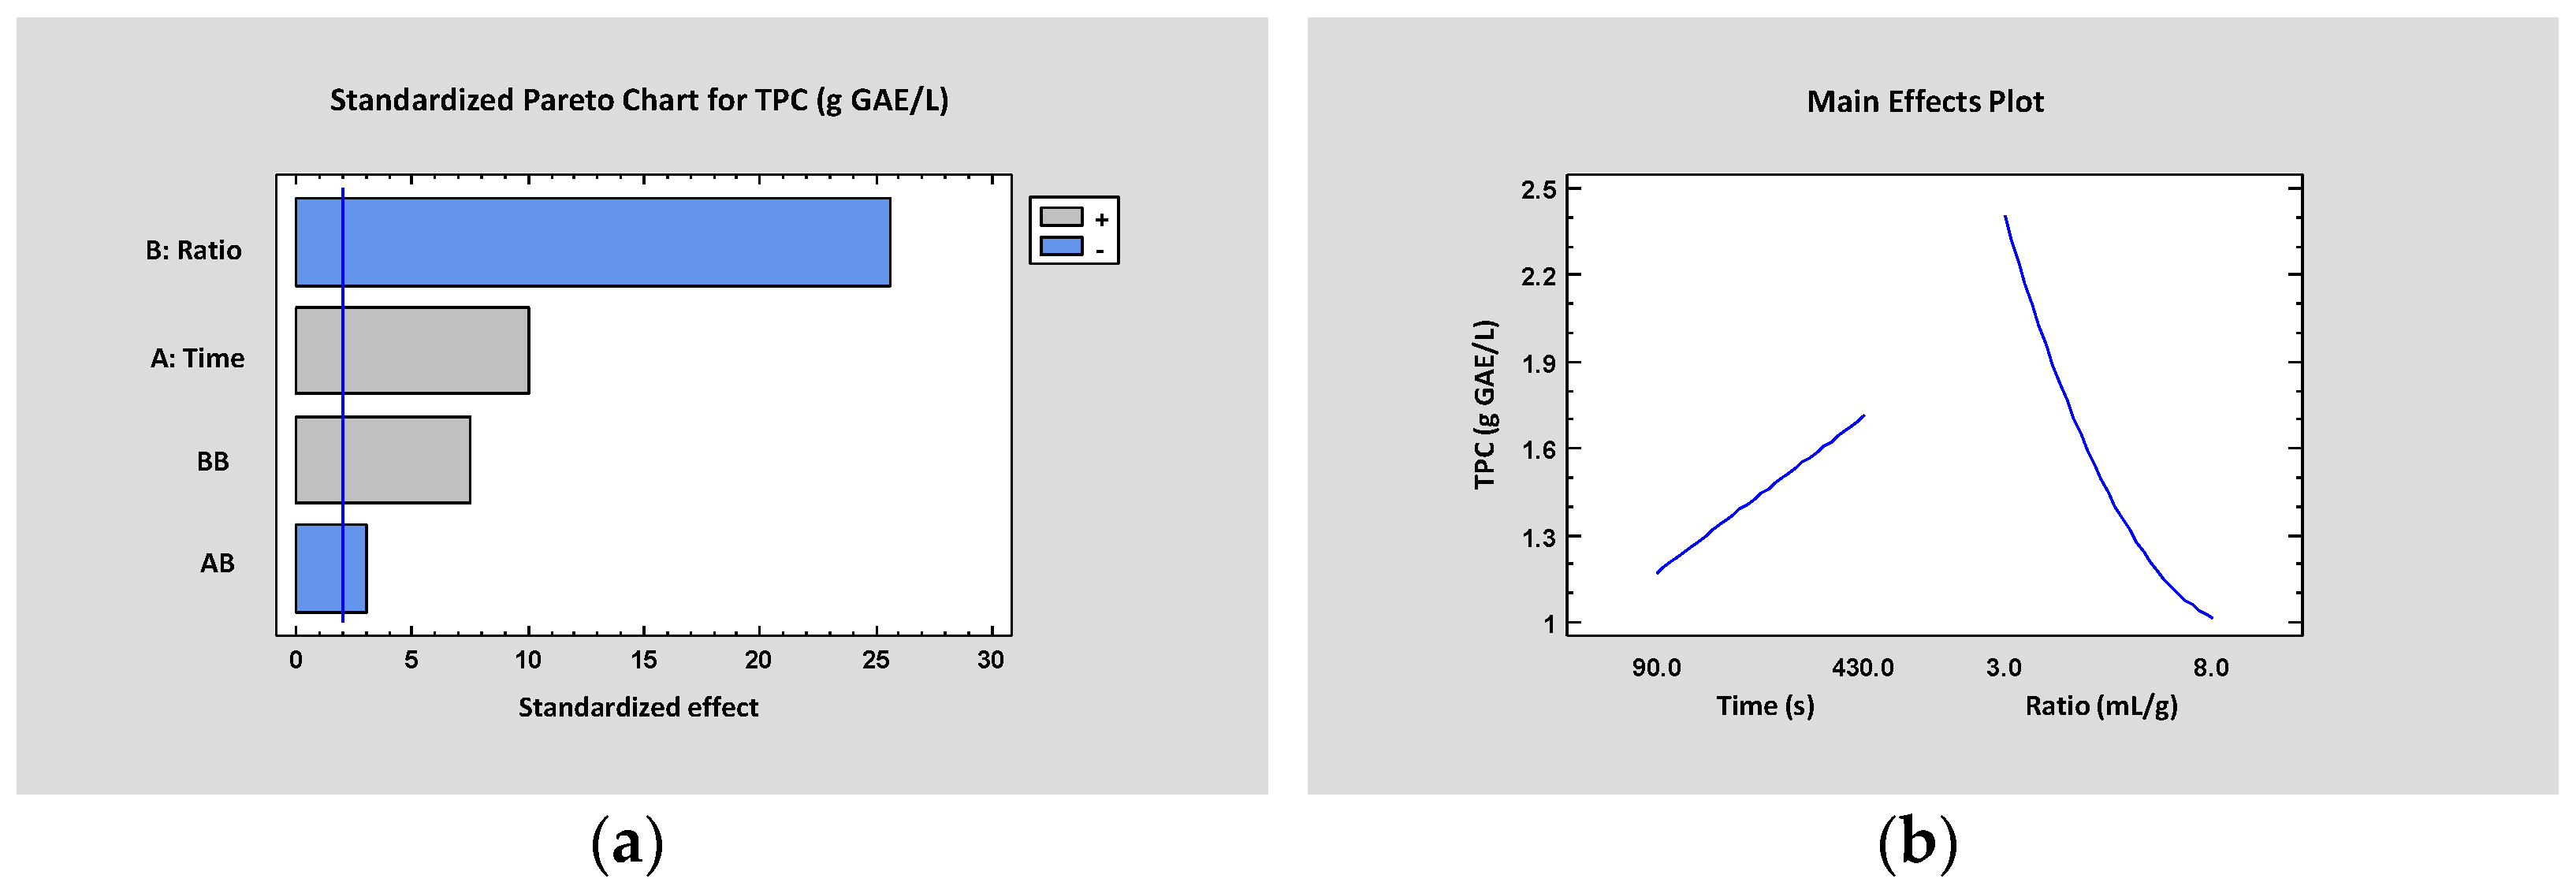
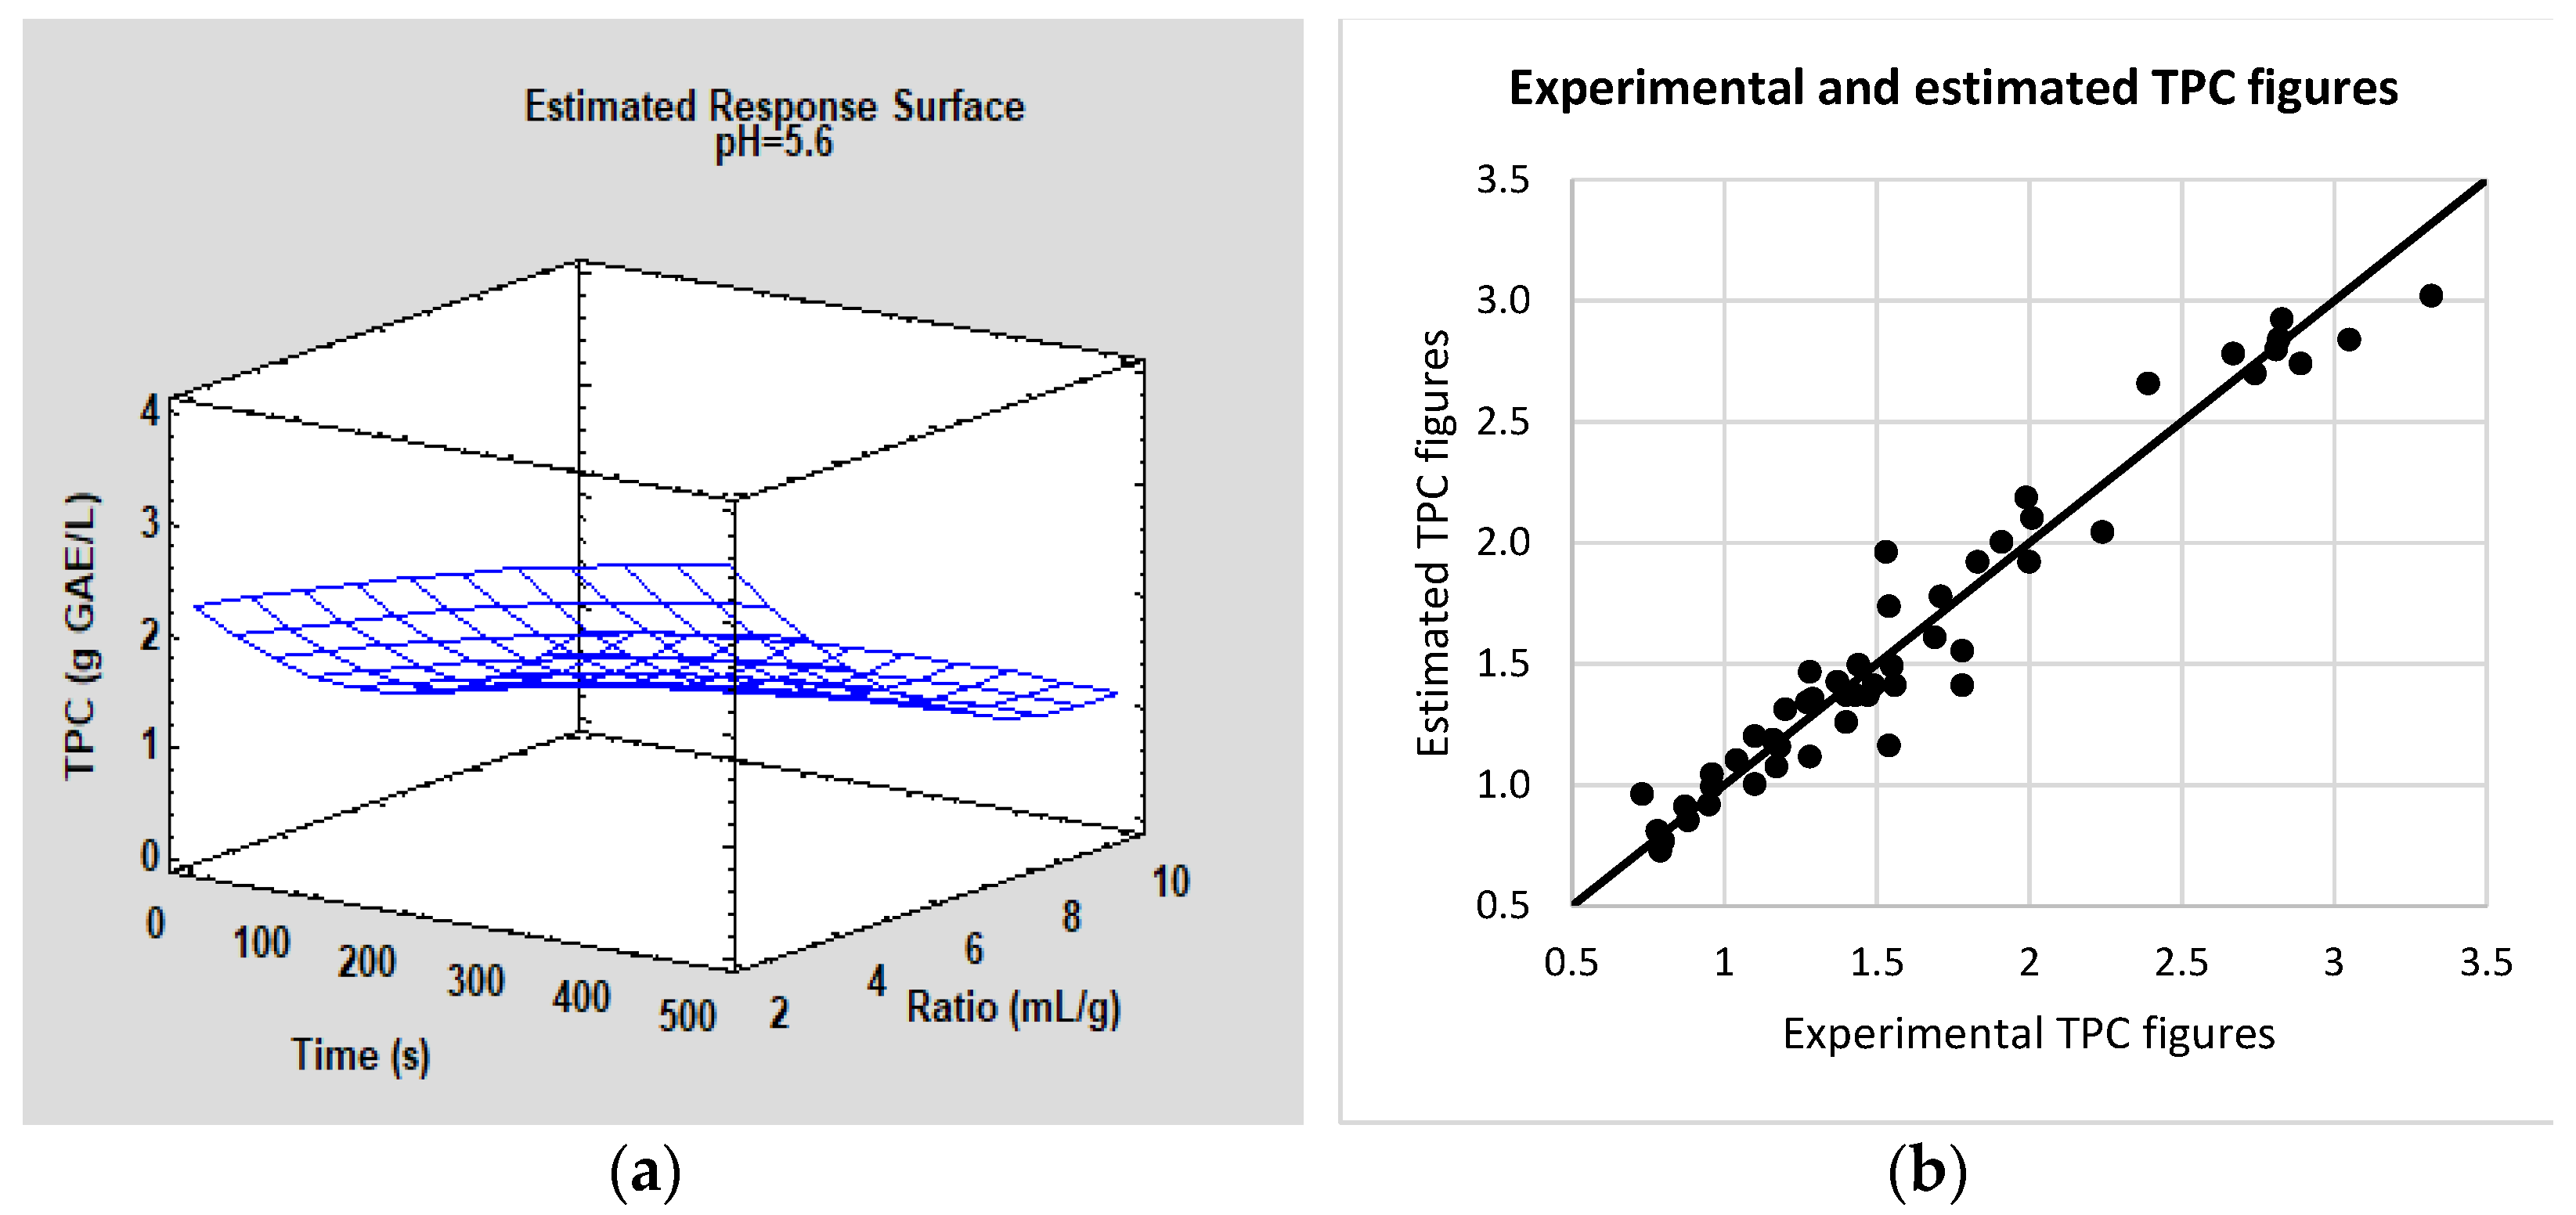
3.1. Laboratory-Scale: Batch

Table 1. shows the TPC measured in the extracts obtained by UAE at laboratory scale. Figures ranged from 0.9 to 3.1 g GAE/L, corresponding to 1.7 to 6.1 g GAE/kg OP. These figures agree with those reported by De Bruno et al.: 0.5–1.7 g/kg OP [17] when extracting polyphenol compounds by using a 1:1 water-ethanol mixture. Lafka et al. [18] reported TPC figures from 6 to 16 g of caffeic acid/kg dry extract after 25 h of extraction using different solvents such as ethyl acetate, propanol, ethanol, and methanol. Suarez et al. [19] reported a TPC of 233 g/kg g of dry extract after a double liquid extraction first using 20:80 water-ethanol mixture, followed by ethyl acetate.
The ANOVA (Table 2) partitions the variability in TPC (g GAE/L) into separate pieces for each of the effects attributed to the factors and their interaction.
The variables Time [s] and Ratio [mL/g] are significant (p-value <0.05) within the ultrasound extraction process, as well as the quadratic term BB (Ratio) and the interaction between Time and Ratio. On the other hand, the variable pH does not appear as significant, it did not significantly affect (p < 0.05) the extraction yield of polyphenols from the olive pomace sample. Lafka et al. [18] suggested that the solubilization of phenolic compounds in the organic phase is increased under acid conditions. They observed higher polyphenol content in the extracts obtained at pH 2 (lower than the one considered in this study) compared to those obtained under neutral conditions (pH 6).
The effect of Time [s] and Ratio [mL/g] together with their interactions is shown in Figure 1 through the standardized Pareto chart. The Pareto chart shows the absolute values of the standardized effects, from the most significant effect to the least effect factor in the process. Standardized effects are statistics that test the hypothesis where the effect is zero. The graph also draws a reference line to indicate which effects are statistically significant.
Figure 1a shows that the Ratio variable is the most significant one in the UAE, followed by the Time variable. Ratio is a variable with a negative effect since when its value increases, the extraction is lower. Instead, the variable Time has a positive effect, indicating that the longer the process, the higher the extraction of polyphenols. In Figure 1b we see graphically the effects on the extraction of polyphenols. As has already been said, by decreasing the ratio we obtain a much higher total amount of polyphenols than in the experiments carried out at a higher ratio. This may be due to the concentration of antioxidant compounds since if we experiment with a higher ratio, the mass of residue is smaller and, therefore, the concentration of polyphenols will be reduced. Thus, it is not the consequence of the quantity of phenols, but rather of the dilution in which the sample to be treated is found.
Considering the results obtained by the ANOVA test and the effects of the variables on the process, the design of experiments using the response surface predicted the optimal conditions: Time: 490 s; Ratio: 2.1; pH: 5.6 to achieve maximum extraction of 3.42 g GAE/L (Figure 2a) The R-squared statistic obtained from the model indicates that 94.99% of the variability obtained is determined by the variables of Time and Ratio, therefore, there was not any high intrinsic variability from the olive pomace sample (5%). In Figure 2b, representation of the experimental and the estimated TPC figures is shown. A good correlation between both groups of data can be observed being the mean absolute error (MAE) of 0.099.
To validate the optimal conditions provided by the model, three replications of the experiment at such conditions were carried out. Under these conditions, experimental TPC obtained was of 3.64 ± 0.17 g GAE/L and the temperature increment was of 56 ± 2 °C. The results confirmed that these were the conditions in which a higher polyphenol content was obtained. For comparison purposes, an extraction test was carried out without ultrasound assistance, but applying stirring and heating up the mixture to a final temperature of 76 °C under the optimal conditions observed. The extraction yield obtained was 0.63 g GAE/L, 83% lower than the one observed in the UAE.
Regarding the acoustic parameters, the acoustic amplitude was fixed for all tests (46 µm). The acoustic power varied from 180 W at the beginning of the extraction down to 46 W at the end of the extraction (490 s), which means a 75% loss. Then, the acoustic intensity varied from 33.3 to 8.5 W/cm2. When the temperature rises, the viscosity drops and then the sonotrode needs less power to oscillate at the selected amplitude. The total acoustic energy applied in this test was of 17 Wh.

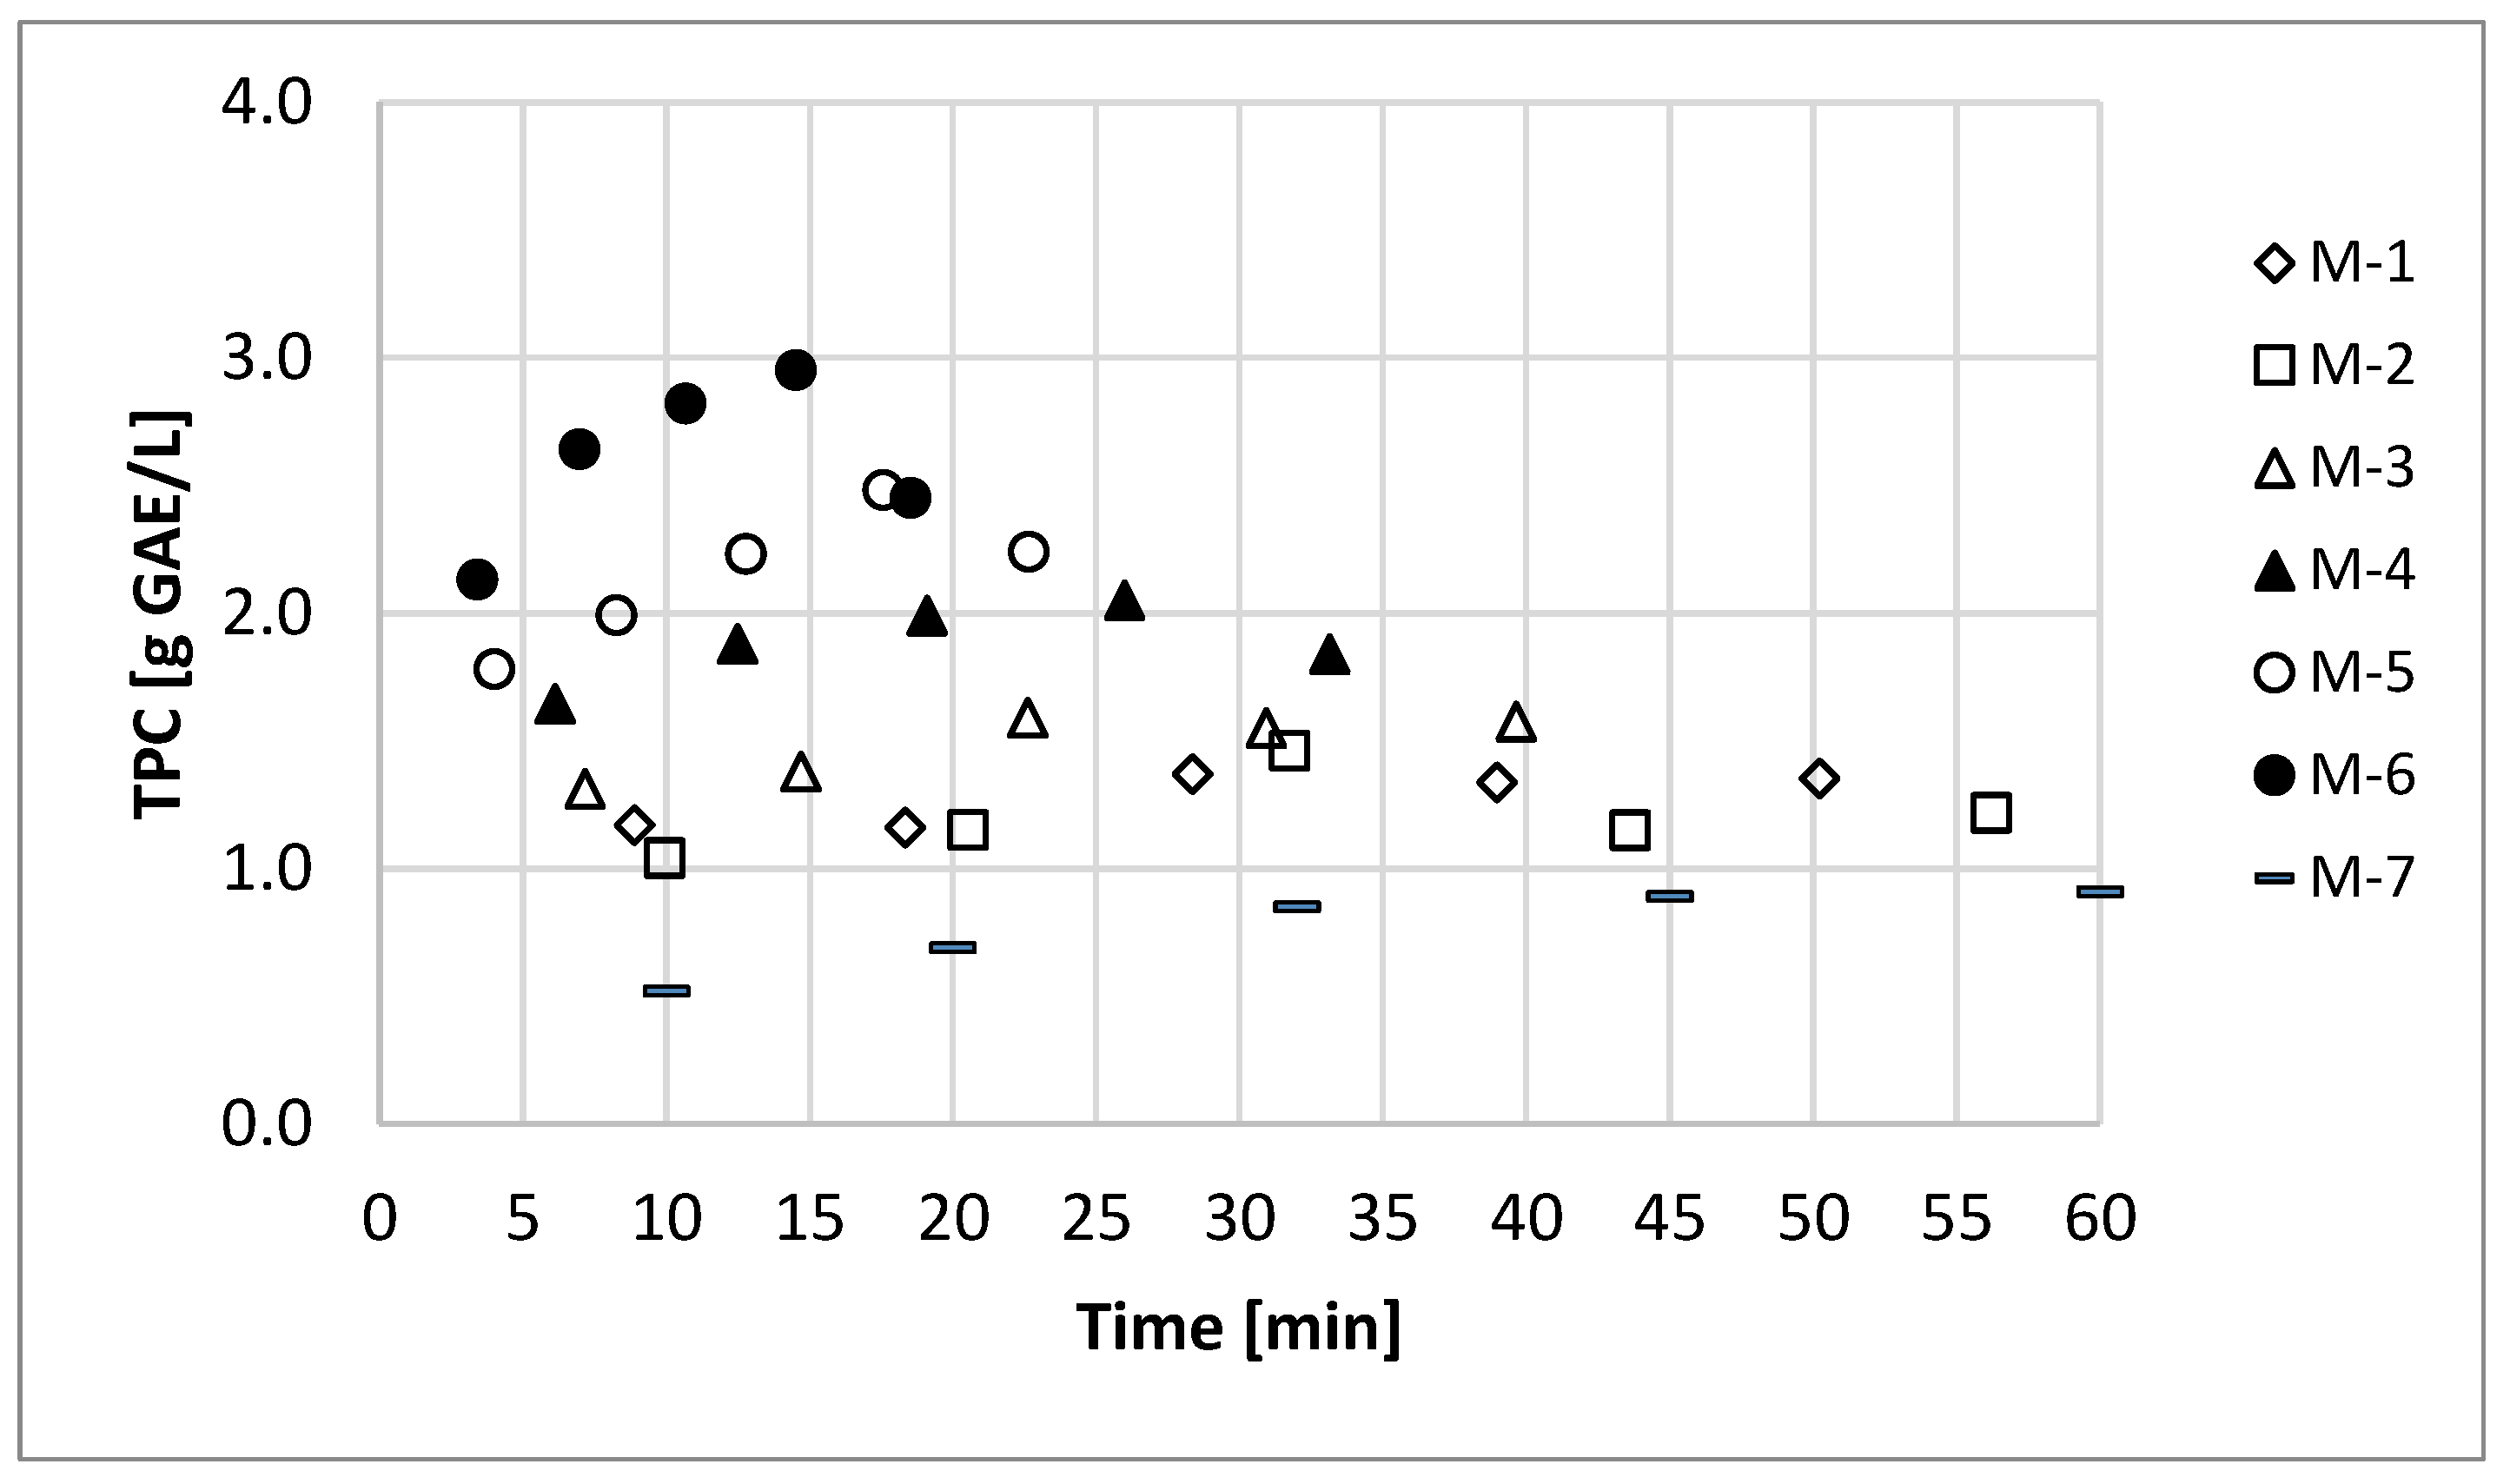
3.2. Medium-Scale: Continuous

The information obtained in the laboratory (3.1) was used for the UAE at medium-scale. In this sense, 750 g of OP was mixed with 1.5 L of water (2.2 kg mixture). The initial pH of the mixture was of 4.1, and it was not adjusted. Several combinations of probe and booster (constellations) were tested in order to study the effect of the acoustic amplitude on the extraction yield. Besides the effect of the pressurization of the system, up to 1.0 barg was considered using a V50SA industrial compressor (Cevik, Alcalá de Henares, Spain). Chilled water (6 °C) was used as cooling mechanism in order to slow down the heating of the mixture during the UAE. Tests were extended until 187 Wh of energy were applied, corresponding to 11 times the energy used in the optimal laboratory-scale test.
In Table 3 a list of the tests carried out is given. During the extraction, 6 samples were taken in order to measure the TPC (g GAE/L) kinetics. As control, a conventional extraction without acoustic assistance was carried out, in this case, the mixture was pumped through the system during 60 min.
The acoustic energy that reached the samples is transformed into heat. Although all tests started at room temperature (20 ± 1 °C) the heating of the system was unavoidable. The increment of the temperature was proportional to the acoustic power delivered. Pressurized UAE exhibited the higher increments of temperature (ΔT) of 31 to 37 °C while non pressurized tests exhibited smaller temperature increments (ΔT) of 14 to 33 °C. The extraction of polyphenols is highly affected by the temperature. Higher temperatures favored the solubility of polyphenols while improving the mass transfer and increasing the diffusivity into the solvent [10]. However, during the UAE, the acoustic power (W) and its effects are favored by low temperatures [11], therefore the temperature control is considered as double improvement for efficiency of the extraction and stability of the polyphenols extracted, however not for the extraction yield.
Figure 3 shows the acoustic power delivered to the mixture during each test (M-1: M-6). For all tests, a loss of the acoustic power was evident during the UAE. The average power loss was of 18% in the non-pressurized tests, but it was only of 12% in the pressurized ones. Compared to the laboratory-scale tests (75% power loss), the UAE at medium-scale seems to be more acoustically efficient thanks to the use of chilling water to cool down the mixture during the extraction. Considering the fluctuations of the acoustic power, the extraction time varied from 19 min (M-6) to 56 min (M-1).
The effect of the pressure on the UAE was positive in terms of higher extraction yield and faster extraction rates. Regardless the acoustic amplitude, the pressure increment from 0 to 1.0 barg promoted and improvement in the TPC extraction yield of 27% at 57 µm (M-3 and M-4) and 21% at 43 µm (M-5 and M-6). This increment could be related to an 18–19% increment of the average acoustic power. The higher the external pressure, the greater the acoustic pressure is required to induce cavitation; therefore, the intensity of the cavitation bubbles leads to an enhancement of the acoustic effects [11].
Figure 4 showed the extraction kinetic of all tests carried out. The conventional extraction (M-7) exhibited the lowest extraction yields, being the highest TPC figure of 1.0 g GAE/L after 60 min of extraction. From all UAE tests, the higher the acoustic power delivered promoted the higher TPC figure. Test M-6 exhibited the highest extraction yield, being of 2.95 g GAE/L, and it was reached after 15 min of extraction (56 °C), while test M-1, exhibited the lowest yield, being of 1.37 g GAE/L after 31 min of extraction (34 °C).
Regarding the acoustic amplitude, the highest extraction yields were observed at 43 µm; and from both tests carried out at this amplitude the pressurized one exhibited a 16% higher extraction yield in shorter time due to a higher power was obtained (632 ± 46 W).

3.3. Pilot-Scale: Continuous

Once the medium-scale tests concluded (Section 3.2), the objective in the pilot-scale tests was to maintain the extraction yield while enlarging the scale and keeping extraction time short, and reducing the energy consumption by the application of power ultrasound.
The pilot tests were carried out at Fraunhofer Institute for Process Engineering and Packaging IVV (Freising, Germany). First, 70 L of distilled water were added into a jacketed tank followed by the addition of 50 kg of OP. Due to the availability of more powerful equipment (stirrer and pump) the ratio H2O/OP was the reduced from 2 to 1.4, which allowed us a more concentrated mixture. The stirrer and the heating system were turned on. Once the mixture was homogenized (5 min), the pH was adjusted to 7.0 using a 10% NaOH solution. After this, the pump and the US device were turned on and the trial started, with the initial temperature of the mixture at 50 ± 2 °C. UAE preliminary tests (results not shown) were carried out for 3 h, and a total 2000 Wh of acoustic energy was applied. The highest TPC figures were observed after 1000 Wh were applied. Therefore, the pilot-scale tests described in this work were extended until 1200 Wh of energy were applied. Table 4 collects the list of tests carried out, the variables tested and the responses observed. During the extraction, 11 samples were taken in order to measure the TPC (g GAE/L) kinetics. As control, a conventional extraction without acoustic assistance was carried out, in this case, the mixture was pumped through the system during 120 min.
Tests were paired in order to compare the effect of different acoustic parameters on the extraction yield. The effect of the extraction temperature was studied by comparing test P-3 (80 °C) and test P-5 (55 °C). The intensity-dependence was evaluated by comparing Tests P-1 with P-2, and P-3 with P-4. The amplitude-dependence was evaluated by comparing Test P-2 and P-5.
Figure 5 depicts the evolution of the acoustic power delivered to the mixture during the extraction at pilot-scale.
In general, all UAE tests exhibited higher extraction yields than observed in the conventional extraction (1.3 g GAE/L). As expected, pressurized tests (P-2 and P-4) exhibited higher acoustic power that ranged from 1126 to 1673 W, while the non-pressurized tests (P-1, P-3, and P-5) exhibited lower acoustic powers that ranged from 660 to 1254 W. At this scale, the increment of the pressure from 0 to 1.0 barg doubled the acoustic power delivered to the system. In all tests, a power loss was observed. This fact could be explained by the increment of the temperature during the extraction, which provoked a reduction in the viscosity of the sample, therefore the sonotrode needed less power to oscillate at the set amplitude and frequency. In pressurized tests (P-2 and P-4), after a short period of adaptation (pressure was slowly increased), until the maximum acoustic power is achieved, a loss of power is observed, but only of 15%. Since there were different levels of acoustic power delivered to the mixture, the duration of the extraction process to obtain maximum yield varied from test to test. In general, the pressurized tests (P-2 and P-5) were 48% shorter than the non-pressurized ones.
The initial mixture temperature ranged between 50 and 55 °C and it raised up to 80 ± 2 °C (ΔT: 23–33 °C) except for test P-5 which was kept at 55 °C (ΔT: 5 °C). As expected, Test P-5 exhibited a higher acoustic power (872 ± 170 W) during the extraction compared to the one observed in test P-3 carried out at 80 °C (755 ± 110); however, the extraction yield was 17% lower. The effect of the extraction temperature on the extraction yield is evident in Table 4. For all tests (P-1 to P-5) the higher extraction yield was observed at the higher temperatures, close to 80 °C.
The acoustic amplitude affected the extraction yield. UAE tests carried out at 30 µm exhibited higher extraction yields than those observed at 42 µm for both pressure levels considered. As it was expected, the pressurization of the system promoted a higher extraction yield in the extract for both amplitudes considered.
By using different constellations (sonotrode-booster) together with the pressurization of the system, it was possible to obtain different acoustic intensities (W/cm2). The acoustic intensity observed was the result not only of the acoustic power delivered but also of the surface area of the sonotrode used (cm2). The acoustic intensity varied as the acoustic power did. The highest acoustic intensities corresponded to the pressurized tests; they were 58 ± 6 and 44 ± 5 W/cm2 for tests P-2 and P-4, respectively, while the lowest figure was observed in test P-1 and P-3 with intensities of 23 ± 4 and 30 ± 2 W/cm2.
The highest extraction yield was observed in test P-4 (44 ± 5 W/cm2), pressurized (1.0 barg) and at the lowest acoustic amplitude (30 µm). The acoustic intensity falls further as the distance from the transducers increase, and it is a function of the density and the viscosity of the sample being treated [15]. High acoustic intensities will provoke a dramatic increment in the temperature of the sample, but also will diminish the working life of the sonotrode due to erosion caused by the rapid and turbulent movement of liquids around the sonotrode surface. Knowing the right acoustic intensity constitutes a foundation for upscaling or downscaling the UAE system [20], however, this parameter might be bonded to a specific acoustic amplitude (µm).

4. Conclusions

Ultrasound-assisted extraction of polyphenols from olive pomace has been studied in different scenarios, from the laboratory scale (batch) to pilot-scale (continuous), considering several technological and acoustic variables.
The results confirmed that ultrasound assistance improved the polyphenol extraction yield when compared to un-assisted aqueous extraction, achieving up to a 58% increase in yield (observed at pilot-scale) and up to a 48% reduction in the extraction time (medium-scale). The effect of the ultrasound-assistance is affected by each process variable to a different extent, and by the combination of them.
The extraction temperature affected the extraction yield due to an improved solubility of the polyphenols, leading to a better diffusion into the solvent. However, an adverse effect of high temperatures was observed on the acoustic power delivered on the mixture. This drop of power reduced the efficiency of the ultrasound application and consequently enlarged the extraction duration. The drop of acoustic power could be compensated by the pressurization of the system. Pressurized tests (1.0 barg) at medium and pilot-scale exhibited a higher extraction yield than non-pressurized ones. However, this increment should be studied carefully, and it will be beneficial for the extraction only if the acoustic intensity remains close to the optimal one.
The acoustic intensity (W/cm2) exerts an important effect on the extraction yield, and should be tailored to each process scale, and its effect is linked to the acoustic amplitude used in the extraction.
In order to make the ultrasound-assisted extraction of natural compounds from agri-food by-products the appropriate, next steps have been identified: (i) improve the understanding of the process as a whole and further optimize ultrasound application, and (ii) push the technology closer to commercial applications.
The application of this technology at industrial scale to evaluate if the improvement of the extraction caused by the application of ultrasound is still important when other operations like centrifugation, ultrafiltration, and reverse osmosis are included in the system, and to evaluate its techno-economic feasibility.

Author Contributions

Conceptualization, L.R.-T.; methodology, Ó.R. and S.B.; validation, Ó.R. and S.B.; investigation, Ó.R. and S.B.; resources, L.R.-T. and A.S.; writing—original draft preparation, Ó.R.; writing—review and editing, A.S. and L.R.-T. All authors have read and agreed to the published version of the manuscript.

Funding

This research is part of the AGRIMAX project that has received funding from the Bio Based Industries Joint Undertaking (JU) under the European Union’s Horizon 2020 research and innovation programme under grant agreement No. 720719. The JU receives support from the European Union’s Horizon 2020 research and innovation programme and the Bio Based Industries Consortium.

Data Availability Statement

Not applicable.

Conflicts of Interest

The authors declare no conflict of interest.

References

  1. Roselló-Soto, E.; Koubaa, M.; Moubarik, A.; Lopes, R.P.; Saraiva, J.A.; Boussetta, N.; Grimi, N.; Barba, F.J. Emerging opportunities for the effective valorization of wastes and by-products generated during olive oil production process: Non-conventional methods for the recovery of high-added value compounds. Trends Food Sci. Technol. 2015, 45, 296–310. [Google Scholar] [CrossRef]
  2. Rossi, R. The EU olive and olive oil sector. Eur. Parliam. Res. Serv. 2017, 608.690, 1–12. [Google Scholar]
  3. Şahin, S.; Şamlı, R. Optimization of olive leaf extract obtained by ultrasound-assisted extraction with response surface methodology. Ultrason. Sonochem. 2013, 20, 595–602. [Google Scholar] [CrossRef] [PubMed]
  4. Skaltsounis, A.-L.; Argyropoulou, A.; Aligiannis, N.; Xynos, N. Recovery of High Added Value Compounds from Olive Tree Products and Olive Processing Byproducts. Olive Olive Oil Bioact. Const. 2015, 333–356. [Google Scholar] [CrossRef]
  5. Albahari, P.; Jug, M.; Radić, K.; Jurmanović, S.; Brnčić, M.; Brnčić, S.R.; Čepo, D.V. Characterization of olive pomace extract obtained by cyclodextrin-enhanced pulsed ultrasound assisted extraction. LWT 2018, 92, 22–31. [Google Scholar] [CrossRef]
  6. Čepo, D.V.; Radić, K.; Jurmanović, S.; Jug, M.; Rajković, M.G.; Pedisić, S.; Moslavac, T.; Albahari, P. Valorization of Olive Pomace-Based Nutraceuticals as Antioxidants in Chemical, Food, and Biological Models. Molecules 2018, 23, 2070. [Google Scholar] [CrossRef] [PubMed] [Green Version]
  7. Batuecas, E.; Tommasi, T.; Battista, F.; Negro, V.; Sonetti, G.; Viotti, P.; Fino, D.; Mancini, G. Life Cycle Assessment of waste disposal from olive oil production: Anaerobic digestion and conventional disposal on soil. J. Environ. Manag. 2019, 237, 94–102. [Google Scholar] [CrossRef] [PubMed]
  8. European Commission. DIRECTIVE 2008/98/EC OF The European Parliament and of the Council of 19 November 2008 on Waste and Repealing Certain Directives (Text with EEA Relevance). 2008. Available online: https://eur-lex.europa.eu/legal-content/EN/TXT/?uri=CELEX%3A32008L0098 (accessed on 29 August 2022).
  9. Ahmad-Qasem, M.H.; Cánovas, J.; Barrajón-Catalán, E.; Micol, V.; Cárcel, J.A.; García-Pérez, J.V. Kinetic and compositional study of phenolic extraction from olive leaves (var. Serrana) by using power ultrasound. Innov. Food Sci. Emerg. Technol. 2013, 17, 120–129. [Google Scholar] [CrossRef]
  10. Pradal, D.; Vauchel, P.; Decossin, S.; Dhulster, P.; Dimitrov, K. Kinetics of ultrasound-assisted extraction of antioxidant polyphenols from food by-products: Extraction and energy consumption optimization. Ultrason. Sonochem. 2016, 32, 137–146. [Google Scholar] [CrossRef] [PubMed]
  11. Chemat, F.; Rombaut, N.; Sicaire, A.-G.; Meullemiestre, A.; Fabiano-Tixier, A.-S.; Abert-Vian, M. Ultrasound assisted extraction of food and natural products. Mechanisms, techniques, combinations, protocols and applications. A review. Ultrason. Sonochem. 2017, 34, 540–560. [Google Scholar] [CrossRef] [PubMed]
  12. Medina-Torres, N.; Ayora-Talavera, T.; Espinosa-Andrews, H.; Sánchez-Contreras, A.; Pacheco, N. Ultrasound Assisted Extraction for the Recovery of Phenolic Compounds from Vegetable Sources. Agronomy 2017, 7, 47. [Google Scholar] [CrossRef]
  13. Patist, A.; Bates, D. Ultrasonic innovations in the food industry: From the laboratory to commercial production. Innov. Food Sci. Emerg. Technol. 2008, 9, 147–154. [Google Scholar] [CrossRef]
  14. Paniwnyk, L.; Alarcon-Rojo, A.; Rodriguez-Figueroa, J.C.; Toma, M. The Use of Ultrasound as an Enhancement Aid to Food Extraction; Elsevier Inc.: London, UK, 2017; pp. 399–440. [Google Scholar] [CrossRef]
  15. Kentish, S.E. Engineering Principles of Ultrasound Technology. In Ultrasound: Advances in Food Processing and Preservation; Elsevier Inc.: London, UK, 2017; pp. 1–13. [Google Scholar] [CrossRef]
  16. Soria, A.C.; Villamiel, M. Effect of ultrasound on the technological properties and bioactivity of food: A review. Trends Food Sci. Technol. 2010, 21, 323–331. [Google Scholar] [CrossRef]
  17. De Bruno, A.; Romeo, R.; Fedele, F.L.; Sicari, A.; Piscopo, A.; Poiana, M. Antioxidant activity shown by olive pomace extracts. J. Environ. Sci. Health Part B 2018, 53, 526–533. [Google Scholar] [CrossRef] [PubMed]
  18. Lafka, T.-I.; Lazou, A.E.; Sinanoglou, V.J.; Lazos, E.S. Phenolic and antioxidant potential of olive oil mill wastes. Food Chem. 2011, 125, 92–98. [Google Scholar] [CrossRef]
  19. Suárez, M.; Romero, M.-P.; Ramo, T.; Macià, A.; Motilva, M.-J. Methods for Preparing Phenolic Extracts from Olive Cake for Potential Application as Food Antioxidants. J. Agric. Food Chem. 2009, 57, 1463–1472. [Google Scholar] [CrossRef] [PubMed]
  20. Rutkowska, M.; Namieśnik, J.; Konieczka, P. Ultrasound-Assisted Extraction. Appl. Green Solvents Sep. Process 2017, 301–324. [Google Scholar] [CrossRef]
Figure 1. Standardized Pareto Chart (a) and Main effects Plot (b) for TPC (g GAE/L).
Processes 10 02481 g001
Figure 2. Estimated response surface at Optimal conditions (a). Representation of experimental and estimated TPC figures (b).
Processes 10 02481 g002
Figure 3. Acoustic power evolution during the UAE of polyphenols at medium scale. Pressurized tests (full), non-pressurized (empty).
Processes 10 02481 g003
Figure 4. Extraction kinetics at medium scale. Pressurized tests (full), non-pressurized (empty).
Processes 10 02481 g004
Figure 5. Acoustic power (W) evolution during the UAE at pilot-scale. Pressurized tests (full), non-pressurized (empty).
Processes 10 02481 g005
Table 1. Complete design of experiments for the UAE of polyphenols from OP at Laboratory scale.
TestFactorsResponse
Time
[s]
Ratio
[mL/g]
pHTPC
[g GAE/L]
TPC
[g GAE/kg OP]
ΔT
[°C]
L-14905.55.01.69 ± 0.1533.1 ± 3.056 ± 3
L-2305.55.01.07 ± 0.1021.1 ± 2.03 ± 1
L-32605.56.91.45 ± 0.2128.6 ± 4.141 ± 2
L-42605.55.01.52 ± 0.0530.0 ± 1.044 ± 3
L-5903.03.51.85 ± 0.2719.9 ± 2.911 ± 1
L-64308.06.41.18 ± 0.0933.8 ± 2.661 ± 1
L-7908.06.40.87 ± 0.0924.9 ± 2.68 ± 1
L-82605.53.01.31 ± 0.1225.8 ± 2.442 ± 4
L-94303.03.52.65 ± 0.2328.5 ± 2.552 ± 2
L-104303.06.42.80 ± 0.1130.1 ± 1.266 ± 3
L-112605.55.01.66 ± 0.2032.7 ± 3.941 ± 2
L-124308.03.51.28 ± 0.1236.7 ± 3.462 ± 3
L-132608.95.00.91 ± 0.1629.0 ± 5.150 ± 4
L-142602.15.03.06 ± 0.2623.0 ± 2.023 ± 2
L-15903.06.92.05 ± 0.1722.0 ± 1.812 ± 1
L-162605.55.01.48 ± 0.0829.2 ± 1.642 ± 1
L-17908.03.50.82 ± 0.0423.5 ± 1.114 ± 3
Table 2. Analysis of variance for TPC (g GAE/L), significant factors are highlighted in bold.
SourceSum of SquaresDfMean Squarep-Value
A:Time2.5812.58<0.0001
B:Ratio16.85116.85<0.0001
C:pH0.0610.060.1016
AA0.0710.070.0712
AB0.2310.230.0023
AC0.0210.020.3953
BB1.4311.43<0.0001
BC0.0610.060.1086
CC0.0810.080.0599
Table 3. Process parameters and responses observed at Medium-scale tests.
TestVariablesResponses
Amplitude [µm]Pressure [barg]Power
[W]
Intensity [W/cm2]ΔT [°C]TPC
[g GAE/L]
TPC
[g GAE/kg OP]
M-1410.0217 ± 1457.1161.5 ± 0.210.8 ± 1.4
M-2460.0235 ± 1561.8141.4 ± 0.210.0 ± 1.5
M-3570.0288 ± 2875.7251.6 ± 0.111.5 ± 0.7
M-4571.0343 ± 2990.3312.1 ± 0.215.1 ± 1.4
M-5430.0528 ± 5958.7332.5 ± 0.117.9 ± 0.7
M-6431.0632 ± 4670.2 372.9 ± 0.120.8 ± 0.8
M-7Conventional00421.1 ± 0.17.9 ± 0.6
Table 4. Process parameters and responses observed at Pilot-scale tests.
TestVariablesResponses
Amplitude [µm]Pressure [barg]Power [W]Intensity [W/cm2]ΔT [°C]TPC
[g GAE/L]
TPC
[g GAE/kg OP]
P-1420.0685 ± 19730 ± 2332.2 ± 0.311.0 ± 1.5
P-2421.01448 ± 14058 ± 6282.7 ± 0.213.5 ± 1.0
P-3300.0755 ± 12023 ± 4302.4 ± 0.112.0 ± 0.5
P-4301.01464 ± 15144 ± 5313.1 ± 0.115.6 ± 0.4
P-5300.0872 ± 17026 ± 552.0 ± 0.210.0 ± 1.0
P-6Conventional00311.3 ± 0.36.5 ± 1.5
Publisher’s Note: MDPI stays neutral with regard to jurisdictional claims in published maps and institutional affiliations.

