Article

Numerical Study of the Energy Flow Characteristics of Multi-Stage Pump as Turbines

1
Key Laboratory of Fluid Transmission Technology of Zhejiang Province, Zhejiang Sci-Tech University, Hangzhou 310018, China
2
College of Mechanical and Electronic Engineering, Jiangxi College of Applied Technology, Ganzhou 341000, China
3
Key Laboratory of Ionic Rare Earth Resources and Environment, Ministry of Natural Resources, Ganzhou 341000, China
*
Author to whom correspondence should be addressed.
Processes 2022, 10(12), 2488; https://doi.org/10.3390/pr10122488
Submission received: 21 October 2022 / Revised: 9 November 2022 / Accepted: 18 November 2022 / Published: 23 November 2022
(This article belongs to the Section Energy Systems)

Abstract

:
Multi-stage pump as turbine (PAT) has a wider range of heads and application intervals compared to single-stage PAT. In our research, we have conducted experimental and numerical simulation studies on this issue. In this paper, based on experimental research, numerical simulation is applied to calculate the multi-stage PAT flow field. The flow characteristics of multi-stage PAT under different working conditions are studied using the entropy production theory. Finally, the Pearson correlation coefficient is used to evaluate the relationship between the hydraulic loss and entropy production of the impellers and guide vanes. The entropy production theory is used to determine the location where the multi-stage PAT energy loss occurs compared with the traditional pressure drop assessment method. The results show that the trend of the numerical simulation results is consistent with the experimental results. The energy loss in the multi-stage PAT is calculated combined with the impeller and guide vane which accounts for 69.1–73% of the total energy loss under all flow conditions. The total entropy production rate of each component under design flow conditions is listed in decreasing order: impeller, guide vane, front and back chamber, a balance disk, and inlet and outlet volute. The first stage component has a larger energy loss compared with the rest of the stages. The magnitude of energy loss is closely related to physical quantities such as flow field velocity and skin friction coefficient. Furthermore, the distribution of streamlines and vortex cores at the impellers reflects that flow domain stability increases from the first stage impeller to the fifth stage impeller. The correlation between entropy production and hydraulic loss was evaluated by the Pearson correlation coefficient. Therefore, using the entropy production theory can effectively identify the characteristics of the flow field and the location of energy losses. It provides a reference for the targeted optimization of multi-stage PAT.

1. Introduction

With the rapid development of industrial processes, energy consumption is increasing, and problems such as energy shortage and environmental pollution are becoming more serious. Therefore, studying high-pressure liquid energy recovery technology is important to save energy, reduce pollution and develop hydraulic machinery design theory.
Pumps as Turbine (PAT) is an important form of hydraulic turbine, which is widely used in the field of liquid energy recovery. At present, scholars in China and overseas have completed a lot of research on pumps running as turbines and proposed a variety of methods to predict the performance of pumps as turbines based on pump parameters. However, most of these studies are based on single-stage pumps [1,2]. Research on multi-stage centrifugal pumps for turbulence is relatively little which is limited to theoretical analysis and numerical simulation to obtain the flow rate and head of the multi-stage centrifugal pump at the best efficiency point under turbine mode. There is also a scarcity of experimental data to validate. In the prediction of turbine performance. Shahram Derakhshan [3] predicted the performance of a reversing centrifugal pump and selected single-stage centrifugal pumps with different specific speeds (14 < ns < 56) for turbine operating tests to obtain the distribution of a series of dimensionless performance parameter curves for low specific speed centrifugal pumps and the trend of the ratio of the two operating conditions performance parameters at the best efficiency point. Williams [4] compared prediction methods for the centrifugal pump as a turbine. Si Huang et al. [5] used the impeller-volute matching principle to predict the performance of centrifugal pumps as a turbine. Mdee Ombeni John et al. [6] analyzed and evaluated the head and flow rate off-design characteristics based on the pump as turbine applications. Tao Wang, Ming Liu, Sun-Sheng Yang, and Guangtai Shi [7,8,9,10] derived the conversion equation between a turbine and pump conditions by conducting theoretical, experimental, and numerical studies on centrifugal pumps as turbines. Mosè Rossi [11,12] fitted a dimensionless prediction equation for off-design flow conditions based on data from 32 different pumps in the relevant literature, and subsequently its prediction of the optimal operating point and performance curve of the PAT using artificial neural networks. Ema Frosina [13] used a numerical calculation method to predict the performance of the turbine. Sun-Sheng Yang [14,15,16,17,18] et al. analyzed the effects of blade number, impeller trim, the radial clearance between the impeller tip and volute tongue spacer, impeller size, and blade thickness on turbine performance. In terms of the influence of structural parameters on the turbine. Senchun Miao et al. [19] and Wangtao et al. [7] analyzed the effect of blade profile on turbine performance. FengXia Shi [20] studied the effect of the number of guide vanes on turbine performance. J. Delgado, Shi Feng Xia, et al. [21,22] studied the effect of rotational speed on turbine performance. Maxime Binama et al. [23] analyzed the effect of the blade trailing edge position on the pressure field of PAT. Sanjay V. Jain, Wenguang Li, et al. [24,25] conducted experimental and simulation studies on the cavitation characteristics of PAT. In terms of the influence of the transport medium on the turbine performance. Wen-Guang Li, Sina Abazariyan, et al. [26,27] investigated the effect of fluid viscosity on turbine performance using numerical simulations and experiments, respectively, and M. Stefanizzi, Shi Fengxia, et al. [28,29] studied the effect on turbine performance under gas-containing conditions. In the area of hydraulic loss research. Hydraulic losses are correlated with dissipation and transportation effects in a domain. Researchers are in agreement that the total pressure difference between the inlet domain and outlet domain is equal to the hydraulic loss of the whole domain. However, there are varying opinions regarding the physical quantity that accurately captures the distribution of the hydraulic loss. Bo Qian [30] considered that hydraulic losses are equal to energy dissipation and evaluated the internal flow quality of a model centrifugal pump in terms of energy distribution and entropy production, using the Eulerian head to measure the energy of the fluid inside the impeller and a dissipation function to represent the distribution of dissipation effects in the domain. Wilhelm et al. [31] divided the hydraulic loss into the energy transported by viscosity, the energy transported by Reynolds stress, the energy dissipation through viscosity and the production of turbulent kinetic energy.
However, there are few studies on multi-stage PAT in China and overseas. We have conducted experimental and numerical simulation studies on this issue. This paper considers the beneficial characteristics of multi-stage PAT such as wider head range and applicability interval, investigating the multi-stage PAT. Meanwhile, considering the high complexity of multi-stage PAT, this paper analyzes the internal flow and energy loss of multi-stage PAT based on the experimental study and performs the correlation analysis of entropy production and hydraulic loss. The research results can provide a reference for the targeted optimization of multi-stage PAT.
This paper is organized as follows. The approach to correlate hydraulic losses and entropy production is demonstrated in Section 2 along with the application of the entropy production theory to the assessment of energy consumption. Section 3 describes the experimental scheme of the multi-stage PATs system and the geometrical parameters of the multi-stage pump. Section 4 describes the numerical model and numerical method for this study. Section 5 analyzes the results obtained from the numerical simulations by applying the entropy production theory as well as the correlation coefficients. Finally, Section 6 concludes this paper.

2. Methodology

2.1. Definition of Hydraulic Loss

In turbulent flow, the average kinetic energy equation is shown in Equation (1), which is further transformed into Equation (2) according to the definition of hydraulic energy, and the term on the right-hand side of Equation (2) can be regarded as a hydraulic loss.
D D t 1 2 U i U i = 1 ρ p U j x j + 2 v U i S i j x j u i u j ¯ U i x j 2 v S i j S i j + u i u j ¯ S i j
ρ x j p ρ g + U i U i 2 g g U i = 2 μ U i S i j x j I ρ u i u j ¯ U i x j I I 2 μ S i j S i j I I I + ρ u i u j ¯ S i j I V
where S i j is the shear strain rate tensor, μ is the viscosity.
In addition, the eddy viscosity μ t is chosen to evaluate the turbulence effect (Equation (3)). Thus, the final form of the hydraulic loss can be written as Equation (4), where the hydraulic loss can be considered as a combination of the dissipation effect and transportation effect. It should be noted that μ e f f in Equation (5) refers to the effective viscosity, calculated by viscosity μ and eddy viscosity μ t .
ρ u i u j ¯ = μ t U i x j + U j x i
ρ x j p ρ g + U i U i 2 g g U i = 2 μ eff U i S i j x j 2 μ eff S i j S i j =   TRNS     DIS  
μ e f f = μ + μ t

2.2. Entropy Production Theory

In order to quantify the effect of energy loss of each component in a multistage PATs system, entropy production theory was introduced [32,33,34,35,36,37]. The entropy transport equation can be expressed as:
ρ s t + u 1 s x 1 + u 2 s x 2 + u 3 s x 3 = q T + Φ T + Φ θ T 2
The Φ T and Φ θ T 2 in Equation (6) are produced by energy dissipation due to irreversible processes. Among these two dissipation source terms, the former is caused by viscous dissipation, while the latter is contributed by heat transfer over a finite temperature gradient. The specific expressions for Φ T and Φ θ T 2 can be formulated as:
Φ T = μ T 2 u 1 x 1 2 + u 2 x 2 2 + u 3 x 3 2 + u 1 x 2 + u 2 x 1 2 + u 1 x 3 + u 3 x 1 2 + u 2 x 3 + u 3 x 2 2
Φ Θ T 2 = λ T ¯ 2 T x 1 2 + T x 2 2 + T x 3 2
Since the multi-stage PAT operates at normal temperature, the temperature of the flowing medium does not change a lot. The energy dissipation generated by the temperature gradient is minimal compared to the viscous dissipation of the fluid. Therefore, the dissipation term Φ θ T 2 affected by the temperature gradient in Equation (6) is smeared out. At this point, Equation (6) is simplified as follows:
ρ s t + u 1 s x 1 + u 2 s x 2 + u 3 s x 3 = q T + Φ T
where s is the specific entropy, u 1 , u 2 and u 3 are the velocity components in the Cartesian coordinate system. x 1 , x 2 , and x 3 are the coordinate components. q is the heat flow density vector and T is the temperature.
According to the Reynolds time averaging method, the specific entropy s is decomposed into the time-averaging term s ¯ and the pulsation term s s = s ¯ + s . The velocity component u i is the time-averaging term u 1 ¯ and the pulsation term u i u i = u i ¯ + u i . So, Equation (9) may be transformed into Equation (10).
ρ s ¯ t + u 1 ¯ s ¯ x 1 + u 2 ¯ s ¯ x 2 + u 3 ¯ s ¯ x 3 = q T ¯ ρ u 1 s ¯ x 1 + u 2 s ¯ x 2 + u 3 s ¯ x 3 + Φ T ¯
The entropy production rate is divided into the time-averaged term S ˙ p r o , D ¯ , and the pulsation term S ˙ p r o , D , as shown:
S ˙ p r o , D = S ˙ p r o , D ¯ + S ˙ p r o , D
where S ˙ p r o , D ¯ is the specific entropy production rate driven by the time-averaged velocity gradient, i.e., direct entropy production, and S ˙ p r o , D is the specific entropy production rate induced by the pulsating velocity gradient, i.e., turbulent entropy production. Both are local entropy production rates and can be defined as follows.
S ˙ pro ,   D ¯ = μ T 2 u 1 ¯ x 1 2 + u 2 ¯ x 2 2 + u 3 ¯ x 3 2 + u 1 ¯ x 1 + u 2 ¯ x 2 2 + u 1 ¯ x 1 + u 3 ¯ x 3 2 + u 2 ¯ x 2 + u 3 ¯ x 3 2
S ˙ pro ,   D = μ T 2 u 1 x 1 2 ¯ + u 2 x 2 2 ¯ + u 3 x 3 2 ¯ + u 1 x 2 + u 2 x 1 2 ¯ + u 1 x 3 + u 3 x 1 2 ¯ + u 2 x 3 + u 3 x 2 2 ¯
where S ˙ p r o , D is not closed in the equilibrium equation, the entropy source due to turbulent dissipation is calculated using the method presented by Kock and Herwig et al. [38,39], which is given as follows.
S ˙ p r o , D = ρ ε T
It was found that the large velocity gradient near the wall provoked a strong wall effect due to the fluid viscosity. Moreover, the integration region for viscous and pulsating entropy production does not include the core region near the wall, and errors are produced during the calculation of the entropy production equation. According to Zhang and Duan [40,41], the wall entropy production can be written as Equation (15).
S ˙ p r o , W = τ v T
where S ˙ p r o , W , τ , and v represent the wall entropy production, the wall shear, and the velocity of the first mesh near the wall, respectively.
Based on the entropy production theory, the total entropy production rate S p r o can be expressed as
S p r o = V S ˙ p r o , D ¯ d V + V S ˙ p r o , D d V + A S ˙ p r o , W d A = S p r o , D ¯ + S p r o , D + S p r o , W

2.3. Pearson Correlation Coefficient and p-Value

With the help of numerical simulation, the value of entropy production and hydraulic loss can be exported as two sets of data. Pearson correlation coefficient and p-value are used to assess the correlation between hydraulic loss and entropy production. The equation of Pearson correlation is calculated by:
ρ = cov ( X , Y ) σ X σ Y = E X μ X Y μ Y σ X σ Y
where cov ( X , Y ) is the covariance of X , Y and σ X , σ Y are the standard deviations of X , Y , respectively.
The p-value reveals the probability that the sample difference is attributable to sampling error. p-value within 0.01 indicates a highly significant relationship between the two values. The Pearson correlation coefficient and the criteria for the p-value are listed in Table 1 and Table 2. In the present paper, computational fluid dynamics results provide sufficient data to guarantee a p-value within 0.01 according to the Tests of Significance in statistics, which indicates that hydraulic loss and entropy production show a very significant relationship.

3. Experimental Research

3.1. Experimental Setup and Process

Figure 1 shows the test setup of the multi-stage PAT. The assembly of the test system is shown in Figure 1a. The multi-stage PAT was connected directly with an eddy current dynamometer (ECD) as depicted in Figure 1b. The test system consists of a booster pump, multi-stage PAT, ECD, pressure transmitters, flow meters, control valves, a water tower, and a data collection platform. The booster pump provides high-pressure fluid for the multi-stage PAT, the pressure at the inlet and outlet of the multi-stage PAT was monitored by pressure transmitters, and the flow rate was adjusted by control valves and measured by flow meters. The speed and torque of the multi-stage PAT are tracked and modified by the ECD, and water is supplied by the water tower. The ranges and accuracies of the test instruments are shown in Table 3.
The test procedure is as follows. First, close valves 1 and 2 and evacuate the air in the system. Set the ECD load power to the maximum, open valve 2, then quickly click the start button of the motor to ensure the direction of rotation properly, and subsequently, start the motor. Reduce the ECD load gradually to stabilize the multi-stage PAT rotation speed at 2900 rpm, and record the flow rate, inlet and outlet pressure, torque, and recovery power of the multi-stage PAT simultaneously. Finally, by controlling the opening of valves 1 and 2 synchronized with changing the ECD load, the characteristics of multi-stage PAT at different flow rates and rotational speeds can be obtained.

3.2. Geometric Parameters

The main geometric parameters of the multi-stage PAT are provided in Table 4, along with the flow rate, head, speed, and design-specific speed of 27.5 m3/h, 216 m, 2900 rpm, and 56.7, respectively.

4. Numerical Analysis

4.1. Computational Model and Mesh Generation

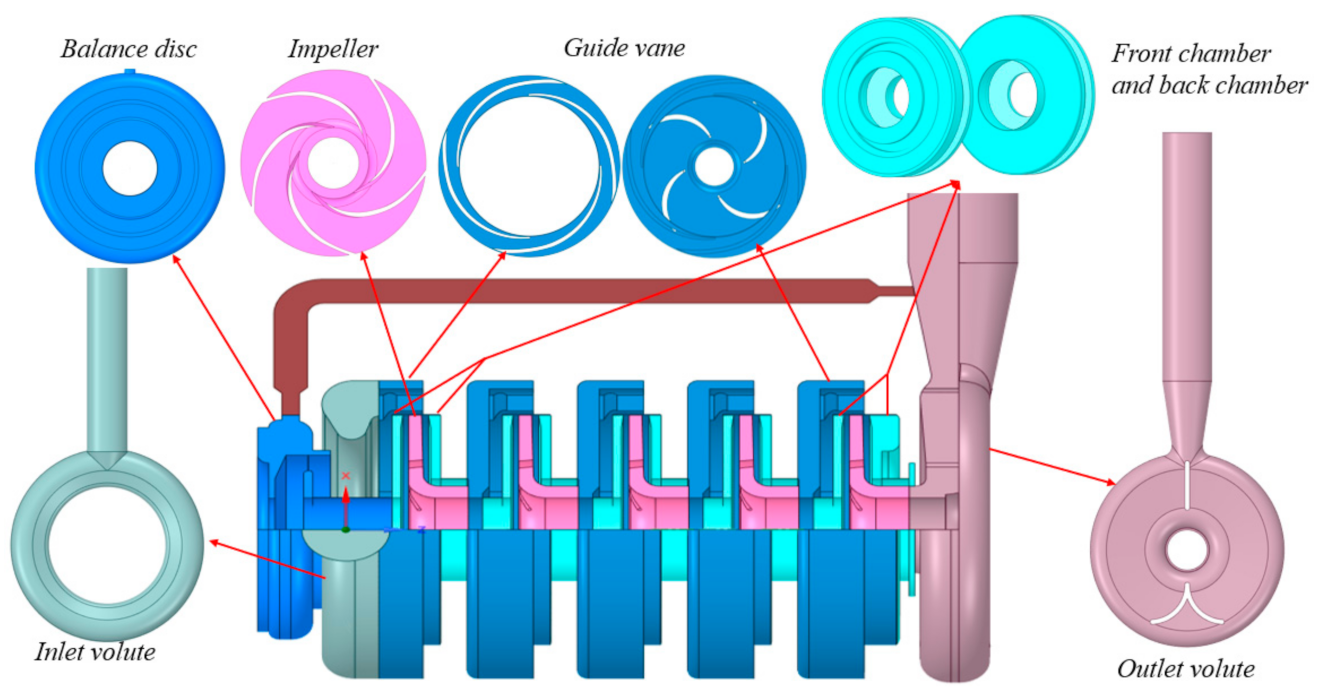
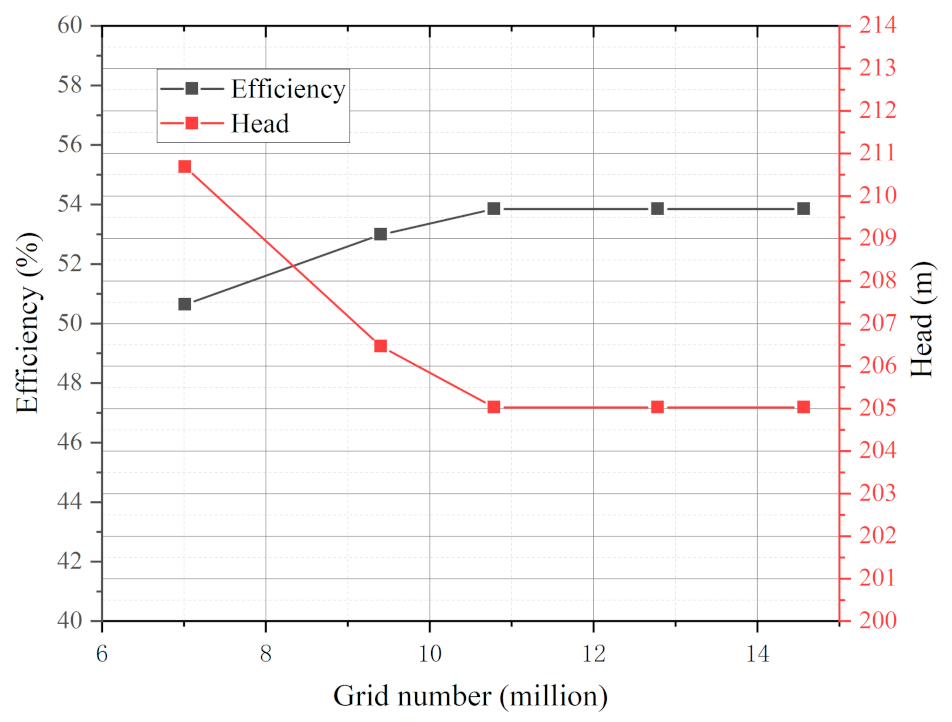
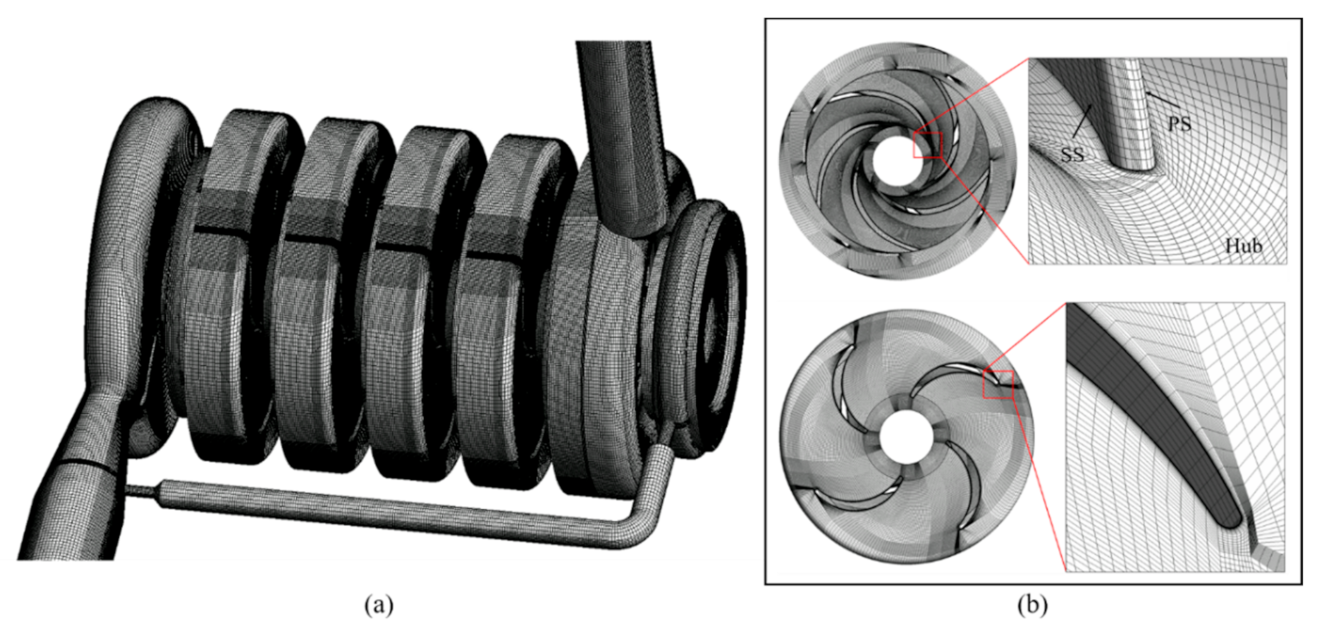
The multi-stage PAT fluid domain is displayed in Figure 2, which included inlet and outlet volute, front and back chambers, balance disc, impeller, and guide vane. A hexahedral mesh is constructed using ICEM software, and the Refined Boundary Mesh (RBM) method is used to increase the number of mesh nodes close to the walls. Five mesh grids are generated to conduct the grid convergence, the efficiency and head of the multi-stage PAT corresponding to different grid numbers at the optimal operating condition are given in Figure 3. When the number of grids is exceeding 10.78 million, the efficiency and head fluctuation of the multi-stage PAT was less than 0.5 %. Therefore, a mesh scheme with a grid number of 10785025 is used for further numerical simulations in order to capture the turbulence details of the multi-stage PAT and to save computational resources. The mesh and local mesh details of the multi-stage PAT are exhibited in Figure 4.
The discretized error data of the grids utilized for the calculation were obtained to analyze the error verification of the grids, as demonstrated in Table 5. N1/N2/N3 corresponds to different grids of the total number of grids, respectively. φ 1 / φ 2 / φ 3 are the parameters of the flow characteristics within the multi-stage PAT under the corresponding grids, respectively. The numerical errors of the head coefficient and the efficiency coefficient are 1.87% and 1.06%, respectively. The discretization error of the grids is small enough to ensure the accuracy of the calculation.

4.2. Solution Modeling

The RNG k-ε model with higher accuracy and precision is applied in this paper. For the steady calculation, water at 25 °C is chosen as the flow medium, and the effects of temperature and compressibility are not considered. The total inlet pressure was set as the inlet boundary condition, and the outlet boundary condition was given by mass flow rate. In the unsteady state, the rotating domain intersection is converted into a transient frozen rotor, and the impeller is rotated every 3° as one timestep. The characteristics of the multi-stage PAT under different operating conditions are obtained by altering the outlet mass flow rate.

4.3. Comparison of Experimental and Numerical Simulation Results

The head H, recovery power P, and efficiency η of multi-stage PAT at different flow conditions are calculated by the following equations.
H = P 1 P 2 ρ g
P = 2 π n T 60
η = P ρ g Q H × 100 %
In the above equation, P1 and P2 represent the inlet and outlet total pressure, T is the torque, n is the rotational speed, and Q is the mass flow rate.
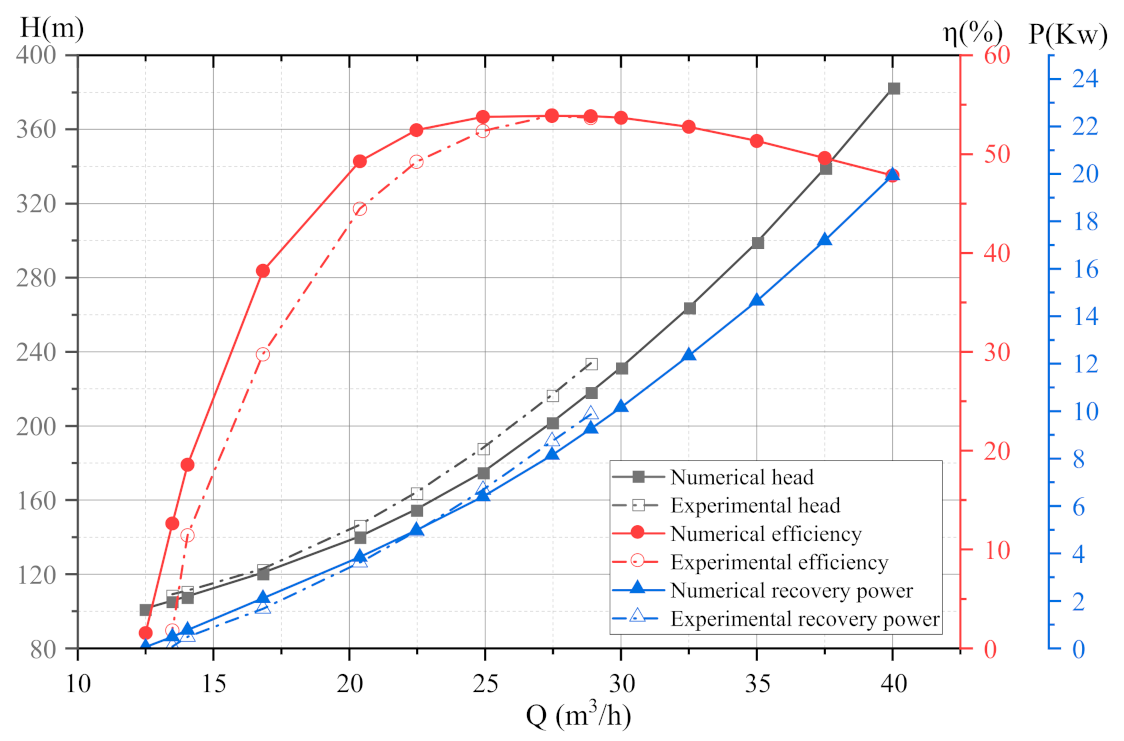
The results of the comparison between the numerical simulation and the experiment are presented in Figure 5. In general, the trend of the numerical simulation results is consistent with the experimental results. It is observed that a slightly deviate between the numerical and experimental results. Since the mechanical losses and partial volumetric losses are not taken into account in the simulation, the simulated efficiency is larger than the experimental value. While the simulated outlet pressure is larger than the experimental value, resulting in a smaller simulated head than the experimental value. The numerical simulation results deviate from the experimental values under part-load conditions, with a maximum deviation of efficiency of 10.8%. Under the design condition, the deviation is smaller. According to the performance results of multi-stage PATs under different flow conditions, the high-efficiency range of multi-stage PAT is quite narrow. The efficiency decreases significantly under part-load conditions. Under the over-load condition, the drop in efficiency is relatively flat, and the recovered power and head increase with the increase of flow rate.
Figure 6 represents the relationship between different stages within the multi-stage PAT. The head of the single-stage includes the impeller, guide vane, and the front and back chambers as seen in Figure 6a. The first stage is connected to the inlet volute without a negative guide vane, so the head of the first stage component is relatively high. Figure 6b indicates the head variation of the multi-stage PAT through stages. It is evident that the head increases with the number of stages, almost in a linear relationship. From the results, the multi-stage PAT has a greater range of applications compared with the single hydraulic turbine, and the required head can be acquired by changing the number of stages in multi-stage PAT.

5. Energy Loss Analysis

5.1. Comparison of Energy Loss Calculation Methods

The conventional hydraulic loss calculation method is derived from the pressure difference between the domain inlet and domain outlet, namely the pressure drop method (PDM), as shown in Equation (21). However, the energy loss of the specific components cannot be obtained by PDM. Figure 7 represents the comparison results of the losses obtained by the entropy production method (EPM), as shown in Equation (16), and PDM calculations. It is clear that the errors of EPM and PDM are small around the design conditions, and significant errors exist in the small flow conditions, which are inappropriate intervals for the operation of multi-stage PAT. Moreover, the loss power obtained by EPM aligns greatly with the hydraulic loss derived from PDM, and the accuracy is higher in the applicable interval. Instantaneously, the use of EPD allows for quantitative analysis of the energy losses and identification of the location where the losses occur at individual components within the multi-stage PAT. Therefore, using EPD to evaluate the energy loss within the multi-stage PAT is reliable.
  Hydraulic   Loss   = ρ g Q H P

5.2. Distribution of Entropy Production of Each Component with Flow Rate

Entropy production rate (EPR) and total entropy production variations for each part of the multi-stage PAT are shown in Figure 8. Since there are numerous components within the multi-stage PAT, all domains are first combined for analysis and comparison, and then each stage is analyzed subsequently. Figure 8 shows the volume-averaged EPR distribution under different flow conditions. Overall, the energy loss of the multi-stage PATs system varies smoothly at the lower flow conditions and increases with the flow rate. While the energy loss increases significantly at high flow conditions. When the discharge is larger than 20 m3/h, there is no observable change in EPR at the inlet and outlet volute, which implies that the energy loss density in this area is minimal. The EPR of the balance disc and the front and back pump chambers increases slowly as the flow rate increase. The impeller and diffuser are the main concentrated parts of multi-stage PAT, the energy loss at the impeller is more focused compared with the diffuser. The energy loss density of different parts under Qd condition is in descending order: impeller, guide vane, front chamber, back chamber, balance disc, outlet volute, and inlet volute.
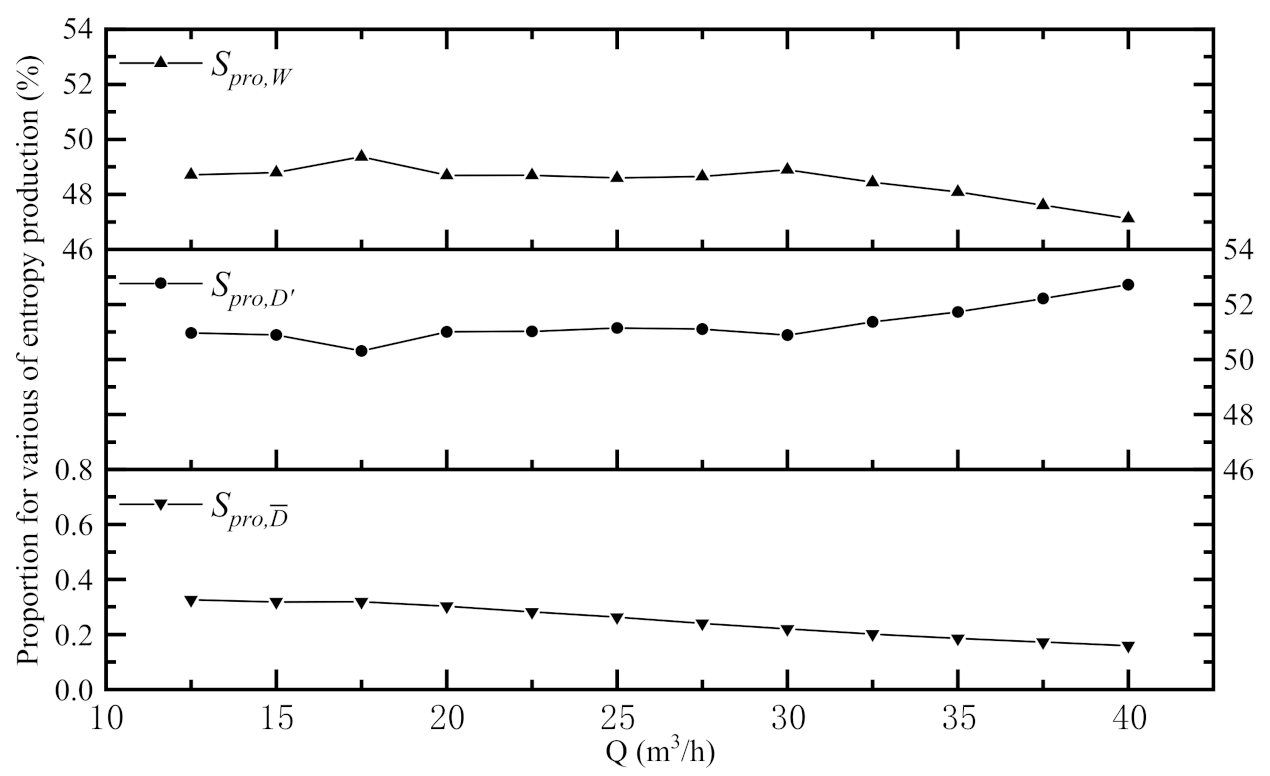
Figure 8 shows the volume-averaged EPR of the various components of the multi-stage PAT at different flow conditions. Overall, the impellers and guide vanes are the main energy-loss components of the multi-stage PAT. Therefore, the internal flow characteristics of these components determine the energy conversion performance of the multi-stage PAT. The entropy production is mainly divided into three types: direct entropy from viscous dissipation, turbulent entropy from turbulent dissipation, and wall entropy from the boundary layer effect. The proportion of each type of entropy production is represented in Figure 9 to better clarify the composition of entropy production under different flow conditions. Direct entropy production accounts for only 0.16–0.33% of total entropy production, which is dominated by turbulent entropy production and wall entropy production accounting. As a result, turbulent dissipation and wall friction are regarded as the primary causes of irreversible energy loss. Both the proportion of turbulent dissipation and wall friction are becoming smoother around the design condition. As the flow rate rises, the percentage of wall entropy production gradually decreases while the fraction of turbulent entropy production gradually increases after the design condition.
Figure 10 portrays the volume-averaged EPR production difference of single-stage components in a multi-stage PAT. The variation of EPR of the single-stage guide vane under different flow conditions is featured in Figure 10a. The EPR of the first-stage guide vane is markedly higher than the other stages. This is because the first-stage guide vane is directly connected to the inlet volute without the reverse guide vane and is impacted by the water streaming from the inlet volute. So, the intensity of the energy loss generated is notably greater than the other stages, and the EPR of the remaining guide vanes are quite similar. Figure 10b presents the internal energy loss of the impellers within different stages under different flow conditions. The energy loss of the first stage impeller is slightly lesser than the other impellers under small flow conditions, whereas under high flow conditions, the energy loss of the first stage impeller grows faster. The energy loss in the back chamber tends to diminish and then rise with the flow rate shift in the single-stage components (Figure 10c,d), while the front chamber increases steadily and then rapidly. The front and back chambers of the first stage have remarkably higher energy loss than the other stages, namely because the first stage guide vane does not have a reverse guide vane and the flow is not stable enough, resulting in greater energy loss. On the contrary, the energy loss of the remaining chambers is not clearly distinguishable. The energy loss in the fifth stage front chamber is lower than the others because it is connected with the outlet volute, leading to smoother flow. Overall, the impellers and guide vanes of the single-stage play a key role in the energy loss of the multi-stage PAT, while the impact of the front and back chambers is limited.
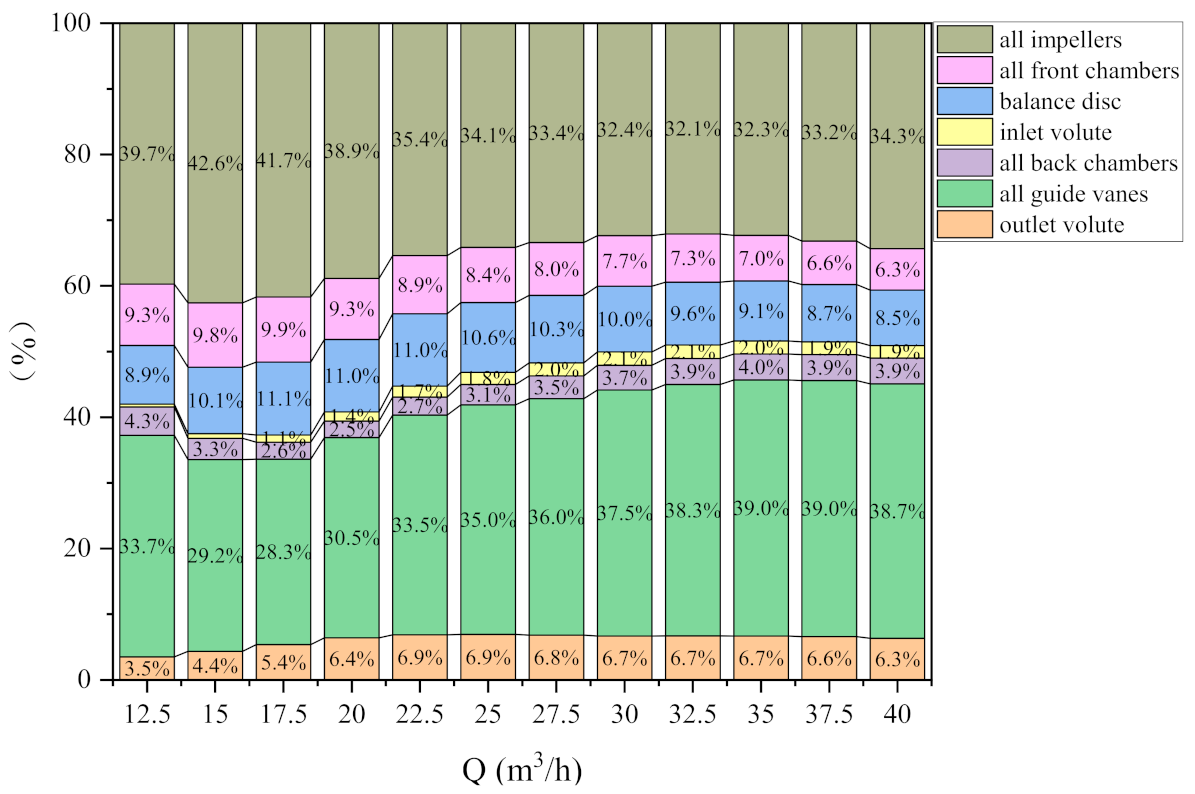
To conduct a quantitative analysis of the contribution of various components in the multi-stage PAT to the entire energy loss. Figure 11 conveys the energy loss of each piece in the overall energy loss with the multi-stage PAT, and the energy loss is calculated combined with the impeller and guide vane which accounts for 69.1–73% of the total energy loss under all flow conditions. The proportion of both the impellers and guide vanes is relatively stable through the overall loss. The ratio of energy loss at the impellers is relatively large under low flow conditions, but it gradually decreases and then stabilizes as the flow rate increases. The percentage of energy loss at the guide vane increases and subsequently stabilizes with the growth of the flow rate. For the front and back chambers, the energy loss contributes about 10.2−13.6% of the total energy loss, and it decreases slightly as the flow rate increases. Revealing that the front and back chambers pattern tends to stabilize in the process of the flow rate rises, the energy loss ratio of the front chambers is slowly reduced, while it increases at the back chambers. When the flow rate increases, the ratio of energy loss ratio at the balance disc gradually decreases as the flow rate increases. Under low flow conditions, the proportions of energy loss at the inlet and outlet volutes are pretty tiny, which can be negligible. Besides, the total energy loss of a multi-stage PAT is governed by the impeller and guide vane.

5.3. Distribution of Entropy Production in Flow Field

The overall volumetric entropy production distribution (VEPR) of multi-stage PAT under the design condition is detailed in Figure 12. The energy loss occurs merely in the impellers and guide vanes, with the first stage guide vane having greater energy loss than the rest of the stages. There is a greater VEPR distribution at the junction of the impellers and guide vanes because the fluid hits the impeller blades when entering the impeller from the guide vanes. There is a greater relative velocity and a chaotic flow field, resulting in greater energy loss. In the middle stages, there is no discernible difference in the energy loss of the impellers and guide vanes. Synchronously, the recognizable energy loss can be seen at the connection of the return pipe with the balance disc and the outlet volute. There is a greater relative velocity when the fluid enters the outlet volute from the return pipe, resulting in greater energy loss.
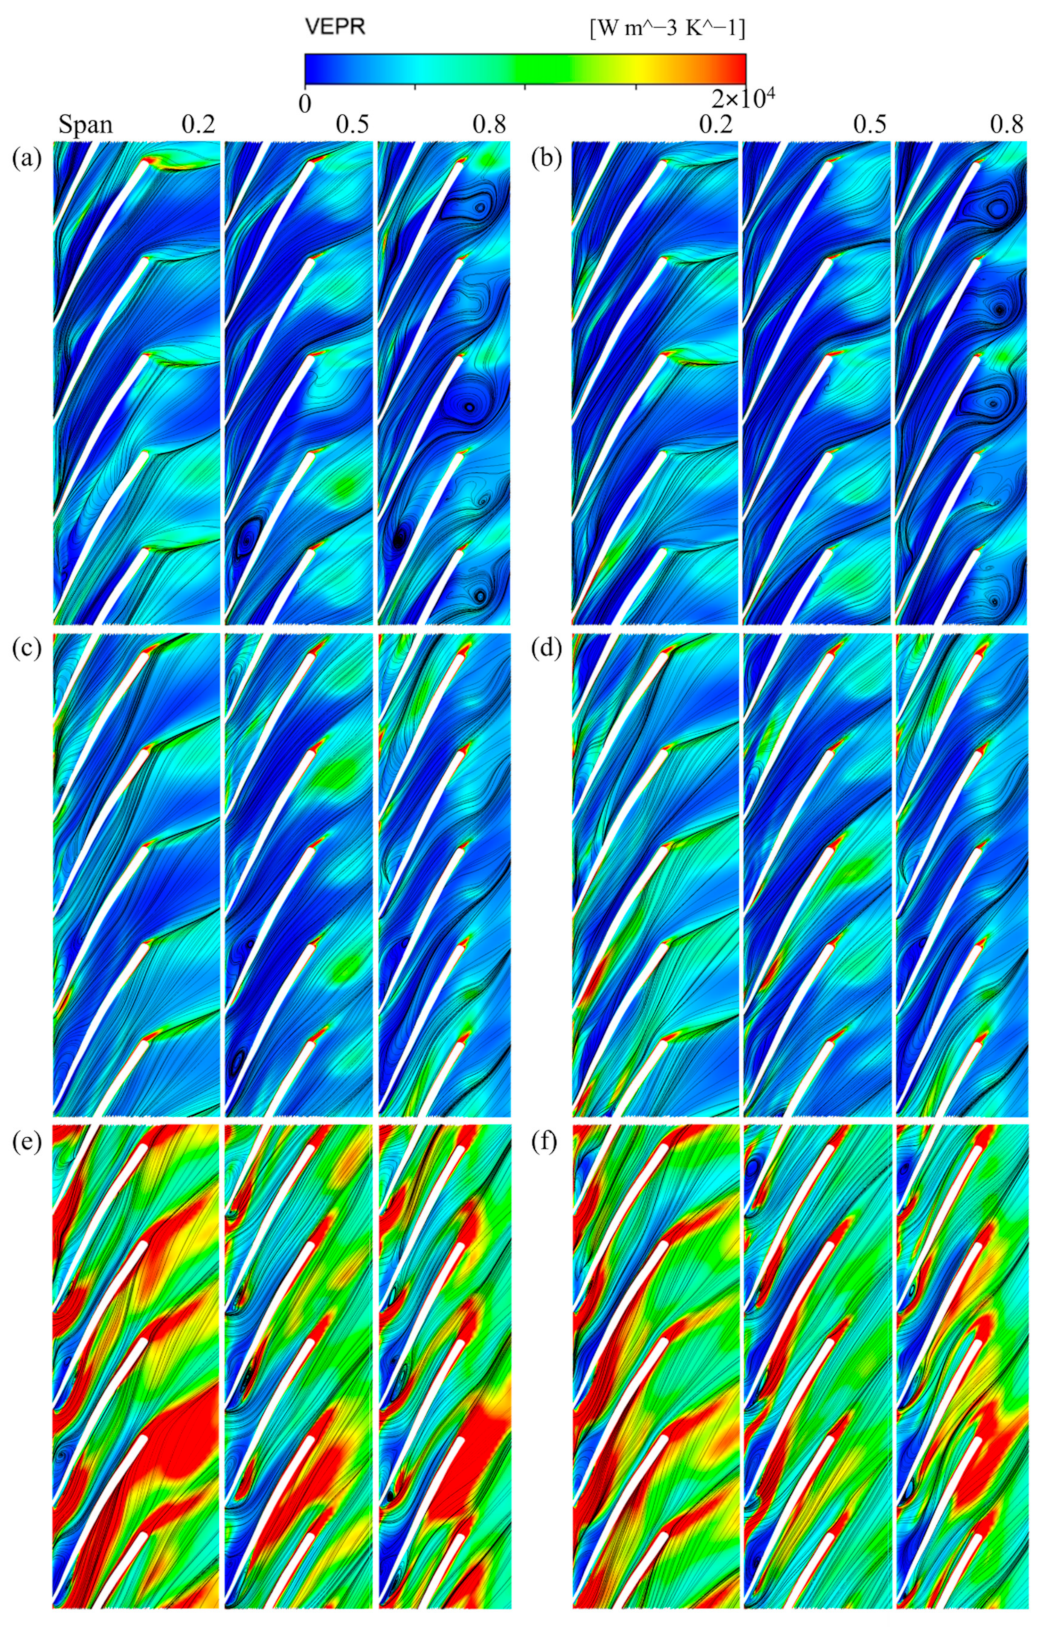
Figure 13 shows the distribution of VEPR and streamlines at the different span-wise surfaces at the first and fifth stage impeller under various flow rates. Under low flow conditions, VEPR is mainly distributed at the trailing edge of the blade. Combined with the streamlines that can be seen, the streamlines are more uniform near the hub. At Span = 0.5 the blade pressure surface appears to return vortex, there is a large number of return vortices near the shroud. There is a relatively uniform streamlined distribution for impeller 5 relative to impeller 1. Under the design condition, the streamlines are more uniform. VEPR distribution is mainly concentrated in the blade trailing edge and blade suction surface. The return vortex appearance in the impeller 1 Span = 0.5, impeller 5 is almost no return vortex. Under high flow conditions, VEPR distribution is mainly concentrated in the blade trailing edge and blade suction surface. Many small return vortices appear at the blade trailing edge. As the flow rate increases, entropy production grows rapidly, resulting in greater energy loss.
Figure 14 depicts the distribution of the VEPR and the streamlines at the first, middle, and last stage impellers. Figure 14a–c shows the distribution of the VEPR on the cross-section of impellers within three stages, and Figure 14d–f shows the distribution of the streamlines on the cross-section of impellers within three stages. The flow pattern of the first stage impeller is more complicated, and the vortex exists in all the pressure surfaces of the blades. At the middle stage, the streamlines at the bottom of the impeller are gradually smooth, and the vortex still exists at the top and the left and right sides of the impeller. The vortex region decreases slightly, and the streamlines are smoother at the impeller of the fifth stage. The distributions of VEPR are similar to these three impellers, while the streamlines diagram is more varied. The area with large VEPR also has a high velocity.
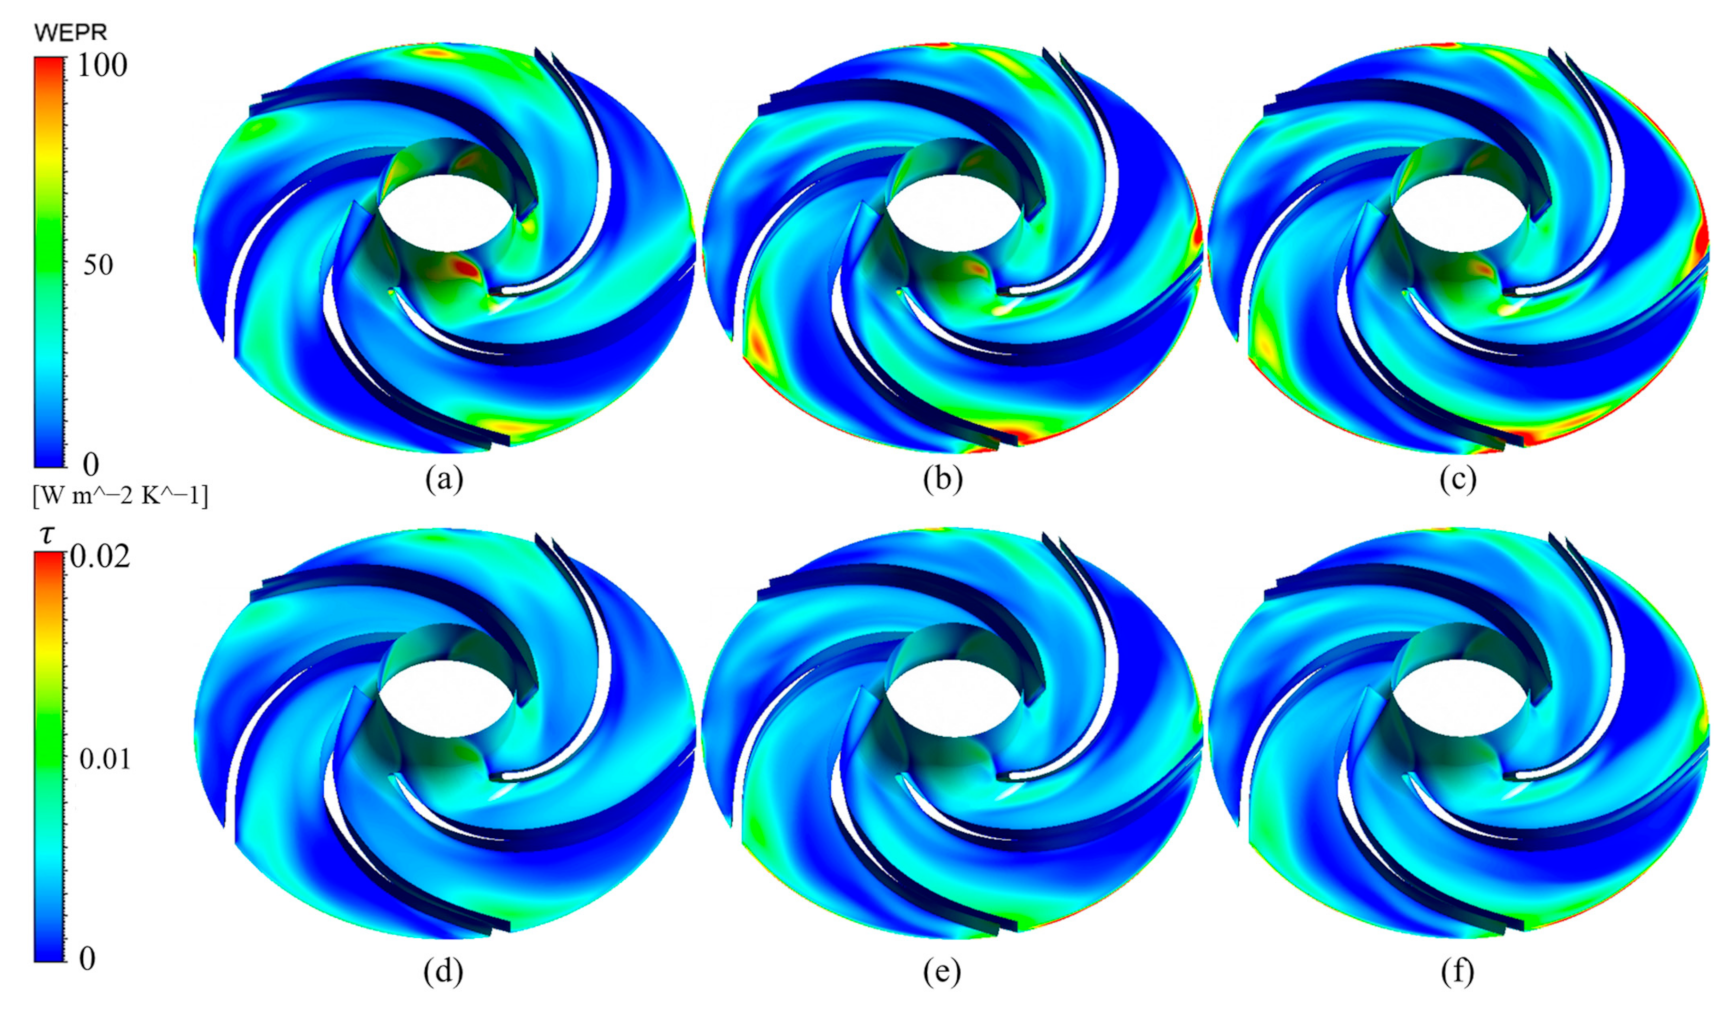
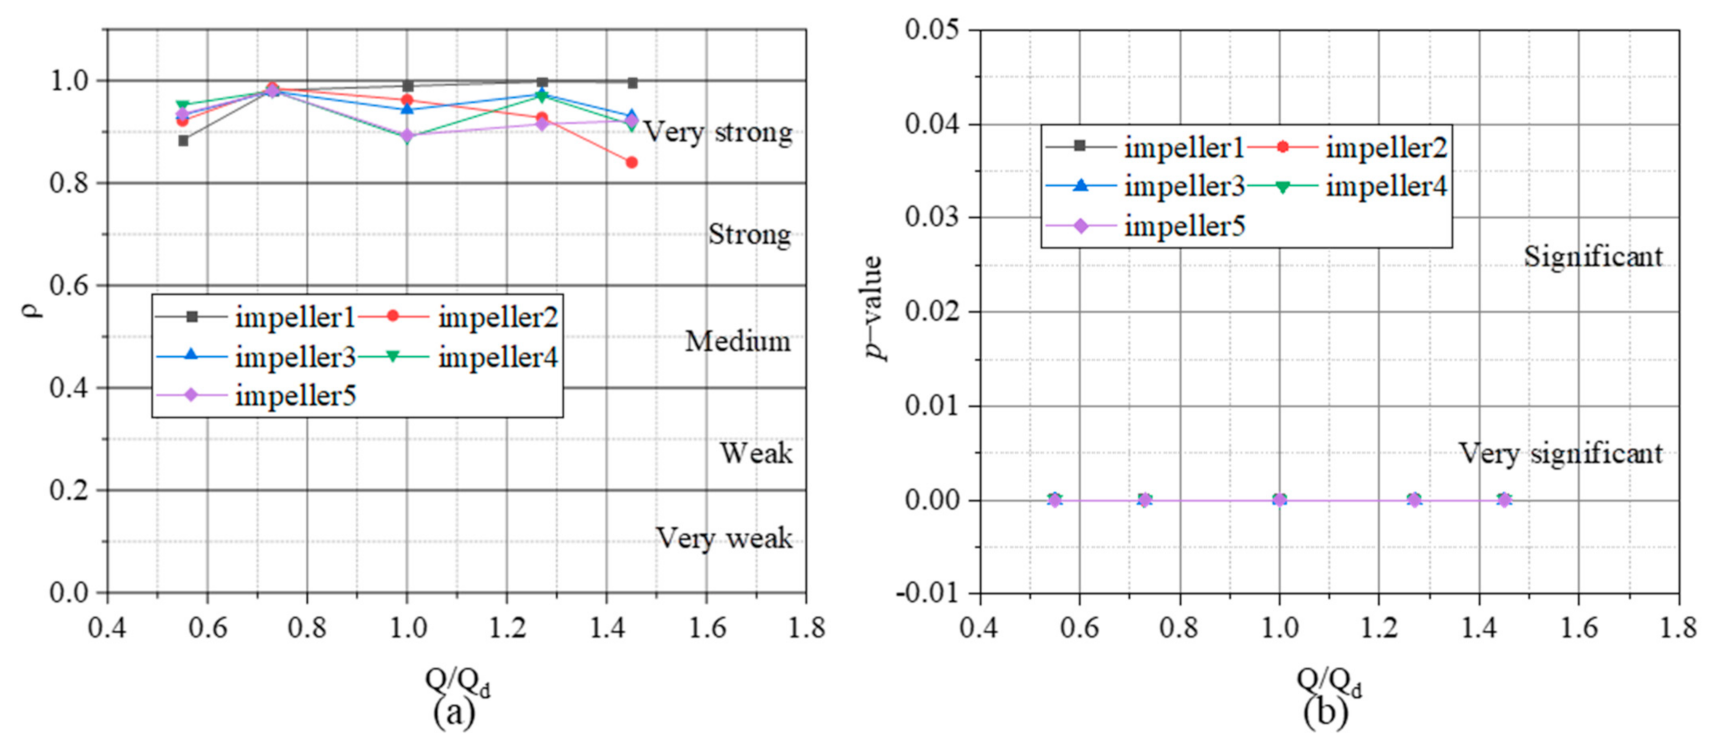
The wall entropy production rate (WEPR) is closely related to the wall friction distribution. To investigate the relationship between WEPR and the wall friction distribution, the skin friction coefficient τ is defined as shown in Equation (21). Figure 15 shows the distribution of WEPR and surface friction coefficient at the first, third, and fifth-stage impellers. WEPR is the main present at the hub of impellers and the blade inlet. It has a similar distribution of skin friction coefficient. The Pearson correlation coefficient and p-value analysis of both WEPR and skin friction coefficient are shown in Figure 16. The results show that the distribution of the surface friction coefficient is strongly correlated with WEPR, and the p-value is always less than 0.01, suggesting that the WEPR has a very significant relationship with its skin friction coefficient.
τ = τ 0.5 ρ u 2
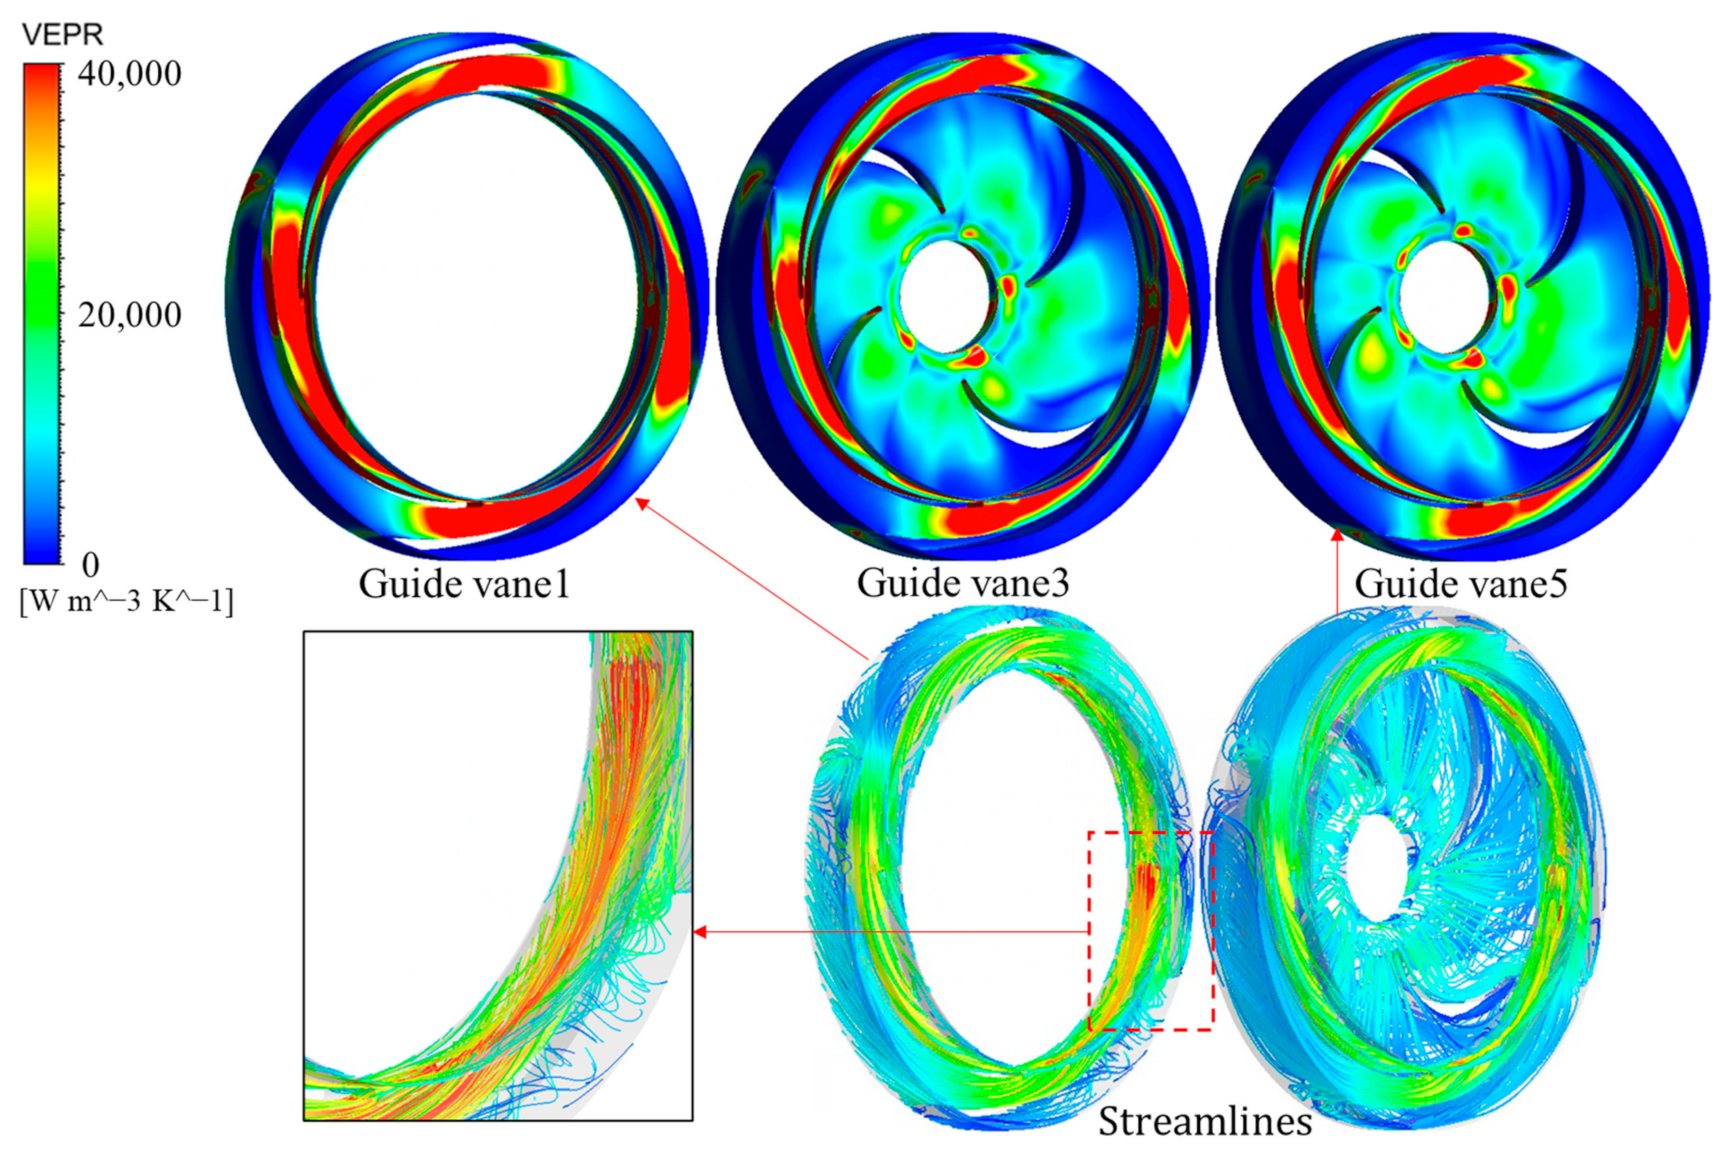
The distributions of VEPR and the streamlines of the first, third, and fifth stage guide vane are depicted in Figure 17. The VEPR exists mainly at the positive guide vane and reaching to its peak at the leading edge of the guide vane. The reverse guide vane represents quite a low entropy production value, whereas the first stage guide vane without reverse guide vane for buffering has a larger entropy production distribution resulting in greater energy loss than the third and fifth stage guide vane. The distributions of the third and fifth stage guide vane entropy production are similar. From the flow diagram, the same greater relative velocity exists at the positive guide vane blades, while flow vortices occur on the inlet of the guide vane. Additionally, the shock phenomena appear near the leading-edge region, and the EPR in these regions is relatively high.
The vortex core distributions of the first, third, and fifth stage impellers are displayed in Figure 18, and the Q criterion is used to identify the vortex core structure, where the Q standard equivalent surface is Q* = 0.03, and EPR is used for coloring. When comparing the vortex cores of impellers through different stages, the first stage impeller is subjected to direct fluid impact, and the vortex band at the junction of the leading edge of the blade and the guide vane is the longest. The interaction between the vortex bands causes the vortex core structure to change, resulting in flow domain instability. From the third stage impeller to the fifth stage impeller, the vortex band length at the leading edge of the blade is shortened, and the stability of the flow field will be improved.
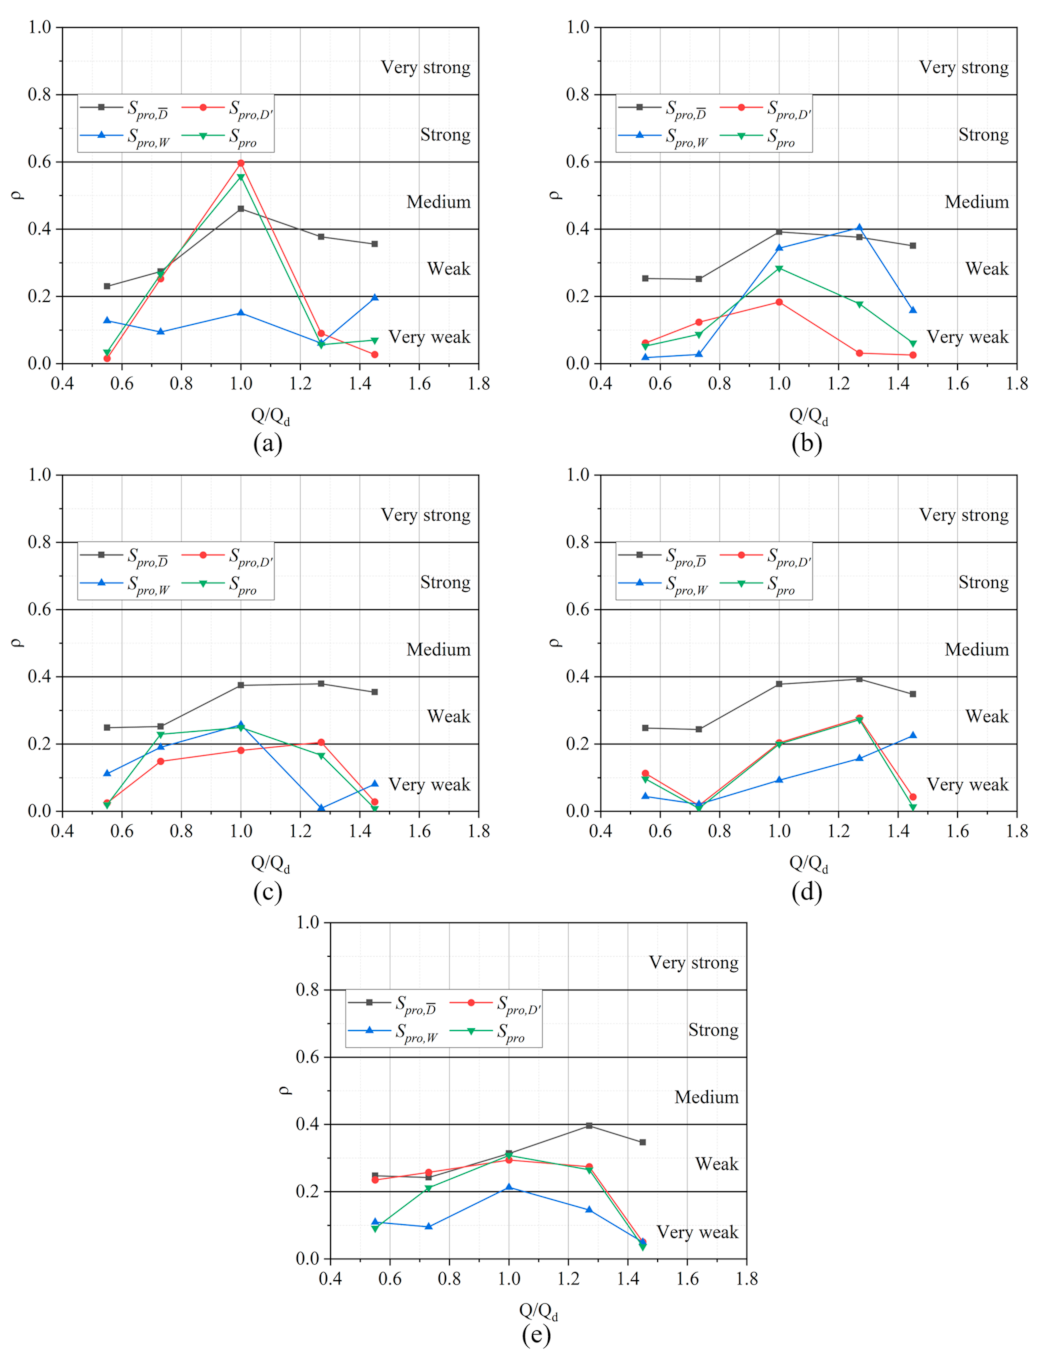
The relationship between the dissipation effect and entropy production with each component of the impeller hydraulic losses at each stage of the multi-stage PAT is pictured in Figure 19. The figure shows that the viscous entropy production has a strong correlation with the dissipation effect at all flow conditions, while the other components have a weak correlation. In fact, viscous entropy production accounts for a small portion of total entropy production, while turbulent entropy production and wall entropy production are more indicative of dissipation. For the first two impeller stages, there is a higher correlation between turbulent entropy production and total entropy production at 1.0 Qd, and the last three impellers have a better correlation at higher flow conditions. In conclusion, the strongest correlation is between viscous entropy production and the dissipation effect, while the other entropy production components are weakly correlated or below.

5.4. Correlation Analysis

The relationship between the transportation effect on each component of entropy production in the hydraulic loss at each impeller is illustrated in Figure 20. The figure demonstrates that the correlation of viscous entropy production is more stable and settles near the medium. The correlation of each component in the first two impellers is high at 1.0 Qd, while the last three impellers are stable around the weak correlation. The variation of each component varies in each stage of the impeller, reflecting the high complexity of the flow in the multi-stage PAT, which requires further investigation.
The relationship between the dissipation effect and entropy production with each component of the guide vane hydraulic losses at each stage of the multi-stage PAT is pictured in Figure 21. The turbulent entropy production in each stage of the guide vane shows a very strong correlation at all flow conditions. The rest of the components show large fluctuations with the changing flow conditions. The turbulent entropy production and the total entropy production in the first-stage guide vane are always around a strong correlation. The viscous entropy production is always around the medium correlation, while the wall entropy production shows a weak correlation. In the second-stage guide vane, the turbulent entropy production has the strongest correlation. The remaining components show a trend of increasing and then decreasing with the flow rate when the wall entropy production has a strong correlation. The same trend exists in the latter three impellers, except that each component of turbulent entropy production has large fluctuations under different flow conditions.
The relationship between the transportation effect and entropy production with each component of the guide vane hydraulic losses at each stage of the multi-stage PAT is pictured in Figure 22. Large fluctuation cases exist for each component under different flow conditions. In the first-stage impeller, the viscous entropy production is a strong correlation. The correlation of the total entropy production is similar except for the second-stage guide vane. Where the wall entropy production in the last four stages is a strong correlation at all flow conditions. The turbulent entropy production is increasingly correlated as the flow rate changes. The high complexity of the multi-stage PAT leads to great differences in each flow condition, and further research is necessary.

6. Conclusions

In this paper, based on the experimental study, numerical simulation is applied to calculate the multi-stage PAT. The flow characteristics of multi-stage PAT under different working conditions are studied using the entropy production theory, and the physical fields and energy loss quantities are correlated by correlation analysis. The following conclusions are obtained.
(1)
Based on entropy production theory, the energy loss calculation method can statistically investigate each component of the multi-stage PAT. Unlike the traditional methods, entropy production theory can predict the locations where losses occurred accurately. The guide vane, impeller, inlet and outlet volute, front and back chambers, and the balance disc are the main sources of energy loss in multi-stage PAT. The total entropy production rate of the impellers and the guide vanes increases dramatically as the flow rate increases. The total entropy production rate of each component under design flow conditions is listed in decreasing order: impeller, guide vane, front and back chamber, a balance disk, and inlet and outlet volute. The energy loss is commonly observed near the leading edge of both the impeller blades and the positive guide vanes. The entropy production of each factor is referenced in decreasing order as turbulent entropy production, wall entropy production, and direct entropy production. The entire energy loss is larger at the first stage because there is no reverse guide vane. The entropy production rate of each impeller is not clearly distinguishable. Therefore, using the entropy production theory can effectively identify the characteristics of the flow field and the location of energy losses. It provides a reference for the targeted optimization of multi-stage PAT.
(2)
The flow domain versus entropy production of impellers and guide vanes indicates that the energy loss is closely related to other physical quantities in the flow domain. The distributions of streamlines with the impellers and guide vanes versus VEPR prove that higher relative velocity accompanies larger energy loss. Furthermore, the distribution of streamlines and vortex cores at the impellers reflects that flow domain stability increases from the first stage impeller to the fifth stage impeller. When the distributions of WEPR and skin friction coefficient at the impeller are compared, the WEPR is discovered to be significantly relevant to the wall friction distribution.
(3)
There is a correlation between hydraulic loss and entropy production. The Pearson correlation coefficient is used to evaluate the relationship between the hydraulic loss and entropy production of the impellers. According to the findings, viscous entropy production has the strongest correlation with the dissipation effect, followed by turbulent entropy, total entropy, and wall entropy. The dissipation and transportation effects are also strongly associated.

Author Contributions

S.Y.: writing—original draft, preparation, conceptualization, software, experiment. X.L.: conceptualization, data curation, investigation, methodology. Z.Z.: conceptualization, supervision, writing—review & editing. L.L.: validation, guidance. T.L.: validation, guidance. All authors have read and agreed to the published version of the manuscript.

Funding

This work was supported by the National Natural Science Foundation of China (Grant Nos. 52076196), the National Natural Science Foundation of China (Grant Nos. 52006197), the Natural Science Foundation of Zhejiang Province (Grant No. LR20E090001), and Key Research and Development Program of Zhejiang Province (Grant No. 2021C05006), the Science and Technology Research Project of Jiangxi Provincial Department of Education (Grant No. GJJ214903), the high-level talent research start-up project of Jiangxi College of Applied Technology (Grant No. JXYY-G2022002).

Data Availability Statement

All the data is already in the article.

Conflicts of Interest

The authors declare no conflict of interest.

References

  1. Nautiyal, H.; Varun, V.; Kumar, A.; Yadav, S.Y.S. Experimental Investigation of Centrifugal Pump Working as Turbine for Small Hydropower Systems. Energy Sci. Technol. 2011, 1, 79–86. [Google Scholar]
  2. Derakhshan, S.; Nourbakhsh, A. Theoretical, numerical and experimental investigation of centrifugal pumps in reverse operation. Exp. Therm. Fluid Sci. 2008, 32, 1620–1627. [Google Scholar] [CrossRef]
  3. Derakhshan, S.; Nourbakhsh, A. Experimental study of characteristic curves of centrifugal pumps working as turbines in different specific speeds. Exp. Therm. Fluid Sci. 2007, 32, 800–807. [Google Scholar] [CrossRef]
  4. Williams, A.A. The Turbine Performance of Centrifugal Pumps: A Comparison of Prediction Methods. Proc. Inst. Mech. Eng. Part A J. Power Energy 1994, 208, 59–66. [Google Scholar] [CrossRef]
  5. Huang, S.; Qiu, G.; Su, X.; Chen, J.; Zou, W. Performance prediction of a centrifugal pump as turbine using rotor-volute matching principle. Renew. Energy 2017, 108, 64–71. [Google Scholar] [CrossRef]
  6. Mdee, O.J.; Kimambo, C.Z.; Nielsen, T.K.; Kihedu, J. Analytical Evaluation of Head and Flow Rate Off-Design Characteristics for Pump as Turbine Application. J. Fluids Eng. 2019, 141, 051203. [Google Scholar] [CrossRef]
  7. Wang, T.; Wang, C.; Kong, F.; Gou, Q.; Yang, S. Theoretical, experimental, and numerical study of special impeller used in turbine mode of centrifugal pump as turbine. Energy 2017, 130, 473–485. [Google Scholar] [CrossRef]
  8. Liu, M.; Tan, L.; Cao, S. Theoretical model of energy performance prediction and BEP determination for centrifugal pump as turbine. Energy 2019, 172, 712–732. [Google Scholar] [CrossRef]
  9. Yang, S.-S.; Derakhshan, S.; Kong, F.-Y. Theoretical, numerical and experimental prediction of pump as turbine performance. Renew. Energy 2012, 48, 507–513. [Google Scholar] [CrossRef]
  10. Shi, G.; Liu, X.; Wang, Z.; Liu, Y. Conversion relation of centrifugal pumps as hydraulic turbines based on the amplification coefficient. Adv. Mech. Eng. 2017, 9, 299–307. [Google Scholar] [CrossRef]
  11. Rossi, M.; Renzi, M. Analytical Prediction Models for Evaluating Pumps-As-Turbines (PaTs) Performance. Energy Procedia 2017, 118, 238–242. [Google Scholar] [CrossRef]
  12. Rossi, M.; Renzi, M. A general methodology for performance prediction of pumps-as-turbines using Artificial Neural Networks. Renew. Energy 2018, 128, 265–274. [Google Scholar] [CrossRef]
  13. Frosina, E.; Buono, D.; Senatore, A. A Performance Prediction Method for Pumps as Turbines (PAT) Using a Computational Fluid Dynamics (CFD) Modeling Approach. Energies 2017, 10, 103. [Google Scholar] [CrossRef] [Green Version]
  14. Yang, S.S.; Kong, F.Y.; Qu, X.Y.; Jiang, W.M. Influence of Blade Number on the Performance and Pressure Pulsations in a Pump Used as a Turbine. J. Fluids Eng. 2012, 134, 124503. [Google Scholar] [CrossRef]
  15. Yang, S.-S.; Kong, F.Y.; Jiang, W.M.; Qu, X.Y. Effects of impeller trimming influencing pump as turbine. Comput. Fluids 2012, 67, 72–78. [Google Scholar] [CrossRef]
  16. Yang, S.S.; Liu, H.L.; Kong, F.Y.; Dai, C.; Dong, L. Experimental, Numerical, and Theoretical Research on Impeller Diameter Influencing Centrifugal Pump-as-Turbine. J. Energy Eng. 2013, 139, 299–307. [Google Scholar] [CrossRef]
  17. Yang, S.S.; Liu, H.L.; Kong, F.Y.; Xia, B.; Tan, L.W. Effects of the Radial Gap Between Impeller Tips and Volute Tongue Influencing the Performance and Pressure Pulsations of Pump as Turbine. J. Fluids Eng. 2014, 136, 054501. [Google Scholar] [CrossRef]
  18. Yang, S.S.; Wang, C.; Chen, K.; Yuan, X. Research on Blade Thickness Influencing Pump as Turbine. Adv. Mech. Eng. 2014, 6, 841–868. [Google Scholar] [CrossRef]
  19. Miao, S.C.; Yang, J.H.; Shi, G.T.; Wang, T.T. Blade profile optimization of pump as turbine. Adv. Mech. Eng. 2015, 7, 1687814015605748. [Google Scholar] [CrossRef] [Green Version]
  20. Shi, F.; Yang, J.; Wang, X. Analysis on the effect of variable guide vane numbers on the performance of pump as turbine. Adv. Mech. Eng. 2018, 10, 168781401878079. [Google Scholar] [CrossRef]
  21. Delgado, J.; Ferreira, J.P.; Covas, D.I.C.; Avellan, F. Variable speed operation of centrifugal pumps running as turbines. Experimental investigation. Renew. Energy 2019, 142, 437–450. [Google Scholar] [CrossRef]
  22. Xia, S.F.; Hu, Y.J.; Hui, W.X. Effect of Rotating Speed on Hydraulic Energy Recovery Turbines Performance. Appl. Mech. Mater. 2013, 444–445, 1033–1037. [Google Scholar]
  23. Binama, M.; Su, W.T.; Cai, W.H.; Li, X.B.; Muhirwa, A.; Li, B.; Bisengimana, E. Blade trailing edge position influencing pump as turbine (PAT) pressure field under part-load conditions. Renew. Energy 2019, 136, 33–47. [Google Scholar] [CrossRef]
  24. Jain, S.V.; Patel, N.K.; Patel, R.N. Experimental Investigations of Cavitation Characteristics of Pump Running in Turbine Mode. J. Energy Eng. 2016, 143, 04016034. [Google Scholar] [CrossRef]
  25. Li, W.; Zhang, Y. Numerical simulation of cavitating flow in a centrifugal pump as turbine. Proc. Inst. Mech. Eng. Part E J. Process Mech. Eng. 2018, 232, 135–154. [Google Scholar] [CrossRef]
  26. Li, W.-G. Effects of viscosity on turbine mode performance and flow of a low specific speed centrifugal pump. Appl. Math. Model. 2016, 40, 904–926. [Google Scholar] [CrossRef]
  27. Abazariyan, S.; Rafee, R.; Derakhshan, S. Experimental study of viscosity effects on a pump as turbine performance. Renew. Energy 2018, 127, 539–547. [Google Scholar] [CrossRef]
  28. Stefanizzi, M.; Torresi, M.; Fornarelli, F.; Fortunato, B.; Camporeale, S.M. Performance prediction model of multistage centrifugal Pumps used as Turbines with Two-Phase Flow. Energy Procedia 2018, 148, 408–415. [Google Scholar] [CrossRef]
  29. Fengxia, S.; Junhu, Y.; Senchun, M.; Xiaohui, W. Investigation on the power loss and radial force characteristics of pump as turbine under gas–liquid two-phase condition. Adv. Mech. Eng. 2019, 11, 1687814019843732. [Google Scholar] [CrossRef] [Green Version]
  30. Qian, B.; Chen, J.P.; Wu, P.; Wu, D.Z.; Yan, P.; Li, S.Y. Investigation on inner flow quality assessment of centrifugal pump based on Euler head and entropy production analysis. In IOP Conference Series: Earth and Environmental Science; IOP Publishing: Bristol, UK, 2019; Volume 240, p. 092001. [Google Scholar]
  31. Wilhelm, S.; Balarac, G.; Métais, O.; Ségoufin, C. Analysis of Head Losses in a Turbine Draft Tube by Means of 3D Unsteady Simulations. Flow Turbul. Combust. 2016, 97, 1255–1280. [Google Scholar] [CrossRef] [Green Version]
  32. Hou, H.; Zhang, Y.; Li, Z.; Jiang, T.; Zhang, J.; Xu, C. Numerical analysis of entropy production on a LNG cryogenic submerged pump. J. Nat. Gas Sci. Eng. 2016, 36, 87–96. [Google Scholar] [CrossRef]
  33. Zhang, F.; Appiah, D.; Hong, F.; Zhang, J.; Yuan, S.; Adu-Poku, K.A.; Wei, X. Energy loss evaluation in a side channel pump under different wrapping angles using entropy production method. Int. Commun. Heat Mass Transf. 2020, 113, 104526. [Google Scholar] [CrossRef]
  34. Ji, L.; Li, W.; Shi, W.; Tian, F.; Agarwal, R. Diagnosis of internal energy characteristics of mixed-flow pump within stall region based on entropy production analysis model. Int. Commun. Heat Mass Transf. 2020, 117, 104784. [Google Scholar] [CrossRef]
  35. Ghorani, M.M.; Haghighi, M.H.S.; Riasi, A. Entropy generation minimization of a pump running in reverse mode based on surrogate models and NSGA-II. Int. Commun. Heat Mass Transf. 2020, 118, 104898. [Google Scholar] [CrossRef]
  36. Ji, L.; Li, W.; Shi, W.; Tian, F.; Agarwal, R. Effect of blade thickness on rotating stall of mixed-flow pump using entropy generation analysis. Energy 2021, 236, 121381. [Google Scholar] [CrossRef]
  37. Ji, L.; Li, W.; Shi, W.; Chang, H.; Yang, Z. Energy characteristics of mixed-flow pump under different tip clearances based on entropy production analysis. Energy 2020, 199, 117447. [Google Scholar] [CrossRef]
  38. Herwig, H.; Kock, F. Direct and indirect methods of calculating entropy generation rates in turbulent convective heat transfer problems. Heat Mass Transf. 2007, 43, 207–215. [Google Scholar] [CrossRef]
  39. Kock, F.; Herwig, H. Entropy production calculation for turbulent shear flows and their implementation in cfd codes. Int. J. Heat Fluid Flow 2005, 26, 672–680. [Google Scholar] [CrossRef]
  40. Zhang, X.; Wang, Y.; Xu, X.; Wang, H. Energy conversion characteristic within impeller of low specific speed centrifugal pump. Nongye Jixie Xuebao (Trans. Chin. Soc. Agric. Mach.) 2011, 42, 75–81. [Google Scholar]
  41. Duan, L.; Wu, X.; Ji, Z. Application of entropy generation method for analyzing energy loss of cyclone separator. CIESC J. 2014, 65, 583–592. [Google Scholar]
Figure 1. Test system: (a) Test rig. (b) Multi-stage PAT and ECD.
Processes 10 02488 g001
Figure 2. Multi-stage PAT fluid model.
Processes 10 02488 g002
Figure 3. Effect of the number of grids on efficiency and head.
Processes 10 02488 g003
Figure 4. Mesh model and local encrypted mesh of Multi-stage PAT. (a) global mesh, (b) local detail.
Processes 10 02488 g004
Figure 5. Comparison of numerical simulation and test results.
Processes 10 02488 g005
Figure 6. Head curves of multi-stage PAT with different stages, (a) Head of different single-stage impellers, (b) Head of impellers in different stages.
Processes 10 02488 g006
Figure 7. Comparison of calculate methods of total loss.
Processes 10 02488 g007
Figure 8. Comparison of energy loss of different components in multi-stage PAT.
Processes 10 02488 g008
Figure 9. Different dissipation components versus the flow rate conditions.
Processes 10 02488 g009
Figure 10. Comparison of volume averaged EPR of multi-stage PAT of components in different stages: (a) guide vanes, (b) impellers. (c) front chambers. (d) back chambers.
Processes 10 02488 g010
Figure 11. Proportion of each component energy loss in the overall energy loss of the multi-stage PAT.
Processes 10 02488 g011
Figure 12. Distribution of VEPR at the mid-span section.
Processes 10 02488 g012
Figure 13. VEPR and streamlines distributions at the different span-wise surfaces of impeller1 and impeller5 with different various flow rate conditions: (a) impeller1 in 0.73Qd, (b) impeller5 in 0.73 Qd, (c) impeller1 in 1.0 Qd, (d) impeller5 in 1.0 Qd, (e) impeller1 in 1.45 Qd, (f) impeller5 in 1.45 Qd.
Processes 10 02488 g013
Figure 14. Comparative analysis of the VEPR and velocity streamlines between impellers. (a) VEPR of impeller1, (b) VEPR of impeller3, (c) VEPR of impeller5, (d) Streamlines of impeller1, (e) Streamlines of impeller3, (f) Streamlines of impeller5.
Processes 10 02488 g014
Figure 15. Comparative analysis of the WEPR and skin friction coefficient between impellers. (a) WEPR of impeller1, (b) WEPR of impeller3, (c) WEPR of impeller5, (d) τ of impeller1, (e) τ of impeller3, (f) τ of impeller5.
Processes 10 02488 g015
Figure 16. The correlation between WEPR and skin friction coefficient, (a) Pearson correlation coefficient, (b) p-value.
Processes 10 02488 g016
Figure 17. Contour of the VEPR and streamlines at guide vanes.
Processes 10 02488 g017
Figure 18. Vortex core distribution of different impellers at 1.0 Qd, where the Q criterion was used with the iso-surface of Q* = 0.03 and colored by the EGR; (a) the first stage, (b) the third stage, (c) the fifth stage.
Processes 10 02488 g018
Figure 19. Correlation between dissipation effect and entropy production. (a) impeller1, (b) impeller2, (c) impeller3, (d) impeller4, (e) impeller5.
Processes 10 02488 g019
Figure 20. Correlation between transportation effect and entropy production. (a) impeller1, (b) impeller2, (c) impeller3, (d) impeller4, (e) impeller5.
Processes 10 02488 g020
Figure 21. Correlation between dissipation effect and entropy production. (a) guide vane1, (b) guide vane2, (c) guide vane3, (d) guide vane 4, (e) guide vane 5.
Processes 10 02488 g021
Figure 22. Correlation between transportation effect and entropy production. (a) guide vane1, (b) guide vane2, (c) guide vane3, (d) guide vane 4, (e) guide vane 5.
Processes 10 02488 g022
Table 1. Pearson correlation coefficient standard.
Parson Correlation Coefficient RangeCorrelation Level
0.8–1.0Very strong correlation
0.6–0.8Strong correlation
0.4–0.6Medium correlation
0.2–0.4Weak correlation
0.0–0.2Very weak or no correlation
Table 2. p-value standard.
p-Value RangeSignificance Level
<0.05Significant
<0.01Very significant
Table 3. Measurement apparatus’s range and accuracy.
Measurement ApparatusRangeAccuracy (%)
Flow meter2.121–106 m3/h±0.3
Pressure transmitter 10–5 MPa±0.2
Pressure transmitter 20–2.5 MPa±0.2
Torque sensor0–70 N m±0.3
Speed sensor0–13,000 rpm±0.01
Table 4. Main geometric parameters of the Multi-stage PATs.
ParameterValue
Nominal rotating speed n, r/min2900
Nominal flow rate Qd, m3/h27.5
Specific speed ns56.7
Blade number Z5
Impeller inlet diameter D1, mm146
Impeller outlet diameter D2, mm56
Impeller inlet width b, mm6
Inlet volute diameter, mm40
Outlet volute diameter, mm50
Blade inlet angle β, deg27
Table 5. Analysis of grid errors.
Parameters φ   =   H e a d   ( m ) φ   =   E f f i c i e n c y   ( % )
Number of cells (million)N1/N2/N314.6/10.8/7.014.6/10.8/7.0
Grid refinement factorr21/r321.106/1.1561.106/1.156
Computed variables φ 1 / φ 2 / φ 3 203.01/202.46/201.4954.01/53.87/53.59
Apparent orderP1.6472.654
Extrapolated value φ e x t 21 206.6554.94
Approximate relative error e a 21 0.27%0.26%
Extrapolated relative error e e x t 21 1.76%1.69%
Grid convergence index G C I f i n e 21 1.87%1.06%
Publisher’s Note: MDPI stays neutral with regard to jurisdictional claims in published maps and institutional affiliations.