Article

Investigation of Low Cycle Fatigue Behaviors of Inertia-Friction-Welded Joints of the TC21 Titanium Alloy

1
School of Mechanical and Electrical Engineering, Shenzhen Polytechnic, Shenzhen 518055, China
2
School of Materials and Metallurgy, Liaoning University of Science and Technology, Anshan 114051, China
*
Author to whom correspondence should be addressed.
Processes 2022, 10(12), 2548; https://doi.org/10.3390/pr10122548
Submission received: 2 November 2022 / Revised: 20 November 2022 / Accepted: 25 November 2022 / Published: 30 November 2022

Abstract

:
As a new highly damage-tolerant structural material, the TC21 titanium alloy has been widely used in aerospace applications. Inertial friction welding (IFW) is a form of pressure welding technology with less welding parameters and high welding joint performance, which is especially suitable for the connection of rotors of aero-compressors and engines. In this paper, inertia friction welding of TC21 titanium alloys was successfully carried out, and the microhardness, tensile properties and low cycle fatigue (LCF) behaviors of IFW joints were studied. Based on the mechanical parametric results of the tensile test, the true stress–strain curves of the IFW joint of TC21 titanium alloys are obtained by further calculation. Based on the LCF test results under different strain amplitudes, life prediction of IFW joints was investigated. The results of the LCF test show that there is no obvious cyclic hardening and cyclic softening of the IFW joints. Moreover, the fracture morphology of LCF samples under high strain amplitude (0.9%) and low strain amplitude (0.6%) was observed. The results show that the fatigue cracks initiate and propagate at multiple points in the LCF samples, and the transient fracture zone is larger under high strain amplitude. However, under low strain amplitude, a fatigue crack nucleates and propagates at a single point, and the crack propagation zone is larger.

1. Introduction

Since the 1940s, titanium alloys have widely been used in the petrochemical, military, medical, aerospace and other fields due to its excellent advantages, such as low density, high specific strength, low elastic modulus, good corrosion resistance and good heat resistance [1,2,3,4]. TC21 (Ti-6Al-3Mo-2Zr-2Sn-2Nb-1Cr) is a type of α + β two-phase titanium alloy with excellent mechanical properties, especially high damage tolerance, which has been applied to the aerospace field, with the development of recent techniques, for more than a decade [5,6,7]. Welding technology is critical in the application of titanium alloys. However, traditional welding methods cannot realize good welding results for titanium alloys because of its high strength, high melting point and low thermal conductivity. The current welding methods for titanium alloys include brazing, laser welding, friction stir welding, diffusion bonding and so on [8,9,10,11]. Compared with the above technologies, inertia friction welding (IFW) is a solid-state joint technology, and has been widely applied in aerospace and other high-tech fields because it has many advantages, including high quality, high efficiency, environmental friendliness, low heat input, low deformation and narrow welding seam [12,13,14]. During the IFW process, the interface materials are in the state of high temperature thermoplastics without melting. Therefore, IFW can effectively avoid defects such as oxidation slag inclusion, poor fusion, lack of penetration and solidification cracks that often occur in fusion welding methods. Moreover, during the IFW process, the end faces of two welding parts make complete contact with each other and generate rotating friction, thus the IFW joint is relatively uniform, and there is no obvious performance difference between the center and the edge area of the joint. Based on the above advantages, IFW is an extremely suitable method for the welding of rotors of aero-compressors and engines [12].
During practical application, IFW joints of TC21 titanium alloys usually bear large cyclic strain, and this type of strain-controlled fatigue behavior is called strain fatigue [15]. Under the action of large cyclic strain, the alloy can easily induce local plastic deformation, and the damage and fracture occur in relatively few cycles; thus, it is also called low cycle fatigue (LCF). The fracture mechanism of LCF is different from that of high cycle fatigue. For LCF, the fracture occurs under a larger load and fewer cycles. Therefore, it is very important to predict and prevent the fatigue fracture due to low cycle fatigue behavior in practical applications [16,17]. In this paper, in order to understand the actual service condition of IFW joints of the TC21 titanium alloy, the mechanical properties and low cycle fatigue behaviors of the IFW joints were studied.

2. Materials and Methods

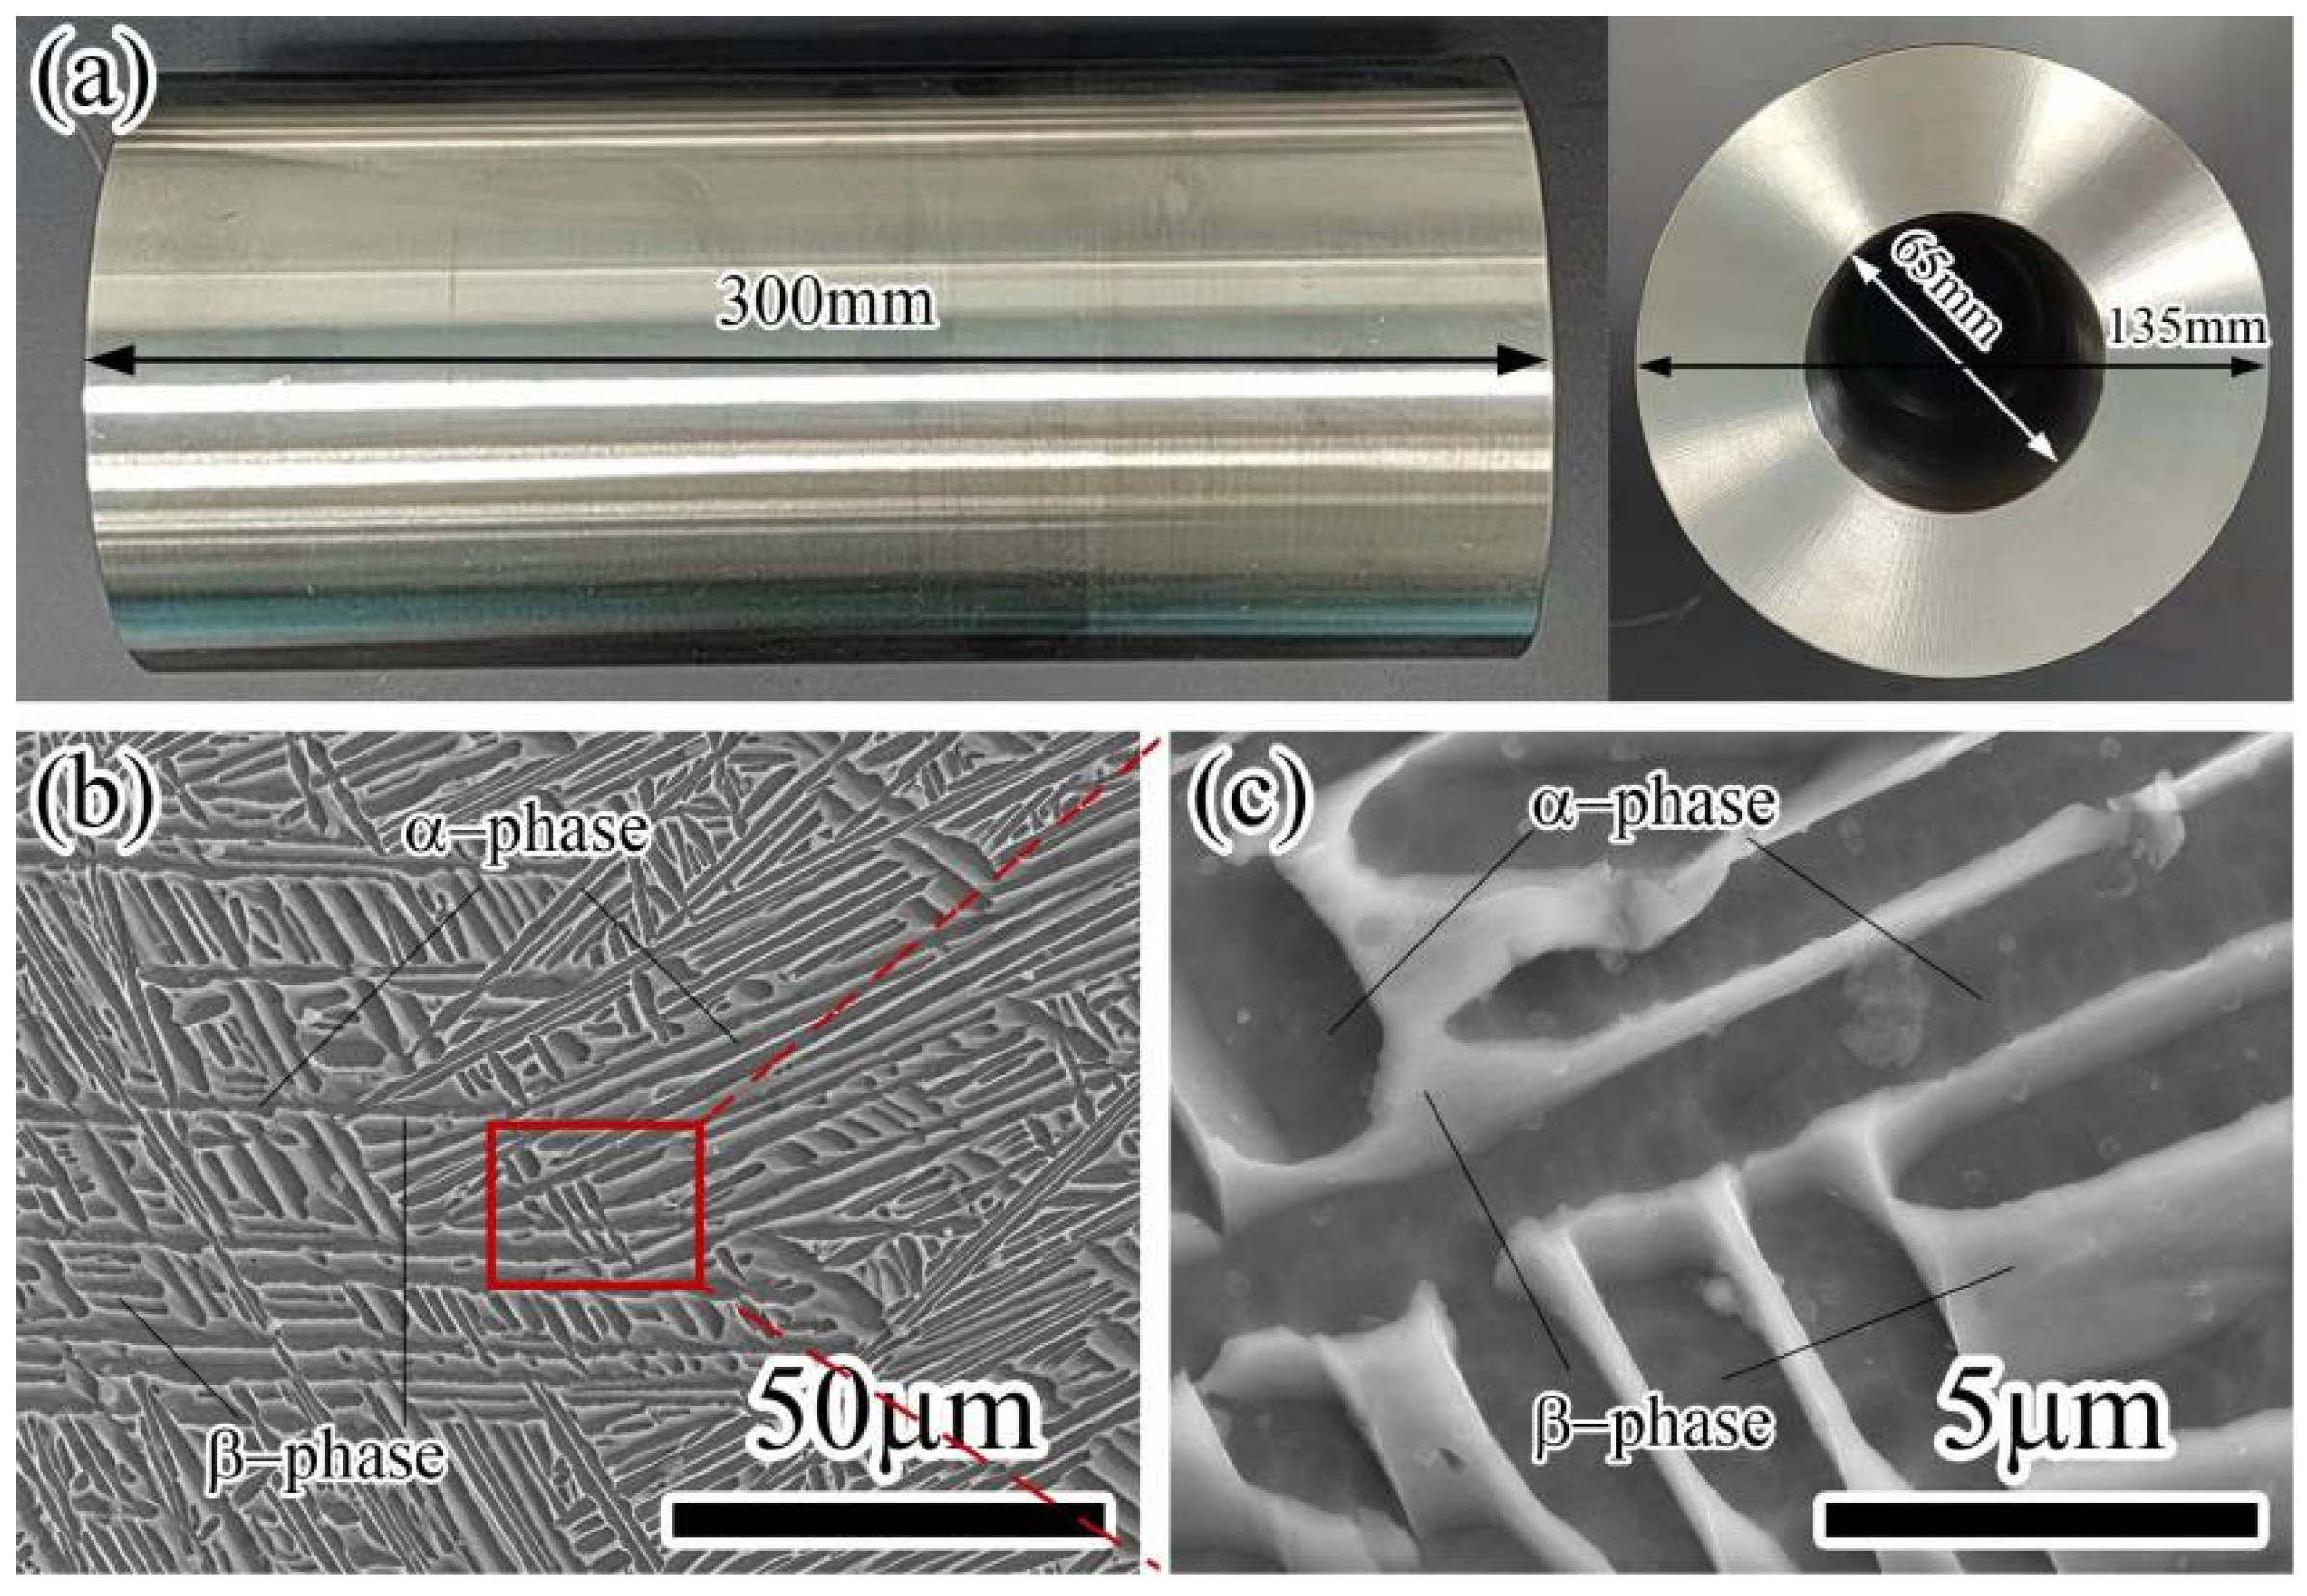
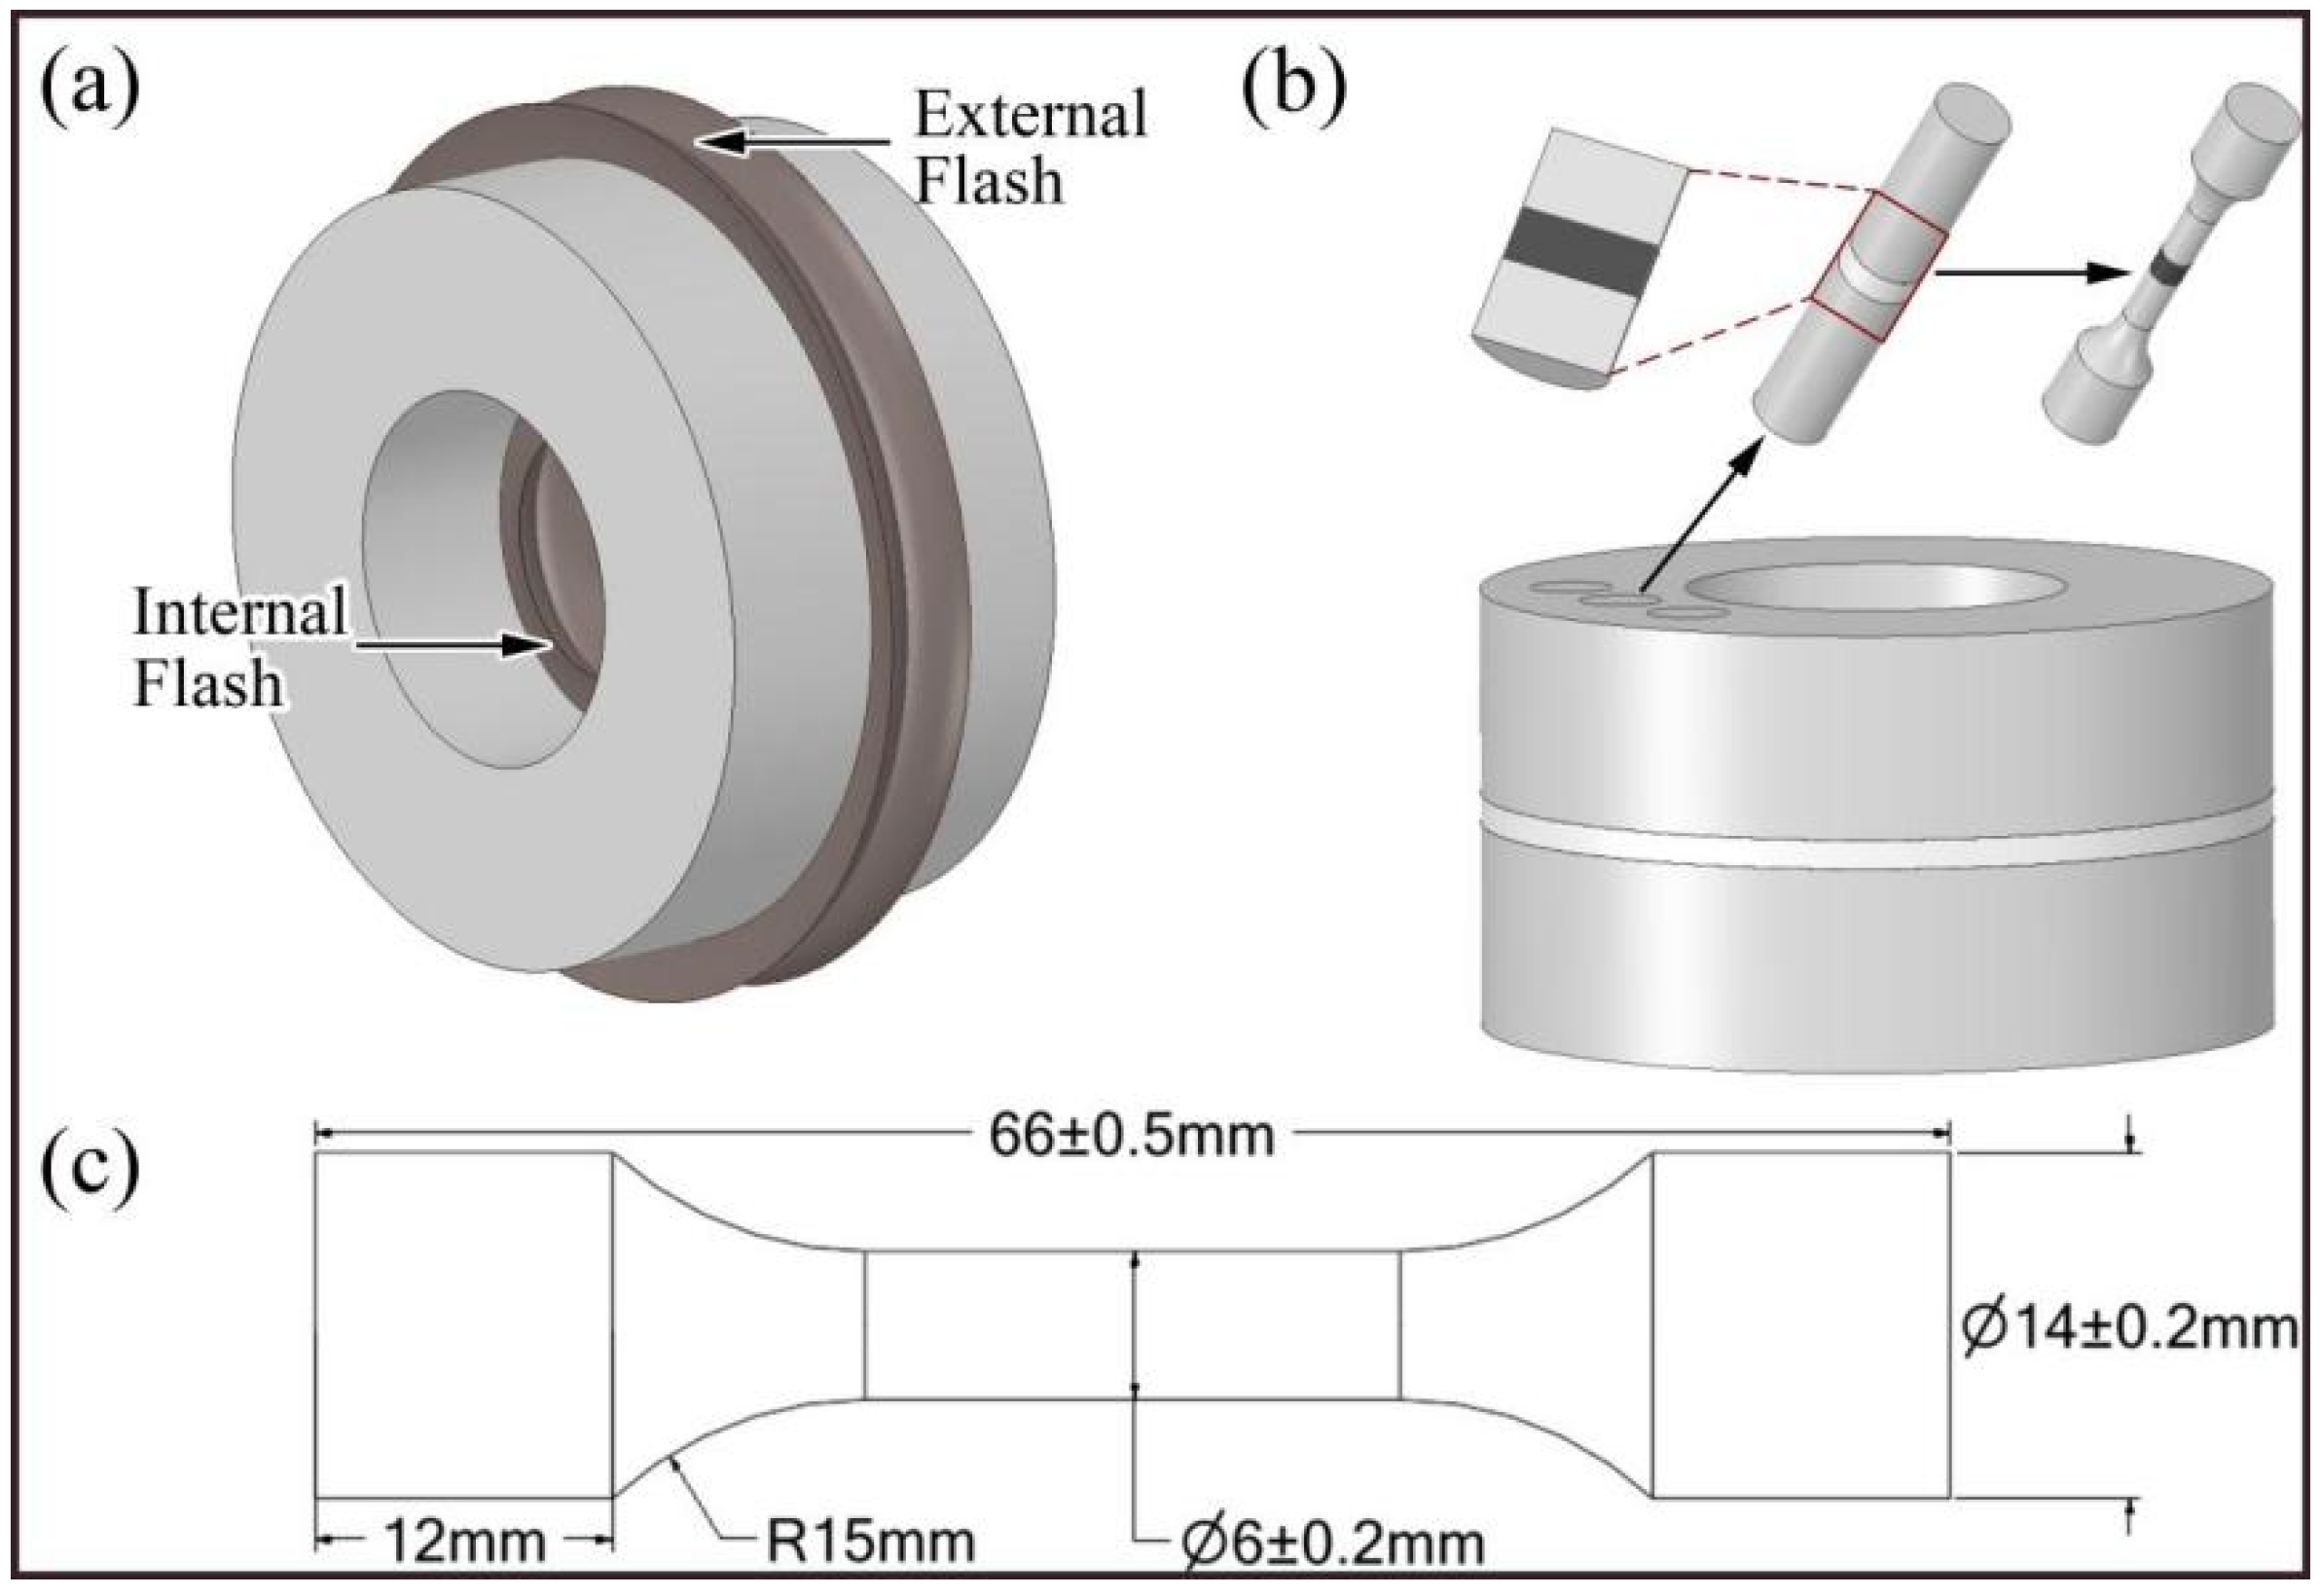
2.1. Material and Sample Preparation

The ring samples of TC21 alloys used in IFW experiments were prepared and forged. Table 1 presents the chemical composition of the material of the TC21 alloy [18]. After forging, the samples were treated by annealing at 850 °C for 2 h. An image of the ring sample and dimensions are shown in Figure 1a [18]. Figure 1b,c show the microstructure of the TC21 samples. It was found that the primitive β grains are destroyed in forging deformation, and the α phases at the β grain boundary are kinked or spheroidized, and distributed in a chain shape. Moreover, the lamellar α phases inside the β grain boundary are cross-distributed with each other and woven into a basket shape. As shown in Figure 1c, the widths of most lamellar α phases were measured within the range of 1–3 μm. The TC21 titanium alloy with this form of basket weave microstructure has excellent mechanical properties and high damage tolerance compared with TC21 alloys with other microstructures. The welding process of two ring samples of TC21 alloys was performed using an HSMZ-130 axial and radial inertia friction welding machine designed by Harbin Welding Institute Limited Company (China). During welding, the initial rotating speed was 700 rpm, moment of inertia was 388 kg·m2, friction pressure was 76 MPa, and upsetting pressure was 102 MPa. After welding, heat treatment of TC21 samples was carried out at 730 °C for 2 h.
After welding, shown as Figure 2a, short ring specimens with lengths of 70 mm were cut from the welded parts, and the IFW joint was located in the middle of the ring specimen; then, the ring specimens were further processed by cutting off the flash. There was no radial or axial crack at the joint, and the color of the untreated welding area was silver-white. As shown in Figure 2b, bar specimens with dimensions of ϕ14 mm and lengths of 70 mm were extracted from the short ring specimens by axially cutting. Microhardness samples were acquired from bar specimens by cutting longitudinally along the axial center. Dumbbell-shaped samples were obtained by further machining the bar specimens, and were used for the tensile test and low cycle fatigue test; the size of a dumbbell-shaped sample is shown in Figure 2c.

2.2. Test Methods

Nanoindentation tests were carried out using a nanoindentation tester (Hysitron TI 980) under 10 mN stress with a test cycle of loading time 5 s, load hold time 2 s and unloading time 5 s. Three test points were randomly selected in the base material and joint central zone, respectively, for nanoindentation measurements. Tensile tests and low cycle fatigue (LCF) tests were conducted at room temperature using an electro-hydraulic servo testing machine (MTS -793). For tensile tests, the loading rate was 1 mm/s and the change point of extensometer was at 3% strain. For LCF tests, triangular strain waveforms with strain amplitudes of 0.6%, 0.65%, 0.7%, 0.8%, 0.9% and 1%, respectively, were used at a constant strain loading rate of 0.01·s−1, the cyclic ratio was R = −1 and the sample was defined as a failure when the final fracture appeared. Three tests were carried out under each strain amplitude, and the fracture surface of the all samples was in the range of the extensometer, so the test results were effective. The morphology of fracture surfaces of IFW joints after the LCF test with strain amplitude of 0.6% and 0.9% were observed by SU8100 scanning electron microscope (SEM).

3. Results and Discussion

3.1. Microhardness

The microstructure and Vickers microhardness of TC21 IFW joints has been tested by Wang and Li et al. [18,19]. The results show that the refinement of the grains and the morphological changes in both α and β phases led to microhardness increasing from BM (base metal), HAZ (heat-affected zone), and TMAZ (thermo–mechanical-affected zone) to WZ (weld zone). In this paper, the surface nanoindentation tests of TC21 IFW joints were carried out. Figure 3a is a schematic diagram of the test, the diagram shows the positions and the number of random measurement points. The surface nanohardness and equivalent Young’s modulus of WZ and BM are shown in Figure 3b,c. Figure 3b depicts that the mean nanohardness of 5.913 GPa for WZ is 18% higher than that of 5.008 GPa for BM, and this result is similar to the axial Vickers microhardness results reported by Li et al. [19]. Figure 3c shows that the mean equivalent Young’s modulus of the WZ is 134.15 GPa, and the mean equivalent Young’s modulus of the BM is 130.24 GPa, which indicates that there is only a small difference in the equivalent Young’s modulus of the two zones.

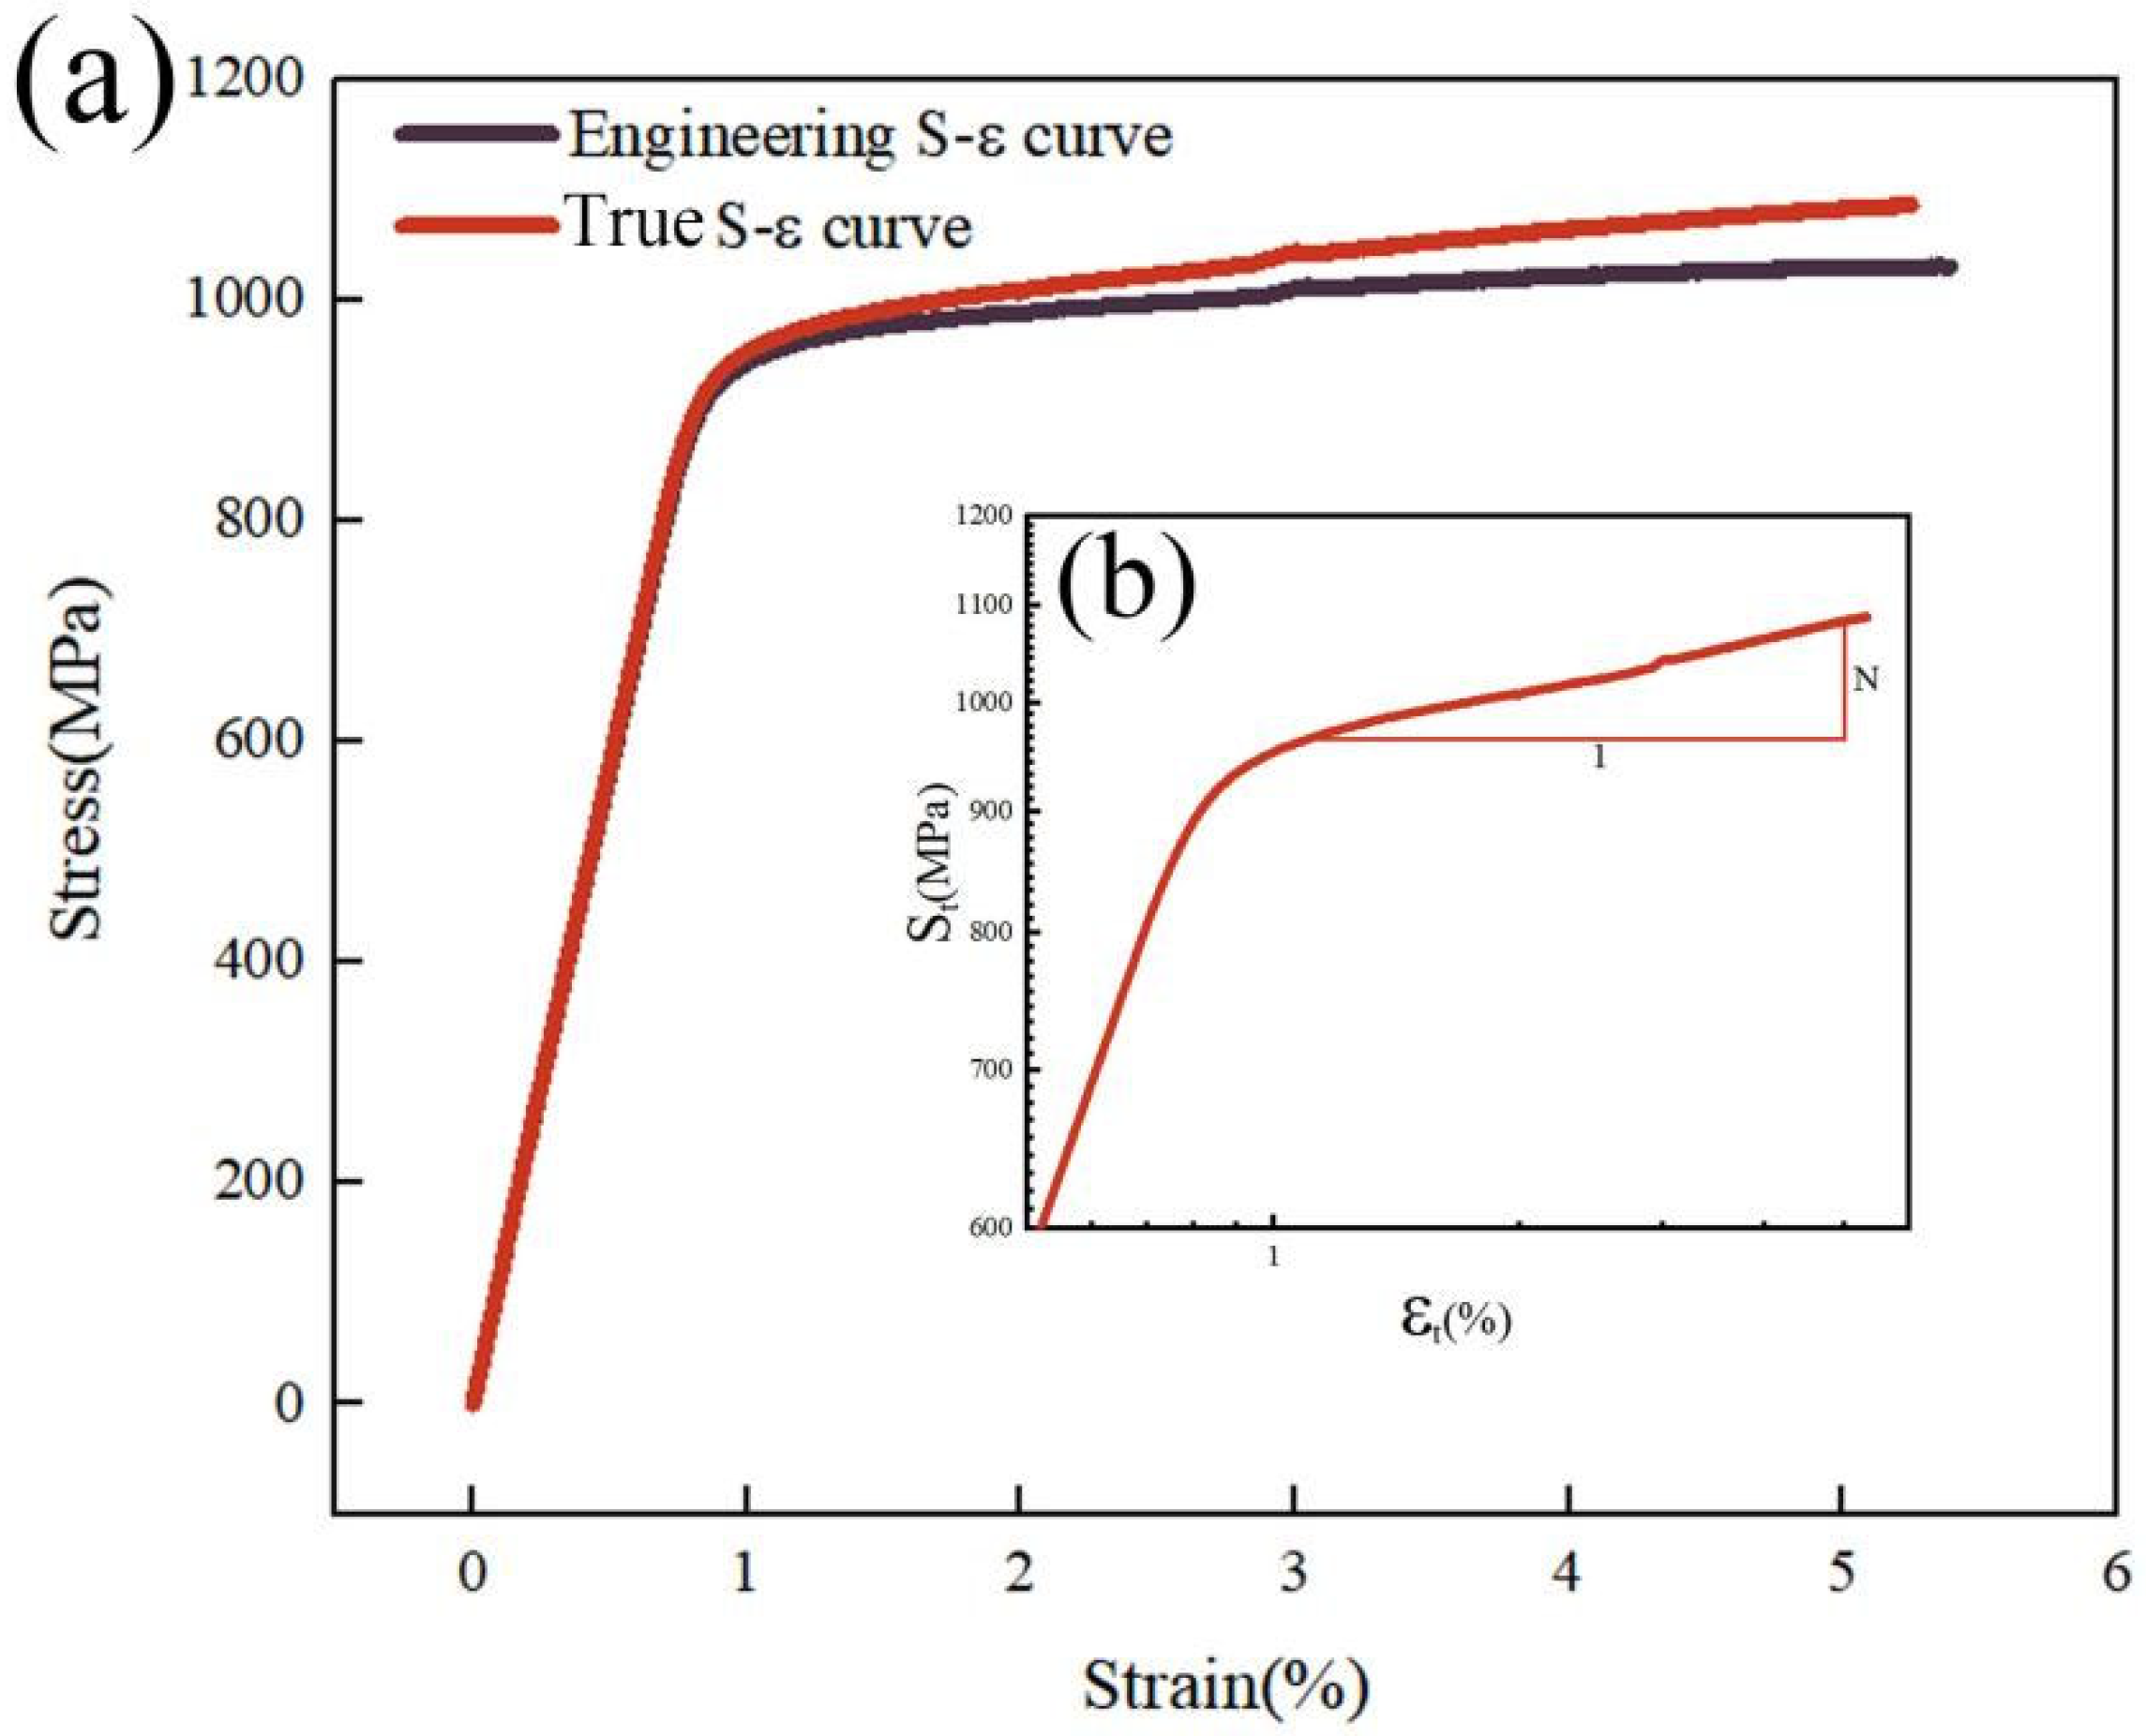
3.2. Results of Tensile Tests

Table 2 shows the parameters obtained from the tensile tests of IFW joints of the TC21 alloy. The fracture positions for all tensile samples are in the BM, far away from WZ; therefore, the weakest point is the base metal area when the IFW joints are subjected to axial tensile force. The modulus of the IFW joint is almost the same as an original alloy (E ≥ 115 GPa), but the offset yield stress and peak stress of the IFW joint are smaller than those of the original alloy (S0.2 ≥ 1000 MPa, SMAX ≥ 1100 MPa) [20].
As shown in Figure 4, in the tensile process, there is no diameter shrinkage in the middle joint zone of the samples. The observation of the microstructure of the TC21 IFW joint by Wang et al. [18] showed that BM was a large-size lamellar α + β structure, while WZ was a very fine α + β needle structure. Grains transformed from BM to WZ become finer, which makes the grain boundary and phase boundary at WZ increase greatly, thus resulting in an increase in the hardness and tensile strength of WZ. The WZ with relatively high tensile strength is located in the middle of the tensile samples, which leads to the diameter shrinkage of the base metal on both sides at the same time. As the force continues to increase, the base metal on one side will shrink more severely, and finally, the fracture occurs. Because the deformations of the joint samples are greater than that of the original alloy sample during the tensile process, the joint sample will fracture in advance, and the mechanical properties of the joint samples will be slightly lower than that of the original alloy samples.
In order to obtain the true stress–strain curve, the correction of engineering stress and strain curve obtained by experiments is performed [21]. As shown in Figure 5a, the true stress–strain (Stt) curve of the IFW joint of the TC21 titanium alloy was obtained by the correction of the engineering stress–strain curve of Test 1. After logarithm conversion of the resulting St and εt, the lgSt-lgεt curve is generated, as shown in Figure 5b. From the curve, two new parameters are obtained, including hardening index N and strength coefficient K. As shown in Figure 5b, the true stress–strain curve of Test 1 is almost linear at the yield stage, where the slope of the yield stage lgεt/lgst is the material hardening index N1, which is calculated to be N1 ≈ 0.074. When the true strain is 1, the corresponding intercept (i.e., the true stress at this time) is the strength coefficient K1. From Figure 5b, we can calculate K1 ≈ 1599.56. By the same calculation method, we obtain N2 ≈ 0.073, K2 ≈ 1538.15 and N3 ≈ 0.076, K3 ≈ 1652.72 from Test 2 and Test 3, respectively.

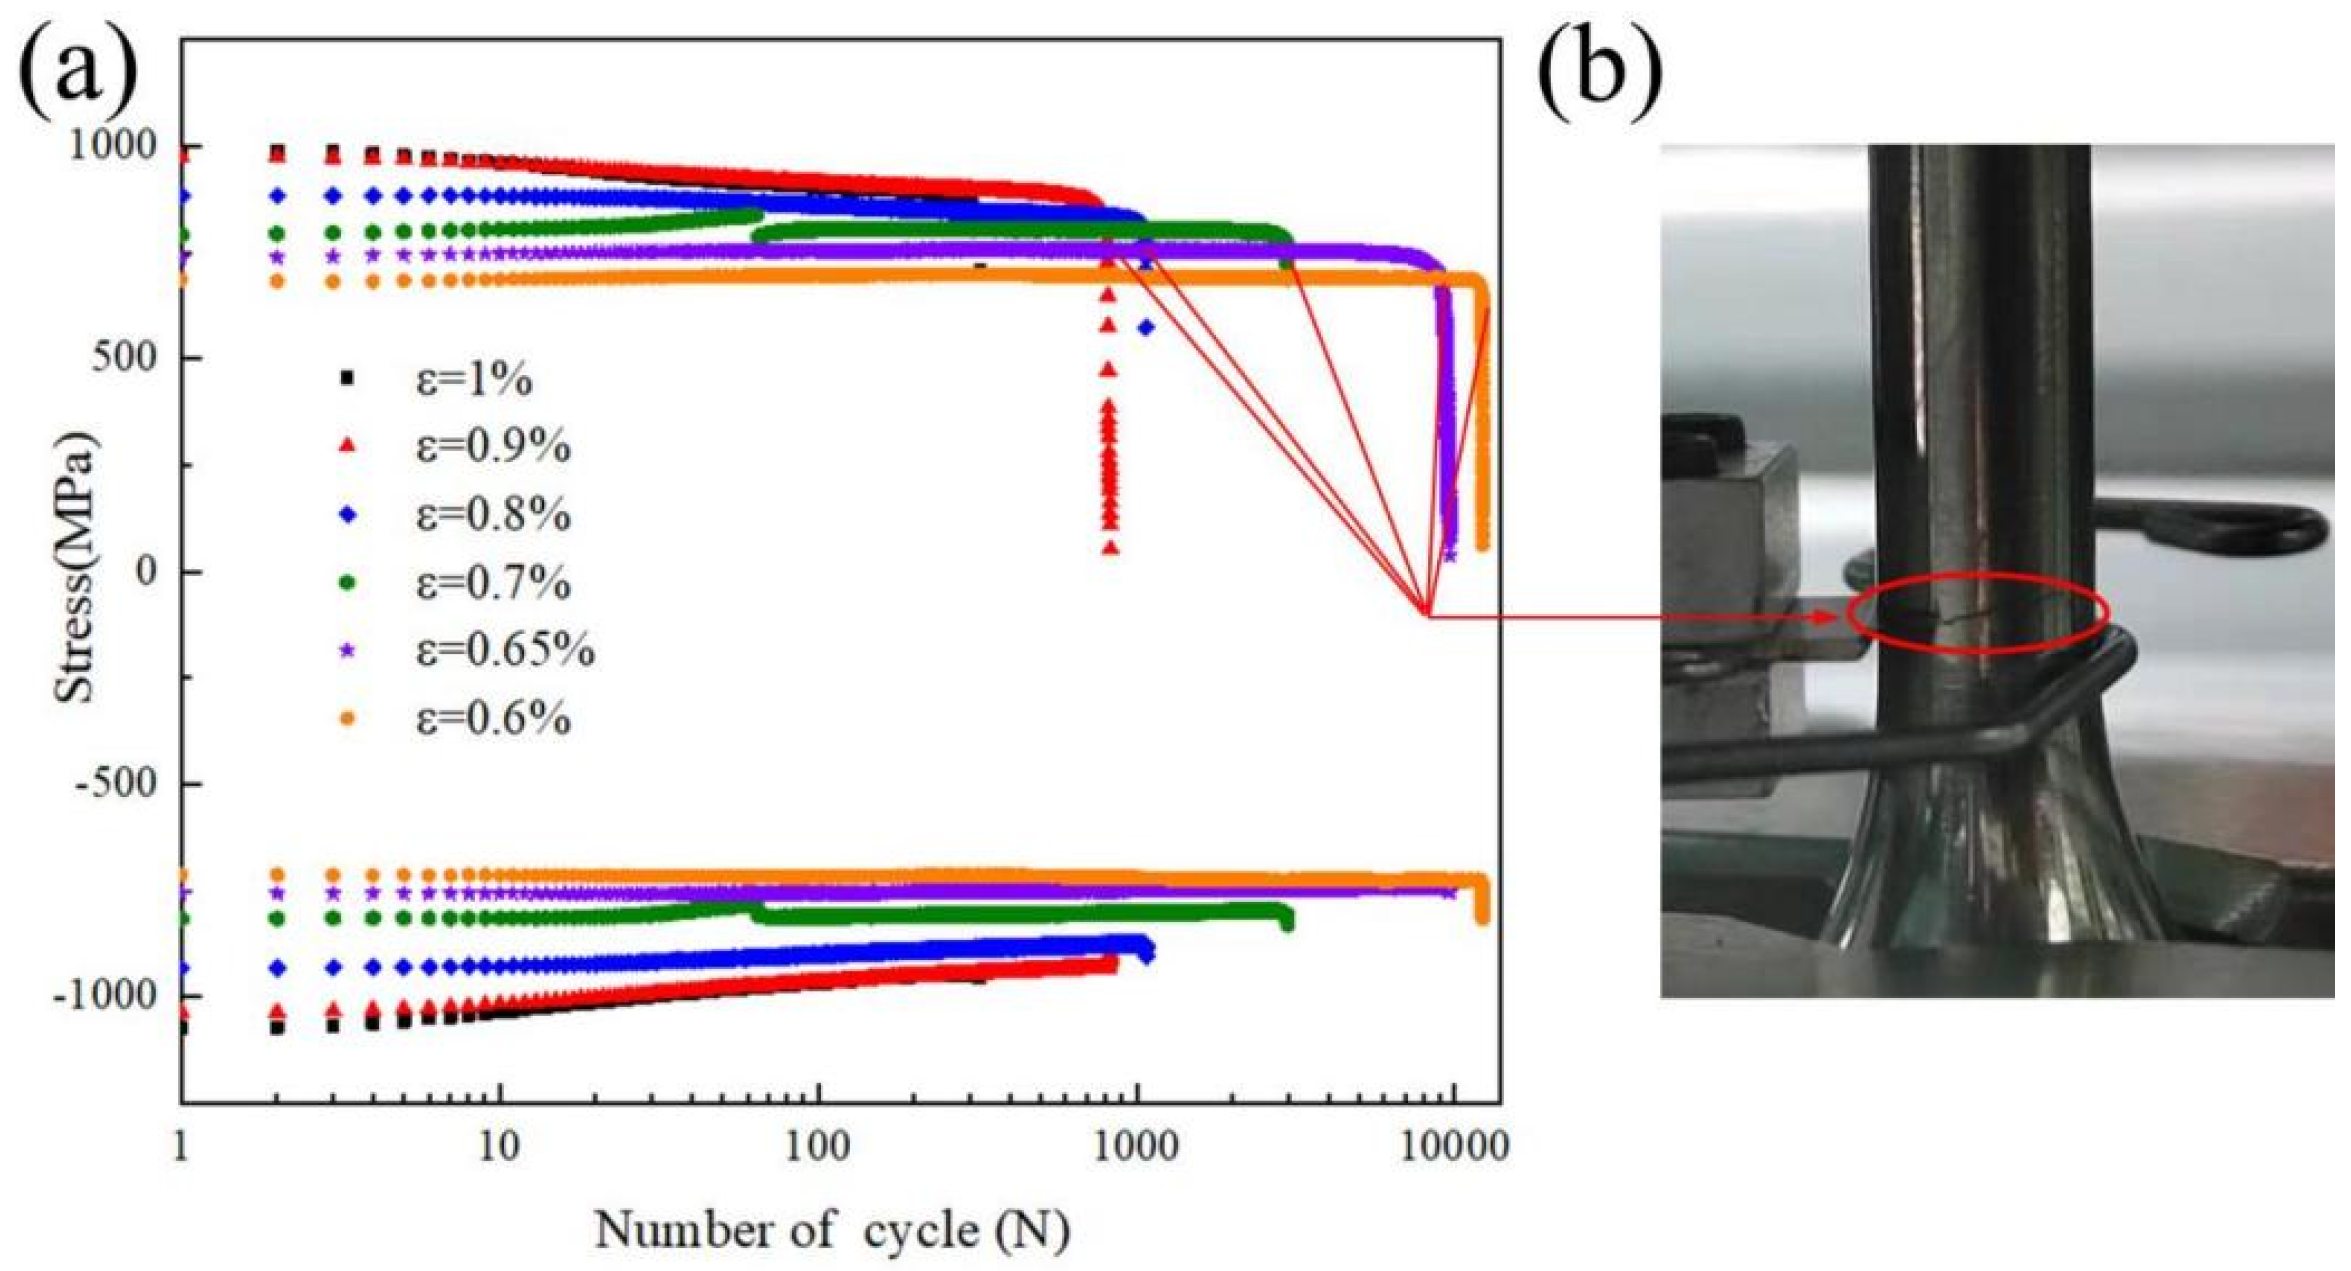
3.3. Test Results of Low Cycle Fatigue (LCF)

Figure 6 shows the cyclic maximum tensile and compressive stress curves (S-N curves) of one of the three LCF tests of TC21 joints. As shown in Figure 6a, it is reasonable that the lifetime increases as the strain amplitude decreases. Moreover, for the curves of 0.6%, 0.65% and 0.9% strain amplitudes, a sharp declining tail of the maximum tensile stress can be observed at the end of the cycle. It is believed that at the end of the test cycle, the obvious crack has already appeared in the LCF sample, as shown in Figure 6b, hence the stress decreases sharply when the sample is cracked but the strain amplitude remains constant. The results of tensile tests show that BM is the weakest point when the IFW joint samples are stretched. The cyclic loading of low cycle fatigue is relatively large, and the zone with low tensile strength is more prone to crack formation. Therefore, the cracks appear at BM during LCF tests. Moreover, the large-sized lamellar α phases and the basal β phases in BM are cross-woven with each other and form a basket weave structure [18], which could prevent the appearance of a crack macro region during crack propagation, and therefore, TC21 material has good damage tolerance properties. Consequently, the LCF sample will not break suddenly even if the crack has already extended very deep when the strain amplitude is relatively low. However, the LCF sample will break suddenly under a relatively high strain amplitude. From the LCF S-N curves, it is also observed that there is no cyclic hardening at any strain amplitude, and cyclic softening only occurred at large strain amplitudes for TC21 joints. For the curve of 0.7% strain amplitude, an interruption was found at about 80 cycles. This is because the external force causes the LCF test suspended at about 80 cycles. The test conditions before and after the suspension are exactly the same, the test cycles before the interruption only account for 3% of the test cycle life, so it has little influence on the test results.
Figure 7a–f present plots of the stress–strain hysteresis curves of the LCF samples after 1/3, 2/3 and near the end of the test cycle at the strain amplitudes of 1%, 0.9%, 0.8%, 0.7%, 0.65% and 0.6%, respectively. With the increase in strain amplitude, the stress–strain hysteresis loop is more rounded. It is also observed that there is almost no hysteresis loop when the strain amplitude is less than 0.7%. The reason for this is that there is almost no plastic deformation in the IFW joint of TC21 titanium alloys when the strain amplitude is lower than 0.7%. In Figure 7a–c, in which hysteresis loops are presented, only the hysteresis curves of the sample at 1% strain amplitude change slightly with the increase in the number of test cycles, in contrast, there is almost no change for the hysteresis curves at 0.9% and 0.8% strain amplitude (Figure 7b,c) with the increase in the number of test cycles, which also indicates that the cyclic softening of TC21 alloy is not obvious.
Table 3 shows the measured results at half-life for all nine LCF test samples at strain amplitudes of 1%, 0.9% and 0.8%. The specific values for each sample and mean values for each strain amplitude are obtained, including total stress Δ stotal, total strain Δ etotal, half-life modulus E, elastic strain ee and plastic strain ep.
For the prediction of strain–life curves ( ε -N) of LCF, the stress–strain hysteretic curve at half-life is normally used for analysis and prediction. The sample has both elastic strain and plastic strain in the process of one-time tensile and compressive tests, so the total strain is defined as the sum of the elastic and plastic strain [22]. The elastic strain at half-life is derived from Hug’s law via σ = E ε , and E is half-life modulus.
The strain–life curves are usually expressed in half amplitude ( Δ ε /2) of the total strain and reversals to failure (2Nf), and half amplitude of the total strain is expressed as follows:
Δ ε / 2 = Δ ε e + Δ ε p = σ / 2 E + Δ ε p / 2 ,
where Δ ε is the range of total strain, Δ ε e is elastic strain amplitude, Δ ε p is plastic strain amplitude, σ is total stress.
The plastic strain amplitude is obtained from Manson–Coffin fatigue model:
Δ ε p / 2 = ε f ( 2 N f ) c ,
Then the range of total stress is expressed by Basquin’s equation:
Δ σ / 2 = σ f ( 2 N f ) b ,
From Equations (1)–(3), half amplitude of the total strain can be expressed as:
Δ ε / 2 = σ f E ( 2 N f ) b + ε f ( 2 N f ) c ,
where σ f is fatigue strength coefficient, N f is fatigue test cycles, ε f is the fatigue ductility coefficient, b is fatigue strength exponent, c is the fatigue ductility exponent.
Equation (4) is the prediction curve considering the interaction of elastic strain and plastic strain, and it is also the basis of all present phenomenological life prediction methods [22].
In Equation (4), there are four unknown parameters. To determine these four parameters, Table 4 lists the expressions for four prediction methods, including (a) the Manson general slope method reported in 1965 [23]; (b) Muralidharan–Manson improved expression that introduced a new correction parameter in 1998 based on the Manson general slope method [24]; (c) Bäumel–Seeger parametric expression that was obtained from a large number of experiments of titanium alloys in 1990 [25]; (d) the parametric expression that was obtained by Yao Weixing on the basis of the general slope method and summary of several prediction methods in 2003 [26].
The true stress expression of fracture is shown in Equation (5), and the true strain expression of fracture is shown in Equation (6):
σ f = σ b 1 ψ ,
ε f = ln 1 1 - ψ ,
We define that σb is the strength limit, ψ is the shrinkage in cross-section, σf is the true stress and εf is the true strain. The values of σb, E and ψ are selected from Table 3, which presents the average values of tensile test results of TC21 IFW joint. Consequently, σb = 1025.1 MPa; E = 114795.7 MPa; ψ =14.95%. From Equation (5), σf = 1205.3 MPa. From Equation (6), εf = 16.19%.
Figure 8 shows the fracture cycle of the predicted curves from the four prediction methods and the actual test data of fracture life cycle under different strain amplitudes. It can be found that, when the strain amplitudes are at 1%, 0.9% and 0.8%, that is, the fatigue behavior is strain fatigue with plastic strain, the prediction curves 1 and 4 are the most accurate and consistent with the actual test results. If only the number of cycles is considered, the fatigue behavior of samples at strain amplitude less than 0.7% can also be thought as low cycle fatigue, but the fracture mechanism is not based on the strain fatigue mechanism of Equation (1). Therefore, to judge whether the strain fatigue prediction curve based on Equation (1) is accurate, we should consider the cases in which the strain amplitude is higher than 0.7%. From the Figure 8, the conclusion can be drawn that when the strain amplitude is higher than 0.7%, prediction methods 1 and 4 are more accurate. When the strain amplitude is less than 0.7%, method 3 is more accurate.
Figure 9 shows the fracture morphology of the LCF sample at 0.9% strain amplitude, where the strain amplitude exceeds the offset yield strength of the IFW joint, so the fatigue crack enters the propagation zone directly. The middle image in Figure 9 is an overall fracture morphology map at low microscope magnification. Because the fracture shear lip is very large and the fracture height difference is very high, the upper part of the image of the overall fracture morphology is relatively blurry. Figure 9a–e display the SEM images corresponding to the Regions 1–5 marked in the overall image. As shown in Figure 9a,b, distinct fatigue striations are observed, and are further clearly displayed in the illustration of images in bottom left corner. As we know, fatigue striations are the marks of the crack propagation zone. This means that crack propagations in Regions 1 and 2 are simultaneously found, which indicates that the crack initiation and propagation simultaneously happen at multiple points in the LCF samples of IFW joints under this strain amplitude. Moreover, all of these small striations appear at the edge of the cross-section of the LCF samples, which shows that the IFW joint is also consistent with the rule of fatigue crack directly entering the propagation zone without the nucleation zone under the large strain amplitude. Figure 9c (corresponding to the Region 3) shows the transition zone between the crack propagation zone and the fracture zone, where a distinct difference can be observed on both sides of the boundary line. Fatigue striations can still be observed below the boundary line, but the width of striations here is larger than that of striations at the edge, and small dimples can be found above the boundary line. Therefore, it can be concluded that the cracks propagate and end at this region. Figure 9d,e show the morphology of fracture zones corresponding to Regions 4 and 5, respectively, where no fatigue striation is observed and dimples are formed. Because the TC21 alloy is a ductile material, dimples will appear during fracture. Therefore, it is confirmed that these two regions are transient fracture zones.
Figure 10 shows the fracture morphology of the LCF sample at 0.6% strain amplitude, where the strain amplitude does not exceed the offset yield strength of the IFW joint, so the fatigue behavior of the LCF sample goes through three zones, including nucleation, propagation and fracture. It is known that fatigue cracks generally start nucleation on the sample surface due to surface roughness and defects caused by surface machining. An overall fracture morphology map at low microscope magnification is shown in the left image of Figure 10, where the river patterns can be observed. It demonstrates that crack nucleation and propagation is the mode of surface single point. The reason for this is that 0.6% strain amplitude is relatively low, and the stress does not reach the offset yield strength of the IFW joint, so the simultaneous occurrence of multiple crack nucleation points is impossible. Figure 10a shows the morphology in the fracture direction of the main crack, and the crack propagates from top to bottom. Figure 10b–g display the microstructures of the corresponding regions marked in Figure 10a. Figure 10b shows the microstructure of nucleation zone, where the river patterns converge upward and no fatigue striation is observed. In Figure 10c,d, fatigue striations can obviously be observed, which indicates that these two regions are propagation zones of the crack. Moreover, more “small cracks” can be observed in Figure 10d compared with Figure 10c due to crack propagation. In Figure 10e, fatigue striations are no longer observed, but many “deep cracks” propagating downward can be found. Moreover, there are no fracture dimples observed here. As a result, it is concluded that this region is the end of the fatigue crack propagation zone. In Figure 10f, the dimple-like morphology can be observed in the upper half of the image, while relative smooth morphology is shown in the lower half. Figure 10e shows the same smooth morphology with the lower half of Figure 10f. We can see that the morphology of fracture zones at strain amplitudes of 0.6% and 0.9% are different. Fracture zone is much larger at high strain amplitude, which is similar to the axial tensile fracture zone, where final fracture surface will occur with a large number of dimples toward the top. In contrast, the propagation zone is larger at low strain amplitude, the fatigue crack has already propagated very deep, and the transient fracture zone is smaller. Therefore, the mode of final fracture at low strain amplitude is tearing fracture, and the final fracture surface shows tearing morphology.

4. Conclusions

(1)
Inertial friction welding (IFW) of TC21 titanium alloy was successfully carried out. Relatively narrow IFW joints (about 5.1 mm) were achieved under suitable process parameters.
(2)
The approximation of nanohardness of the IFW weld zone is 5.913 GPa, which is 18% higher than that of BM (5.008 GPa). The approximation of equivalent Young’s modulus of the weld zone is 134.15 GPa, which is only 3% higher than that of BM (130.24 GPa).
(3)
The tensile tests show that the offset yield strength of IFW joints is about 941.6 MPa, peak stress is about 1025.1 MPa, elastic modulus is about 114.80 GPa, hardening index is about 0.074 and strength coefficient is about 1596.81.
(4)
The results of the low cycle fatigue test show that there is no obvious cyclic hardening and cyclic softening of IFW joints of TC21 aluminum alloys. There is almost no hysteresis loop when the strain amplitude is lower than 0.7%, because there is almost no plastic deformation in IFW joints under low strain amplitude.
(5)
The results of LCF life prediction show that the Manson general slope method and Yao Weixing corrected parametric method are suitable for LCF life prediction of the IFW joints of TC21 titanium alloys.
(6)
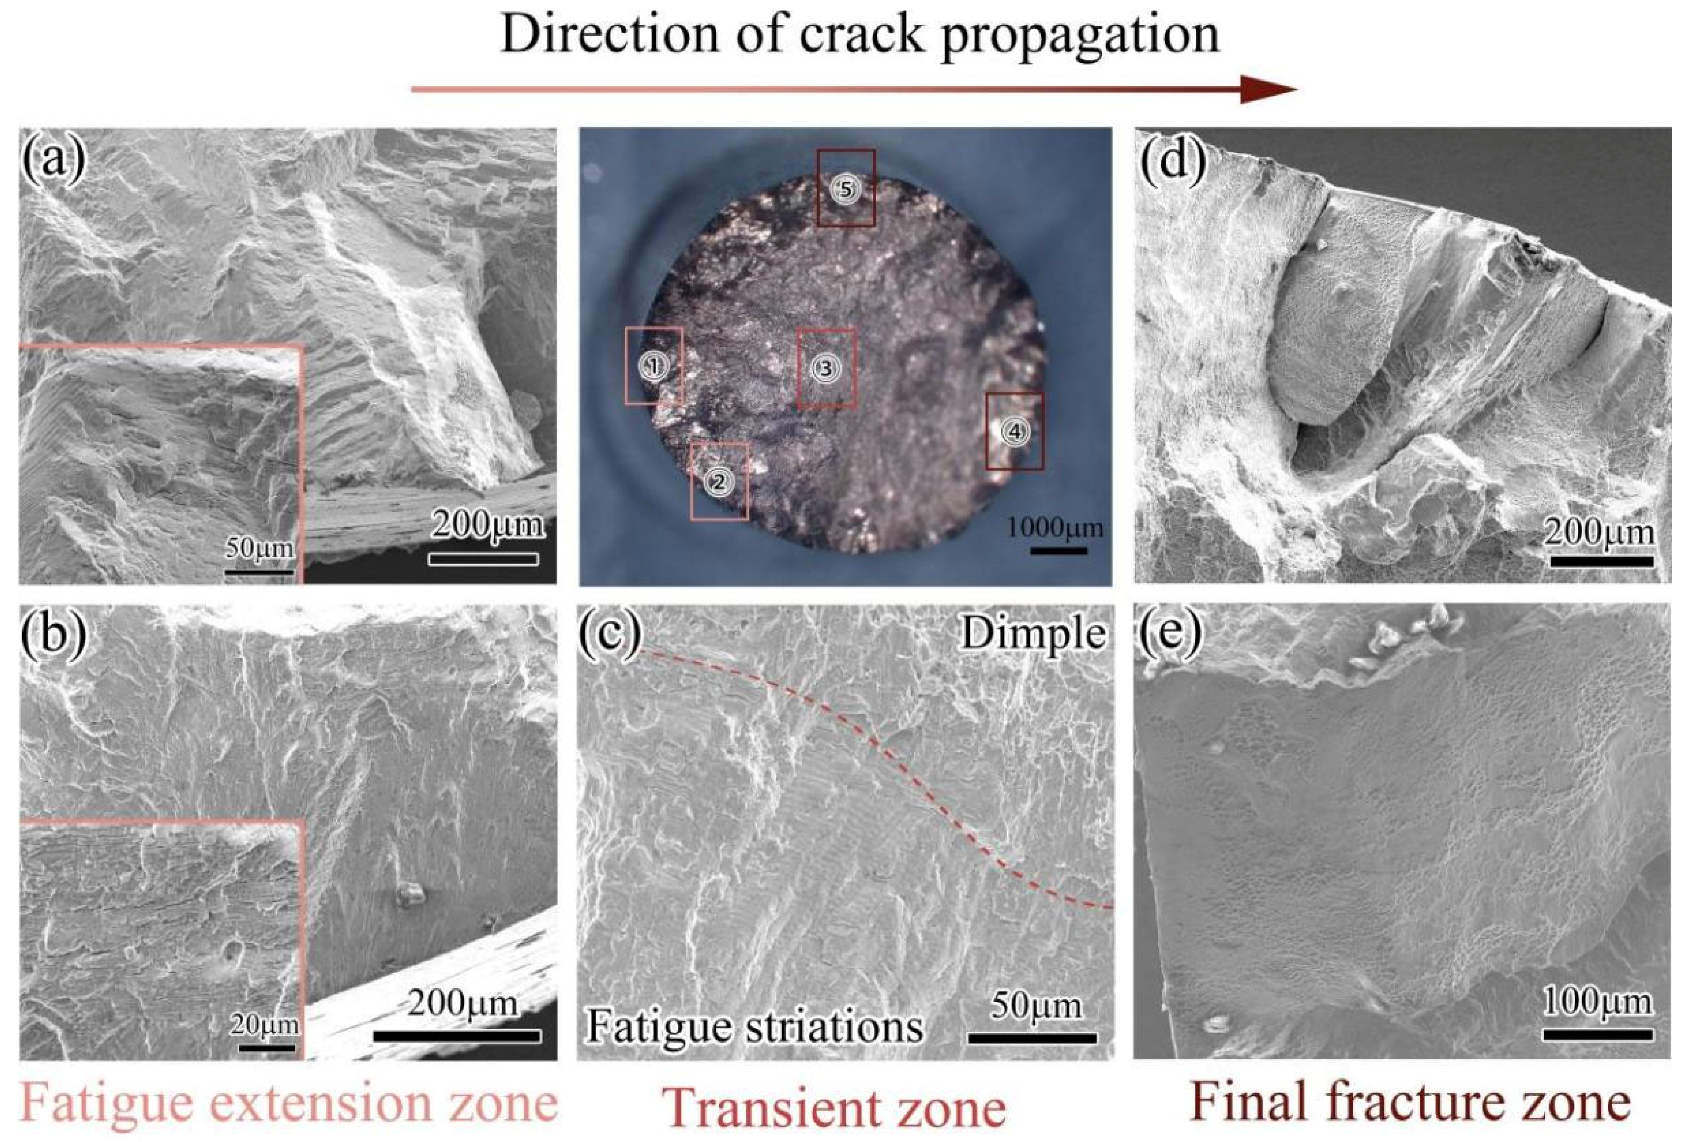
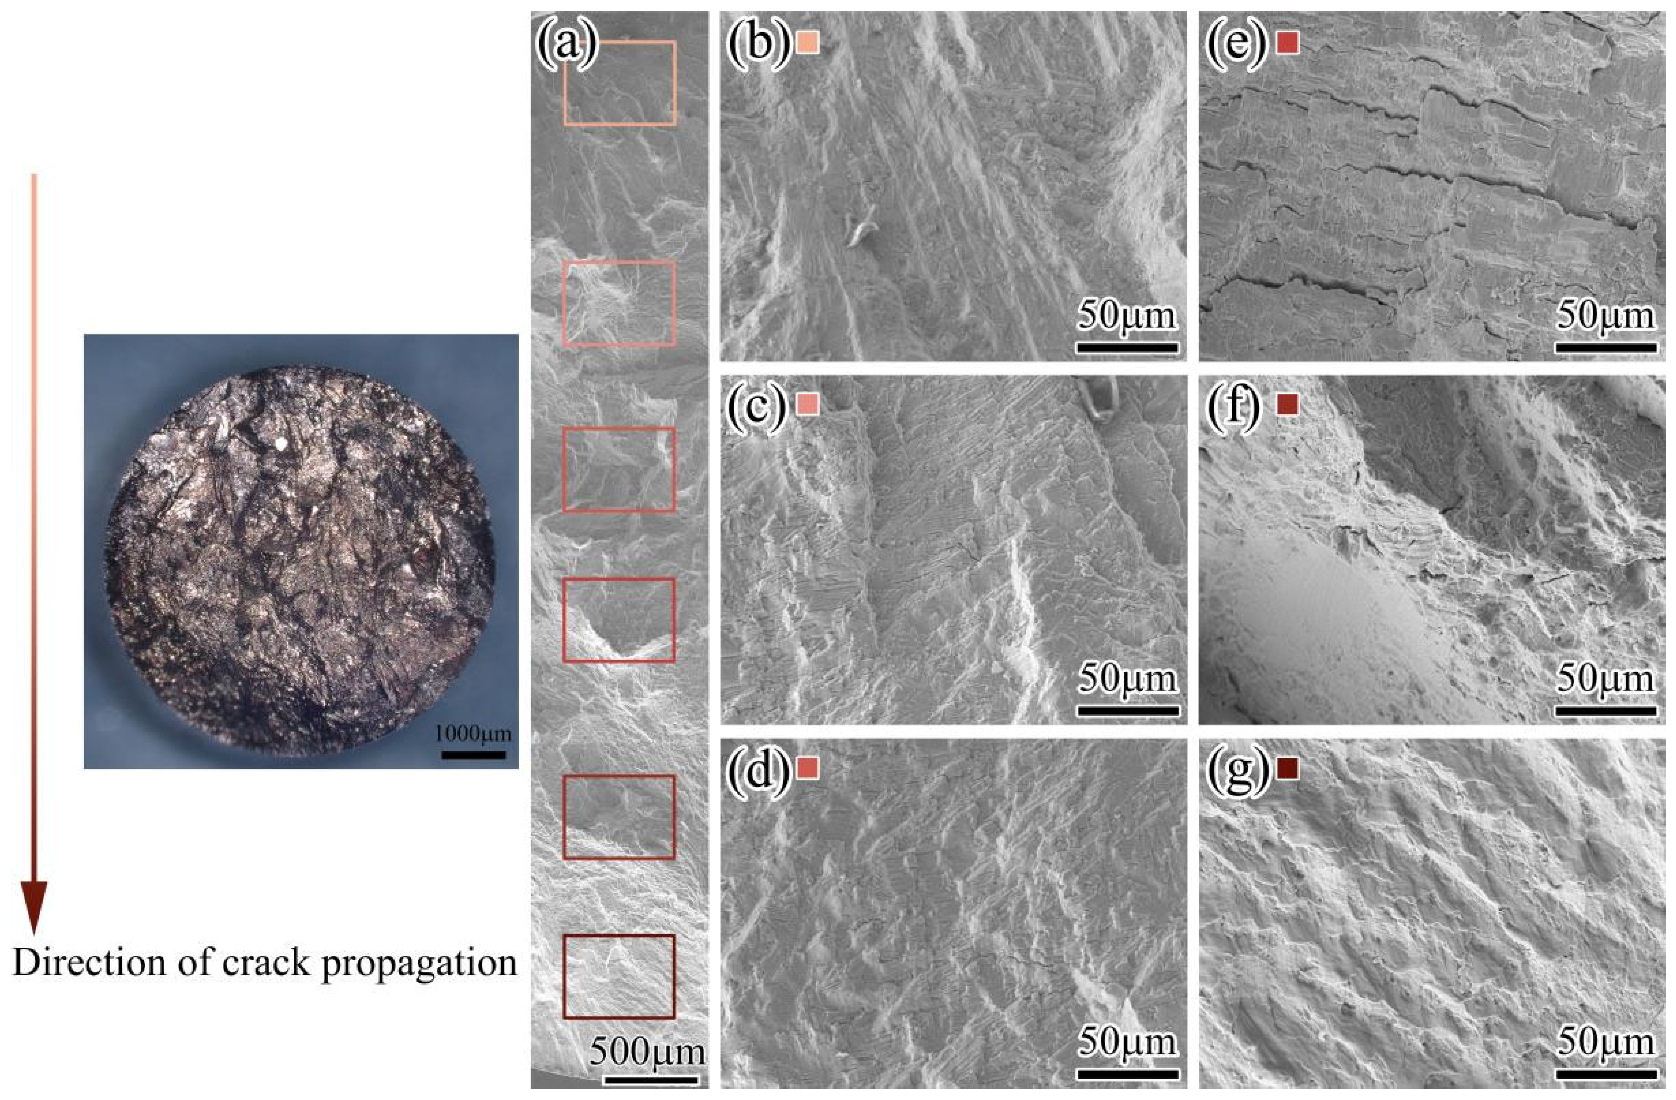
The results of fracture morphology show that the fatigue cracks initiate and propagate at multiple points in the LCF samples, and the transient fracture zone is larger under high strain amplitude. However, under low strain amplitude, a fatigue crack nucleates and propagates at a single point, and the crack propagation zone is larger.

Author Contributions

H.W. and F.W. designed and supervised the experiments and test methods; Z.L. (Zihao Li) and H.W. were in charge of IFW experiments and the test of microhardness, tensile properties and low cycle fatigue; S.Z., Z.L. (Zhijun Li) and W.T. assisted with sampling and data analyses. H.W. and Z.L. (Zihao Li) were responsible for writing and editing the manuscript. All authors have read and agreed to the published version of the manuscript.

Funding

This research was funded by the Shenzhen Science and technology R & D Fund: JCYJ20190809150001747.

Data Availability Statement

All data used to support the findings of this study are included within the article.

Conflicts of Interest

The authors declare no conflict of interest.

References

  1. Li, G.X.; Chandra, S.; Rashid, R.A.R.; Palanisamy, S.; Ding, S.L. Machinability of Additively Manufactured Titanium Alloys: A Comprehensive Review. J. Manuf. Process. 2022, 75, 72–99. [Google Scholar] [CrossRef]
  2. Mi, G.B.; Huang, X.; Cao, J.X.; Cao, C.X.; Huang, X.S. Frictional Ignition of Ti40 Fireproof Titanium Alloys for Aero-Engine in Oxygen-Containing Media. Trans. Nonferrous Met. Soc. China 2013, 23, 2270–2275. [Google Scholar] [CrossRef]
  3. Williams, J.C.; Boyer, R.R. Opportunities and Issues in the Application of Titanium Alloys for Aerospace Components. Metals 2020, 10, 705. [Google Scholar] [CrossRef]
  4. Cui, C.X.; Hu, B.M.; Zhao, L.C.; Liu, S.J. Titanium Alloy Production Technology, Market Prospects and Industry Development. Mater. Des. 2011, 32, 1684–1691. [Google Scholar] [CrossRef]
  5. Qian, X.H.; Duan, X.Y.; Zou, J.Y. Effects of Different Tool Microstructures on the Precision Turning of Titanium Alloy Tc21. Int. J. Adv. Manuf. Technol. 2020, 106, 5519–5526. [Google Scholar] [CrossRef]
  6. Hui, L.; Zhao, Y.S.; Zhou, S.; An, J.L.; Wang, L. Analysis of Corrosion Fatigue Properties of Notched Tc21 Titanium Alloy. Rare Met. Mater. Eng. 2020, 49, 2706–2711. [Google Scholar]
  7. Song, J.W.; Tan, C.S.; Sun, Q.Y.; Xiao, L.; Zhao, Y.Q.; Sun, J. Effect of Step-Quenching on Microstructure and Mechanical Properties of Tc21 Titanium Alloy. Rare Met. Mater. Eng. 2019, 48, 1260–1266. [Google Scholar]
  8. Muhrat, A.; Puga, H.; Barbosa, J. Low-Temperature Brazing of Titanium Using Al-Based Filler Alloys. Adv. Mater. Sci. Eng. 2018, 2018, 4570120. [Google Scholar] [CrossRef] [Green Version]
  9. Auwal, S.T.; Ramesh, S.; Yusof, F.; Manladan, S.M. A Review on Laser Beam Welding of Titanium Alloys. Int. J. Adv. Manuf. Technol. 2018, 97, 1071–1098. [Google Scholar] [CrossRef]
  10. Mironov, S.; Sato, Y.S.; Kokawa, H. Friction-Stir Welding and Processing of Ti-6al-4v Titanium Alloy: A Review. J. Mater. Sci. Technol. 2018, 34, 58–72. [Google Scholar] [CrossRef]
  11. Mo, D.F.; Song, T.F.; Fang, Y.J.; Jiang, X.S.; Luo, C.Q.; Simpson, M.D.; Luo, Z.P. A Review on Diffusion Bonding between Titanium Alloys and Stainless Steels. Adv. Mater. Sci. Eng. 2018, 2018, 8701890. [Google Scholar] [CrossRef] [Green Version]
  12. Wu, Y.Q.; Zhang, C.B.; Zhou, J.; Liang, W.; Li, Y.L. Analysis of the Microstructure and Mechanical Properties During Inertia Friction Welding of the near-Alpha Ta19 Titanium Alloy. Chin. J. Mech. Eng. 2020, 33, 88. [Google Scholar] [CrossRef]
  13. Liu, Y.; Zhao, H.Y.; Peng, Y.; Ma, X.F. Microstructure and Tensile Strength of Aluminum/Stainless Steel Joint Welded by Inertia Friction and Continuous Drive Friction. Weld. World 2020, 64, 1799–1809. [Google Scholar] [CrossRef]
  14. Yang, J.; Li, J.L.; Jin, F. Effect of Welding Parameters on High-Temperature Tensile and Fatigue Properties of Fgh96 Inertia Friction Welded Joints. Weld. World 2019, 63, 1033–1053. [Google Scholar] [CrossRef]
  15. Nie, B.H.; Song, Y.; Huang, X.Y.; Qi, H.Y.; Zhao, Z.H.; Chen, D.C. Low Cycle Fatigue Behavior of Tc21 Titanium Alloy with Bi-Lamellar Basketweave Microstructure. Crystals 2022, 12, 796. [Google Scholar] [CrossRef]
  16. Kang, G.Z.; Luo, H.L. Review on Fatigue Life Prediction Models of Welded Joint. Acta Mech. Sin. 2020, 36, 701–726. [Google Scholar] [CrossRef]
  17. Singh, V. Effects of Prior Cold Working on Low Cycle Fatigue Behavior of Stainless Steels, Titanium Alloy Timetal 834 and Superalloy in 718: A Review. Trans. Indian Inst. Met. 2010, 63, 167–172. [Google Scholar] [CrossRef]
  18. Wang, H.Y.; Li, Z.H.; Zhao, S.S.; Li, Z.J.; Tang, W.J.; Wu, F.Y.; Zhou, J. Microstructure Evolution of Inertia Friction Welded Joints of Tc21 Titanium Alloy. Processes 2022, 10, 1086. [Google Scholar] [CrossRef]
  19. Li, Z.H.; Zhao, S.S.; Li, Z.J.; Wang, M.; Wu, F.Y.; Wang, H.Y.; Zhou, J. Investigation of the Mechanical Properties of Inertia-Friction-Welded Joints of Tc21 Titanium Alloy. Processes 2022, 10, 752. [Google Scholar] [CrossRef]
  20. Shi, Z.F.; Guo, H.Z.; Liu, R.; Wang, X.C.; Yao, Z.K. Microstructure and Mechanical Properties of Tc21 Titanium Alloy by near-Isothermal Forging. Trans. Nonferrous Met. Soc. China 2015, 25, 72–79. [Google Scholar] [CrossRef]
  21. Cai, W.Y.; Morovat, M.A.; Engelhardt, M.D. True Stress-Strain Curves for Astm A992 Steel for Fracture Simulation at Elevated Temperatures. J. Constr. Steel Res. 2017, 139, 272–279. [Google Scholar] [CrossRef]
  22. Lv, F.; Yang, F.; Duan, Q.Q.; Yang, Y.S.; Wu, S.D.; Li, S.X.; Zhang, Z.F. Fatigue Properties of Rolled Magnesium Alloy (Az31) Sheet: Influence of Specimen Orientation. Int. J. Fatigue 2011, 33, 672–682. [Google Scholar] [CrossRef]
  23. Manson, S.S. Fatigue: A complex subject: Some simple approximations. Exp. Mech. 1965, 5, 193–226. [Google Scholar] [CrossRef] [Green Version]
  24. Muralidharan, U.; Manson, S.S. Materials universal slopes equation for estimation of fatigue characteristics. J. Engeering Mater. Technol. 1988, 110, 55–58. [Google Scholar] [CrossRef]
  25. Bäumel Jr, A.; Seeger, T. Materials Data for Cycle Loading:Supplement I; Elsevier Science Publishers: Amsterdam, The Netherlands, 1990. [Google Scholar]
  26. Yao, W.X. Fatigue Life Estimation of Structures; National Defense Industry Press: Beijing, China, 2003. [Google Scholar]
Figure 1. Dimensions and microstructures of TC21 titanium alloy sample: (a) sample dimensions; (b) SEM image with relatively low microscope magnification; (c) SEM image with high microscope magnification.
Processes 10 02548 g001
Figure 2. Schematic diagram of acquisition procedure of experimental samples: (a) short ring specimen including IFW joint; (b) procedure of processing samples; (c) sample size.
Processes 10 02548 g002
Figure 3. (a) Schematic diagram of nanoindentation test; (b) Nanohardness of BM and WZ; (c) equivalent Young’s modulus of BM and WZ.
Processes 10 02548 g003
Figure 4. Schematic diagram of tensile test.
Processes 10 02548 g004
Figure 5. (a) True stress–strain curve of IFW joint; (b) lgSt-lgεt curve.
Processes 10 02548 g005
Figure 6. (a) Cyclic maximum tensile and compressive stress curves; (b) image of LCF sample crack.
Processes 10 02548 g006
Figure 7. Stress-strain hysteresis curves of the LCF samples after 1/3, 2/3 and near the end of the test cycle at different strain amplitudes: (a) 1%; (b) 0.9%; (c) 0.8%; (d) 0.7%; (e) 0.65%; (f) 0.6%.
Processes 10 02548 g007
Figure 8. LCF predicted curves from the four prediction methods of TC21 IFW joints.
Processes 10 02548 g008
Figure 9. SEM fracture morphology of the LCF sample at 0.9% strain amplitude: (a) Region 1; (b) Region 2; (c) Region 3; (d) Region 4; (e) Region 5.
Processes 10 02548 g009
Figure 10. SEM fracture morphology of the LCF sample at 0.6% strain amplitude: (a) fracture direction of the main crack; (b) crack nucleation zone; (c) crack propagation zone; (d) middle region of crack propagation zone; (e) end region of crack propagation zone; (f) transient fracture zone; (g) shear lip.
Processes 10 02548 g010
Table 1. Chemical composition of TC21 alloy, wt.%.
AlMoNbSnZrCrFeOCNHSiTi
6.352.752.092.032.061.480.0980.0990.0200.0170.002≤0.13Bal.
Table 2. Parameters obtained from the tensile tests of IFW joints of TC21 alloy.
Test No.Elastic Modulus (MPa)Offset Yield Strength S0.2 (MPa)Peak Stress
SMAX (MPa)
Shrinkage on Cross-Section
Processes 10 02548 i001 (%)
Test 1115499.4946.01031.515.36
Test 2112646.3911.8992.813.51
Test 3116241.5967.11051.015.97
Average114795.7941.61025.114.95
Table 3. Parameters at half-life for LCF test samples at strain amplitudes of 1%, 0.9% and 0.8%.
Sample No.Δstotal (MPa)ΔetotalE (MPa)eeepAverage eeAverage ep
1%-1#18602%112,0001.66%0.34%1.657%0.343%
1%-2#18902%113,0001.67%0.33%
1%-3#18702%114,0001.64%0.36%
0.9%-1#18401.8%114,0001.61%0.19%1.593%0.207%
0.9%-2#18301.8%114,0001.61%0.19%
0.9%-3#17801.8%114,0001.56%0.24%
0.8%-1#17201.6%114,0001.51%0.09%1.510%0.090%
0.8%-2#17501.6%114,0001.54%0.06%
0.8%-3#16901.6%114,0001.48%0.12%
Table 4. The prediction methods and parameters of LCF life.
Method No.Prediction Method σ f ε f b c
1Manson general slope method (1965) 1.9 σ b 0.76 ln 1 1 ψ 0.6 −0.12−0.6
2Muralidharan–Manson (1988) 0.623 E σ b E 0.832 0.0196 ( σ b / E ) 0.53 ln 1 1 ψ 0.155 −0.09−0.56
3Bäumel–Seeger (1990) 1.67 σ b 0.35−0.095−0.69
4Yao Weixing (2003) 1.75 σ b 0.5 ε f 0.6 −0.12−0.6
Publisher’s Note: MDPI stays neutral with regard to jurisdictional claims in published maps and institutional affiliations.

