Abstract
The flow and heat transfer characteristics in micro-tube are very important research fields. In order to study the influence of the Reynolds number on the overall characteristics of flow and heat transfer, a 510 mm long micro-tube with dimples was constructed. Thirty-five different working conditions are considered, and the Reynolds number is between 1500 and 8100. At the same time, the change of physical properties of coolant with temperature is considered. The reliability of numerical simulation results is verified by the grid independence verification and the comparison of experimental data. The results show that the dimple will promote the instability of the flow state and improve the heat transfer efficiency. The flow state evolution formed in the stream-wise direction is basically similar, and its fully developed position remains at 76 mm, which is independent of the Reynolds number. For the fully developed region, the partial derivation of static pressure in the stream-wise component has a quasi-linear relationship with the stream-wise direction. With the development in the stream-wise direction, the partial derivation of static temperature in the steam-wise component decreases. With the increase of Reynolds number, the friction factor f and heat transfer factor j decrease. The ratio of factor heat transfer f to Reynolds number relative collapses for the different cases, especially when the Reynolds number is larger than 3800. The heat transfer factor j is an exponential function of the Reynolds number and decreases with the increased Reynolds number.
1. Introduction
Micro-tube is widely used in thermal management systems because it has the advantages of a firm structure, small size and light weight. Reynolds number is often used to characterize flow characteristics. The study of the influence of Reynolds number on the overall flow and heat transfer characteristics in micro-tubes is helpful to understand the synergy between them and will promote the research and development of heat management systems. There is much existing research conducted on the overall characteristics of heat transfer and flow in the micro-tube through the methods of experiment measurement [1,2,3,4] and numerical simulation [5,6,7].
The Reynolds number is an important influencing factor on the characteristics of flow and heat transfer. For micro-tubes with dimples, the effect of the Reynolds number on the flow and heat transfer characteristics near the dimples is particularly obvious [8,9,10,11,12,13,14]. Wang et al. [8] found that the dimple can produce obvious secondary flow in the tube, significantly improving the thermal performance, and the higher the Reynolds number, the greater the performance improvement of the tubes with dimples. Burgess and Ligrani [9] found that the eddy intensity and the secondary flow intensity increase with the increase of Reynolds number. With the increase of Reynolds number, Okab et al. [2] found that the heat transfer performance of microchannels with dimples was improved, but the pressure drop increased slightly. Farsad et al. [13] found that the small vorticities currents generated by the dimples play a role in enhancing turbulent mixing and heat transfer, and this effect increases significantly with the increase of Reynolds number. Moreover, several studies have been performed on the influence of Reynolds number on the friction factor [15] and Nusselt number [16,17,18,19,20,21,22,23,24]. For example, Chadi et al. [15] found that, as the Reynolds number increases, the Nusselt number and the friction factor increase and decrease, respectively. Compared with traditional heat sinks, Vajravel et al. [19] showed that the above rules are more obvious in microchannel heat sinks; that is, with the increase of the Reynolds number, the Nusselt number increases faster. Isaev et al. [21] found that the influence of the Reynolds number on the local Nusselt number is more pronounced than the average Nusselt number, especially in the fully developed turbulent region. In addition, Raju et al. [25] found that, as the Prandtl number increased, the critical Richardson number decreased with isothermal walls, which meant that flow separation was more likely to occur. Jing et al. [26] deduced that high temperature and low pressure are beneficial to reduce flow resistance by studying the amount of entropy production in pipes.
Although the overall characteristics of flow and heat transfer have been investigated across a wide range of Reynolds numbers, most of them are focused on short-length micro-tube. The flow and heat transfer states within the micro-tube may not be sufficiently developed to reflect the real situation fully. The present study takes the long micro-tube with dimples, whose length is 510 mm, as the research object. Then, we perform numerical simulations of the research object with the Reynolds number from 1500 to 8100 and the Prandtl number from 7.2 to 14.8. During the numerical simulation, the variation of physical parameters with temperature is considered because they have a great impact on the flow and heat transfer characteristics, which have been reported in Refs. [27,28,29,30]. At last, the influence of the Reynolds number on the overall characteristics of flow and heat transfer are investigated in detail.
2. Geometric Model and Numerical Descriptions
2.1. Geometric Model
The geometric model is a long-length micro-tube with dimples, as shown in Figure 1a, whose length is 510 mm. The model as a whole consists of a cuboid with dimples on the upper and lower surfaces and a semi-cylinder. The length and width of the rectangle are 9.51 mm and 1.12 mm, respectively, and the radius of the semicircle is 0.56 mm, as shown in Figure 1b. The dimples are found between 22 mm and 488 mm of the X-axis. For upper or lower walls, the number of dimples is 106. The arrangement of dimples is shown in Figure 1c. The left and right rows of dimples are staggered, and the spacing of each group of dimples in the flow direction is the same. The detailed parameters of the micro-tube with dimples are given in Table 1.
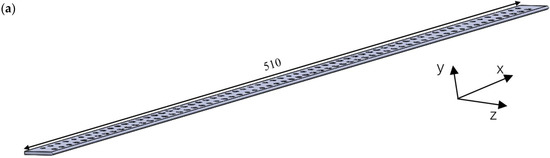

Figure 1.
Three-dimensional model of the micro-tube with dimples. Overall model (a), transversal surface (b) and dimples (c).

Table 1.
Main parameters of the micro-tube with dimples.
2.2. Governing Equations
Since the flow medium is the coolant, the governing equations are the time-dependent, three-dimensional Navier–Stokes equations for an incompressible fluid in dimensional form. The governing equations of mass, momentum and energy conservation are as follows:
where is the pressure, is the velocity vector, is the Kronecker tensor. The total energy , shear stress tensor , and conductive heat flux are given by
The density , viscosity , specific heat capacity and coefficient of heat conductivity are all functions of temperature.
2.3. Numerical Approach
In the numerical study of the flow and heat transfer characteristics in a long micro-tube, when the wall temperature is constant at 293.15 K, different Reynolds numbers Re and Prandtl numbers Pr are used as the inlet variables and defined as follows
where subscript “in” denotes the inlet condition, is the hydraulic diameter, , and represent the cross-sectional area and perimeter at the entrance of the long micro-tube, respectively. Seven flow rates are about 0.85 L/min, 1.05 L/min, 1.25 L/min, 1.45 L/min, 1.65 L/min, 1.85 L/min and 2.05 L/min, respectively. Five inlet temperatures are about 363.15 K, 353.15 K, 343.15 K, 333.15 K and 323.15 K, respectively. Therefore, there are 35 working conditions, and the corresponding Reynolds number ranges from 1500 to 8100 (Cases R1 to R35). At the same time, the different Prandtl number ranges from 7.2 to 14.8 (Cases P1 to P5). The Prandtl number corresponding to working conditions R1 to R7 is P1, and so on for other working conditions. The flow rate and temperature corresponding to different Reynolds numbers and Prandtl numbers are shown in Figure 2. The flow rate increases with the increase of the Reynolds number, while the inlet temperature decreases with the increase of the Prandtl number.
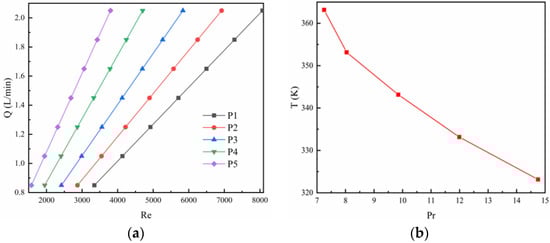
Figure 2.
Distributions of flow (a) and temperature (b).
The simulation is performed using ANSYS Fluent 18.0. It uses the finite volume method to discrete the governing equations. The standard model [31] is employed to calculate the internal flow. The standard model uses two transport equations to solve turbulent kinetic energy and specific dissipation rate. The model has good simulation performance for the flow with reverse pressure gradient at a low Reynolds number. The SIMPLE algorithm is applied to realize the coupling between velocity and pressure. A high resolution was adopted to ensure overall accuracy, and the second-order backward Euler scheme was applied to the non-stationary part.
The velocity boundary condition and the outflow boundary condition are applied to the inlet and outlet of the micro-tube, respectively. On the wall boundary, a no-slip condition is used for the velocity, and the wall temperature is kept isothermal, whose value is 293.15 K. In addition, the flow and temperature fields are considered to be steady when the convergence residual errors are all less than 1 × 10⁻⁶.
2.4. Grid Independence Verification
The grid independence test is performed to ensure the reliability of simulation results. ANSYS ICEM 18.0 is used to divide the computational domain into structural grids, and the near-wall regions are encrypted.
Figure 3 shows the evolution of the temperature drop and pressure drop with the number of grids for case R32. For the stream-wise direction, with the number of nodes increased, temperature drop increases and pressure drop decreases firstly and then gradually flattens, as shown in Figure 3a. Regarding the transversal surface, with the number of grids increased, the temperature drops and pressure drops increase first and then gradually flatten, as shown in Figure 3b. Thus, in this study, the number of nodes in the stream-wise direction and the number of grids in the transversal surface are 2806 and 9813, respectively. The total grid number is 24.91 million. The node diagram of the main structures is shown in Figure 4.
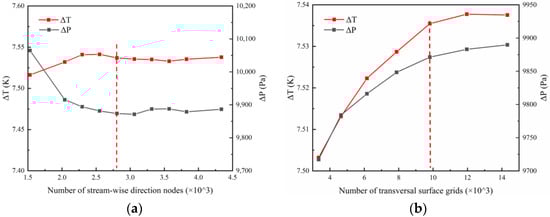
Figure 3.
Mesh independence verification at R32 case in the stream-wise direction (a) and transversal surface (b).
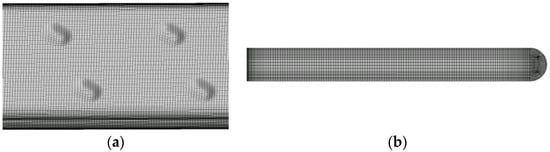
Figure 4.
Grid of the long micro-tube with dimples. Stream-wise direction view (a) and transversal surface view (b).
3. Experimental Set-Up and Validation
The transverse cross-section is so small that the experimental accuracy of the single long micro-tube is very difficult to guarantee. In order to obtain accurate experimental data, a multi-long micro-tube heat sink model, including 32 long micro-tubes, is designed, as shown in Figure 5. The model also includes inlet and outlet pipes, front and rear cavities, and fins. Among the 32 long micro-tubes, only 10 are in circulation, and there are two blocked tubes between every two long micro-tubes. Fins sandwiched between each long micro-tube to play a fixed role.
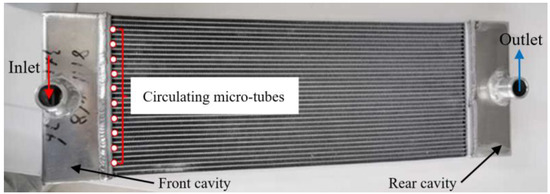
Figure 5.
Long micro-tubes heat sink.
The experimental measurement involved in this study is all carried out in Zhejiang Yinlun Machinery Co., Ltd. (Hangzhou, China).
3.1. Experiment Set-Up
Figure 6 shows the outline of the long micro-tube heat sink system, including the heat flow loop and the cooling loop. Within the heat flow loop, heaters are used to provide different temperatures of coolant to the test sample. A pressure sensor (XPM4-5BG) is responsible for acquiring pressure data at both ends of the test sample. A mass flow meter (FMC-5101LA) is used to measure mass flow with high accuracy. The temperature at the entrance of the test sample was measured by a T-type thermocouple (PT100). The coolant is pumped by a gear pump to ensure high-precision flow. The main function of the cooling circuit is to provide a constant temperature environment for the test sample, including a constant temperature water bath and armored thermocouples.
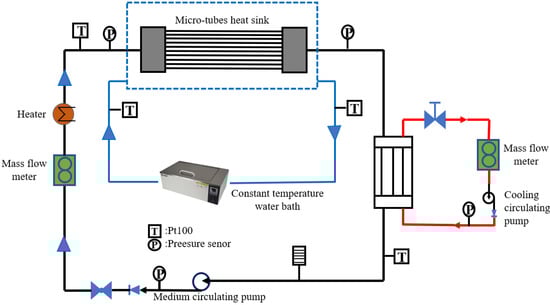
Figure 6.
The outline of the long micro-tubes heat sink closed loop.
The total pressure drop of the micro-tube heat sink , obtained by experimental measurement, can be expressed as the sum of three parts: pressure drop at the sudden expansion , pressure drop at the sudden contraction and pressure drop in the long micro-tubes . The first two parts are summarized by Kays [32] and are calculated as follows.
where represents the proportionality constant in Newton’s second kinetic law of motion, represents the flow velocity, represents the area ratio, stands for mass flow, means dimensionless contraction loss coefficient for flow at heat exchanger entrance, means dimensionless expansion loss coefficient for flow at heat exchanger exit.
Figure 7 shows the ratio of pressure drop in the long micro-tubes to the total pressure drop. It can be seen that, with the increase of the Reynolds number, the ratio gradually decreases and then increases. Moreover, the ratio also has a relationship with the Prandtl number. On the whole, the value of the P5 case (low inlet temperature) is relatively large compared with the result of the P1 case (high inlet temperature).
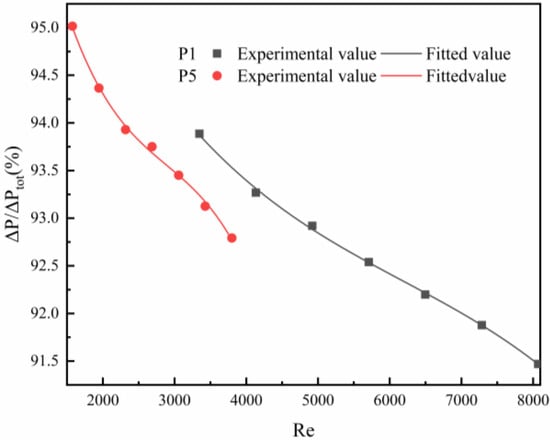
Figure 7.
Ratio of pressure drop in the long micro-tubes to the total pressure drop.
3.2. Experimental Verification
Figure 8 shows the pressure drop in the long micro-tube and provides a comparison with the experimental results. Note that the pressure drop obtained by numerical simulation are all higher than the experimental results. The deviation between the two methods is within 10% of 57.14% and within 20% of 100%. The minimum and maximum relative errors of pressure drop are 5.54% and 19.77%, respectively. The error is mainly caused by the wall temperature may be different between numerical simulation and experimental measurement. The wall temperature of the latter, which is difficult to control accurately, will be higher than that of the former. At present, the physical properties of coolant are considered a function of internal temperature (including viscosity). The viscosity decreases with the increase in temperature, which leads to the decrease of pressure drop. However, the relative error is within the acceptable range, so the numerical results in this paper are reliable.
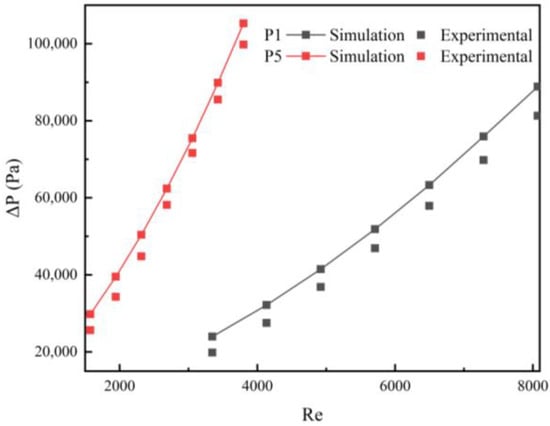
Figure 8.
Pressure drop of the long micro-tube with dimples for different Reynolds numbers and Prandtl numbers conditions.
4. Results and Discussions
In the present study, 35 Reynolds numbers are selected to investigate the influence of Reynolds numbers on flow and heat transfer. The analysis of the first three sections is conducted under the same Prandtl number of P1, with the corresponding working conditions ranging from R1 to R7. The last section discusses Prandtl number variation when all Reynolds number conditions are discussed.
4.1. Turbulent Kinetic Energy
Figure 9a shows the distribution of the average turbulent kinetic energy (TKE). It can be seen that the TKE first increases to a maximum value. The maximum value of TKE sharply increases with the increase in the Reynolds number, as shown in Figure 9b. It increases from 0.026 m2/s2 for R1 case to 0.079 m2/s2 for R7 case. However, the position of maximum value remains at 43 mm and is insensitive to the Reynolds number. After a period of development, the evolution of TKE tends to be fully developed, whose position is located at 76 mm and also insensitive to the Reynolds number. In the fully developed stage, the TKE fluctuation can be observed, mainly caused by the dimples. In addition, for large Reynolds number conditions, the intensity of TKE fluctuation indicates that there existed a transitional stage.
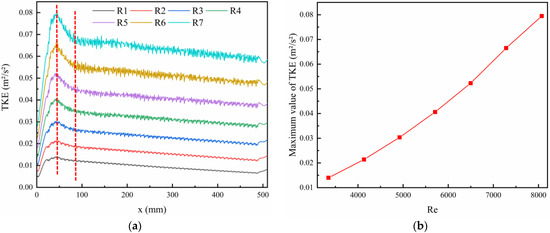
Figure 9.
Distributions of turbulent kinetic energy (a) and its maximum value (b).
The above position and amplitude characteristics also can be investigated by the distributions of TKE on (x, z)-plane (y/y0 = 0.68, y0 = 0.56), as shown in Figure 10. For example, the position of maximum TKE is between the fourth and fifth groups of dimples. The distributions of TKE tend to be fully developed and show some periodicity after the seventh group of dimples. At the same time, the Reynolds number has an impact on the overall TKE. Compared with case R1, the distribution of TKE becomes more chaotic for case R7, especially behind the dimples. The number and distribution area of detached vortices are greatly increased. This characteristic causes the TKE intensity to fluctuate, and the intensity of the fluctuation increases with the increase of the Reynolds number. At the left rear of the dimple, there is a low-value area of TKE. With the development of flow, the area of this area gradually decreases.
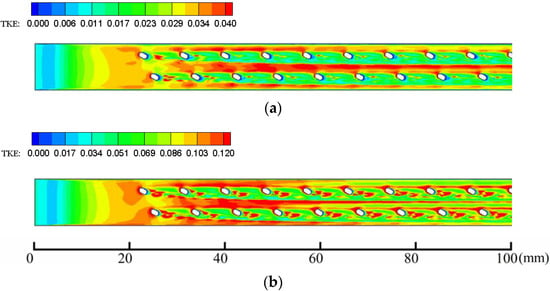
Figure 10.
Turbulent kinetic energy on (x, z)-plane at y/y0 = 0.68 for R1 (a) and R7 (b) cases.
4.2. Static Pressure
Figure 11a shows the mean static pressure in the different stream-wise positions. It can be seen that the mean static pressure decreases with the stream-wise position development for all cases. As the Reynolds number increases, the drop rate of static pressure increases. This phenomenon also can be seen in the average static pressure partial gradient in the stream-wise direction, as shown in Figure 11b. Moreover, the mean static pressure is distributed in three stages. With the increase of Reynolds number, the mean static pressure partial gradient amplitude of the middle stage, which includes dimples, decreases from −47.43 for the R1 case to −176.56 for the R7 case, and the fluctuation intensity also increases gradually.
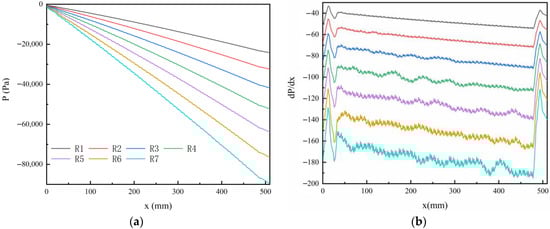
Figure 11.
Mean static pressure (a) and its partial gradient in the stream-wise component (b) for different Reynolds numbers conditions.
This phenomenon has a relatively obvious relationship with the existence of dimples, as shown in Figure 12. The distribution characteristics of the pressure gradient under low and high Reynolds number conditions are relatively similar. The left side of the dimple has a larger positive value area, and the right side has a larger negative value area. This distribution characteristic is the inducement for the flow separation on the left side and the vortex detachment on the right side after the dimple. In addition, compared with case R1, the above differences are more obvious in case R7. The pressure distribution characteristics correspond to the distribution characteristics of TKE. The TKE value is small in the area where flow separation occurs and large in the area where vortex detachment occurs.
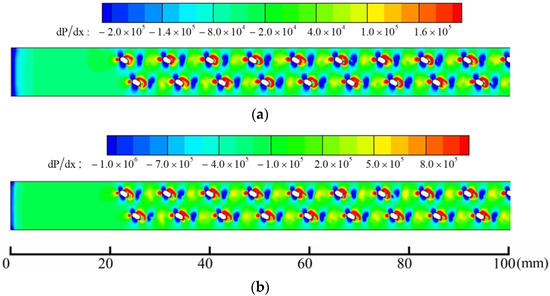
Figure 12.
Partial gradient of static pressure in stream-wise component on (x, z)-planes at y/y0 = 0.68 for R1 (a) and R7 cases (b).
Figure 13a shows the pressure drop versus Reynolds numbers. It can be seen that when the Prandtl number is constant, the pressure drop and its growth rate increase with the increase of the Reynolds number. This phenomenon may be related to the region size of flow separation behind the dimples.
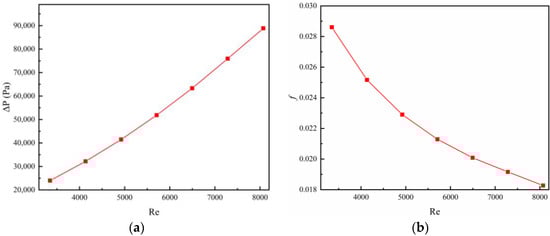
Figure 13.
Distributions of pressure drop (a) and friction factor f (b) versus Reynolds numbers.
The non-dimensional parameter of friction factor f is introduced to express the distributions of flow characteristics, which can be calculated as follows:
where denotes the average conditions, represents the heat exchange surface area of the micro-tube. The friction factor f ranges between 0.018 and 0.029 for the different Reynolds numbers, as shown in Figure 13b. The friction factor f decreases with the increasing Reynolds number.
4.3. Heat Transfer Results
In Figure 14a,b, the mean static temperature and its partial gradient in the different stream-wise positions are shown, respectively. When the coolant first enters the dimple region, the static temperature drop rate will rise briefly. The rising range of mean static temperature can be revealed as its partial gradient, whose maximum value is about 25.62% for case R1 and 4.11% for case R7. It is indicated that the rising range decreases as the Reynolds number increases. With the progress of flow and heat transfer, the influence of the Reynolds number on the temperature drop rate gradually decreases. The maximum relative deviation of temperature drop between different Reynolds number conditions is less than 5% for x > 210 mm.
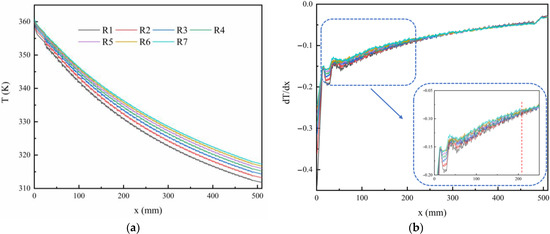
Figure 14.
Mean static temperature (a) and its partial gradient in the stream-wise component (b) for different Reynolds numbers.
Figure 15 shows the static temperature on (x, z)-planes. Note that, similar to the flow field, the dimples will also cause temperature pulsations. The uniform distribution law of the temperature field is destroyed by the dimples. A low-temperature region appears behind the dimple and extends backward, driven by the detachment vortex. In the left region where flow separation occurs, the temperature is closer to the mainstream temperature. With the increase of the Reynolds number, the temperature drop rate slows down, the thickness of the temperature boundary layer near the wall surface is thinner, and the inhomogeneity of the temperature field distribution is further strengthened.
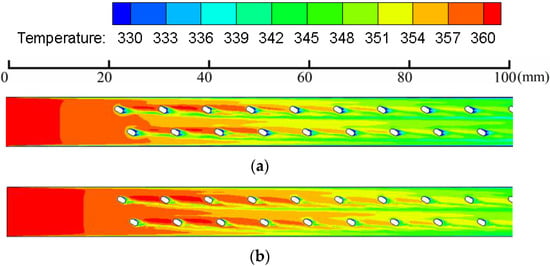
Figure 15.
Static temperature on (x, z)-planes at y/y0 = 0.68 for R1 (a) and R7 (b) cases.
Figure 16 shows the distributions of the average Nusselt number, , which can be calculated as follows:
where subscript “out” denotes the outlet condition, is the wall temperature. With the increase of Reynolds number, driven by the larger area and strength of the detachment vortex, the degree of coolant mixing increases. More coolant participates in the heat transfer process, and the Nusselt number increases significantly. It can be seen that when the Prandtl number is constant, there is a quasi-linear relationship between the average Nusselt number and Reynolds number.
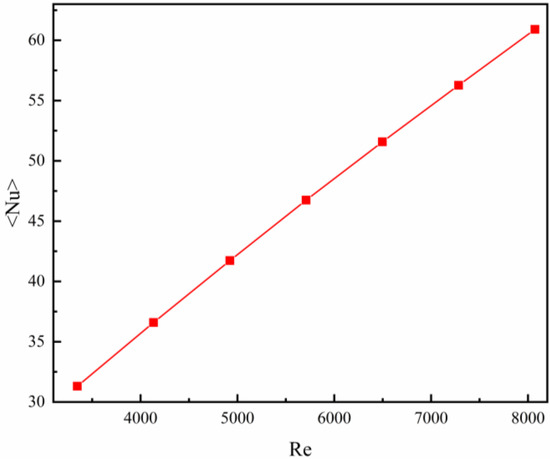
Figure 16.
Distributions of Nusselt number versus Reynolds numbers.
The heat transfer factor j can be calculated as follows.
Figure 17 shows the changes in the average Reynolds number and average Prandtl number under different Reynolds numbers. Note that an obvious linear relationship between the average Reynolds number and the Reynolds number is observed, and the former increases with the increase of the latter. However, the average Prandtl number is negatively correlated with the Reynolds number.
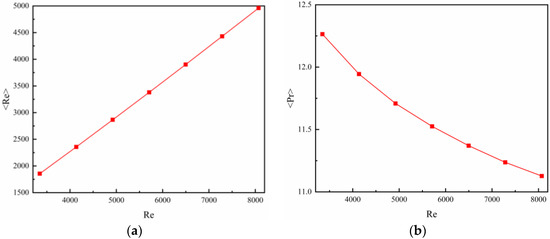
Figure 17.
Distributions of average Reynolds number (a) and average Prandtl number (b) versus Reynolds numbers.
Figure 18 shows the relationship between heat transfer factor j and Reynolds number. It can be clearly seen that factor j decreases with the increase of Reynolds number, and the decreasing rate gradually slows down. Obviously, compared with the average Nusselt number, the average Reynolds number has a greater impact on the factor j. However, with the increase of Reynolds number, this effect decreases gradually.
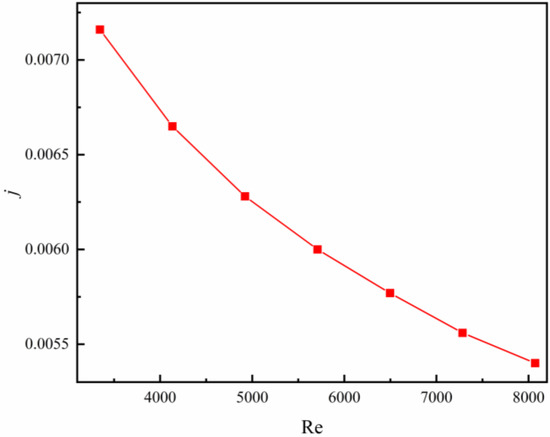
Figure 18.
Distributions of heat transfer factor j versus Reynolds numbers.
4.4. Prandtl Number Effects
Figure 19 shows the distribution of TKE and its maximum value under different Reynolds number and Prandtl number conditions. The Reynolds number decreases gradually from top to bottom under the working conditions corresponding to each Prandtl number. Note that the positions of maximum value and full development are independent of the Prandtl number, which are still maintained at 43 mm and 76 mm, respectively. Although the evolution trend of TKE with the Prandtl number is similar, their maximum value gradually decreases with the decrease of the Prandtl number. When the flow equals 2.05 L/min, the relative deviation of the maximum value of TKE between the P1 case and the P5 case is up to approximately 10%. In addition, as the Prandtl number decreased, the intensity of TKE fluctuation decreased.
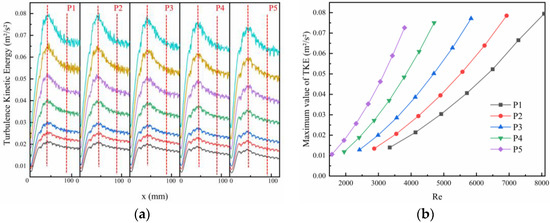
Figure 19.
Distributions of turbulent kinetic energy (a) and its maximum value (b) for different Reynolds numbers and Prandtl numbers.
Figure 20 shows the distributions of mean static temperature with different Prandtl numbers within the first 250 mm. In the working conditions corresponding to different Prandtl numbers, the Reynolds number decreases gradually from top to bottom. Note that the relationship between mean static temperature and Reynolds number is similar for all Prandtl number cases. As the Prandtl number decreases, the rate of decline of mean static temperature increases. For example, for the first 250 mm, the mean static temperature drop is about 31.08~36.87 K for the P1 case and about 12.09~14.6 K for the P5 case.
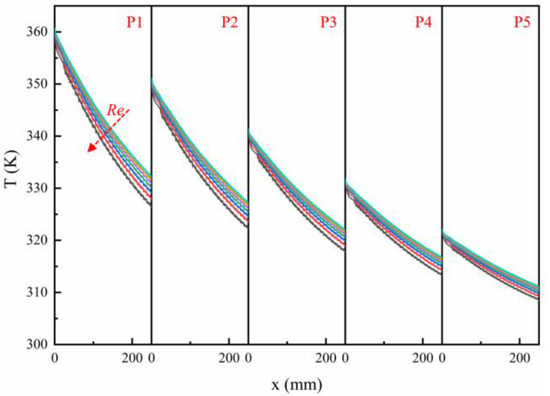
Figure 20.
Average static temperature in the stream-wise component for different Reynolds numbers and Prandtl numbers.
Under different Prandtl number conditions, the increasing trend of pressure drop with Reynolds number will not change, as shown in Figure 21. At the same time, the growth rate of pressure drop increases significantly with the increase of the Prandtl number. For example, the pressure drop under the P1 case is about 23,985~88,870 Pa, and that under the P5 case is 29,785~105,300 Pa.
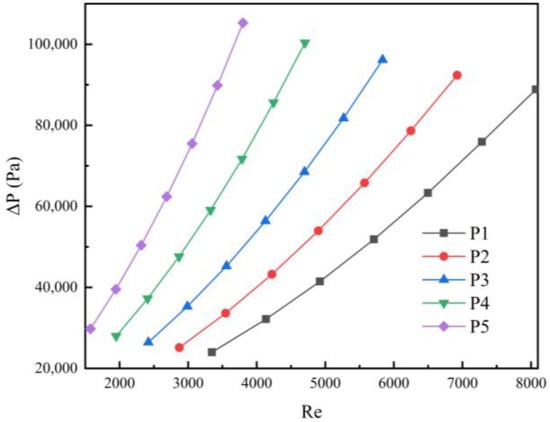
Figure 21.
Distributions of pressure drop versus different Reynolds numbers and Prandtl numbers.
The relationship between friction coefficient f and Reynolds number under different Prandtl number conditions is shown in Figure 22. The slope of the friction factor f will increase with the increase of the Prandtl number. Note that the ratio of friction factor f to Re relative collapses for the different cases, especially when the Reynolds number is larger than 3800. At this point, a quasi-linear also can be observed, and the reason is that the internal flow is turbulent. Therefore, the friction factor f has an important relationship with the Reynolds number.
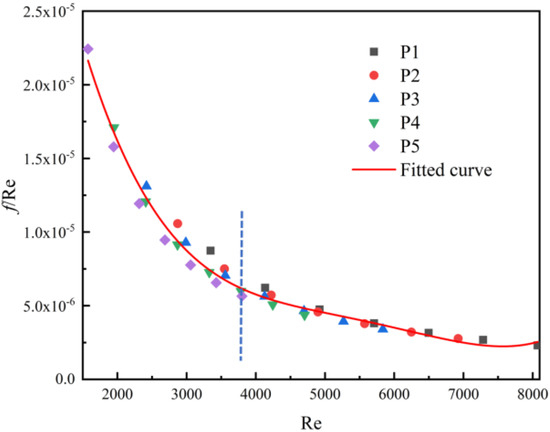
Figure 22.
Distributions of friction factor f versus different Reynolds numbers and Prandtl numbers.
Figure 23 shows the relationship between the average Nusselt number and Reynolds number under different Prandtl number conditions. It can be clearly seen that with the increase of the Prandtl number, the overall value of the average Nusselt number gradually decreases. On the contrary, the growth rate of the average Nusselt number will increase with the increase of the Prandtl number.
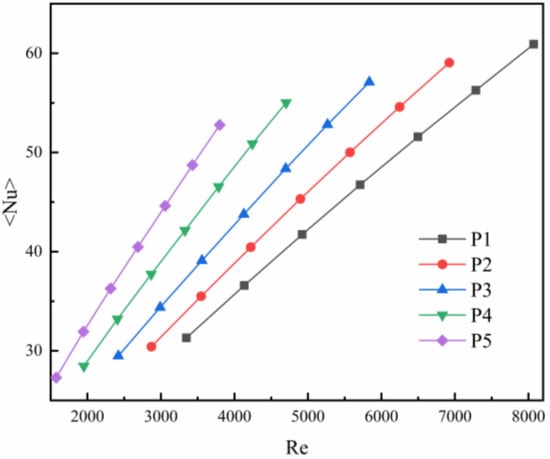
Figure 23.
Distributions of average Nusselt number versus different Reynolds numbers and Prandtl numbers.
The heat transfer factor j decreases with increasing Reynolds number at different Prandtl numbers, while its overall value increases with the increase of Prandtl number, as shown in Figure 24. The relationship between heat transfer factor j and Reynolds number and Prandtl number is opposite to that of the Nusselt number. The heat transfer factor j can be well expressed by the Reynolds number, and the relationship between them is an exponential function. Based on the curve fitting method, the curve formula can be expressed as follows:
where (k = 0, 1, 2, 3, 4) is the constant coefficient. , , , , .
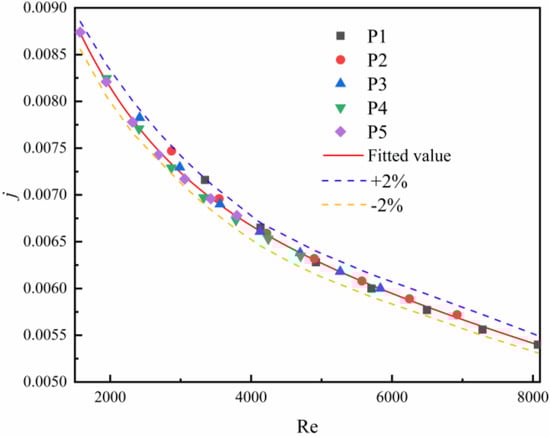
Figure 24.
Distributions of factor j versus different Reynolds numbers and Prandtl numbers.
The exponential function decreases with the increase of the Reynolds number. The curve well reflects the relationship between heat transfer factor j and Reynolds number, and all relative deviations are within 2%.
5. Conclusions
Numerical investigation on the flow and heat transfer characteristics in a micro-tube with dimples, whose length is 510 mm, are conducted at a wall temperature of 293.15 K. 35 Reynolds numbers are selected to investigate its effects. The reliability of the numerical simulation is verified by the grid independence first and then compared with the experimental data, which is obtained in the multi-long micro-tube heat sink system. The relative errors between the numerical simulation and the experimental data are within 10% of 57.14% and within 20% of 100%.
The overall distribution of TKE along the stream-wise direction is basically independent of the Reynolds number and Prandtl number, and its maximum value is kept at about 43 mm. The distribution characteristics of TKE show that the flow has reached a fully developed state at about 76 mm. In addition, the TKE is small and stable in the region with flow separation, whereas the TKE is large and chaotic in the region with a detachment vortex.
The pressure drop increases and decreases with the Reynolds number and Prandtl number increase, respectively. The dimple will strengthen flow shear and cause an adverse pressure gradient, thus promoting complex phenomena such as flow instability. The degree of the pressure fluctuation in the long micro-tube increases with the increase of Reynolds number. The friction factor f decreases with the increase of the Reynolds number and the decrease of the Prandtl number, respectively, and has an important relationship with the Reynolds number. Under different working conditions, the decreasing speed of the ratio of the heat transfer factor f to the Reynolds number slows down rapidly, especially when the Reynolds number is greater than 3800. The decreasing speed is almost unchanged.
Regarding the heat transfer characteristics, the position of full development static temperature, which is basically independent of Reynolds number, is roughly 210 mm. The flow pattern has a great influence on heat transfer. The heat transfer will be enhanced and weakened by the detachment vortex and flow separation, respectively. The relationship between heat transfer factor j and Reynolds number and Prandtl number is opposite to that of the Nusselt number. The heat transfer factor j is an exponential function of the Reynolds number. All the data approach a curve, and the curvature decreases with an increasing Reynolds number.
Since the flow and heat transfer characteristics in the long micro-tube will be obviously affected by the dimples, thus the long-length model has advantages in revealing the detailed flow field and heat transfer mechanism, which will be given more comprehensive investigation in the fully developed region in the future.
Author Contributions
Conceptualization, R.Q. and X.C.; methodology, X.C.; software, R.Q.; validation, F.C., L.X. and J.Y.; formal analysis, R.Q.; investigation, X.C.; resources, X.C.; data curation, R.Q.; writing—original draft preparation, R.Q.; writing—review and editing, X.C.; visualization, R.Q.; supervision, X.C.; project administration, X.C.; funding acquisition, X.C. All authors have read and agreed to the published version of the manuscript.
Funding
This work was financially supported by the National Natural Science Foundation of China (Grant No. 51976198) and the Fundamental Research Funds of Zhejiang Sci-Tech University (Grant No. 2021Y001).
Data Availability Statement
All the data is already in the article.
Conflicts of Interest
The authors declare no conflict of interest.
Nomenclature
| Nomenclature | |||
| Hydraulic diameter (m) | Re | Reynolds number (-) | |
| f | Friction factor (-) | T | Static temperature (K) |
| Proportionality constant (-) | |||
| j | Heat transfer factor (-) | Greek symbols | |
| Mass flow (kg·s−1) | Kronecker tensor (-) | ||
| Conductive heat flux (W·m−2) | Coefficient of heat conductivity (W·m−1·K−1) | ||
| Flow velocity (m·s−1) | Viscosity (kg·m−1·s−1) | ||
| Cross-sectional area at the entrance (m2) | Density (kg·m−3) | ||
| Total heat exchange area (m2) | Shear stress tensor (-) | ||
| Cp | Specific heat capacity (J·kg−1·K−1) | ||
| Total energy (J) | Subscripts | ||
| Contraction loss coefficient (-) | in | Inlet condition | |
| Expansion loss coefficient (-) | out | Outlet condition | |
| Nu | Nusselt number (-) | w | Wall condition |
| Pressure (Pa) | tot | Total pressure | |
| Pr | Prandtl number (-) | exp | Area expansion |
| Q | Flow rate (L min−1) | con | Area contraction |
References
- Chyu, M.K.; Yu, Y.; Ding, H.; Downs, J.P.; Soechting, F.O. Concavity enhanced heat transfer in an internal cooling passage. Turbo Expo Power Land Sea Air 1997, 7. [Google Scholar] [CrossRef]
- Rao, Y.; Feng, Y.; Li, B.; Weigand, B. Experimental and numerical study of heat transfer and flow friction in channels with dimples of different shapes. J. Heat Transfer 2015, 137, 031901. [Google Scholar] [CrossRef]
- Rao, Y.; Zhang, P.; Yu, Y.; Ke, H. Experimental study and numerical analysis of heat transfer enhancement and turbulent flow over shallowly dimpled channel surfaces. Int. J. Heat Mass Transfer 2020, 160, 120195. [Google Scholar] [CrossRef]
- Xie, Y.; Rao, Y.; Li, W.C.; Jiang, Q. Experiments and Stress-Blended eddy simulations of turbulent flow over edge-rounded dimples. Int. J. Therm. Sci. 2020, 154, 106380. [Google Scholar] [CrossRef]
- Xie, S.; Guo, Z.; Gong, Y.; Dong, C.; Liu, J.; Ren, L. Numerical investigation of thermal-hydraulic performance of a heat exchanger tube with helical dimples. Int. J. Therm. Sci. 2022, 177, 107530. [Google Scholar] [CrossRef]
- Ligrani, P.M.; Harrison, J.L.; Mahmmod, G.I.; Hill, M.L. Flow structure due to dimple depressions on a channel surface. Phys. Fluids 2001, 13, 3451–3452. [Google Scholar] [CrossRef]
- Ligrani, P.M.; Mahmood, G.I.; Harrison, J.L.; Clayton, C.M.; Nelson, D.L. Flow structure and local nusselt number variations in a channel with dimples and protrusions on opposite walls. Int. J. Heat Mass Transfer 2001, 44, 4413–4425. [Google Scholar] [CrossRef]
- Wang, T.; Zhang, Q.; Song, K.; Zhang, K.; Su, M.; Wu, X. Thermodynamic characteristics of a novel combination of three-start twisted tube and oval dimples. Case Stud. Therm. Eng. 2022, 37, 102284. [Google Scholar] [CrossRef]
- Burgess, N.K.; Ligrani, P.M. Effects of Dimple Depth on Channel Nusselt Numbers and Friction Factors. J. Heat Transfer 2005, 127, 839–847. [Google Scholar] [CrossRef]
- Xie, S.; Liang, Z.; Zhang, J.; Zhang, L.; Wang, Y.; Ding, H. Numerical investigation on flow and heat transfer in dimpled tube with teardrop dimples. Int. J. Heat Mass Transfer 2019, 131, 713–723. [Google Scholar] [CrossRef]
- Tay, C.M.J.; Khoo, B.C.; Chew, Y.T. Mechanics of drag reduction by shallow dimples in channel flow. Phys. Fluids 2015, 27, 035109. [Google Scholar] [CrossRef]
- Okab, A.K.; Hasan, H.M.; Hamzah, M.; Egab, K.; Al-Manea, A.; Yusaf, T. Analysis of heat transfer and fluid flow in a microchannel heat sink with sidewall dimples and fillet profile. Int. J. Fluids 2022, 15, 100192. [Google Scholar] [CrossRef]
- Farsad, S.; Mashayekhi, M.; Zolfagharnasab, M.H.; Lakhi, M.; Farhani, F.; Zareinia, K.; Okati, V. The effects of tube Dimples-Protrusions on the thermo-fluidic properties of turbulent forced-convection. Case Stud. Therm. Eng. 2022, 35, 102033. [Google Scholar] [CrossRef]
- Cheraghi, M.H.; Ameri, M.; Shahabadi, M. Numerical study on the heat transfer enhancement and pressure drop inside deep dimpled tubes. Int. J. Heat Mass Transfer 2020, 147, 118845. [Google Scholar] [CrossRef]
- Chadi, K.; Belghar, N.; Falek, M.; Driss, Z.; Guerira, B. Effect of the Position of Parallelogram Ribs in Micro Channel on Heat Transfer Using Diamond Nanoparticles. Metall. Mater. Eng. 2020, 27, 351–370. [Google Scholar] [CrossRef]
- Guo, A.N.; Wang, L.B. Parametrization of secondary flow intensity for laminar forced convection in twisted elliptical tube and derivation of loss coefficient and Nusselt number correlations by numerical analysis. Int. J. Therm. Sci. 2020, 155, 106425. [Google Scholar] [CrossRef]
- Arun, M.; Barik, D.; Sridhar, K.P.; Vignesh, G. Experimental and CFD analysis of copper plain and dimples tube at application of solar water heater. Mater. Today Proc. 2021, 42, 410–415. [Google Scholar] [CrossRef]
- Hsieh, W.H.; Wu, J.Y.; Shih, W.H.; Chiu, W.C. Experimental Investigation of Heat-Transfer Characteristics of Aluminum-Foam Heat Sinks. Int. J. Heat Mass Transfer 2004, 47, 5149–5157. [Google Scholar] [CrossRef]
- Vajravel, L.V.; Swaminathan, S.K.; Baskaran, S.; Sekar, R.K. Experimental Investigations on Heat Transfer in a New Minichannel heat sink. Int. J. Therm. Sci. 2019, 140, 144–153. [Google Scholar] [CrossRef]
- Kaood, A.; Aboulmagd, A.; Othman, H.; ElDegwy, A. Numerical investigation of the thermal-hydraulic characteristics of turbulent flow in conical tubes with dimples. Case Stud. Therm. Eng. 2022, 36, 102166. [Google Scholar] [CrossRef]
- Isaev, S.A.; Kornev, N.V.; Leontiev, A.I.; Hassel, E. Influence of the Reynolds Number and the Spherical Dimple Depth on Turbulent Heat Transfer and Hydraulic Loss in a Narrow Channel. Int. J. Heat Mass Transfer 2009, 53, 178–197. [Google Scholar] [CrossRef]
- Su, L.; Duan, Z.; He, B.; Ma, H.; Ning, X.; Ding, G.; Cao, Y. Heat Transfer Characteristics of Thermally Developing Flow in Rectangular Microchannels with Constant Wall Temperature. Int. J. Therm. Sci. 2020, 155, 106412. [Google Scholar] [CrossRef]
- Ma, H.; Duan, Z.; Ning, X.; Su, L. Numerical Investigation on Heat Transfer Behavior of Thermally Developing Flow Inside Rectangular Microchannels. Case Stud. Therm. Eng. 2021, 24, 100856. [Google Scholar] [CrossRef]
- Renksizbulut, M.; Niazmand, H. Laminar Flow and Heat Transfer in the Entrance Region of Trapezoidal Channels with Constant Wall Temperature. J. Heat Transfer 2006, 128, 63–74. [Google Scholar] [CrossRef]
- Raju, B.; Nath, D.; Pati, S. Analysis of Mixed Convective Heat Transfer Past an Isoflux/Isothermal Sphere: Influence of Prandtl Number. Phys. Scripta 2020, 95, 085211. [Google Scholar] [CrossRef]
- Jing, Q.; Xie, Y.; Zhang, D. Thermal-Hydraulic Performance and Entropy Generation of Supercritical Carbon Dioxide in Heat Exchanger Channels with Teardrop Dimple/Protrusion. Int. J. Heat Mass Transfer 2019, 135, 1082–1096. [Google Scholar] [CrossRef]
- Chatterjee, R.; Duryodhan, V.S.; Agrawal, A. Impact of Aspect Ratio and Thermophysical Properties on Heat Transfer Behavior in Spiral Microchannel. Int. J. Therm. Sci. 2022, 172, 107335. [Google Scholar] [CrossRef]
- Kumar, V.; Gupta, P.; Nigam, K.D. Fluid Flow and Heat Transfer in Curved Tubes with Temperature-Dependent Properties. Ind. Eng. Chem. Res. 2007, 46, 3226–3236. [Google Scholar] [CrossRef]
- Sehyun, S.; Cho, Y.I.; Gringrich, W.K.; Shyy, W. Numerical Study of Laminar Heat Transfer with Temperature Dependent Fluid Viscosity in a 2:1 Rectangular Duct. Int. J. Heat Mass Transfer 1993, 36, 4365–4373. [Google Scholar] [CrossRef]
- Zhao, H.; Li, X.; Wu, X. New friction factor and Nusselt number equations for turbulent convection of liquids with variable properties in circular tubes. Int. J. Heat Mass Transfer 2018, 124, 454–462. [Google Scholar] [CrossRef]
- Wilcox, D.C. Turbulence Modeling for CFD; DCW Industries: La Canada, CA, USA, 1998. [Google Scholar]
- Kays, W.M.; London, A.L. Compact Heat Exchangers, 3rd ed.; McGraw-Hill Book Co.: New York, NY, USA, 1984. [Google Scholar]


Publisher’s Note: MDPI stays neutral with regard to jurisdictional claims in published maps and institutional affiliations. |
© 2022 by the authors. Licensee MDPI, Basel, Switzerland. This article is an open access article distributed under the terms and conditions of the Creative Commons Attribution (CC BY) license (https://creativecommons.org/licenses/by/4.0/).