Abstract
In this study, dry fractionation process was proposed in order to obtain protein-enriched sunflower meal fractions. The process includes two-stage grinding using a hammer mill and a roll mill, and fractionation of sunflower meal by sieving. Central composite design (CCD) with four variables on three levels within response surface methodology was applied in order to estimate the influence of grinding parameters (sieve openings diameter of the hammer mill: 2, 4, and 6 mm, roll gap: 0.15, 0.2, and 0.25 mm, feed rate: 0.1, 0.175, and 0.25 kg/cm min, and roll speed: 400, 500, and 600 rpm) on responses (protein content, fraction yield and grinding energy consumption). Sieve openings diameter expressed the highest impact on fraction yield while roll gap expressed the most dominant influence on protein content in the fraction and grinding energy consumption. The highest protein content obtained was 48.06%(dm) with fraction yield of 77.22%. A multi-response optimization procedure was performed and optimal values were: sieve openings diameter of 2 mm, roll gap of 0.25 mm, feed rate of 0.2 kg/cm min, and roll speed of 400 rpm, while predicted values for a desired range of responses were: protein content 45.5%(dm), fraction yield 77.89%, and grinding energy consumption 8.31 Wh/kg.
1. Introduction
The world’s population is expected to reach 10 billion people in this century [1]. Following this trend, demands for key agricultural commodities, including proteins of animal origin, will continue to rise [2]. This may create significant pressure on the fast-growing livestock sector. Obtaining the high production performance of animals is decisive and the protein content of feed diets is one of the most important parameters when it comes to feeding. Soybean meal is the most commonly used source of plant protein in livestock diet formulations [3]. Due to its high protein content and high-quality amino acid composition, soybean meal has stood out as a standard compared to other plant protein raw materials [4,5]. However, a large extent of soy products is often of genetically modified origin (GMO), while there is a lack of trust in GMO products among customers [6]. Furthermore, due to insufficient production, Europe is forced to import a large part of soybeans from other parts of the world, which further affects the price of its products [7]. Increased demand and higher prices influence the increasing interest for alternative and more affordable sources of plant proteins.
Sunflower meal (SFM) is a valuable residual product that is obtained after hexane extraction of oil from sunflower seeds. Its relatively high protein content and low price set the SFM as a favourable plant protein source in feed formulations [8]. Composition of SFM is determined by various factors, such as seed variety, climatic conditions, soil quality, the degree of decortication during processing, and the entire extraction process [9]. Thus, the SFM protein content usually varies from 28% to 40% [10,11,12]. The protein nutrition value of SFM is comparable to those of soybean proteins, except in lysine deficiency. When compared to other oilseeds, it has a higher amount of sulphur-containing amino acids and less antinutritional factors as well [13,14,15]. Although SFM is intensively used in animal nutrition, especially for ruminants [16,17,18], the high content of crude fibre, which can range from 14% to 32% [8], is a limiting factor for its wider use in the diet of monogastric animals [3,19], and it also reduces the energy value of feed [20]. However, due to the inverse correlation between crude fibre content and crude protein content in SFM, fibre content could be decreased while protein content is increased at the same time by removing hulls using different fractionation processes. In order to obtain the different plant-origin feedstock of improved nutritional quality, conventional wet extractions and enzyme treatments were used [21,22,23,24]. However, the application of both the extraction and enzymatic methods have different disadvantages, such as the high cost of the process, harsh conditions which negatively impacts the functionality of ingredient, a huge amount of water and energy usage, and difficulties in recycling waste streams [25,26]. Due to the aforementioned shortcomings of wet methodologies, dry fractionation methodologies appear as “green” and affordable technologies. Namely, these methodologies generate significantly less waste, drying costs are avoided, and due to milder application conditions, the native functionality of proteins and other components remains preserved. There are many published and patented works on the improvement of the nutritional value of different plant materials using dry fractionation methods [6,27,28,29]. In addition, many authors applied these methodologies in order to improve the nutritional quality of SFM meals [11,30,31,32]. The similarity in the work of almost all of these authors is that the treatment of SFM mainly consists of two steps. The first step is grinding of SFM while the second step is the fractionation of the SFM by sieving, air classification, centrifugal and electrostatic separation, or a combination of these techniques.
In our previous work [33], a two dry fractionation processes for protein enrichment of SFM were proposed and compared. The obtained results pointed that, in regard to relative protein content enrichment and yield of the obtained fraction as well, a process that combines two-stage grinding and sieving should be the preferred option over the second studied process that included two-stage grinding and air classification of SFM. The content of the current paper may be observed as a continuation of that work and the goal of this research is to scale up the fractionation process from laboratory to semi-industrial capacity by introducing a Variostuhl roll mill in the grinding step. Two-stage grinding included hammer pre-grinding followed by fine roll grinding after which stock was fractionated by sieving operation. Hammer mill provides crushing of agglomerates but is unable to achieve high level of the separation of the hull and cotyledon particles. On the contrary, roll mills are once-through type of mills with short retention time and provide much more controlled grinding operation especially with appropriate selection of various roll parameters (roll surface, roll gap, feed rate, roll speed, differential etc). By variation of the roll parameters, it is possible to change the extent of the stress and the relative contributions of compressive and shearing forces in the grinding zone. The magnitude and the nature of the forces acting in the grinding zone influence the degree of particle size reduction and energy required for grinding. Moreover, deformation may be ductile or brittle depending on the applied stresses and the structural-mechanical characteristic of the particles to be ground [34]. Consequently, the goal of the current paper is to gain better insight into how varying parameters influence responsive variables and to determine the optimal parameters of the proved process, which will provide SFM fraction with improved protein content and yield acceptable at the industrial scale.
2. Materials and Methods
2.1. Raw Material
The batch of 600 kg of SFM was provided from oil plant “Victoria Oil” Šid, Serbia. It was packed in bags (30 kg each) and 5 bags were randomly selected for the experiment. For purpose of material homogenization, the SFM mass was mixed in a twin-shaft paddle mixer (model SLHSJO.2A, Muyang, Yangzhou, China) for 2 min. The homogeneous SFM was then placed in plastic storage boxes until the beginning of the experiment.
2.2. Processing
The complete fractionation process of SFM, which includes two-stage grinding followed by sieving of ground SFM, was performed at the pilot plant for animal feed production of the Institute of Food Technology in Novi Sad (University of Novi Sad, Serbia), and in the milling laboratory of Faculty of Technology (University of Novi Sad, Serbia).
2.2.1. Two-Stage Grinding of SFM
In order to crush the agglomerates, that are normally present in the SFM produced in the oil factory, the starting SFM was first pre-ground using a hammer mill (ABC Engineering, Pančevo, Serbia) driven by a 2.2 kW electric motor, with the rotational speed of 2880 rotation per minute and 16 hammers assembled in four rows. The SFM was introduced into the mill via the feeder (model FlexwWall®Plus FW40-5, Brabender Technologie KG, Duisburg, Germany) that was temporarily set right above the loading bin of the hammer mill. The feeding rate (F) was controlled by changing speed of feeder screw and it was set and kept constant at 75 kg/h. In order to obtain different grinding intensities, sieves with different openings diameter were used: 2, 4, and 6 mm. Such ground SFM sample batches were separately collected on the basis of grinding intensity and kept in plastic storage boxes until the continuation of the experiment.
Second fine grinding step of pre-ground SFM was performed using laboratory roll mill Variostuhl, model C Ex 2 (Miag, Braunschweig, Germany) equipped with smooth rolls (100 mm length and 250 mm diameter). The semi-industrial device enables relatively easy change of grinding parameters in a wide working range. All operating parameters, except the differential that was kept constant (d = 2), were, according to experimental plan, varied at three levels: roll gap (0.15; 0.20; 0.25 mm); roll speed (400; 500; 600 rpm) and feed rate (0.100; 0.175; 0.250 kg/cm min). The upper and lower levels for independent parameters were chosen based on the results obtained within the preliminary research.
2.2.2. Fractionation of SFM
Fractionation of milled SFM was conducted by use of a Bühler laboratory sifter (Model MLU 300, Uzwil, Switzerland). Square aperture sieves were fitted with rubber balls in order to facilitate particle separation and to clean the sieves. Based on the results obtained in the previous research [33] and average D70 (the value representing the sieve aperture size where 70% of the particles are smaller than this size) determined for sunflower meals obtained after fine grinding by roll mill (results are not presented), sieve aperture with size of 650 µm was used. The assumption was that the value of D70 would provide a good orientation value for the sieve aperture size that would be used in order to obtain fraction yields potentially interesting for wider application at the industrial scale. The sieving time of ground fractions was 3 min, after which sieved fractions were weighed, then collected into marked plastic bags, and stored until further analysis. Yields of the obtained fractions were calculated according to equation:
where mi (g) is the mass of ith fraction of the undersize material and mt (g) is the whole mass of the sieved sample.
2.3. Laboratory Analysis and Responsive Variables
Chemical analyses, and physical analysis of starting and treated SFM, were conducted in the accredited laboratory FINSlab and Technological laboratory for feed of the Institute of Food Technology in Novi Sad, respectively.
2.3.1. Physical Analysis
Bulk density of starting SFM and SFM ground by hammer mill was determined with bulk density tester (Tonindustry, West and Goslar, Germany). Particle size distribution (PSD) of samples ground on hammer and roll mill was determined in accordance with the standard method ISO [35], by sieving 100 g of material through the stock of sieves (3550, 2500, 2000,1250, 1000, 800, 630, 250, 125, 63 µm) using the Retsch AS 200 Control sieving device (Retsh, GmbH, Haan, Germany). Sieving time was set at 1 min, amplitude at 1.5, while geometric mean diameter (GMD) and geometric standard deviation were calculated in order to estimate PSD conforming to A.S.A.E. standard using the equation shown in a study by [36].
2.3.2. Grinding Energy Consumption
Specific energy consumption of grinding was calculated separately for the hammer and the roll mill and summed for total specific energy consumption. Required power used by hammer mill during grinding, for three different sieves (2, 4, and 6 mm), was measured by use of a Network recorder MC750/UMC750 (Iskra MIS, Kranj, Slovenia). Power readings, P (W) were recorded every 5 s during the grinding process, except the first and last 30 s of the grinding process in order to avoid recording the power when the mill chamber was not fully loaded with material. The average of the recorded values of power readings, for specific sieve, was used for further calculations. The specific grinding energy consumption of hammer mill, Eh (Wh/kg), was calculated using the following equation:
here, Ph (W) stands for the average difference in energy consumption of a hammer mill while working with and without material, while F (kg/h) represents feed rate.
A power measurement device, which is an integral part of the laboratory roll mill, was used for measuring the power required when the roll mill operates with material and without. The specific grinding energy consumption of roll mill, Er (Wh/kg), was calculated according to following equation:
where, Pr (W) stands for the average difference in energy consumption of a roll mill while working with and without material, t (s) stands for a time of grinding measured by chronometer, while m (kg) represents the weight of the ground material.
Total specific grinding energy consumption, Et (Wh/kg) was determined simply by calculating the sum of the hammer mill and the roll mill specific energy consumptions:
In order to calculate total specific grinding energy consumption in relation to obtained fraction Etf (Wh/kg) after the sieving step, the following equation was applied:
where y is yield of the fraction obtained after sieving step, while Et (Wh/kg) has same connotation as in Equation (4).
2.3.3. Chemical Analysis
Moisture content, crude fat, and crude ash of the starting SFM were determined in accordance with standard methods ISO [37,38,39]. Crude protein content of starting meal and fractionated meal samples (fraction < 650 µm) was conducted according to standard method ISO [40]. Crude fibre content in starting SFM was determined according to the method Ankom, American Oil Chemist’s Society Ba 6a-05 [41] using the Ankom 2000 fibre analyser (Ankom Technology, Fairport, NY, USA).
2.4. Statistical Analysis
In order to evaluate the influence of varied grinding parameters and to optimize process conditions, the response surface methodology (RSM) was used. The RSM approach is suitable for analysing the relations between several independent factors figuring in the process and their influence on responses of interest important for the investigated process. An important advantage of RSM is the capability to optimize the multi-variable system in the investigated experimental domain applying relatively small number of experiments [42]. This is done first by obtaining a proper response surface model for all evaluated responses and then determining a set of operating conditions that will keep these responses in optimal or at least in the desired range. Central Composite Design (CCD) of 28 runs with four independent process parameters at three levels was applied and with four replicates at the central point to test the lack of fit. Four independent process parameters with coded levels (−1; 0; 1), were denoted as: A—sieve openings diameter (SOD; hammer mill parameter) and B—roll gap, C—feed rate, and D—roll speed (the latter three are roll mill parameters). Observed response parameters were: R1-protein content (<650 µm), R2-fraction yield (<650 µm), and R3-total specific grinding energy consumption in relation to obtained fraction (in further work grinding energy consumption—Etf, as calculated by Equation (5)), The regression analysis was conducted and response variables were fitted to the polynomial model of second order, which describes relationship between independent variables and response variables:
where R is response variable; β0 stand for an intercept; β1 to β44 represent regression coefficients; A, B, C, and D are the coded levels of input factors. The terms AB, AC, AD, BC, BD, and CD represent interactions of input factors, while A2, B2, C2, and D2 are quadratic terms.
Obtained results were subjected to statistical method of analysis of variance (ANOVA) with the significance levels of 5%, while sum of squares were used to calculate corresponding contributions. ANOVA tables are presented in the Supplementary Materials. The quality of fit of polynomial model was performed by calculating the coefficient R2, ‘‘Lack of Fit’’ (LoF) coefficients, and actual vs. predicted plot. The analysis was performed using the software Statistica 14 [43] and Design-Expert 11 [44].
3. Results and Discussion
3.1. SFM Properties
The chemical composition of starting SFM is presented in Table 1. In the context of this work, it is noteworthy that determined protein content of SFM corresponds to a level needed to be categorized as a sunflower meal of second quality [45].

Table 1.
Chemical composition of starting SFM.
Regarding particle size distribution, starting meal consisted of more than 50% particles larger than 1250 µm. The presence of agglomerates led to the highest percent of particles larger than 3550 µm (28.8%) in starting SFM and 38% of particles larger than 2000 µm. The application of the hammer mill was effective in de-agglomeration of SFM for all three sieves used, since only ground material when 6 mm sieve was used, had a negligible amount of particles larger than 3550 µm, while with the other two sieves used, there were no particles larger than 3550 µm. Moreover, the hammer mill managed to reduce the content of particles larger than 2000 µm in ground material to less than 5% for 6 mm sieve, to approximately 1% for 4 mm sieve, and to less than 1% for 2 mm sieve used. The values for bulk density, GMD and D70 of starting material and for ground material obtained using sieves with different SOD, are shown in Table 2.
Table 2.
Physical properties of starting and hammer milled SFM.
From the observed data, it can be noticed that changing the SOD of the sieve had a significant influence on the bulk density of ground material. It was expected that with the decrease in sieve SOD, the finer material would be gained, and, therefore, the bulk density of the ground material would increase. The highest value of bulk density was obtained when the sieve with 2 mm SOD was used (approximately 471 kg/m3), but this value still did not differ significantly from the bulk density value of starting SFM (approximately 467 kg/m3). This was due to the presence of dense and heavy agglomerates in the starting SFM, which were completely eliminated by the pre-grinding step on the hammer mill and the same was reported in the work of [32]. The decrease in SOD used, also influenced the decrease in GMD of ground meals. The GMD of starting SFM was significantly reduced from 1193.97 to 718.02 µm, 586.81 µm, and 477.05 µm, for 6, 4, and 2 mm SOD, respectively. Moreover, it can be noticed from Table 2 that a significant difference exists between D70 values of starting and ground meals. Based on the D70 value for 2 mm (approximately 765 µm), the authors decided to use a sieve with a openings diameter of 650 µm (which was smaller in size than D70) for the fractionation phase of the experiment since the particle size distribution of the SFM is expected to be even more reduced after the second step grinding with Roll mill.
3.2. Fractionation Results
According to the central-composite design, a total of 28 experimental runs were performed and results of targeted responses i.e., protein content, fraction yield, and grinding energy consumption, are shown in Table 3. Every experimental run was performed in triplicates and the average results are shown in the table.
Table 3.
The Face-centred central-composite design and experimentally determined values of targeted responses: protein content (R1); fraction yield (R2); and grinding energy consumption (R3).
Predictive model equations with omitted insignificant regression coefficients are shown in Table 4. The values of coefficient of determination (R2) and p-values for Lack of fit are also shown in Table 4. Corresponding R2 coefficients for protein content (0.6286), fraction yield (0.947192537), and grinding energy consumption (0.95) confirmed that applied models provided appropriate representation of experimental data. The lack of fit testing confirmed adequacy of model since LoF coefficients for all responses had insignificant p-values (p > 0.05).
Table 4.
Second-order polynomial equations for targeted responses.
As presented in Figure 1, regression plots demonstrate a good correlation between experimentally obtained values and values predicted by a model for all three observed responses.
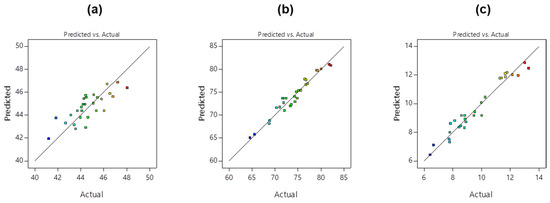
Figure 1.
Comparison of experimental obtained responses and predicted values: (a) protein content; (b) fraction yield; (c) grinding energy consumption.
The graphs illustrating the contribution influence of observed input factors on targeted responses are shown in Figure 2, where with the star are denoted input factors, their interactions and quadratic terms which expressed statistically significant influence on the targeted responses.
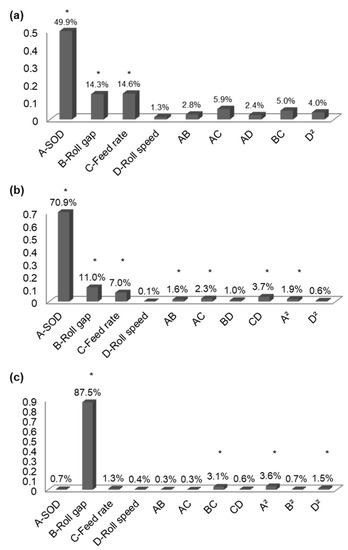
Figure 2.
Contribution graphs of observed parameters influencing: (a) protein content; (b) fraction yield; and (c) grinding energy consumption. By star are denoted input factors, their interactions oe quadratic terms which expressed statistically significant (<0.05) influence (according to ANOVA table) on observed responses.
For a graphical presentation of the significance and direction of influence of investigating parameters on targeted responses, one-factor graphs were used (Figure 3). It is worth noting that in order to reduce the number of graphs, only one-factor graphs for linear terms of investigated factors, which expressed statistically significant influence, were shown here. Thus, interaction graphs of observed parameters and their quadratic terms, even though some of them expressed significant influence on targeted responses, are not presented in this paper.
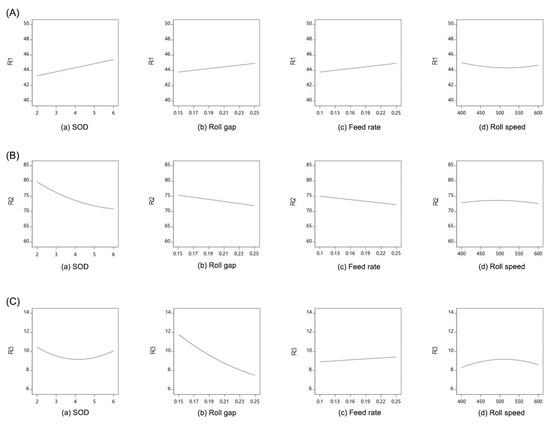
Figure 3.
The influence of the observed parameters on the: (A) protein content; (B) fraction yield; and (C) grinding energy consumption.
3.2.1. Influence of the Grinding Parameters on the Protein Content
Protein content values varied from 41.23% up to 48.06%(dm) (Table 3). The average relative protein enrichment of fractions counted for all 28 performed runs was as high as 23.9%. As suggested by p values from ANOVA, linear terms of SOD, roll gap, and feed rate had a statistically significant impact on this response. As seen in the contribution graphs (Figure 2c), SOD had the biggest impact (49.9%) on protein content, followed by feed rate and roll gap, which contributed almost equally to this response (14.6% and 14.3%, respectively). There is an apparent similarity to the second observed response since the roll speed was also the only investigated parameter that did not express significant influence on fraction yield. Although trend lines had minimum (Figure 3A(d)) and maximum (Figure 3B(d)) value, the influence of the roll speed on the observed response was not significant, and thus it was not discussed and highlighted. In cases of both responses, SOD was the parameter that contributed the most while roll gap and feed rate followed. Moreover, by comparing the one-way graphs for protein content and fraction yield (Figure 3A,B, respectively) it can be concluded that examined parameters had the opposite impact on these responses. This was rather expected as these two responses are inversely related, thus parameters that influenced protein content are supposed to impact the fraction yield too and in an opposite manner.
Observing the trend of influence, it is evident that with increase in SOD protein content was also increased (Figure 3A(a)). This is due to the intensity of grinding which considerably changed when a sieve with different SOD is applied in a hammer mill. Since sieving operation is applied in the fractionation phase of this process, the main goal of the pre-grinding stage is to sufficiently comminute cotyledon particles of the sunflower meal, while at the same time the sunflower hull needs to be comminuted to a lesser extent compared to cotyledon particles. In contrast to the roll mill, the hammer mill is not capable to selectively grind material [46]. Moreover, applying a sieve with a smaller SOD leads to a greater retention time of material in the hammer mill chamber and unselective comminuting due to more pronounced friction forces occurring between the material and the hammer mill sieve. In this experiment, the highest protein contents were obtained when the hammer mill was equipped with the largest SOD (6 mm). Observing Table 3 and comparing the parameters setting of runs with the highest protein content obtained (runs no. 7, 10, 11, 17, and 20), it can be spotted that the sieve with 6 mm SOD does not figure only in run no. 7. Although in this experiment sieve with 2 mm SOD was used, the high protein content obtained was probably a result of milder grinding conditions during the second grinding step with a roll mill since its parameters, which were roll gap, feed rate, and roll speed, were set at 0.25 mm, 0.25 kg/cm min, and 400 rpm, respectively.
Regarding the other two parameters roll gap and feed rate, which also expressed significant influence on protein content, both of them influenced this response in the same manner. More precisely, increasing parameters level (larger roll gap and higher feed rate) also led to an increase in protein content. This can be explained by the difference in the physical properties of the sunflower hull and sunflower kernel. Higher plastic properties of sunflower hull, allow them to pass through the rollers only pressed and almost intact in size. On the other side, the brittle cotyledon particles rich in proteins are trapped by and reduced in size. It is obvious that under the present grinding conditions, SFM exhibits viscoelasticity when fracturing, a condition intermediate between complete brittleness and gross plastic yielding. Smooth rolls finish, relatively small differential and small roll gap used, and consequently under the dominant compressive stresses imposed, the brittle cotyledon particles rich in protein are being communited to a greater extent compared to tough and fibrous hull particles which are being flattened. As a consequence of this behaviour, it is attainable to obtain a relatively high yield of the fraction with increased protein content. However, by adjusting the roll gap and feed rate at a lower level, it is possible that the sunflower hull was ground together with cotyledon particles, which resulted in a higher yield of the fraction and reduced protein content.
3.2.2. Influence of the Grinding Parameters on the Fraction Yield
Fraction yield values (particle size < 650 µm) were in range from 64.6% up to 82.2% (Table 3). According to p-values from ANOVA results all linear terms of investigated factors except roll speed, had a statistically significant influence on fraction yield. Moreover, the interaction of SOD and roll gap, SOD and feed rate, feed rate and roll speed, and the quadratic term of SOD also had a significant impact on this response. The contribution graph (Figure 2b) suggests that SOD had the most dominant impact (70.9%) on fraction yield, followed by roll gap (11.0%), and feed rate (7.0%), which showed only moderate influence.
The trend of influence of SOD on fraction yield can be observed on the one-way graph (Figure 3B(a)) which indicates clearly that increase in the SOD caused decrease in the fraction yield. This was rather expected since with the higher grinding intensity (smaller SOD used) the GMD of particles decreased (Table 2), and thus more particles were able to pass through the sieve influencing the higher fraction yield. Aforementioned emphasizes the importance and necessity of the hammer mill grinding in order to crush the present agglomerates and obtain a higher yield of fractions.
Similar to SOD, the roll gap, and the feed rate, also expressed a significant negative influence on the fraction yield, yet with considerably lower contributions. This is illustrated in Figure 3B(b),(c), where it can be seen that the elevation of both of these two parameters led to the reduced fraction yield. This kind of impact was quite expected, since a decreased roll gap setting leads to intensifying of the compressive forces in the grinding zone. Moreover, it leads to the elongation of the grinding zone causing prolonged grinding action on the particles. Therefore, with the reduction in the roll gap, greater stresses are imposed, which increases the number of the fractures and the degree of the particle size reduction [34,47,48]. Regarding the feed rate and its negative influence on this response, it is due to the fact that when the feed rate was elevated, more particles are at the same time present in the grinding zone. Therefore compressive and shearing forces are distributed to a greater mass causing less stress to each of the particles. As a result, less particle size reduction of milled material is obtained, which leads to decreased fraction yield after the sieving operation. This trend of influence is in accordance with reported in the papers of many authors [49,50,51,52].
Interaction of feed rate and roll speed had also a significant influence on the fraction yield. Noted influence of the roll speed and feed rate on the sunflower meal fraction yield was in accordance with the ribbon theory, presented by Perry and Chilton [49]. This theory predicts that grinding action is proportional to the ratio of these two parameters. With the increase in the roll speed, feed ribbon spreads out, reducing the load in the grinding zone. This causes increased grinding action on each particle present in the grinding zone resulting in higher particle size reduction of the ground material. On the other hand, an increased feed rate reduces the amount of grinding action any given particle receives since it is distributed to the greater mass (more material needs to be ground in the same period of time). Thus, the increased feed rate led to less particle size reduction of the ground material, lowering fraction yield.
3.2.3. Influence of the Grinding Parameters on the Grinding Energy Consumption
The grinding energy consumption ranged from 6.44 to 13.30 Wh/kg (Table 3). According to the ANOVA results, roll gap expressed statistically significant influence and its interaction with feed rate. Although the linear terms SOD and roll speed did not express, their quadratic terms expressed a significant influence on this parameter. Similar could be concluded from the contribution graph of grinding parameters influencing this response (Figure 2c). Observed in this graph is a distinctly dominant influence of roll gap (87.5%), followed by quadratic terms of SOD and roll speed, and interaction of roll gap and feed rate (3.6%, 1.5%, and 3.1% respectively).
Regarding the trend of influence from the one-way graph (Figure 3C(b)) it can be concluded that, as expected, decrease in the roll gap influenced the increase in grinding energy consumption. The explanation for this could be due to the higher power requirements of the roll mill needed in order to surpass the resistance of particles during grinding when the roll gap is set at a lower level. On contrary, when the roll gap was set to higher levels power requirements to overcome particle resistance during grinding operation decreased. Scanlon and Dexter (1986) [50], Scanlon et al. (1988) [34], and Bojanić et al. (2021) [52] also stated that there was a significant relation between energy consumption and the roll gap.
When it comes to the SOD influence, from the one-way graph it can be seen that grinding energy consumption first decreased with the increase in SOD from 2 mm to 4.17 mm, then increased with a further enhancement in SOD from 4.17 mm to 6 mm (Figure 3C(a)). These results were rather expected, considering that values of energy consumption were values of total energy consumption measured for both grinding devices calculated and presented in the paper as a sum. As previous authors reported in paper [53], the variation of the SOD significantly impact the energy consumption of the hammer mill, lowering the energy consumption when sieves with larger SOD were used. Although less energy was consumed by the hammer mill, when sieve with the SOD of 6 mm is adjusted, as result, a sunflower meal with a coarser particle size distribution was obtained. As a consequence, the roll mill, which follows the hammer mill in the process, required more energy in order to mill such a mass consisting of much coarser particles. As opposed, when a sieve with a SOD of 2 mm is applied, the hammer mill uses more energy to perform grinding action. Still, such a finer ground material obtained after hammer mill is later easier comminuted by the roll mill rollers causing less grinding energy consumed during this grinding step. When it comes to the roll speed, its quadratic term expressed a statistically significant influence on the observed response. With the increase in the roll speed from 400 r/min to 510 r/min, grinding energy consumption increased, while with further increase in this parameter observed response had a slightly decreasing trend (Figure 3C(d)).
3.2.4. Comparison of the Results with the Previous Research
Many authors applied dry fractionation processes in order to improve the nutritional quality of SFM meals. A minor review of the previous studies related to dry fractionation of SFM is shown in Table 5. This table specifies the techniques utilized in these works, starting protein content of SFM and protein content of enriched SFM, as well as relative protein enrichment and fraction yield of obtained fractions, and is very suitable to compare results obtained in current work with previous work related to the same topic. It should be noted that the authors presented only the results of those works that they considered the most important in terms of the relative protein enrichment of treated SFM and its fraction yield. In the papers where the relative protein enrichment or its fraction yield was not clearly emphasized, the authors calculated those values.
Table 5.
Published work related to dry fractionation of SFM and highlighted results.
The highest protein content obtained in current work was 48.06%(dm) with fraction yield of 77.22% (Table 3-run no. 7). When expressing an increase in protein content as a relative enrichment, relative protein enrichment in this run would be as high as 33.3%.
As mentioned above, the current work represents continuation of the previously published study by Vidosavljević et al. (2019) [33]. Thus, one of its goals was to investigate whether is the proposed process feasible to provide higher relative protein enrichment and fraction yield than reported in the previous paper. Based on the data in Table 5, it can be concluded that by implementing the process proposed in the current work higher relative protein enrichment and higher fraction yield were obtained. When compared to the previous works of other authors, observations are as follows. Draganov (2015) [6] patented a multi-step process that included deagglomeration with hammer mills combined with several subsequent sieving or air sieving steps and managed to obtain high relative protein enrichment and fraction yield, which is comparable to results obtained in current study. However, the process proposed in current study requires fewer steps, which could be of importance when considered in industrial-scale production. Murru and Calvo (2020) [11] reported that with combination of milling, sieving, and gravity tables it is possible to improve a protein content of SFM to a level close to that of low pro soybean meal. Banjac et al. (2017) [32] and Laguna et al. (2018) [55] used air classification in order to improve SFM content and were able to get a relative protein content enrichment as high as 41.4% and 67.4%, respectively. However, yields of obtained fraction reported in the mentioned works were lower when compared with fraction yields obtained in current study. To the best of our knowledge, the highest relative protein enrichment of SFM so far, regarding dry fractionation methods, is reported in the work of Laguna et al. (2018) [55]. These authors used a pilot electrostatic separator and were able to obtain a relative protein enrichment of 97.1% with a fraction yield of 18%. In order to enhance the fraction yield, the authors performed multiple recycling steps and were able to get a fraction yield higher than 32%, but relative protein enrichment was consequently reduced to 70.3%. Even though some of the aforementioned research describe techniques able to provide relative protein enrichments of SFM that are higher than those obtained in this study, still their drawback could be the high cost of the equipment and low fraction yields that could potentially represent a limitation for attaining a wider application in the industry. Therefore, process for SFM improvement proposed in current work can be regarded as a simple, economical process which does not include many process steps and thus would not require large investments if implemented on the industrial level. Furthermore, the proposed process are able to be adjusted in terms of operating parameters, which can be used in order to obtain SFM with wide range of protein content and fraction yields values.
3.3. Optimization
In this work, multi-response optimization procedure was conducted in order to determine the best set of grinding parameters (SOD, roll gap, feed rate, and roll speed) which would be able to provide desired levels of responses (protein content, fraction yield, and grinding energy consumption). All input factors were held in range and were set to meet requirements for maximum flour yield, minimum total energy consumption, and to provide protein content that is not lower than 45.5%(dm). According to Serbian Regulations on animal feed quality [45], sunflower meal with protein content of 42%(as is) is categorized as “high protein” sunflower meal of first quality. On the other hand, soybean meal with protein content of 44%(as is) is categorized as soybean meal of second quality. Considering that aforementioned Regulations allows permissible deviation of 2% (Article no. 105, Table 57), and taking into account that the sunflower meal used in this experiment had moisture content of 7.69%, the authors calculated that achieved sunflower meal protein content of 45.5%(dm) would be sufficient to level up with the soybean meal of second quality. Fraction yield was maximized aiming to provide value that would be acceptable on an industrial scale, while at the same time grinding energy consumption was minimized which is of paramount importance from an economic point of view. Since protein content is observed as the most important response in this experiment it was given the highest value of the coefficient of importance (set at 5), while the coefficient of the importance of fraction yield and total energy consumption was set at 3. Optimization targets and limits for input factor and responses, and optimization desirability are presented in summary in Table 6.
Table 6.
Optimization of the fractionation process: targets and limits for input factor and responses and desirability.
The optimized set of input values was determined: SOD of 2 mm, roll gap of 0.25 mm, feed rate of 0.2 kg/cm min, and roll speed of 400 rpm. Predicted values for targeted responses were: protein content 45.5%(dm), fraction yield 77.89%, and grinding energy consumption 8.31 Wh/kg.
4. Conclusions
A dry fractionation process combining two-step grinding and sieving was conducted in order to improve the protein content of the sunflower meal. The average relative protein enrichment of fractions performed in all 28 runs suggested by CCD, was as high as 23.9%. The highest protein content obtained in current work was 48.06%(dm) (fraction yield of 77.22%), which was the highest relative protein enrichment of 33.3%. By running this process at a proper set of parameters, it is possible to produce protein-enriched sunflower meal which could be categorized as a “high protein” sunflower meal of first quality (according to Serbian national regulations), or even more to increase the protein content of sunflower meal to a level of the protein content of soybean meal of second quality. The central composite design was utilized in order to estimate the influence of sieve openings diameter, roll gap, feed rate, and roll speed on protein content, fraction yield, and grinding energy consumption. Sieve openings diameter expressed the highest impact on fraction yield followed by roll gap and feed rate. Roll gap was the only input factor that significantly influenced grinding energy consumption. The protein content was significantly dependent on all input factors except roll speed, while roll gap expressed most dominant influence. With the increase in the roll gap, energy consumption decreased, while the protein content increased, as a consequence of the change of deformation forces influencing sunflower meal particles in the grinding zone. Multi-response optimization was performed and optimal parameters were: sieve openings diameter of 2 mm, roll gap of 0.25 mm, feed rate of 0.2 kg/cm min, and roll speed of 400 rpm. Predicted values for desired range of responses were: protein content 45.5%(dm), fraction yield 77.89%, and grinding energy consumption 8.31 Wh/kg.
The process for SFM improvement proposed in this work is a simple economical process that does not include many steps and does not require large investments in order to be implemented on the industrial level. The proposed process is adjustable in terms of operating parameters and thus is suitable for the production of SFM fractions with a wide range of protein content and fraction yields. It could be regarded as an innovation that current study offers to the oil industry, enabling it to increase the value of the SFM which is massively obtained as a by-product of oil extraction.
Supplementary Materials
The following supporting information can be downloaded at: https://www.mdpi.com/article/10.3390/pr10122704/s1, Table S1: ANOVA table for protein content (R1); Table S2: ANOVA table for fraction yield (R2); Table S3: ANOVA table for grinding energy consumption (R3).
Author Contributions
Conceptualization, S.V., V.B. and A.F.; methodology and software, S.V. and D.R.; formal analysis, S.V., N.B. and P.I.; visualization, P.I. and D.R.; writing—original draft preparation, S.V.; writing—review and editing, N.B., D.R., V.B. and A.F.; resources and supervision, O.Đ., V.B. and A.F. All authors have read and agreed to the published version of the manuscript.
Funding
The study was funded by the Ministry of Education, Science and Technological Development of the Republic of Serbia (Project No. 451-03-68/2022-14/200222 and Project No. 451-03-68/2022-14/200134).
Data Availability Statement
All data is contained within the article and the Supplementary Materials.
Conflicts of Interest
The authors declare no conflict of interest.
References
- Ezeh, A.C.; Bongaarts, J.; Mberu, B. Global population trends and policy options. Lancet 2012, 380, 142–148. [Google Scholar] [CrossRef] [PubMed]
- Pojić, M.; Mišan, A.; Tiwari, B. Eco-innovative technologies for extraction of proteins for human consumption from renewable protein sources of plant origin. Trends Food Sci. Technol. 2018, 75, 93–104. [Google Scholar] [CrossRef]
- Senkoylu, N.; Dale, N. Sunflower meal in poultry diets: A review. Worlds. Poult. Sci. J. 1999, 55, 169–174. [Google Scholar] [CrossRef]
- Đorđević, N.; Dinić, B. Proizvodnja Smeša Koncentrata za Životinje; Institut za Krmno Bilje: Kruševac, Serbia, 2011. [Google Scholar]
- Dozier, W.A.; Hess, J.B.; El-Shemy, H. Soybean meal quality and analytical techniques. In Soybean and Nutrition; El-Shemy, H., Ed.; IntechOpen: Auburn, AL, USA, 2011; pp. 111–124. [Google Scholar]
- Draganov, L.K. Process for Preparing High Protein Sunflower Meal Fraction. European Patent EP 2848128 A1, 15 March 2017. [Google Scholar]
- Taelman, S.E.; De Meester, S.; Van Dijk, W.; Da Silva, V.; Dewulf, J. Environmental sustainability analysis of a protein-rich livestock feed ingredient in the Netherlands: Microalgae production versus soybean import. Resour. Conserv. Recycl. 2015, 101, 61–72. [Google Scholar] [CrossRef]
- Mushtaq, T.; Sarwar, M.; Ahmad, G.; Nisa, M.U.; Jamil, A. The influence of exogenous multienzyme preparation and graded levels of digestible lysine in sunflower meal-based diets on the performance of young broiler chicks two weeks posthatching. Poult. Sci. 2006, 85, 2180–2185. [Google Scholar] [CrossRef]
- Lomascolo, A.; Uzan-Boukhris, E.; Sigoillot, J.C.; Fine, F. Rapeseed and sunflower meal: A review on biotechnology status and challenges. Appl. Microbiol. Biotechnol. 2012, 95, 1105–1114. [Google Scholar] [CrossRef]
- Ramachandran, S.; Singh, S.K.; Larroche, C.; Soccol, C.R.; Pandey, A. Oil cakes and their biotechnological applications-A review. Bioresour. Technol. 2007, 98, 2000–2009. [Google Scholar] [CrossRef]
- Murru, M.; Calvo, C.L.; Sunflower Protein Enrichment. Methods and potential applications. OC Oilseeds Fats Crop. Lipids 2020, 27, 17. [Google Scholar] [CrossRef]
- Ivanova, P.; Chalova, V.; Koleva, L.; Pishtizski, I.; Perifanova-Nemska, M. Optimization of protein extraction from sunflower meal produced in Bulgaria. Bulg. J. Agric. Sci. 2012, 18, 153–160. [Google Scholar]
- Mérida, S.N.; Tomás-Vidal, A.; Martínez-Llorens, S.; Jover Cerdá, M. Sunflower meal as a partial substitute in juvenile sharpsnout sea bream (Diplodus puntazzo) diets: Amino acid retention, gut and liver histology. Aquaculture 2010, 298, 275–281. [Google Scholar] [CrossRef]
- Gonzalez-Perez, S.; Vereijken, J.M. Sunflower proteins: Overview of their physicochemical, structural and functional properties. J. Sci. Food Agric. 2007, 87, 2173–2191. [Google Scholar] [CrossRef]
- Canibe, N.; Pedrosa, M.M.; Robredo, L.M.; Knudsen, K.E.B. Chemical composition, digestibility and protein quality of 12 sunflower (Helianthus annuus L) cultivars. J. Sci. Food Agric. 1999, 79, 1775–1782. [Google Scholar] [CrossRef]
- Stake, P.E.; Owens, M.J.; Schingoethe, D.J. Rapeseed, Sunflower, and Soybean Meal Supplementation of Calf Rations. J. Dairy Sci. 1973, 56, 783–788. [Google Scholar] [CrossRef]
- Lardy, G.P.; Anderson, V. Canola and sunflower meal in beef cattle diets. Vet. Clin. North Am. Food Anim. Pract. 2002, 18, 327–338. [Google Scholar] [CrossRef]
- Jabbar, M.A.; Marghazani, I.B. Effect of replacing cotton seed cake with sunflower meal on milk yield and milk composition in lactating nili-ravi buffaloes. JAPS J. Anim. Plant Sci. 2009, 19, 6–9. [Google Scholar]
- Raza, S.; Ashraf, M.; Pasha, T.N.; Latif, F. Effect of enzyme supplementation of broiler diets containing varying level of sunflower meal and crude fiber. Pakistan J. Bot. 2009, 41, 2543–2550. [Google Scholar]
- Lević, J.; Sredanović, S. Suncokretova Sačma, Monografija; Institute of Food Technology in Novi Sad: Novi Sad, Serbia, 2012. [Google Scholar]
- Rommi, K.; Holopainen, U.; Pohjola, S.; Hakala, T.K.; Lantto, R.; Poutanen, K.; Nordlund, E. Impact of particle size reduction and carbohydrate-hydrolyzing enzyme treatment on protein recovery from rapeseed (Brassica rapa L.) press cake. Food Bioprocess Technol. 2015, 8, 2392–2399. [Google Scholar] [CrossRef]
- Kachrimanidou, V.; Kopsahelis, N.; Alexandri, M.; Strati, A.; Gardeli, C.; Papanikolaou, S.; Komaitis, M.; Kookos, I.K.; Koutinas, A.A. Integrated sunflower-based biorefinery for the production of antioxidants, protein isolate and poly(3-hydroxybutyrate). Ind. Crop. Prod. 2015, 71, 106–113. [Google Scholar] [CrossRef]
- Erdaw, M.M.; Bhuiyan, M.M.; Iji, P.A. Enhancing the nutritional value of soybeans for poultry through supplementation with new-generation feed enzymes. World’s Poult. Sci. J. 2016, 72, 307–322. [Google Scholar] [CrossRef]
- Lovatto, N.M.; Goulart, F.R.; Loureiro, B.B.; Speroni, C.S.; Bender, A.B.B.; Giacomini, S.J.; Radünz Neto, J.; Da Silva, L.P. Crambe (Crambe abyssinica) and sunflower (Helianthus annuus) protein concentrates: Production methods and nutritional properties for use in fish feed. An. Acad. Bras. Cienc. 2017, 89, 2495–2504. [Google Scholar] [CrossRef]
- Schutyser, M.A.I.; Van der Goot, A.J. The potential of dry fractionation processes for sustainable plant protein production. Trends Food Sci. Technol. 2011, 22, 154–164. [Google Scholar] [CrossRef]
- Arrutia, F.; Binner, E.; Williams, P.; Waldron, K.W. Oilseeds beyond oil: Press cakes and meals supplying global protein requirements. Trends Food Sci. Technol. 2020, 100, 88–102. [Google Scholar] [CrossRef]
- Wang, N.; Maximiuk, L. Effect of air classification processing variables on yield, composition, and certain antinutrients of air-classified fractions from field peas by response surface methodology. J. Food Process. Preserv. 2019, 43, e13999. [Google Scholar] [CrossRef]
- Xing, Q.; de Wit, M.; Kyriakopoulou, K.; Boom, R.M.; Schutyser, M.A.I. Protein enrichment of defatted soybean flour by fine milling and electrostatic separation. Innov. Food Sci. Emerg. Technol. 2018, 50, 42–49. [Google Scholar] [CrossRef]
- Xing, Q.; Utami, D.P.; Demattey, M.B.; Kyriakopoulou, K.; de Wit, M.; Boom, R.M.; Schutyser, M.A.I. A two-step air classification and electrostatic separation process for protein enrichment of starch-containing legumes. Innov. Food Sci. Emerg. Technol. 2020, 66, 102480. [Google Scholar] [CrossRef]
- Lević, J.; Delić, I.; Ivić, M.; Rac, M.; Stefanović, S. Removal of cellulose from sunflower meal by fractionation. J. Am. Oil Chem. Soc. 1992, 69, 890–893. [Google Scholar] [CrossRef]
- Laudadio, V.; Bastoni, E.; Introna, M.; Tufarelli, V. Production of low-fiber sunflower (Helianthus annuus L.) meal by micronization and air classification processes. CYTA J. Food. 2013, 11, 398–403. [Google Scholar] [CrossRef]
- Banjac, V.; Pezo, L.; Pezo, M.; Vukmirović, Đ.; Čolović, D.; Fišteš, A.; Čolović, R. Optimization of the classification process in the zigzag air classifier for obtaining a high protein sunflower meal–Chemometric and CFD approach. Adv. Powder Technol. 2017, 28, 1069–1078. [Google Scholar] [CrossRef]
- Vidosavljević, S.; Bojanić, N.; Stojkov, V.; Čolović, R.; Đuragić, O.; Fišteš, A.; Banjac, V. Comparison of two dry fractionation processes for protein enrichment of sunflower meal. Food Feed Res. 2019, 46, 209–217. [Google Scholar] [CrossRef]
- Scanlon, M.G.; Dexter, J.E.; Bilideris, C.G. Particle-size related physical properties of flour produced by smooth roll reduction of hard red spring wheat farina. Cereal Chem. 1988, 65, 486–492. [Google Scholar]
- ISO 2591-1; Test Sieving-Part 1: Methods Using Test Sieves of Woven Wire Cloth and Perforated Metal Plate. International Organization for Standardization: Geneva, Switzerland, 1988.
- Vukmirović, Đ.; Lević, J.; Fišteš, A.; Čolović, R.; Brlek, T.; Čolović, D.; Djuragić, O. Influence of grinding method and grinding intensity of corn on mill energy consumption and pellet quality. Hem. Ind. 2016, 70, 67–72. [Google Scholar] [CrossRef]
- ISO 6496; Animal Feeding Stuffs-Determination of Moisture and Other Volatile Matter Content. International Organization for Standardization: Geneva, Switzerland, 2001.
- ISO 6492; Animal Feeding Stuffs—Determination of Fat Content. International Standards Organization: Geneva, Switzerland, 2001.
- ISO 5984; Animal Feeding Stuffs—Determination of Crude Ash. International Organization for Standardization: Geneva, Switzerland, 2013.
- ISO 5983-1; Animal Feeding Stuffs-Determination of Nitrogen Content and Calculation of Crude Protein Content-Part 1: Kjeldahl Method (ISO 5983-1:2005). International Organization for Standardization: Geneva, Switzerland, 2010.
- AOCS. Official Methods and Recommended Practices of the AOCS; Official Method Ba 6-a05; The American Oil Chemists Society: Champaigns, IL, USA, 2005. [Google Scholar]
- Myers, R.; Montgomery, D.; Anderson-Cook, C. Response Surface Methodology: Process and Product Optimization Using Designed Experiments; Wiley: New York, NY, USA, 2009. [Google Scholar]
- TIBCO Software Inc. Data Science Workbench; Version 14; Statistica 14; TIBCO Software Inc.: Palo Alto, CA, USA, 2020; Available online: http://tibco.com (accessed on 25 August 2022).
- Anderson, M.J.; Whitcomb, P.J. DoE Simplified: Practical Tools for Effective Experimentation; Productivity Press: New York, NY, USA, 2007. [Google Scholar]
- Official Gazette of Republic of Serbia. Regulation on Animal Feed Quality: 4/2010, 113/2012, 27/2014, 25/2015, 39/2016, 54/2017. 2010. Available online: https://www.pravno-informacioni-sistem.rs/SlGlasnikPortal/eli/rep/sgrs/ministarstva/pravilnik/2010/4/10/reg (accessed on 7 November 2022).
- Vukmirović, Đ. Influence of Grinding and Pelleting Parameters on Granulation and Physical Characteristics of Pelleted Animal Feed. Ph.D Thesis, University of Novi Sad, Novi Sad, Serbia, 2015. (In Serbian). [Google Scholar]
- Haque, E. Application of size reduction theory to roller mill design and operation. Cereal Foods World 1991, 36, 368–375. [Google Scholar]
- Fang, C.; Campbell, G.M. Effect of roll fluting disposition and roll gap on breakage of wheat kernels during first-break roller milling. Cereal Chem. 2002, 79, 518–522. [Google Scholar] [CrossRef]
- Perry, R.H.; Chilton, C.H. Chemical Engineers’ Handbook; McGraw Hill: New York, NY, USA, 1973. [Google Scholar]
- Scanlon, M.G.; Dexter, J.E. Effect of Smooth Roll Grinding Conditions on Reduction of Hard Red Spring Wheat Farina. Cereal Chem. 1986, 63, 431–435. [Google Scholar]
- Fišteš, A.; Rakić, D.; Vukmirović, Đ.; Bojanić, N. The possibilities of wheat roller milling optimization using the response surface methodology. J. Process. Energy Agric. 2017, 21, 118–123. [Google Scholar] [CrossRef]
- Bojanić, N.; Fišteš, A.; Rakić, D.; Kolar, S.; Ćurić, B.; Petrović, J. Study on the effects of smooth roll grinding conditions on reduction of wheat middlings using response surface methodology. J. Food Sci. Technol. 2021, 58, 1430–1440. [Google Scholar] [CrossRef]
- Vukmirović, Đ.; Fišteš, A.; Lević, J.; Čolović, R.; Rakić, D.; Brlek, T.; Banjac, V. Possibilities for preservation of coarse particles in pelleting process to improve feed quality characteristics. J. Anim. Physiol. Anim. Nutr. 2017, 101, 857–867. [Google Scholar] [CrossRef]
- Banjac, V.; Čolović, R.; Vukmirović, Đ.; Sredanović, S.; Čolović, D.; Lević, J.; Teodosin, S. Protein enrichment of sunflower meal by air classification. Food Feed Res. 2013, 40, 77–83. [Google Scholar]
- Laguna, O.; Barakat, A.; Alhamada, H.; Durand, E.; Baréa, B.; Fine, F.; Villeneuve, P.; Citeau, M.; Dauguet, S.; Lecomte, J. Production of proteins and phenolic compounds enriched fractions from rapeseed and sunflower meals by dry fractionation processes. Ind. Crop. Prod. 2018, 118, 160–172. [Google Scholar] [CrossRef]


Publisher’s Note: MDPI stays neutral with regard to jurisdictional claims in published maps and institutional affiliations. |
© 2022 by the authors. Licensee MDPI, Basel, Switzerland. This article is an open access article distributed under the terms and conditions of the Creative Commons Attribution (CC BY) license (https://creativecommons.org/licenses/by/4.0/).