Article

Magnetic Activated Biochar Fe3O4-MOS Made from Moringa Seed Shells for the Adsorption of Methylene Blue

School of Life Sciences, Shanxi University, Taiyuan 030006, China
*
Author to whom correspondence should be addressed.
Processes 2022, 10(12), 2720; https://doi.org/10.3390/pr10122720
Submission received: 4 November 2022 / Revised: 10 December 2022 / Accepted: 13 December 2022 / Published: 16 December 2022
(This article belongs to the Section Environmental and Green Processes)

Abstract

:
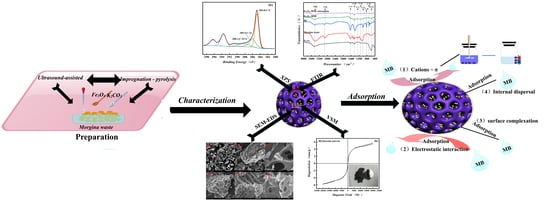
In recent years, more and more biochars have been employed to treat dye wastewater. In order to increase the utilization of moringa seed shell resources and enrich the removal method of methylene blue (MB) in solution, in the current study, the magnetic moringa seed shells biochar was prepared through ultrasonic-assisted impregnation and pyrolysis, while Fe3O4 was used to activate the material to obtain adsorption (Fe3O4-MOS). The prepared adsorbents were characterized by SEM-EDS, XRD, XPS, FTIR, N2 adsorption and desorption and VSM. Under the suitable experimental conditions, the removal rate can be close to 100% and the maximum adsorption capacity of MB could be 219.60 mg/g. The Freundlich model provided a good match to the data presented by the adsorption isotherm, and the adsorption of MB on Fe3O4-MOS was a spontaneous and endothermic reaction. Study of the mechanism indicated that pore adsorption, electrostatic interaction, hydrogen bond, and π-π interaction were the major adsorption mechanisms. After five cycles, it was found that Fe3O4-MOS had a high removal rate for MB, which was close to 90%. This work provides a new idea for moringa seed shells and the results confirm that Fe3O4-MOS has substantial potential for dye wastewater treatment.

Graphical Abstract

1. Introduction

According to an admittedly incomplete statistic, the global output of dyes exceeds 0.79 million tons, and there are more than 100,000 kinds of dyes [1]. The rapid development of textile, paper, printing, medicine, cosmetics and so on has promoted the large-scale applications of methylene blue. About 10 to 15% of them, however, were discharged into the environment during the processing of manufacture and operation [2]. After entering the body of water, the untreated methylene blue wastewater can reduce the transparency of the water and result in visual pollution [3]. It will also affect the growth of aquatic organisms and microorganisms [4], cause eutrophication and eventually destroy the self-purification ability of water bodies [5]. Moreover, due to the fact that the dye is not easily biodegradable, it can exist in the environment for a long time, spread through the food chain, and be enriched in the human body [6]. It is becoming increasingly urgent to filter out these dyes before they are released into ecosystems’ water supplies. At present, methods for removing dyes are mainly oxidation [7], adsorption [8], membrane separation [9], flocculation [9] and biodegradation [10]. Compared with the above methods, adsorption serves as the effective way to remove dyes due to its high efficiency, low consumption, easy operation [8] and selective enrichment of certain substances.
Over the past several years, commercial activated carbon, resin [10], mineral waste (e.g., Slag [11], cinder and fly ash [12]), natural raw materials (e.g., the roots of water hyacinth [13], bacteria [14], and green algae [15]) and agricultural waste, such as peanut husk [16], bamboo [17], wheat straw [18], rice husk [19], Eucalyptus sheathiana bark [20] and other natural carbon fibers, have been developed to achieve the adsorption of dye wastewater. Recently, magnetic biochar has been considered as an effective adsorbent derived from various agricultural wastes because of its larger pore structure, stronger adsorption capacity and higher surface activity. It could not only reduce secondary pollution during agricultural waste disposal, but also realize the recycling and reuse of agricultural waste. Furthermore, it could offer the advantage of easy separation by external magnetic force and recovery after catalytic runs or environmental remediation. Magnetic biochar has been synthesized by the pyrolysis of magnetic medium (e.g., FeCl3 [21], ZnCl2 [22] or α-Fe2O3 [23]) and biochar. The method of impregnation-pyrolysis has become a popular treatment method because of its simple operation, easy control of reaction conditions, and stable combination of magnetic particles and biochar [24]. There have been research studies about chemical impregnation to modify watermelon rind [25], bamboo [26], ashe juniper [26], rice husk [27] and other raw materials. It has been found that their physical and chemical properties and adsorption capacity were significantly improved by using various characterization methods.
With the development and application of the functional components of Moringa seeds, most moringa seed shells, with 52% crude fiber and other nutrients (e.g., amino acids, trace elements, flavonoids and proteins), were discarded or burned off in stacks, which caused resource dissipation and environmental pollution. In recent years, moringa seed shells have been evaluated for the removal of various contaminants from water, such as diuron [28], atrazine [29], and nickel [30]. However, natural materials suffer from many disadvantages, such as poor adsorption capacity, lower ability to be regenerated and secondary contamination by microorganisms. It was urgent to further improve the adsorption capacity of moringa seed shells for dyes, reduce the secondary pollution of the adsorption process, and increase the feasibility of its large-scale practical application. To the best of our knowledge, in the literature, there have been few reports of moringa seed shell biochar, let alone magnetic moringa seed shell biochar.
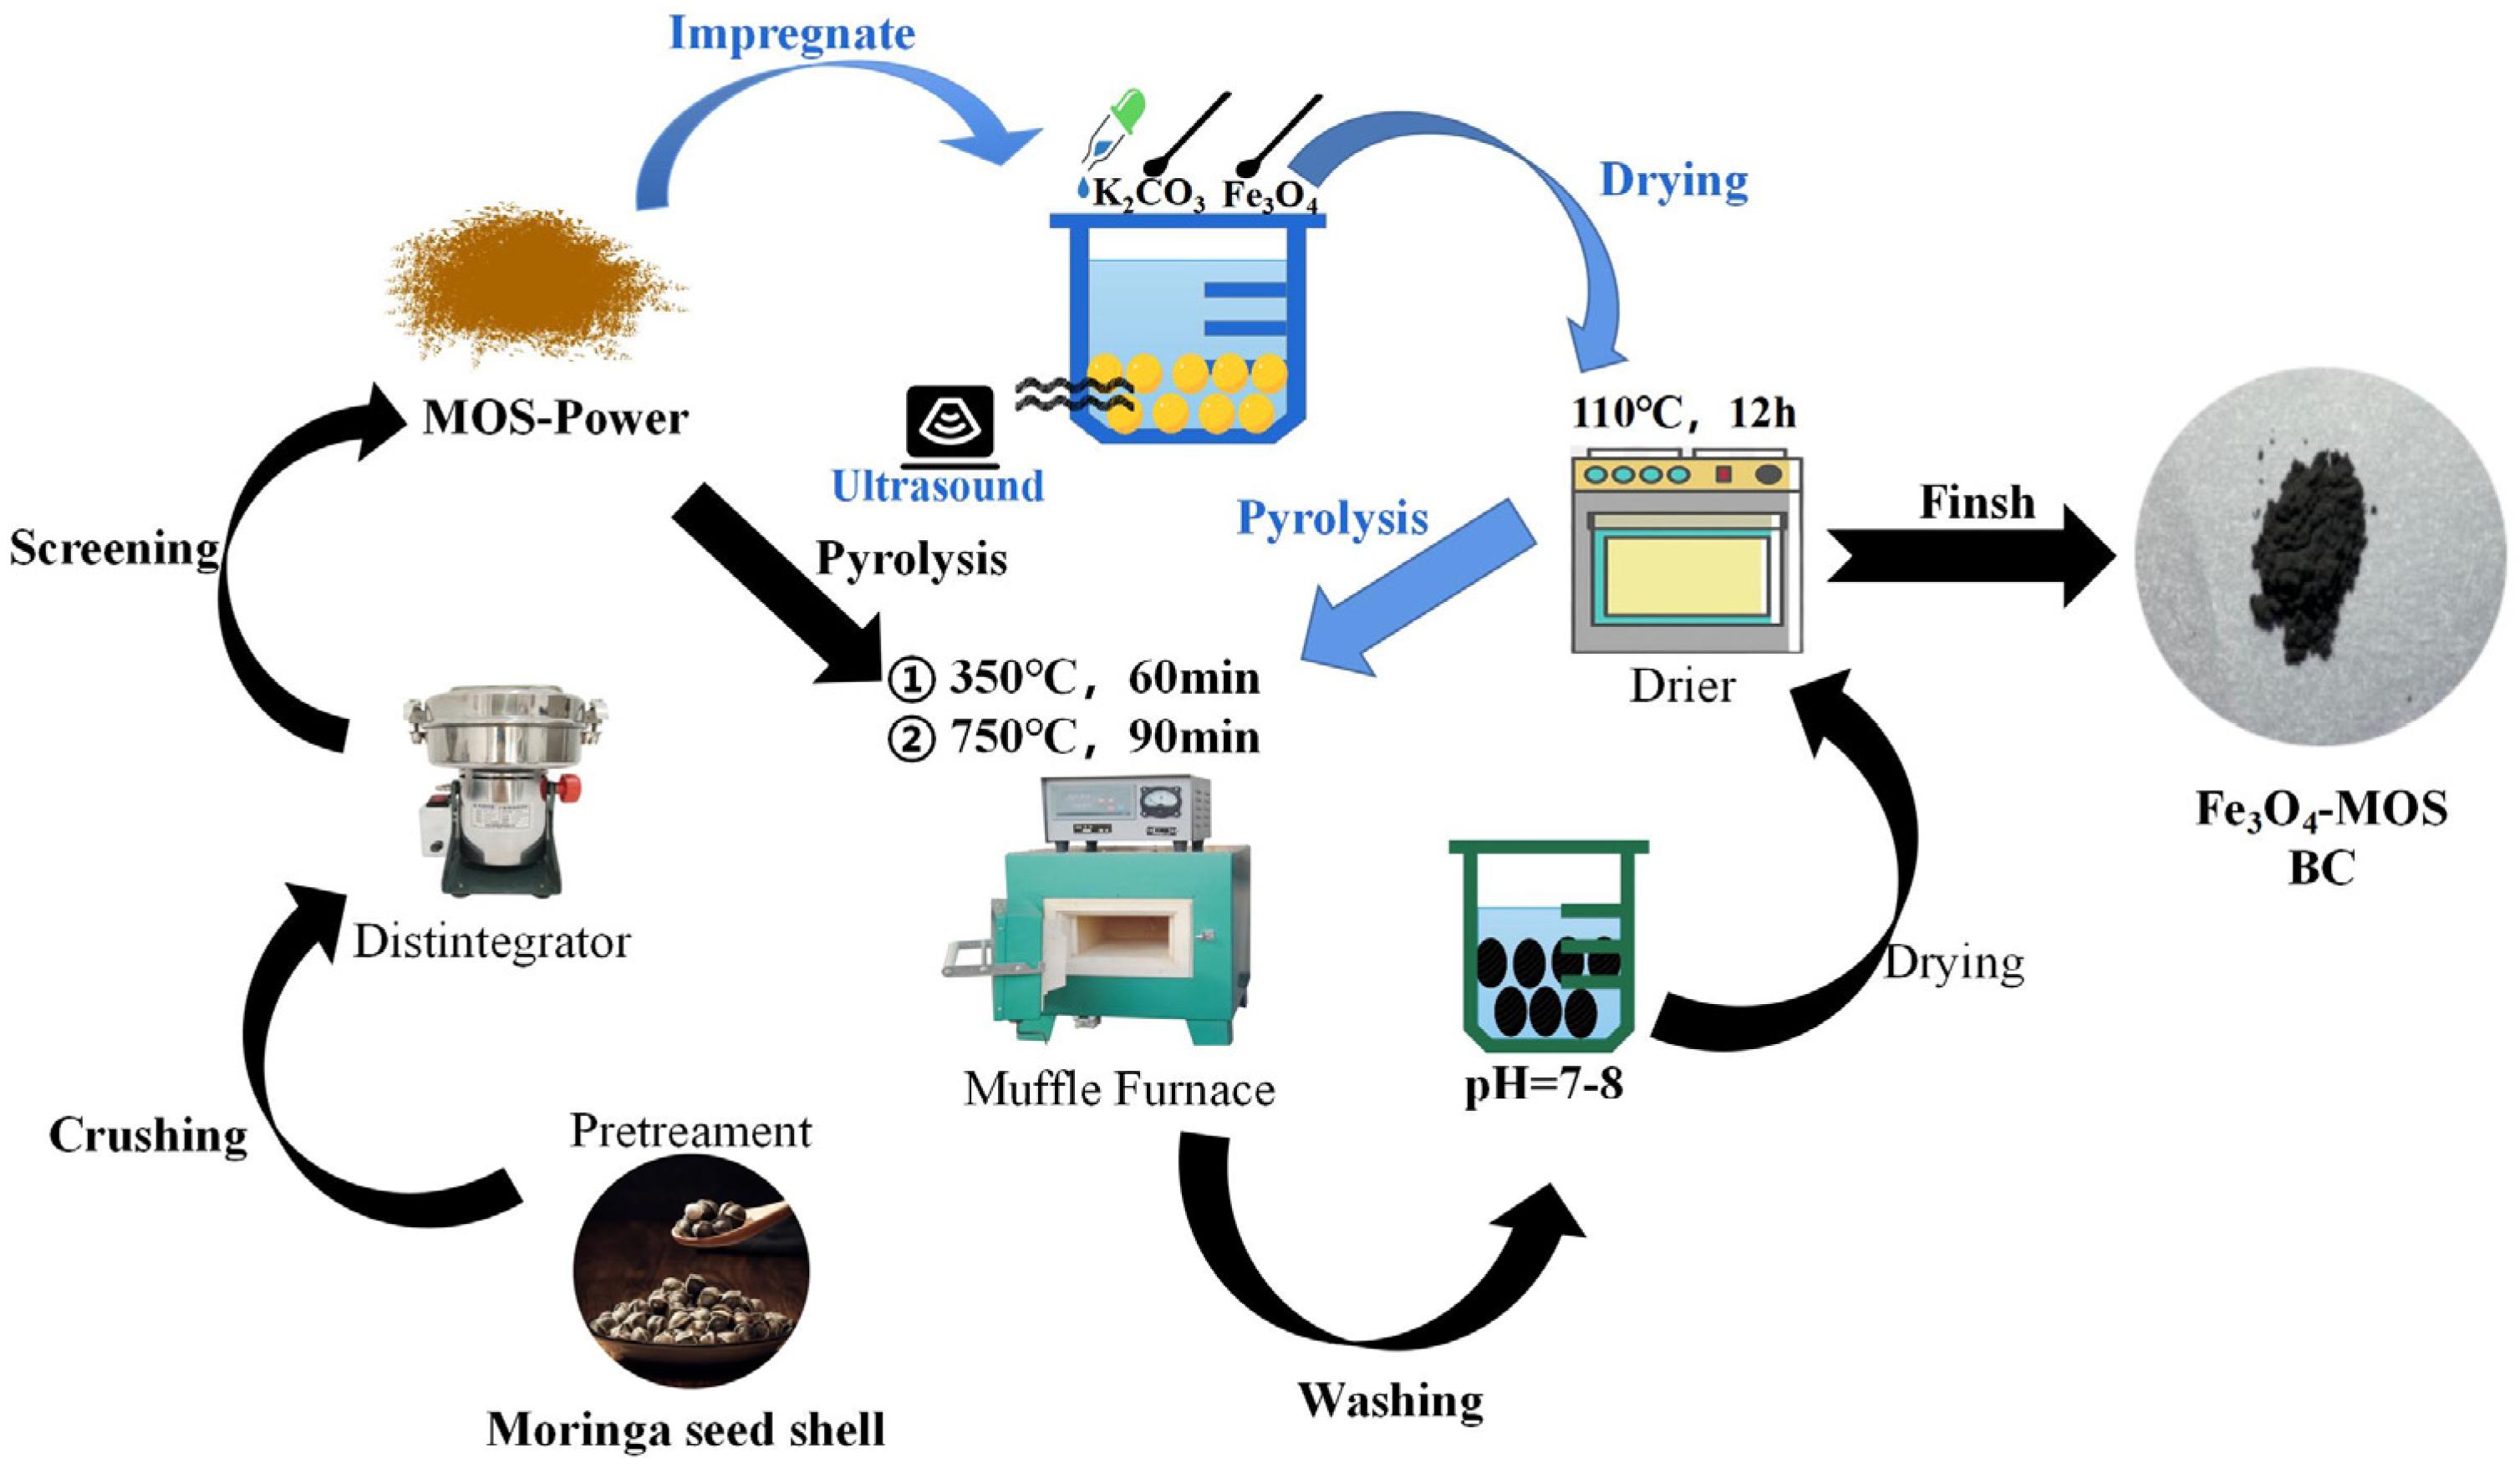
In this study, the authors proposed the preparation of iron-oxide (Fe3O4)-coated biochar (Fe3O4-MOS) from moringa seed shell by ultrasonic-assisted impregnation-pyrolysis treatment; the process is shown in Scheme 1. Fe3O4-MOS was employed for the adsorption of MB in solution to investigate its adsorption performance. Moreover, the adsorption process parameters, including pH, the dose of Fe3O4-MOS, contact time, and temperature were evaluated to determine the optimal adsorption capacities of MB. As well, kinetics, isotherms, and thermodynamic characteristics were explored. Furthermore, the regeneration and circulation of the adsorbent was also evaluated.

2. Materials and Methods

2.1. Materials

Moringa seed was purchased from Yun nan province, China. The moringa seed shell was rinsed several times with deionized water, and dried in an oven at 80 °C. Then the dry moringa seed shell was ground into powder and sieved with 100-mesh. All chemical reagent, including methylene blue (MB, C16H18ClN3S), potassium carbonate (K2CO3) and iron oxide (Fe3O4) were purchased from Tianjin Tianli Chemical Reagent Co., Ltd, Tianjin, China. Co. 0.1 M HCl and 0.1 M NaOH aqueous solution were used to adjust the pH of reaction system.

2.2. Preparation of Adsorbents

Moringa seed shell biochar (BC) was generated through pyrolysis, carbonizing at 300 °C for 1 h and then heating to 750 °C to activate for 90 min. Then the pH of biochar was adjusted to 7–8 using a substantial amount deionized water.
The preparation of magnetic moringa seed shell biochar (Fe3O4-MOS) was divided into two steps. Firstly, 5 g K2CO3 was dissolved at room temperature with an appropriate amount of deionized water, and the processed solution was added with 1 g Fe3O4 powder under ultrasonic treatment to slow down the agglomeration of Fe3O4. Then 10 g moringa seed shell of 100 mesh was added slowly with stirring for mixing thoroughly, and then dried and mashed at 110 °C for 24 h. Secondly, the prepared moringa seed shell powder was placed in a vacuum muffle furnace at a heating rate of 10 °C/min, carbonized at 300 °C for 1 h, then heated to 750 °C to activate 90 min. After cooling, the obtained magnetic activated biochar was rinsed to pH 7–8 by using a large amount of distilled water, and dried at the condition of 80 °C in the oven for 24 h.

2.3. Characterization of Biochar

The surface morphology and energy spectrum analysis of BC and Fe3O4-MOS were obtained by scanning electron microscope and X-ray spectroscope (FEI Quanta FEG250, Hillsboro, OR, USA). VSM (PPMS Quantum Design, San Diego, California, USA) was used to analyze the material magnetism. Surface functional groups information was acquired by FT-IR spectroscopy (FT-IR Nicolet-380, Thermo Fisher Scientific, Waltham, MA, USA). The crystallographic structures of BC and Fe3O4-MOS were studied using XRD (Bruker D8 Advance, New York, NY, USA) at the 2θ scanning range between 2° and 80° (Cu/Kα radiation λ = 1.5406 Å). X-ray photoelectron spectroscopy (XPS) (Thermo Fisher Nexsa G2, Waltham, MA, USA) detected the surface elements for Fe3O4-MOS. Whereas, the BET surface area, micropore, and pore volumes were evaluated using surface area analyzer (ASAP 2020 PLUS HD88, Atlanta, GA, USA), combining N2 sorption-desorption techniques.
The point of zero charge of materials could be obtained from the mass titration method described by Schwarz et al. A series of initial pH of water samples were adjusted to 2–9 by adding 0.1 M HCl and NaOH to 15 mL NaCl solution.

2.4. Adsorption

To evaluate the adsorption performance of the prepared adsorbents for MB dyes, the effects of initial MB concentration, pH, the dose of adsorbent, contact time and the temperature were inspected. All adsorption tests were carried out in three parallel experiments. Adsorbents were dispersed to MB solution with shaking in an oscillator at 160 rpm and maintained at a constant temperature. When adsorption reached equilibrium, MB-load materials were separated from the solution by external magnetic force, and the concentration of residual MB in solution was determined by UV-Vis spectrophotometer at a wavelength of 664 nm. The relationship between MB concentration (x) and absorbance (y) can be represented as the following: y = 0.2009x + 0.0646 (R2 = 0.994). The removal rate is calculated by Equation (1):
Removal   rate   = C 0 C e C 0 × 100 %
where C0 and Ce (mg/L) were the MB concentration in solution at the beginning and equilibrium.

2.5. Desorption and Regeneration

The regeneration test of magnetic biochar was carried out as follows: The saturated magnetic sample was dried in a constant temperature oven at 105 °C for 12 h and heated in a muffle furnace at 350 °C for 3 h, and stored for the subsequent cycles at the optimization of experimental conditions.

3. Results and Discussion

3.1. Characterization of BC and Fe3O4-MOS

3.1.1. Surface Morphology and Energy Spectrum Analysis

The micro-structure of Fe3O4-MOS and BC were determined by scanning electron spectroscopy as shown in Figure 1. The surface image of the prepared adsorbents were observed at various magnifications: 1 μm, 5 μm and 50 μm. The difference in the surface pore structure of BC and Fe3O4-MOS is not obvious. From Figure 1a–c it can be found that the number of BC pores is relatively small, and the distribution is relatively disordered. There are very few melted debris particles. Compared with BC, Fe3O4-MOS has a large number of fine pore structures, the pores are honeycomb, the arrangement is relatively neat, the appearance had changed significantly, and the crystals of varied agglomeration degrees covered the Fe3O4-MOS surface and filled in the formed pores (Figure 1d–f). This also explains why Fe3O4-MOS had rich pore structure, but its effective surface area and pore volume were small, as calculated from N2 adsorption-desorption data. In order to further determine the accompanying crystal composition, the EDS element analyzer was used to analyze it. As shown in Figure 1g, the crystal on the surface of Fe3O4-MOS contained 48.71% carbon, 9.24% of iron, 11.71% oxygen, and other substances. In addition, the magnetic hysteresis curve of Fe3O4-MOS was shown in Figure 1f, and the saturation magnetization of Fe3O4-MOS was 5.73 emu/g. Additionally, the sample strongly attracted to an external magnet, and showed the effective impregnation-pyrolysis extrusion of Fe3O4 to the Fe3O4-MOS.

3.1.2. Crystallization Properties

The crystal structure of BC and Fe3O4-MOS was determined by XRD and shown in Figure 2. It was found that the crystal diffraction peaks in the iron oxide (Fe + 2Fe2 + 3O4) sample matched well with those of cubic crystalline magnetite (JCPDS No. 19-0629). Characteristic peaks appeared at 2θ = 30.10°, 35.44°, 43.10°, 53.43°, 56.96° and 62.54° in iron oxide (Fe + 2Fe2 + 3O4) distributed to the (220), (311), (400), (422), (333) and (440) plane of iron oxide, which suggests that iron oxide was successfully loaded on the surface of Fe3O4-MOS. The peak of iron oxide was stronger at a low angle degree suggesting that there were a number of micropores that coincided with the N2 adsorption-desorption characterization results.

3.1.3. Surface Elements of Fe3O4-MOS Analysis

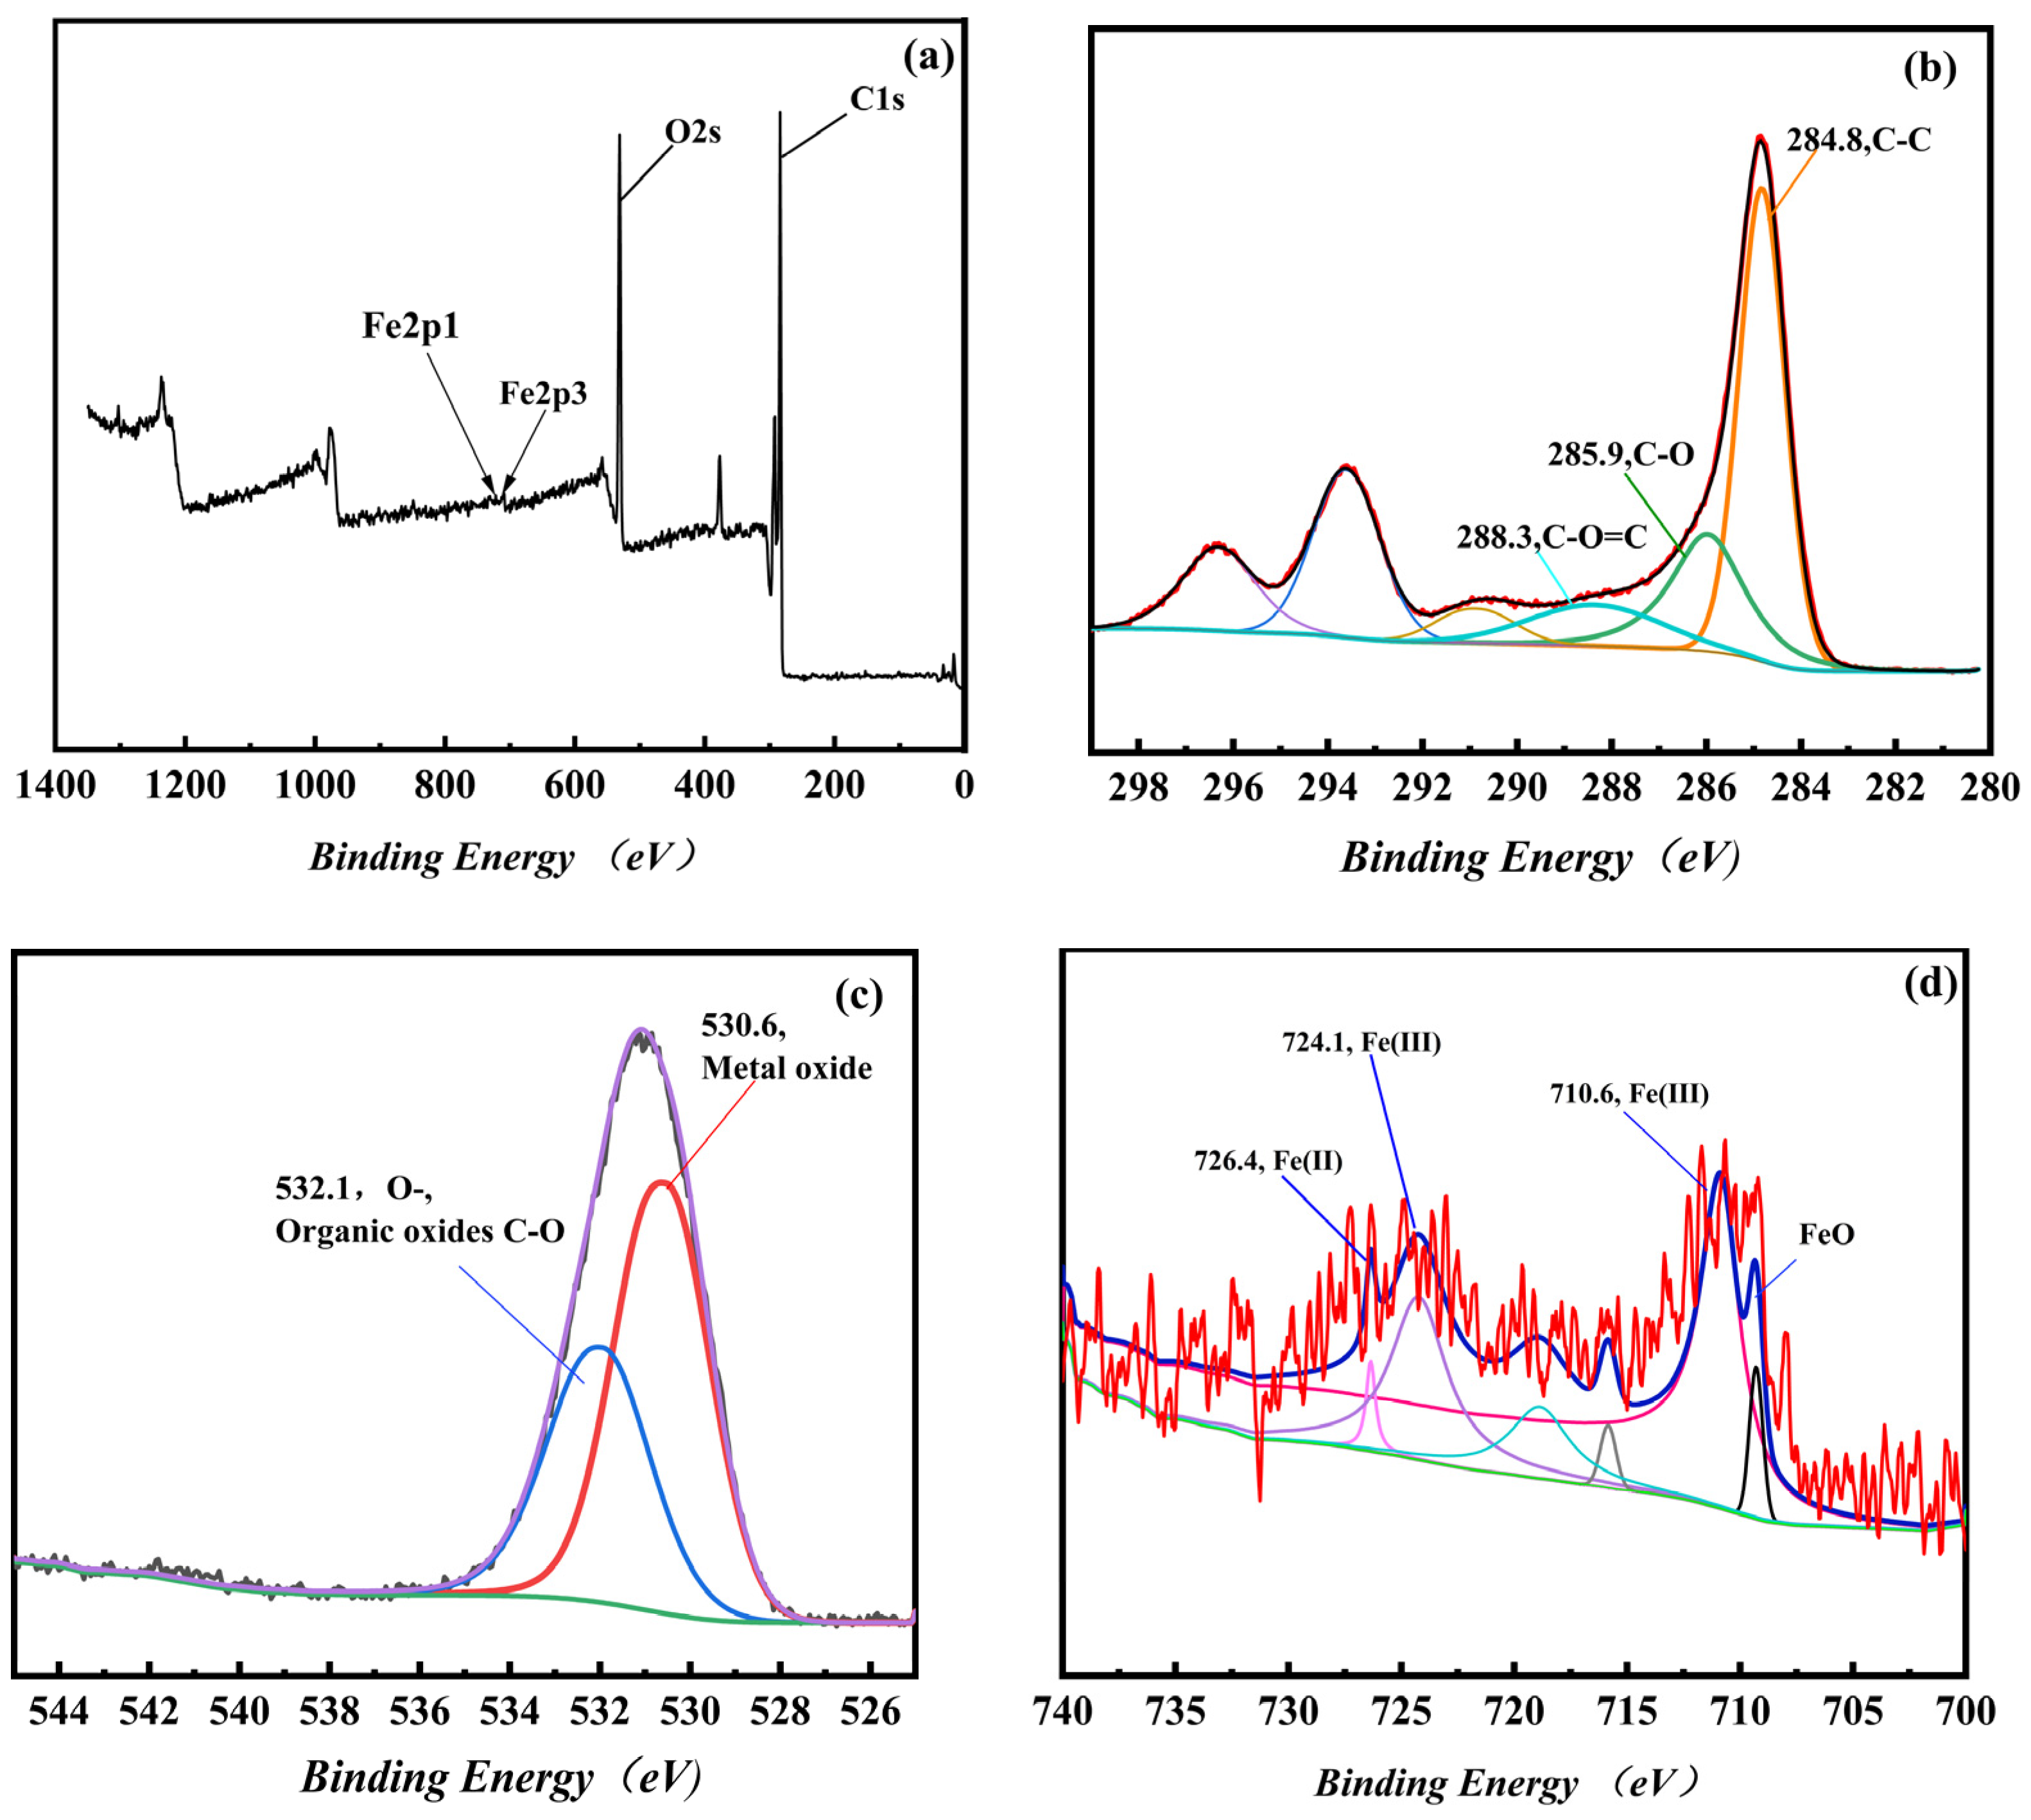
Figure 3 shows the XPS wide-scan spectrum of the Fe3O4-MOS. According to the whole-survey spectra of Fe3O4-MOS, surface elements of this adsorbent included carbon C1s (63.2 at.%), oxygen O1s (26.4 at.%), and iron Fe2p (1.57 at.%). As shown in Figure 3d, the binding energies of Fe2p were divied into five peaks. The peaks at 709.3, 710.6, 724.1 and 726.4 eV distributed to the Fe 2p3/2 and Fe 2p1/2 of Fe(III) and Fe(II), respectively [31], while the peak at 719.0 eV was the satellite peak [32]. The deconvolution of O1s peak showed (Figure 3b) two peaks, one at 530.6 eV and one at 532.1 eV, which arose due to the contribution of Fe-O, suggesting the load of FexOy on biochar [32] and organic oxides bonding C-O [33]. It was found from Figure 3c that the high energy C1s spectrum and the fitting curve of C1s can be decomposed into four peaks, at 284.8 eV, 285.9 eV, 288.3 eV and 290.74 eV, ascribed to carbon atoms in the C-C, C-O, C=O and O-C=O [34]. Furthermore, the absence of carbide eliminated the presence of Fe-C in the adsorbent.

3.1.4. Surface Functional Groups Analysis

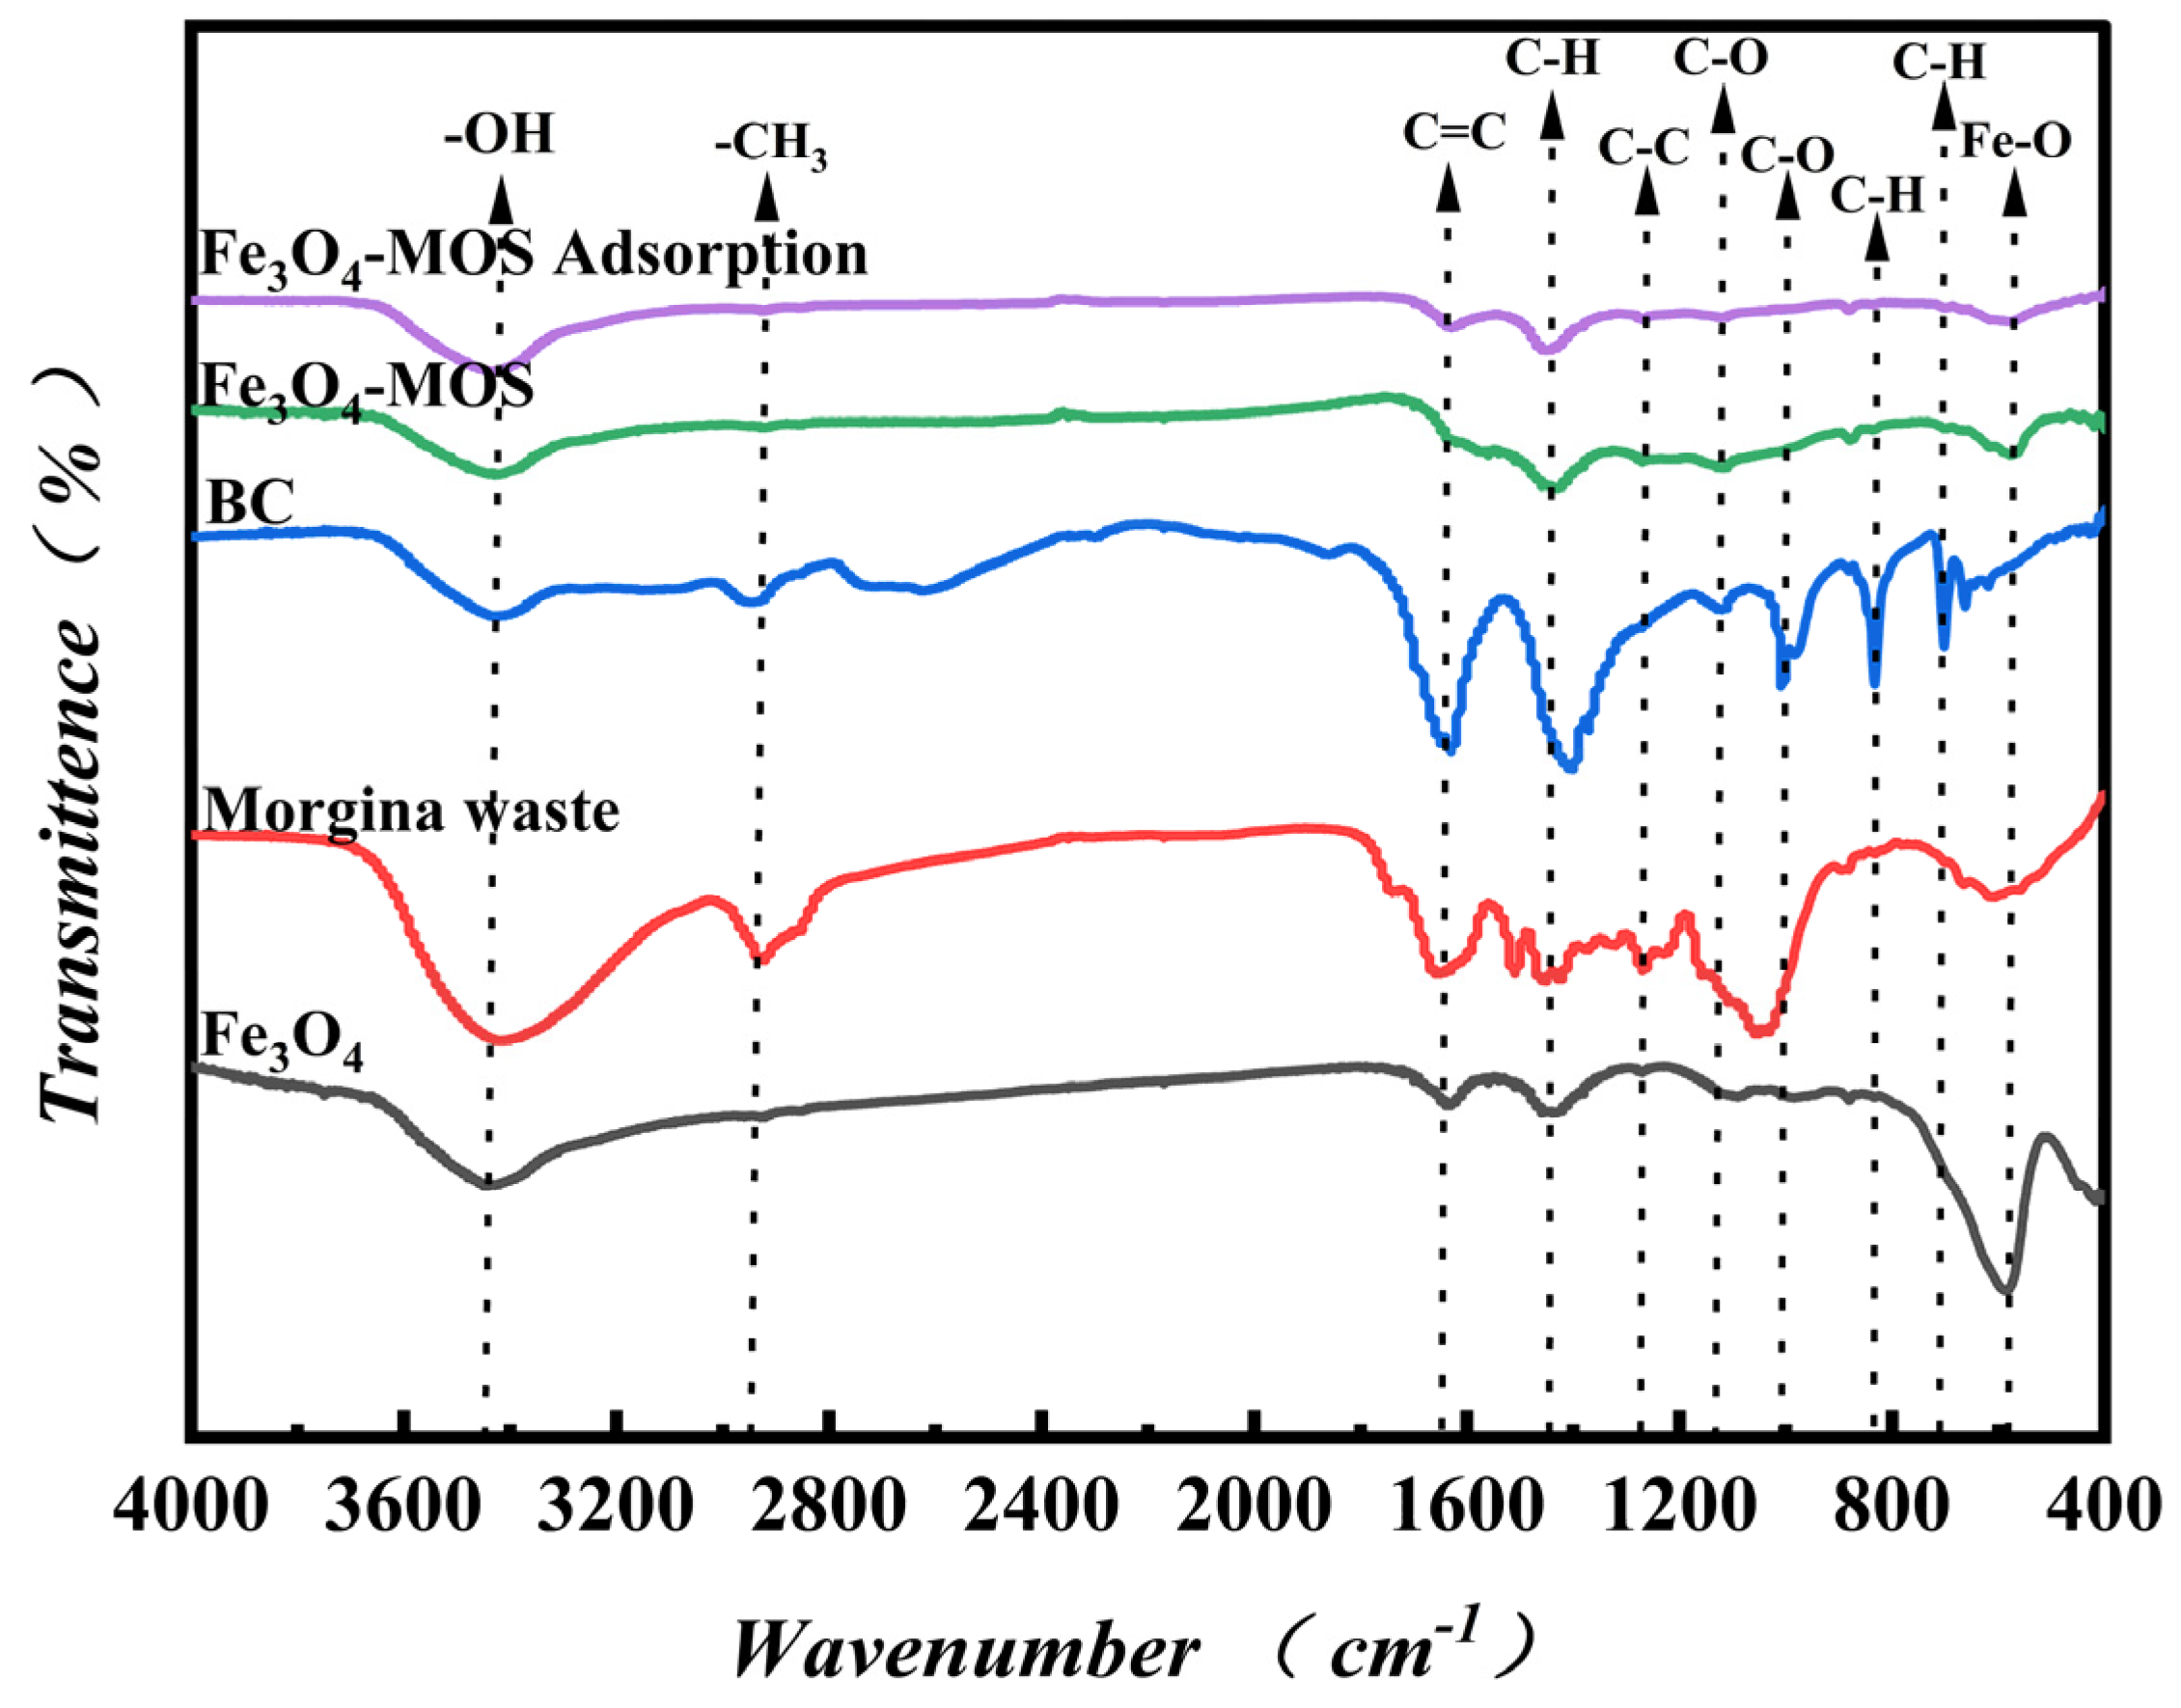
The FT-IR spectra of moringa seed shell, magnetic Fe3O4 nanoparticles, BC and Fe3O4-MOS are displayed in Figure 4. As seen from Figure 4, all samples had a broad band at 3420–3430 cm−1 owing to stretching vibration of the -OH group. In addition to magnetic Fe3O4 nanoparticles, other samples had sharp bands at 1400–1430 cm−1 which can be ascribed to aromatic C-H in-plane bend stretching vibration [35]. Magnetic Fe3O4 nanoparticles have a narrow peak at 586 cm−1 assigned to the asymmetric vibration of the Fe-O bonds. At the wavenumber of 1634 and 1458 cm−1, there are two hydroxyl groups peaks that appeared due to the water introduced during tableting process [36]. For the moringa seed shell, there was a characteristic of aliphatic C-H stretching peak apparent at 2923 cm−1 [37], and the peak at 1510 cm−1 was caused by the C=C aromatic ring stretching vibration. The wide bands at 1055 and 1651 cm−1 can be ascribed to C-O stretching vibration and aromatic C=O stretching, respectively [38], and a narrow aryl-O stretching peak at 1269 cm−1 [39]. Only through pyrolysis processing did the functional groups on the surface of the BC have great changes compared with moringa waste. For example, the strength of the C=C (1630 cm−1) and C-H (1402 cm−1) stretching vibration peak become stronger, the position of the C-O as well as Si-O peaks shift from 1055 cm−1 to 1007 cm−1 and many peaks in the area of 1250–1500 cm−1 disappeared.
After impregnation-pyrolysis, the functional groups of Fe3O4-MOS had obvious changes. The peaks at 663, 702, 1007 and 2945 cm−1 disappeared compared with BC. On the surface of Fe3O4-MOS, new peaks appeared. Similar to magnetic Fe3O4 nanoparticles, the wide band at 577.68 cm−1 was attributed to an asymmetric vibration of the Fe-O bonds [40] and the existence of Si-O-Fe bond could be explained by the presence of tiny peaks at 467.33 cm−1 , and the existence of Si-O-Fe bond could be explained by the presence of tiny peaks at 467.33 cm−1 [41], which confirmed the successful preparation of Fe3O4-MOS. The vibration peak at 577.86 cm−1 (Fe-O) of Fe3O4-MOS had a lower-than-before adsorption, which can be supposed that the dye was removed by combination of chemical bonds.

3.1.5. Pore structure Characteristics Analysis

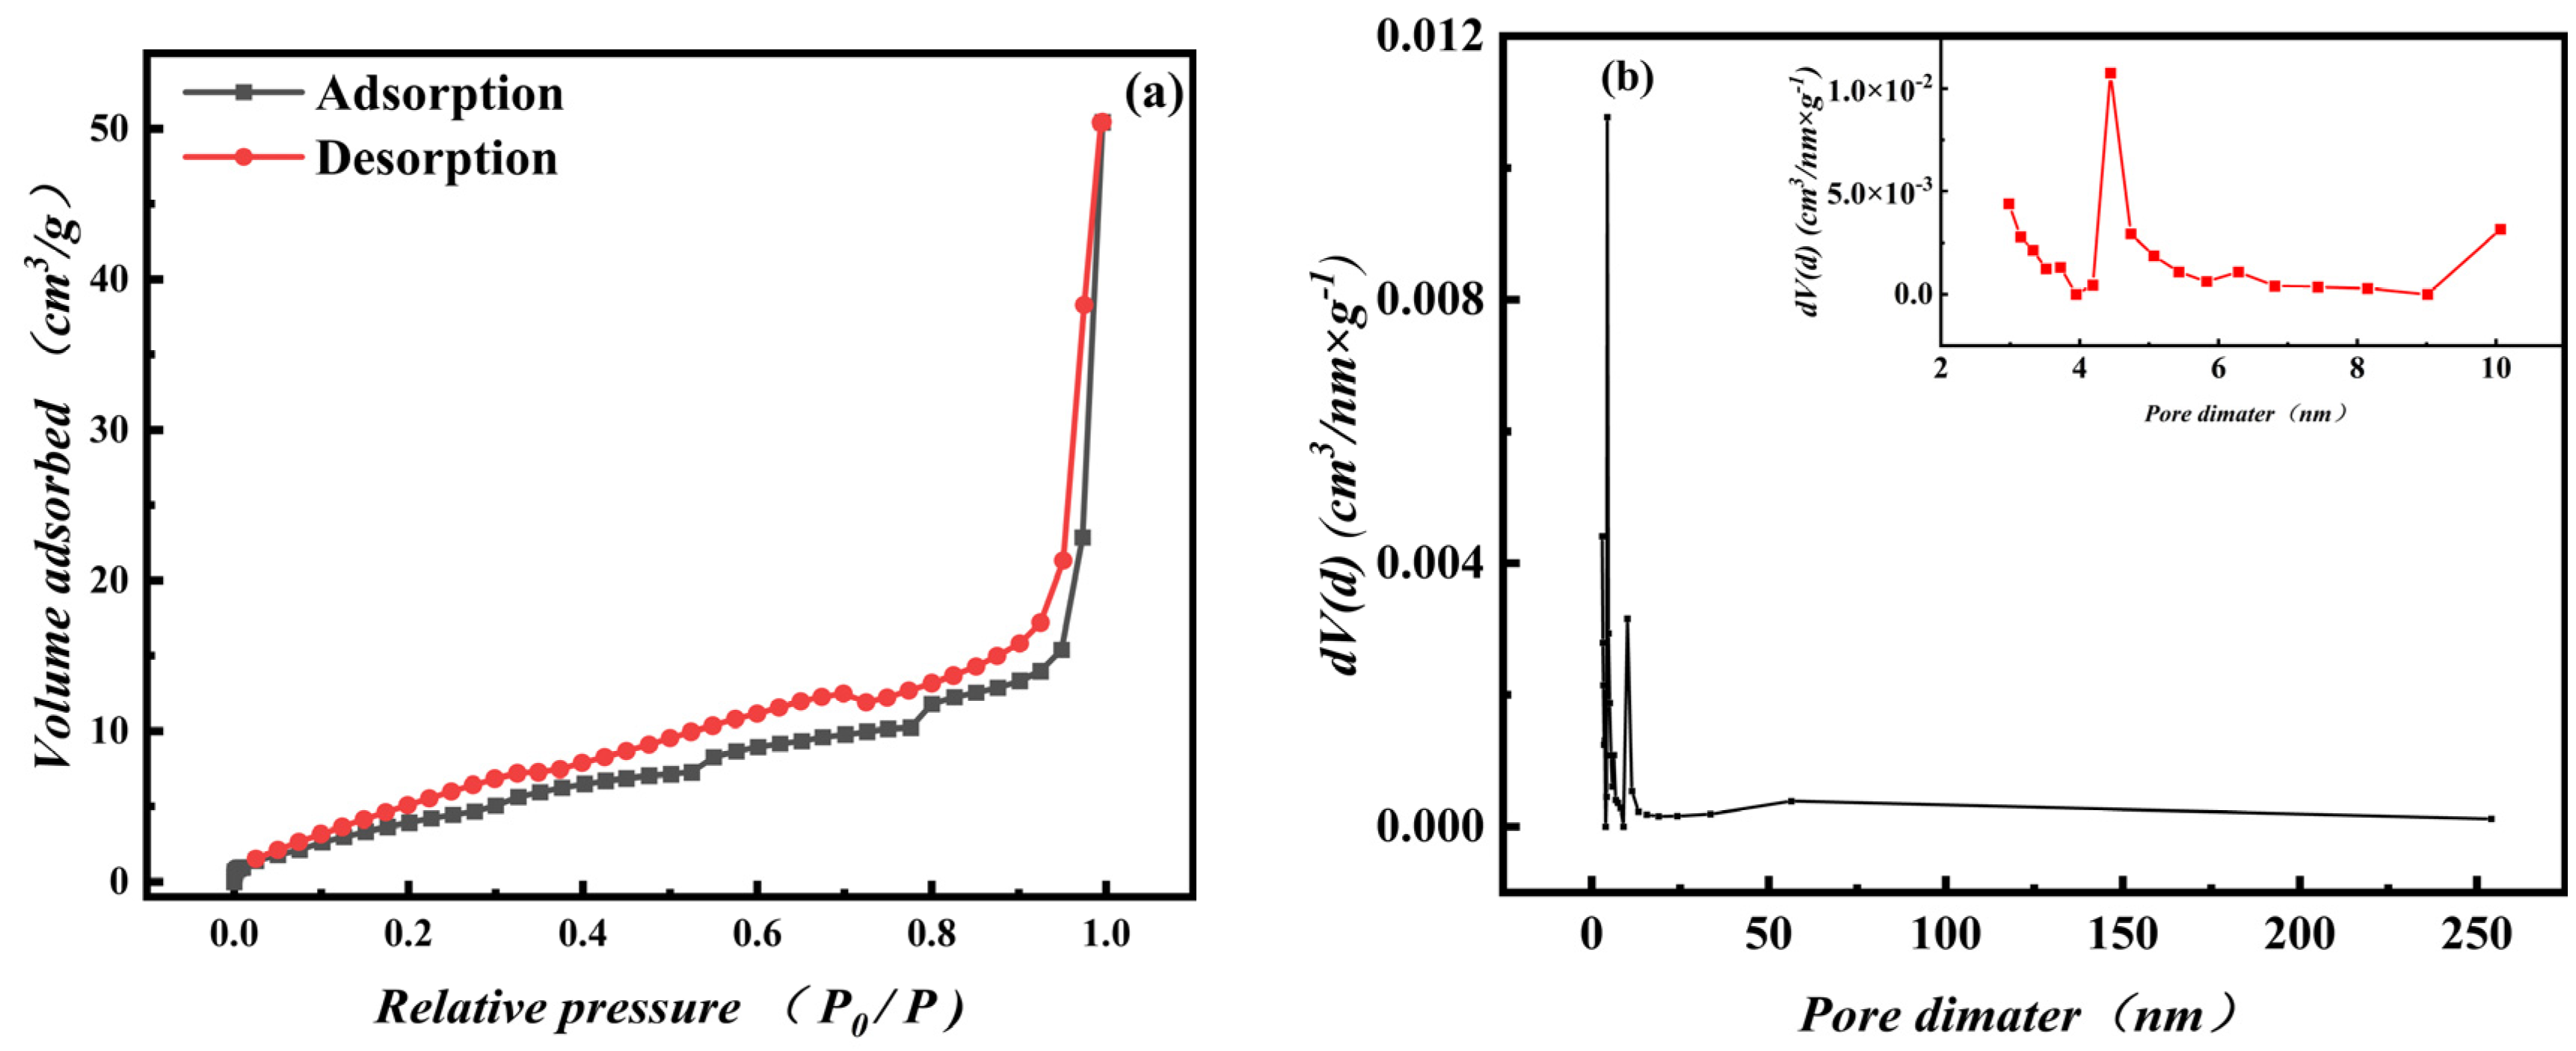
The International Union of Theoretical and Applied Chemistry (IUPAC) have divided the adsorption pores into three types, including macropores (D > 50 nm), mesopores (D = 2–50 nm) and micropores (D < 2 nm), on the basis of the difference of molecular adsorption in pores of different sizes [42]. As seen from Figure 5a, the N2 adsorption curve shows a sharp rise under low relative pressure (P/P0 < 0.01) illustrating that there were many micropores. Meanwhile, hysteresis loop of Fe3O4-MOS appeared 0.2–0.8 (P/P0). Furthermore, a surge of N2 isotherm suggested that macropores of Fe3O4-MOS formed. Compared with IUPAC classification, the N2 adsorption isotherms of Fe3O4-MOS is type IV [42]. The size distributions of Fe3O4-MOS were further calculated using the DFT method and the results were shown in Figure 5b. The largest pores of the pore network of the Fe3O4-MOS had diameters ranging from 3.20 to 8.40 nm and 11.10 to 50.23 nm, which shows that there were minor pore falls within the mesopores region. Moreover, the specific surface area of Fe3O4-MOS was calculated to be 17.90 m2/g based on N2 adsorption isotherm data examined using the BET method. The pore volume and pore diameter of Fe3O4-MOS were 0.075 cm3/g and 4.443 nm respectively, which were calculated by BJH method. According to our previous work, the surface area of BC at 1000 °C was 32.33 m2/g, and the pore volume was 0.0245 cm3/g [43]. This might be due to iron ions and the particles which melted from the pore walls on the surface filling in the pores and, being tightly combined, they did not wash away during the washing process.
On this basis, combined with the pore size distribution calculated by DFT, it could be inferred that Fe3O4-MOS was a mesoporous material.

3.2. Adsorption Property Analysis

3.2.1. Effect Analysis of Adsorption System pH

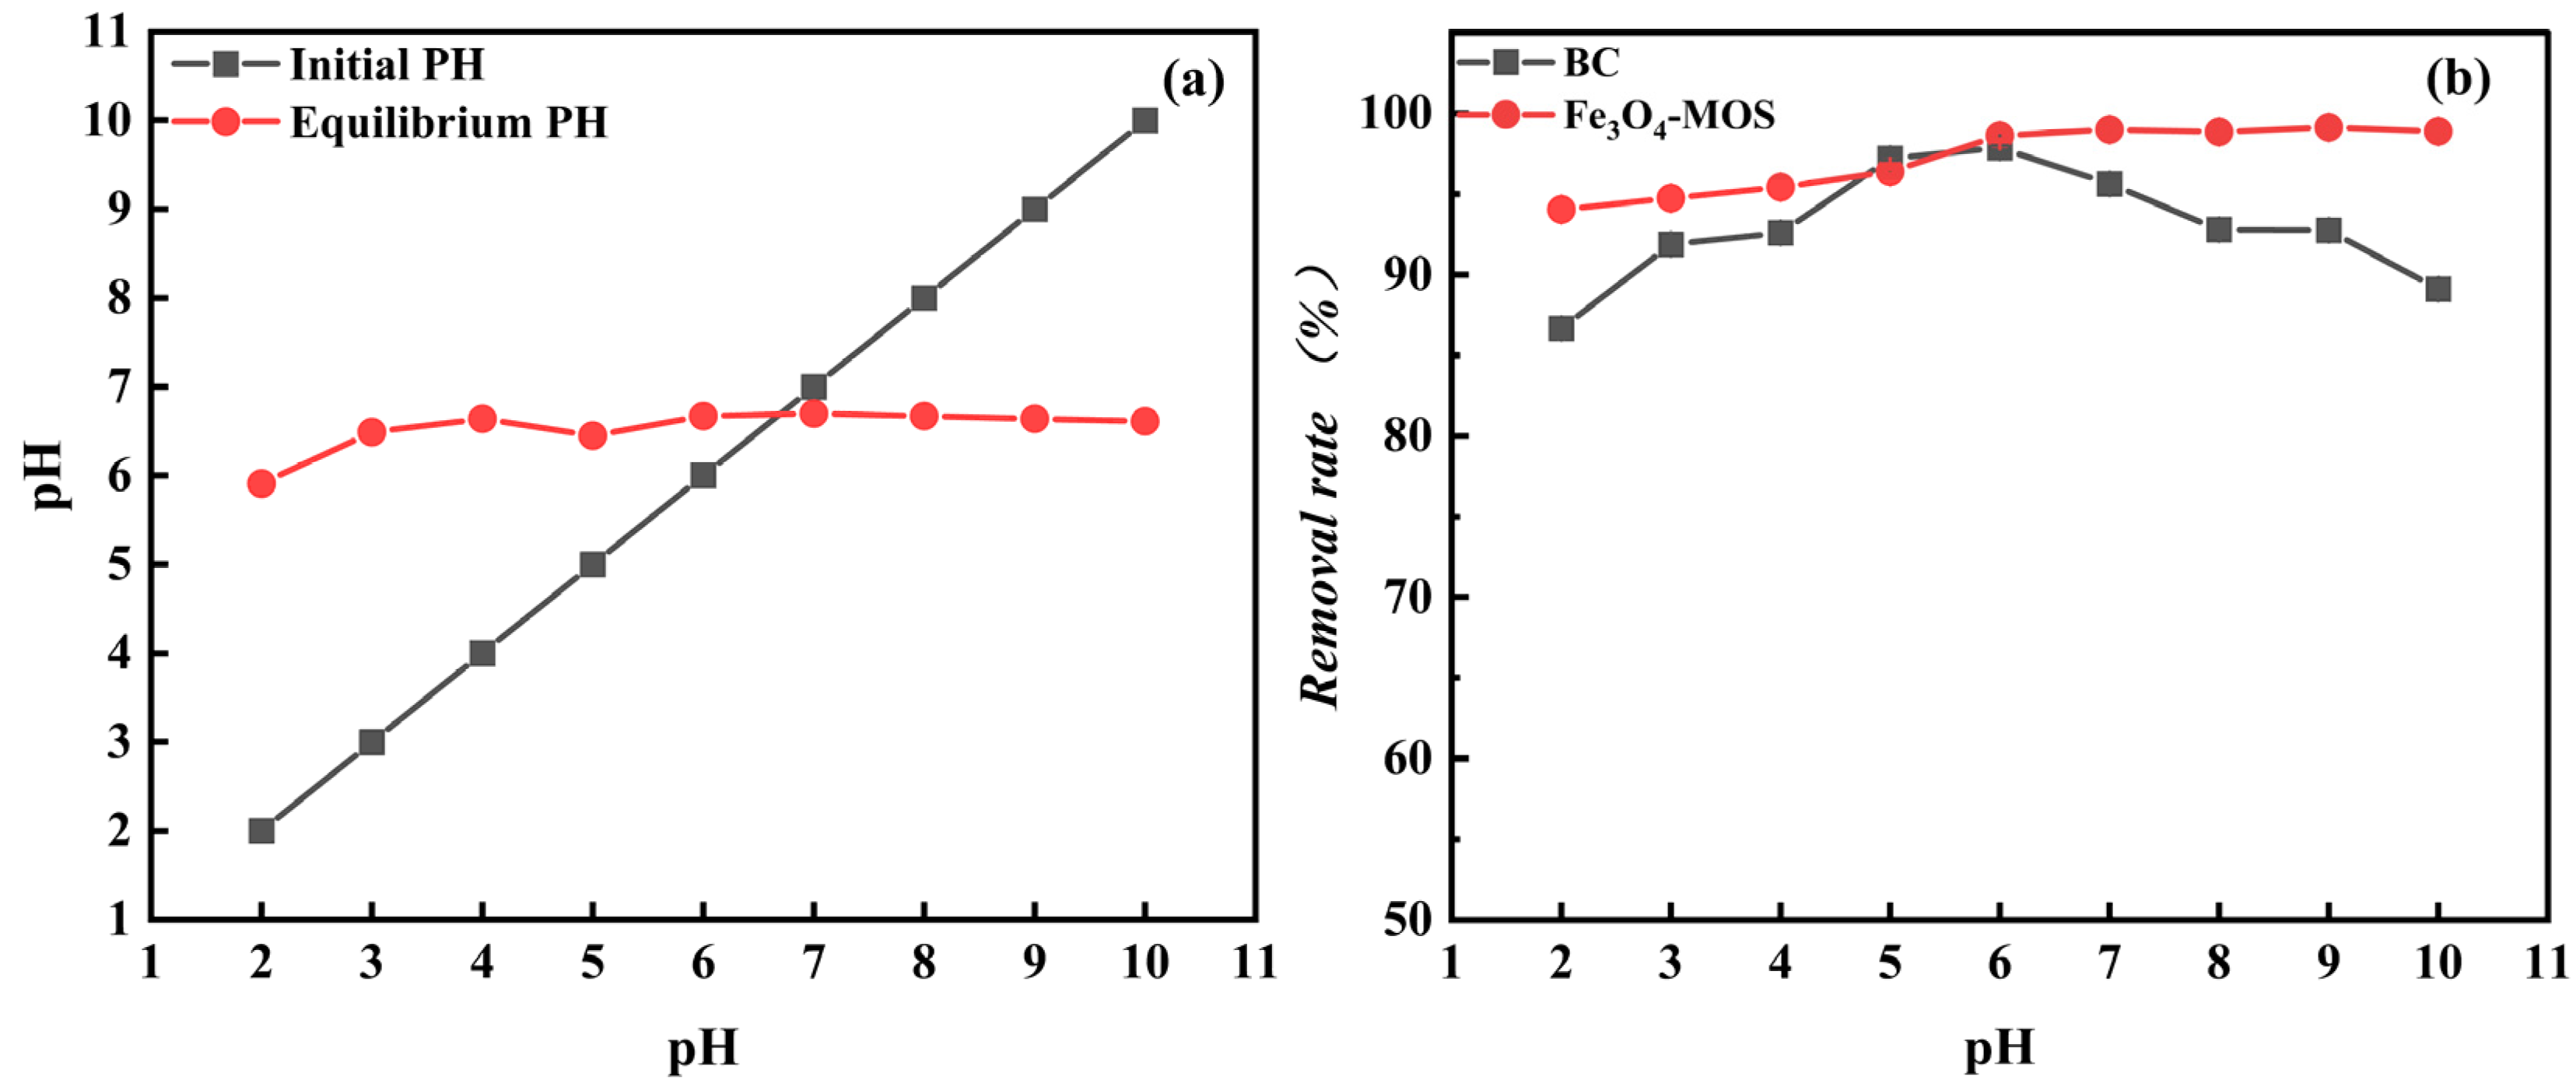
In the adsorption experiment of MB, which used as-prepared materials as adsorbent, it could be found from the Figure 6b that whether the Fe3O4-MOS or BC, the removal rate of MB increased with increases in the pH of solution from 2 to 6 (Fe3O4-MOS was 94% to 99%, BC was 87% to 98%). It was possible that protonation of the acidic functional groups, electrostatic repulsion between adsorbents containing H+ and cationic MB, and competition for adsorption sites between H+ and MB all contributed to the reduced adsorption capacity under acidic circumstances. With the increase of the pH, the functional groups of samples and the adsorption solution deprotonated, and negatively charged active sites were formed on the surface, which bound more MB anions through electrostatic interaction. The charged MB molecules exhibited the least electrostatic repulsion with the Fe3O4-MOS and the strongest π-π dispersion force when the pH of the MB solution was near to the pHpzc (6.7) of Fe3O4-MOS (Figure 6a). For BC, the removal rate of MB decreased from 98% to 90% as the pH of solution exceeded 6. As seen from Figure 4, there were more oxygen-containing functional groups on the BC than Fe3O4-MOS, it was easier to prompt n-π interactions between the oxygen electron pairs of hydroxyl group (n-electron donors) and the electron-depleted sites (π-electron acceptor) of BC, and the strength of n-π interactions increased with increased pH [44]. Therefore, the adsorption efficiency of BC would decrease as OH- competes with MB for access to the active site. However, fewer oxygen-containing functional groups would reduce the impact of OH on Fe3O4-MOS, which explained why the removal rate of MB remained constant while the pH of the solution was raised.

3.2.2. Effect Analysis of Adsorption Material Usage

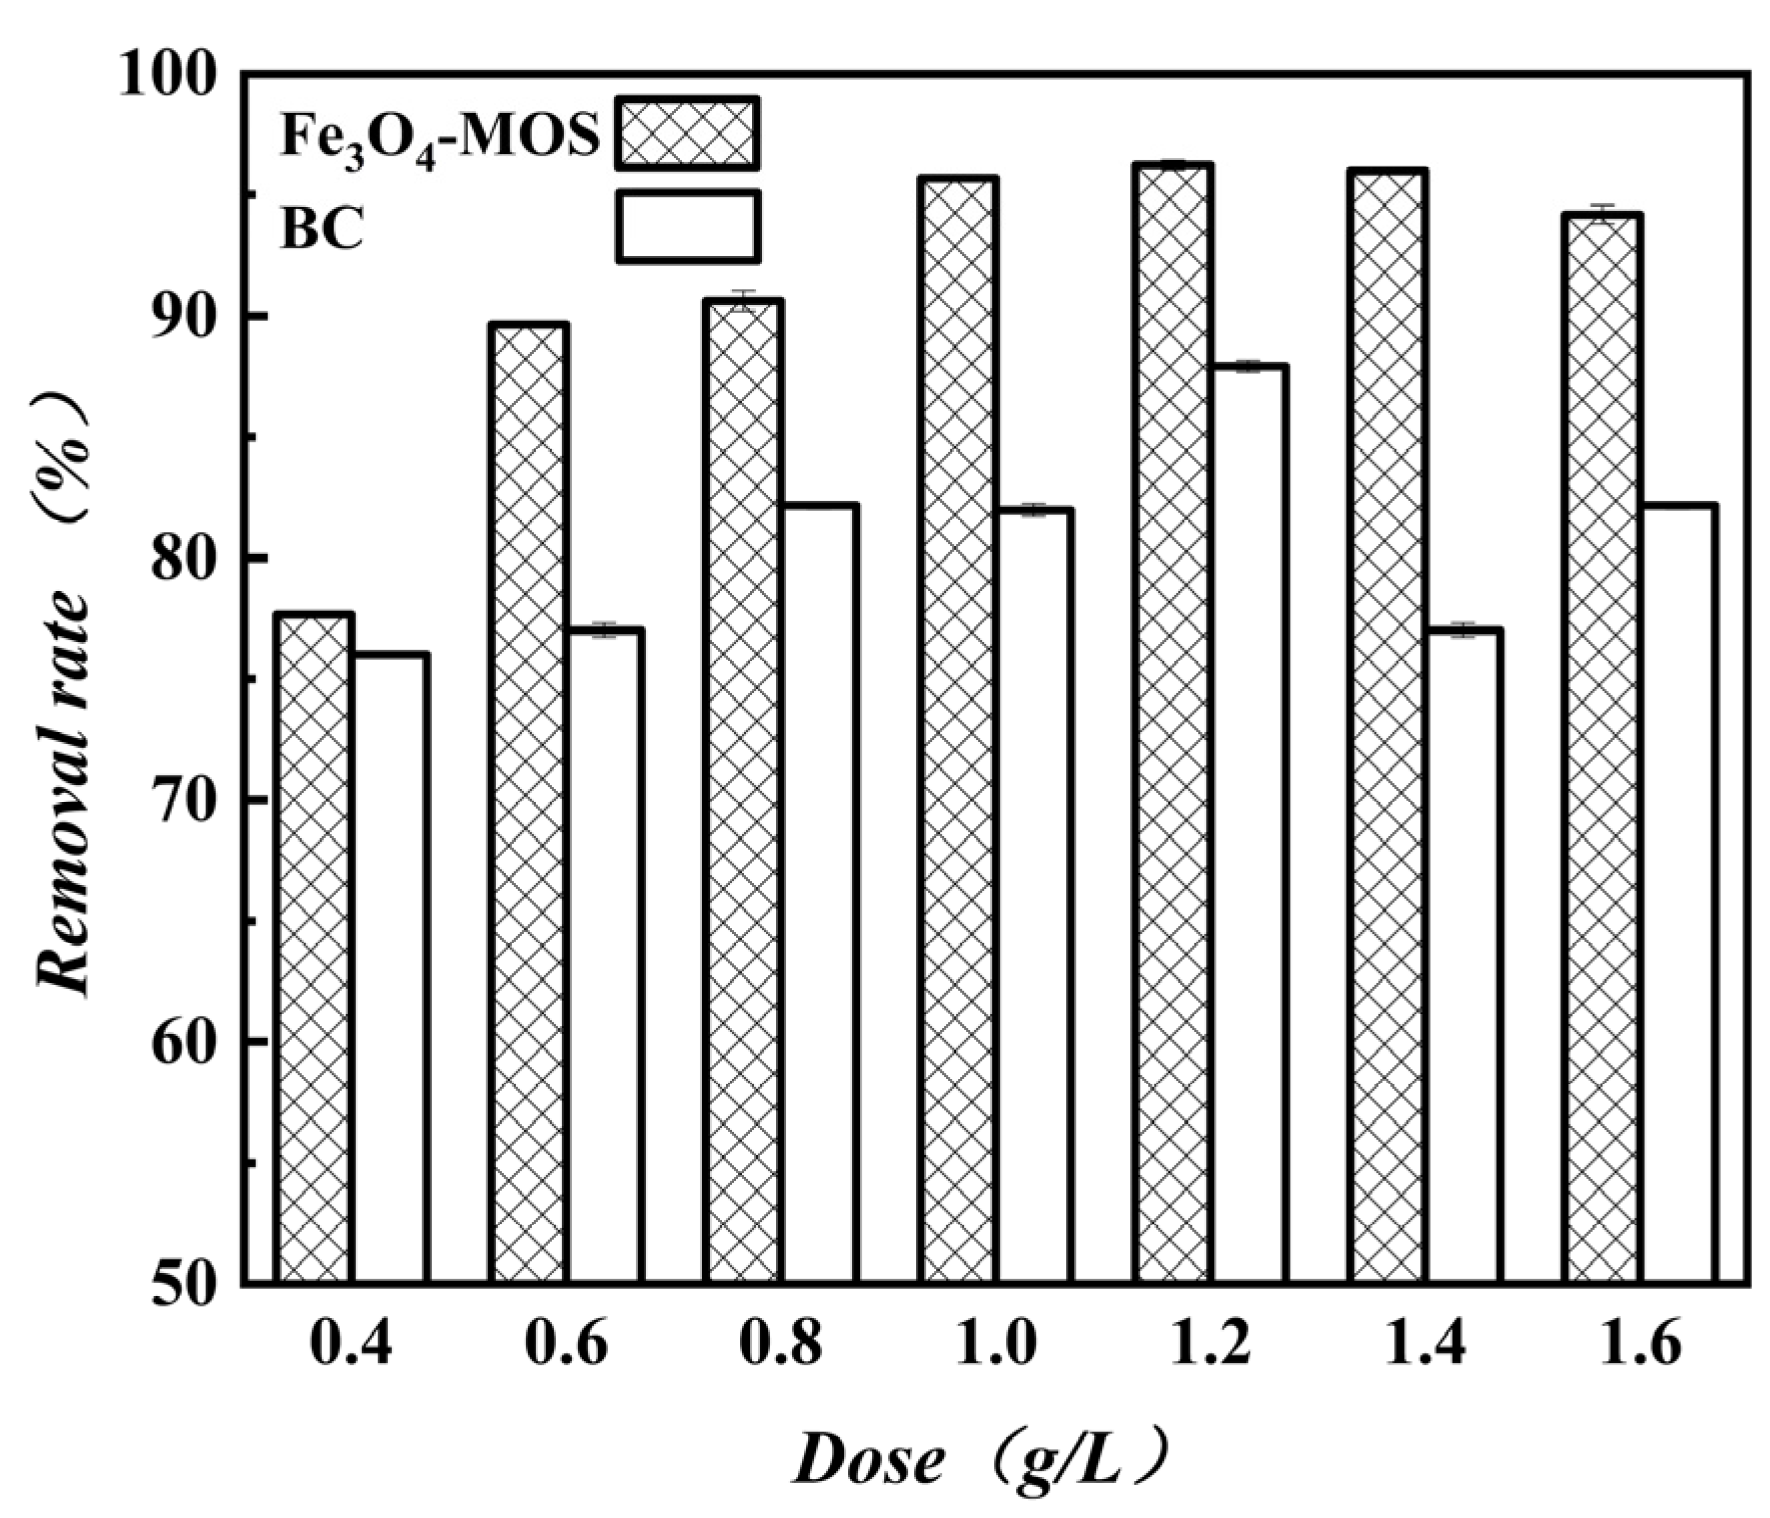
The effectiveness of MB removal at varying dose of Fe3O4-MOS and BC are depicted in Figure 7. As the concentration of the as-prepared materials grew from 0.4 to 1.6 g/L, the removal rates rose and eventually leveled out. This was because there were more accessible active sites for the MB to bind to. The polar region of the MB molecule interacts more strongly with the oxygen-containing functional groups on the surface of the materials as the dosage of materials rises, favoring the adsorption of vertically aligned MB molecules and increasing the quantity of MB adsorption per unit surface area [45].

3.2.3. Adsorption Time and Kinetic Analysis

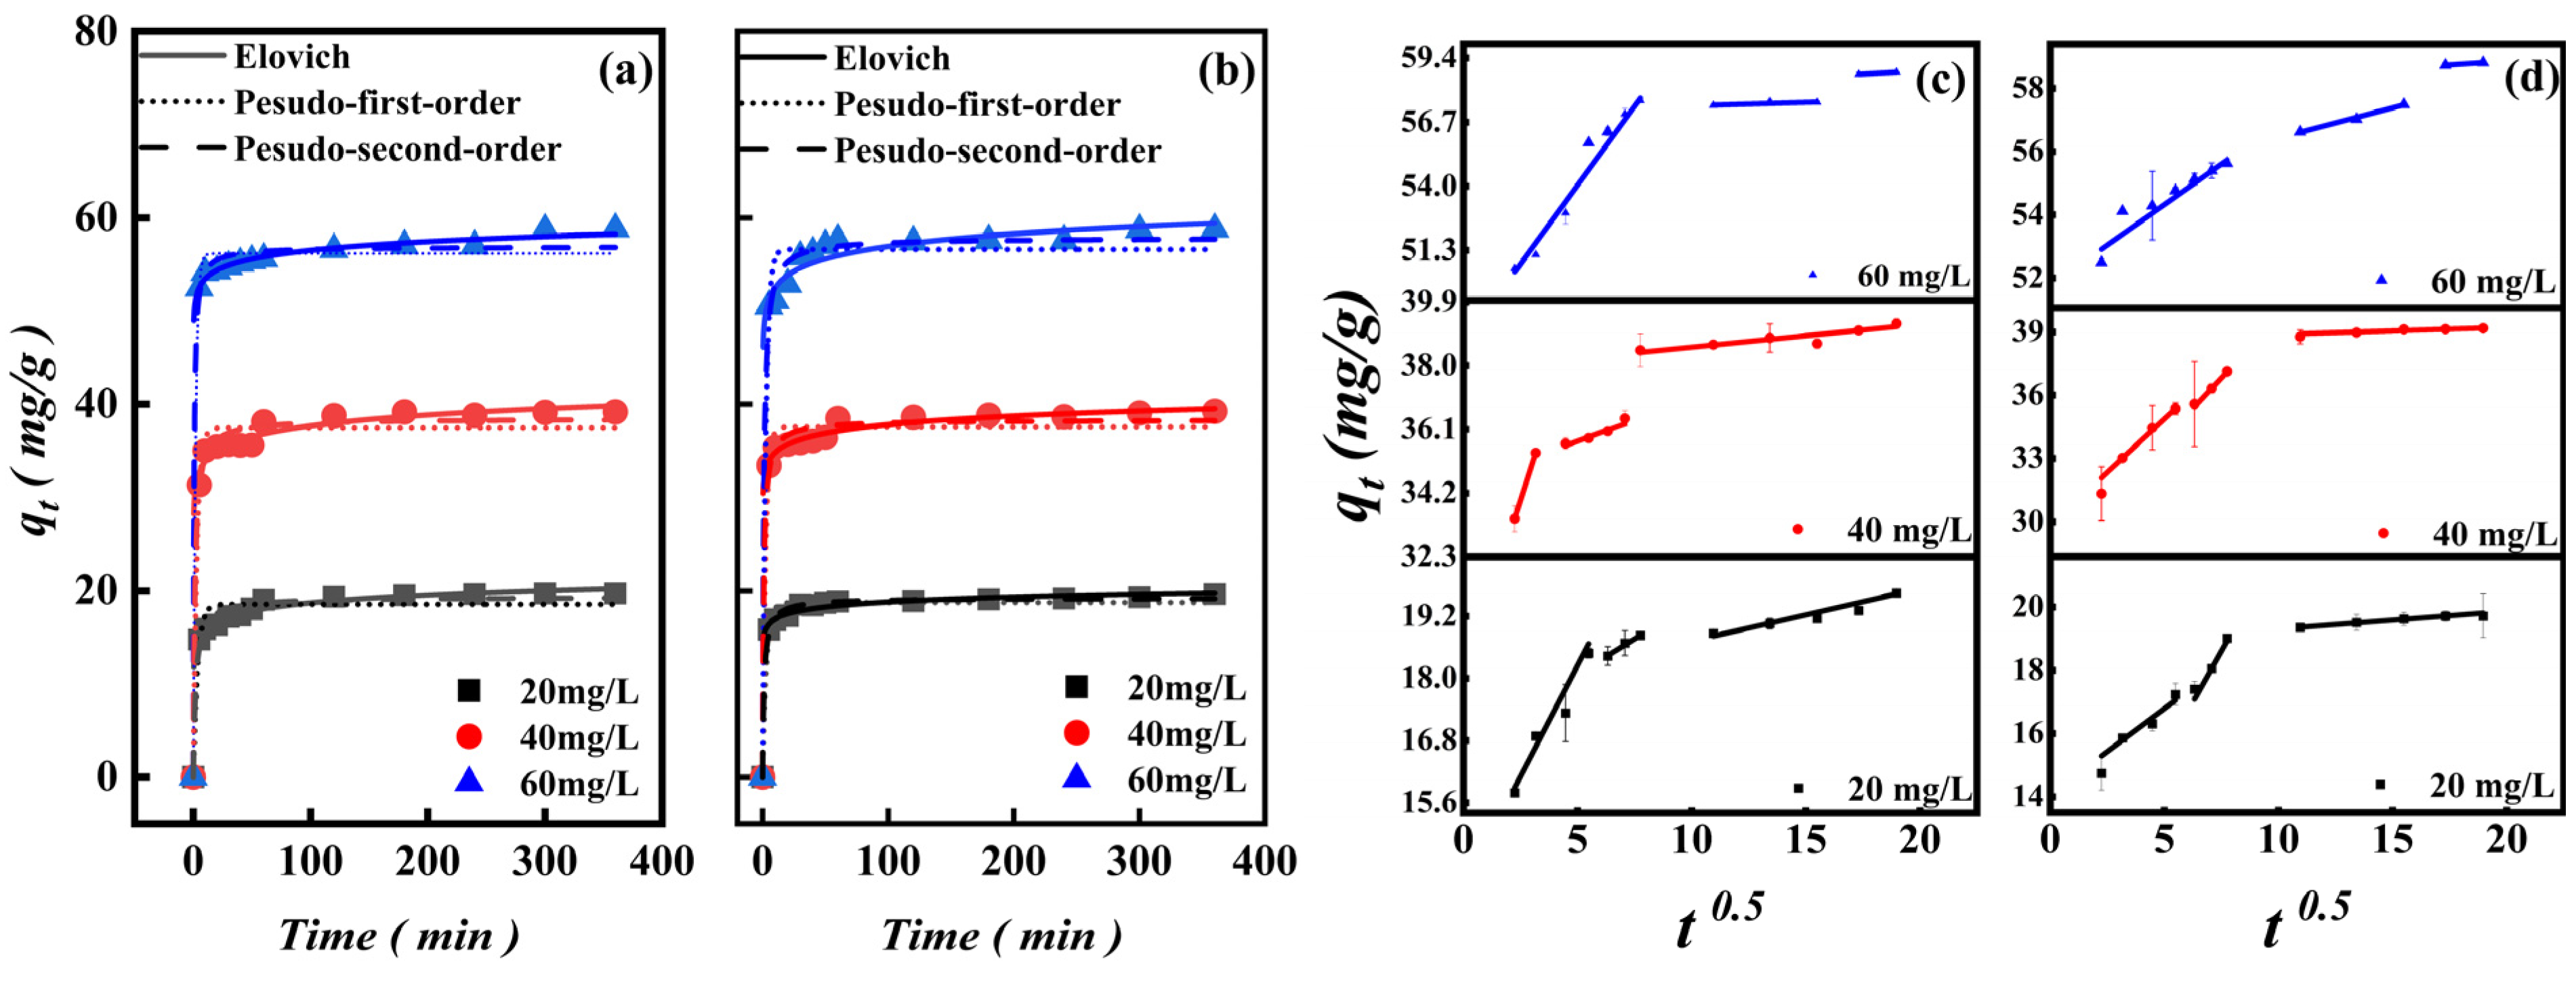
Adsorption tests were conducted with contact times spanning 0 to 360 min and at concentrations from 20 mg/L to 60 mg/L to determine the impact of contact duration on adsorption capacity. The effect of contact time at different concentrations was shown in Figure 8a,b. Fe3O4-MOS and BC both exhibited a similar behavior. Within 60 min, the adsorption capacity of BC could reach 19 mg/g (20mg/L), 38.12 mg/g (40 mg/L) and 55.20 mg/g (60 mg/L), respectively. And as for Fe3O4-MOS, adsorption capacities could be achieved of 18.8 mg/g (20 mg/L), 38.46 mg/g (40 mg/L) and 57.61 mg/g (60 mg/L), respectively. After 60 min, the adsorption capacity increased slowly and the entire adsorption process gradually became flat after 120 min. In the initial stage, a large number of effective adsorption centers existed and were exposed in the adsorbent, so MB molecules had a greater chance to contact and to be adsorbed. As the adsorption proceeded, the driving force of adsorbents to adsorb MB decreased, the effective volume of the adsorbent pores was continuously reduced and the number of adsorption centers was also drastically reduced. The effective adsorption of MB, then, increased slowly and then became saturated. Though Fe3O4-MOS (Figure 8a) and BC (Figure 8b) performed the same adsorption trend, Fe3O4-MOS showed better removal efficiency in the whole process of adsorption.
Adsorption kinetics, which is impacted by the characteristics of the adsorbents and the adsorbate, might be studied in detail by analyzing the reaction time. Pseudo-first-order (PFO), Pseudo-second-order (PSO), the Elovich, and the intra-particle diffusion (IPD) kinetic models were used to investigate the adsorption kinetics of MB on as-prepared materials. The pseudo-first-order model was used to reflect the adsorption controlled by the diffusion step [46] and the pseudo-second-order model describes the chemisorption between the adsorbent and the adsorbate [47]. In addition, the Intra-particle diffusion model is used to predict whether the adsorbed diffuses inside the adsorbent [48]. Based on the above kinetic model, Elovich was used to explain heterogeneous solid surfaces and defined ion exchange in fluid phases [49].
The four model equations are as follows:
ln ( q e q t ) = ln q e k 1 t   ( PFO   model )
t q t = 1 k 2 q e 2 + t q e   ( PSO   model )
q t = ln ( α β ) β + ln ( t ) β   ( Elocivh )
q t = k d t 1 2 + c   ( IPD   model )
where qe (mg/g) and qt (mg/g) were MB adsorption at equilibrium and t (min), k1 (min−1), kd and k2 were the PFO rate constant, the IPD rate constant and PSO rate constants, respectively. In terms of surface coverage and chemisorption activation energy, the desorption coefficient was denoted by β (g/mg)., α (mg/ g·min) was the original adsorption coefficient and c was a dimensionless constant, while t (min) was adsorption time.
The kinetics correlation coefficient R2 shown at Table 1 and Figure 8a,b shows that the adsorption kinetic of Fe3O4-MOS under MB solution at concentrations of 20 mg/L, 40 mg/L and 60 mg/L were suitable for above models, but that the Elovich (0.994–0.999) and PSO model (0.98–0.996) were more suitable to describe. The PSO model and Elovich revealed there might be heterogeneous surfaces of chemically limited adsorption between MB and adsorbents dominated by valence forces during the exchange and sharing of electrons. Furthermore, the IPD model assumed that adsorption involves three steps: external liquid film diffusion, surface adsorption, and particle internal diffusion. Previous research believed that the internal diffusion was the only speed limiting step when t0.5 versus qt linear and the plot passes through the origin. Otherwise, some other mechanism along with intraparticle diffusion were also involved [50]. As shown at Table 1, the coefficient R2 of IPD model increased as the original concentration increased, which revealed that parameters of qt versus t0.5 showed a good linear relationship. At the same time, the ki decreased and the C increased, suggesting that the adsorption site was gradually occupied. Combined with FTIR spectra (Figure 4),the adsorbents had various surface functional groups, such as -OH, Fe-O, which could promote the chemical combination of positively charged MB dye molecules to active sites on the surface of Fe3O4-MOS and BC.
Additionally, the fact that these peaks (C-H, Fe-O, C-O) weaken or disappeared indicated the adsorption might be caused by π-π stacking, hydrogen bonds and van der Waals forces [51]. But as shown at Figure 8c,d, the first-stage fitting curve did not pass through the origin, which implied that the adsorption of MB was controlled not only by the particle internal diffusion, but also by external diffusion processes such as surface adsorption and liquid surface diffusion.
By comparing the constant R2, it could be concluded that the adsorption performance of Fe3O4-MOS was better than that of BC. Above all, the adsorption of MB on Fe3O4-MOS was a heterogeneous surface chemically limited process and not only governed by particle internal diffusion.

3.2.4. Adsorption Temperature and Thermodynamic Analysis

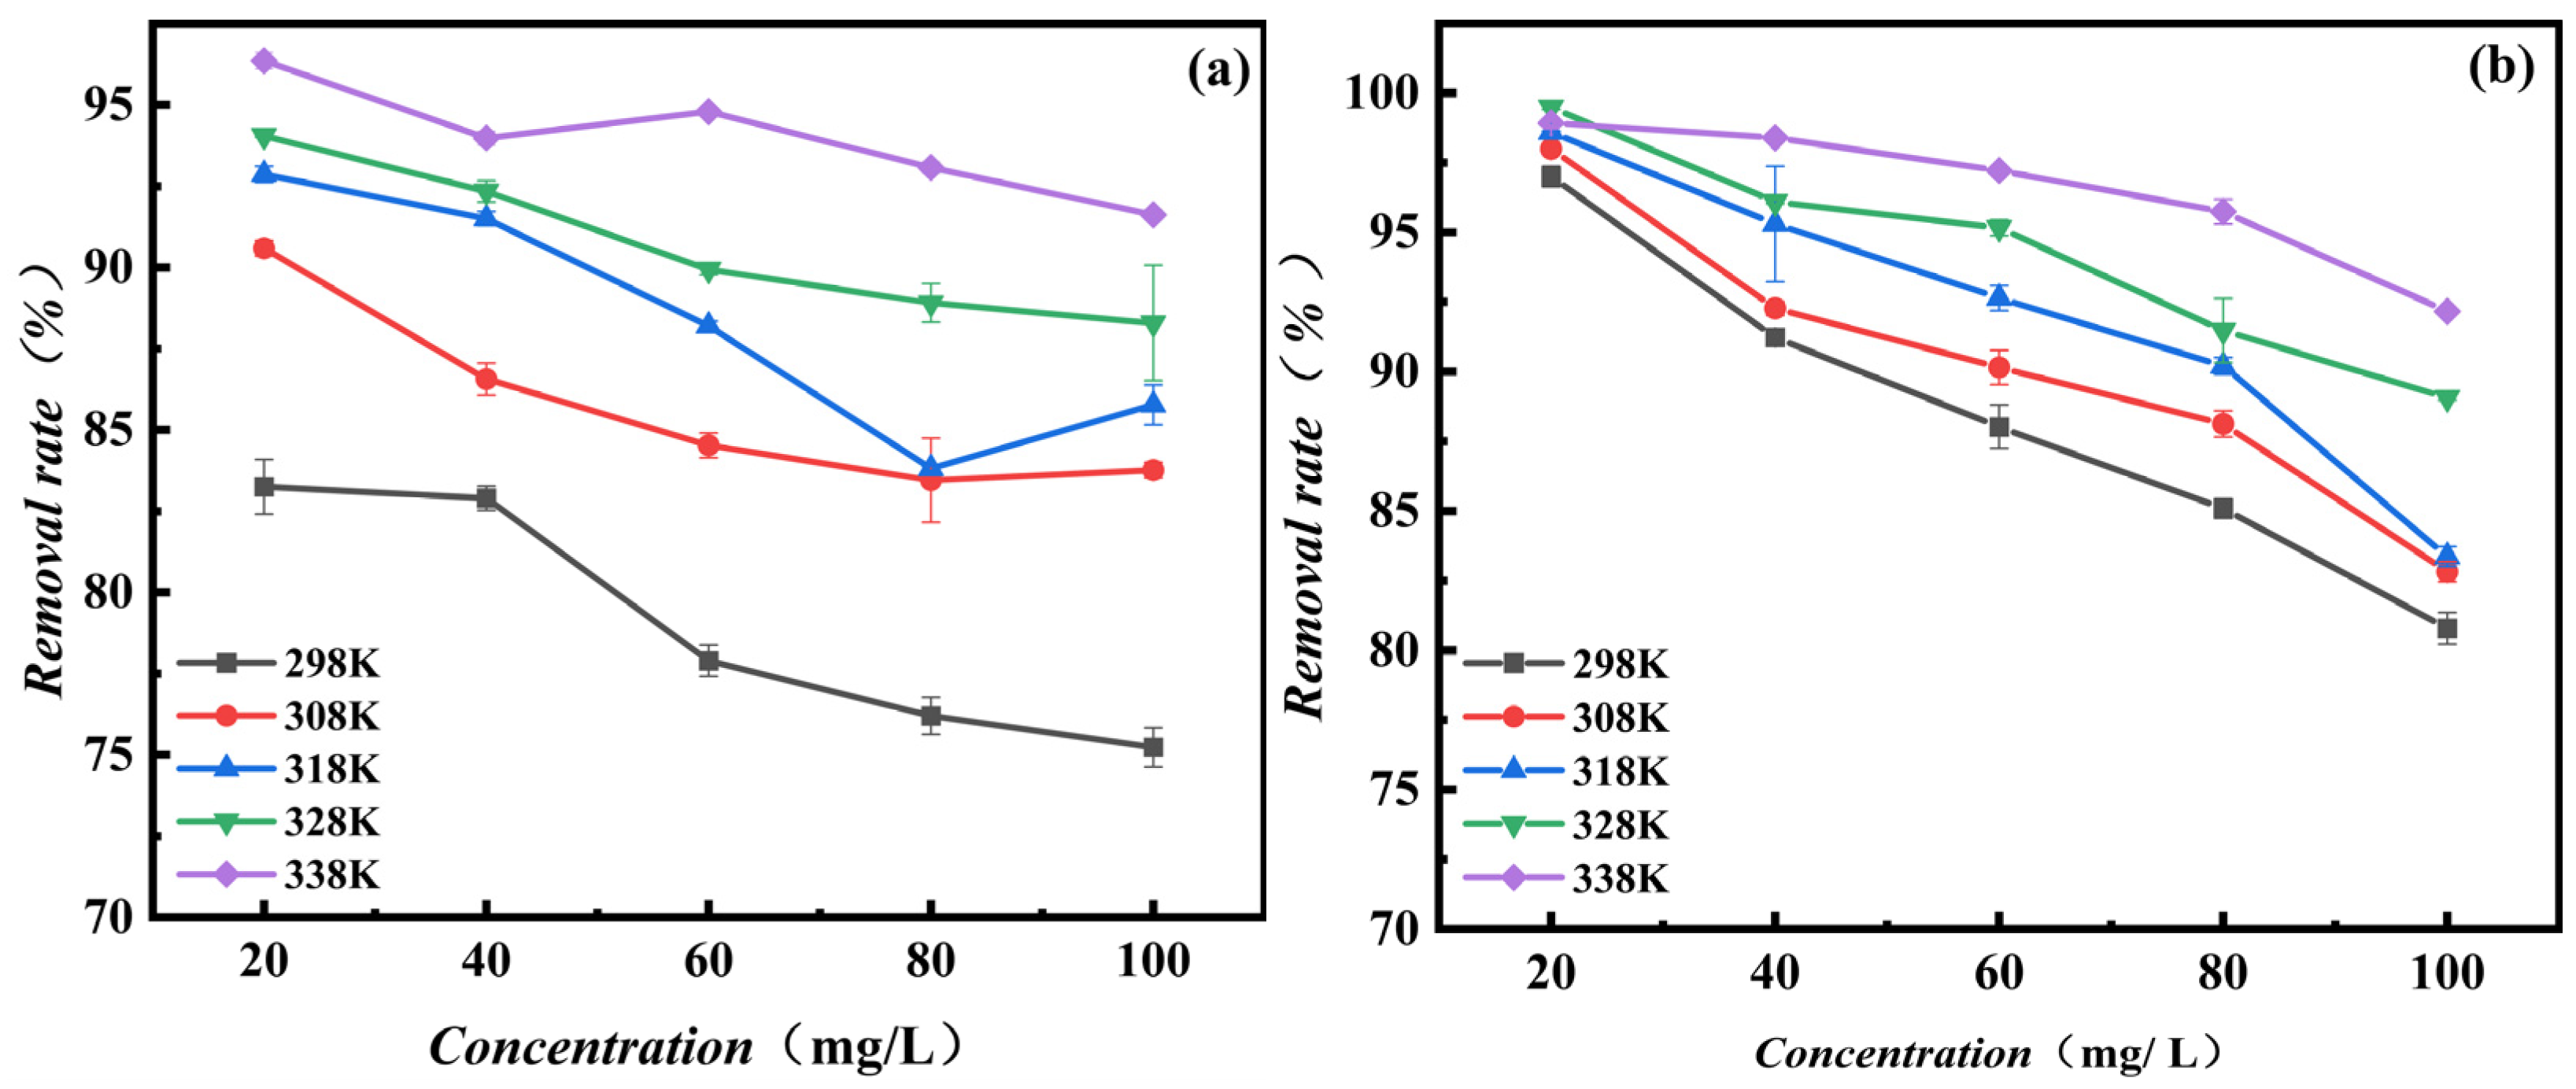
MB adsorption onto the adsorbents were heavily influenced by temperature in a significant way. The adsorption of MB onto Fe3O4-MOS and BC at different temperatures and five various initial mass concentrations of MB were studied. From Figure 9, it could be found that the removal rate of MB increased as the temperature rose from 298 K to 338 K, which suggested that adsorption of MB was an endothermic process. With the increase of adsorption temperature, and enhanced MB, the random mobility of MB was enhanced, the adsorption active sites was increased [52] which elimated the mass transfer resistance that would impede the adsorption process; it was reduced or completely eliminated [53]. In addition, the viscosity of solution decreases and the surface activity of dye molecules increases with the increase of temperature, which results in the diffusion rate of dye molecules on the adsorbent channel being accelerated [54]. Furthermore, there might form extra adsorption active sites on the adsorbent which enhance the adsorption capacity at a high temperature [55]. These reasons made the adsorption of MB become easier and faster with the increase of temperature. Due to the iron ions loaded Fe3O4-MOS were insensitive to temperature changes, and the removal rate of Fe3O4-MOS was more stable and higher as the temperature increased than was BC.
To learn more about the thermodynamic properties of the MB adsorption, a series of experiments was performed at temperatures ranging from 298 K to 338 K. Thermodynamic factors like the Gibbs free energy (∆G), enthalpy (∆H), and entropy (∆S) were used to accurately predict the adsorption. There thermodynamic parameters of the biochar adsorption system were calculated by using the following equations:
L n ( K d ) = T Δ S Δ H R T
Δ G = R T ln   ( K d )
K d = q e C e
where Kd was the Freundlich constant, R (J/mol·K) was the gas parameter (8.314), and T (K) was the kelvin temperature. It was obvious that the negative value of Gibbs free energy becomes larger when the temperature increased from 298 K to 338 K, indicating that the adsorption of MB on these samples was thermodynamically favorable and spontaneous. Thermodynamic parameters for the adsorption of MB onto biochar are listed in Table 2. The value of ΔG was negative, which indicated that adsorption was a spontaneous reaction. Meanwhile, the absolute value of ΔG increases with the increase of temperature, which illustrates that high temperature is beneficial to the adsorption of MB on Fe3O4-MOS and BC. The ΔH value became positive, which establishes that the adsorption of MB on biochar was an endothermic process. In previous studies, when the enthalpy value was less than 25 KJ/mol, an important factor in the reaction was the van der Waals force. The acting force of chemical bonding dominates the entire adsorption when ΔH is in the range of 80–200 KJ/mol [56]. Owing to the enthalpy value being greater than 104.51 KJ/mol, adsorption of MB on Fe3O4-MOS was primarily governed by chemical adsorption. For BC, however, physical adsorption was predominant (∆H < 35 KJ/mol). Additionally, there were no significant changes in enthalpy with the change of MB concentration, indicating that very little energy can be used for the adsorption of higher concentrations of MB. The entropy value (∆S) was positive, proving the increase of disorder in the entire adsorption process. This might be because the concentration of free MB molecules in solution decreased as the adsorption progressed, thereby reducing the electron repulsion in the system and enhancing the ion disorder.

3.2.5. Adsorption Isotherm and Initial MB Concentration

This study investigated the effect of initial mass concentration on adsorption at various temperatures. It could be found from Figure 10b that the removal rate of MB by Fe3O4-MOS shows a downward trend as the concentration increases within the investigated concentration range. As a mesoporous material, the pore structure of Fe3O4-MOS was conducive to the flow of MB and capillary condensation inside it, which made the interaction between solvent molecules and active adsorption centers easier. As the concentration increased, a large number of effective active adsorption centers were occupied, and the effective volume of the pores reduced as the intensity of capillary condensation increased, so a lot of solvent molecules were repelled on the surface of the adsorbents. According to the previous study [57], there are multiple water molecules that would be resolved in the adsorption of the MB molecule, which implies the adsorption of MB would be more difficult with more energy devoted into the resolution of water molecules as the concentration increased. Compared with Fe3O4-MOS, the general trends of BC also declined and the adsorption efficiency was lower. This might be attributed to the diffiences of various pore structures and surface functional groups.
The adsorption isotherm was to reveal the relationship between adsorption efficiency and solution concentration under conditions of constant temperature. This research compared the adsorption behavior of MB using the Langmuir, Freundlich, Temkin, and Dubinin-Redushckevich (D–R) isotherm models. The Langmuir model assumed that the active sites on the adsorbent surface were equally distributed and that each molecule adsorbed the same adsorption activation energy [58]. Freundlich considered that adsorption occurred on an uneven solid surface and had different types of active sites [59]. The Temkin isotherm model accounted for indirect adsorbate-adsorbate interactions on adsorption energy [60]. The D–R model was to judge whether the adsorption was a physical, chemical or ion exchange process [61]. Physical forces such as Vander-Waals and hydrogen bonding might affect the adsorption mechanism when E < 8 KJ/mol [62], while chemical forces dominated when E > 8 KJ/mol [63]. The equations of these as follows:
q e , exp = q e , cal K L C e 1 + K L C e
q e = K F C e 1 / n
q e = R T b T ln ( a T C e )
q e = q m exp   ( k ε 2 )
ε = R T ln   ( 1 + 1 C e )
E = ( 2 K ) 0 . 5
where Ce (mg/L) was the ion concentration of the solution at adsorption equilibrium; qe and qe,exp (mg/g) was the adsorption capacity of MB at adsorption equilibrium, KL (L/mg) was the Langmuir adsorption constant, and qm (mg/g) was the maximum adsorption capacity of the adsorbent. KF indicated the adsorption capacity and represented the strength of the adsorptive bond. n was the heterogeneity factor which represents the bond distribution. k was a constant related to the adsorption energy (mol2/kJ2). ε was the Polanyi potential (J/mol), and the mean free energy of adsorption (E) was calculated from the k values. aT and bT were Temkin model parameters, with bT linked to adsorption heat.
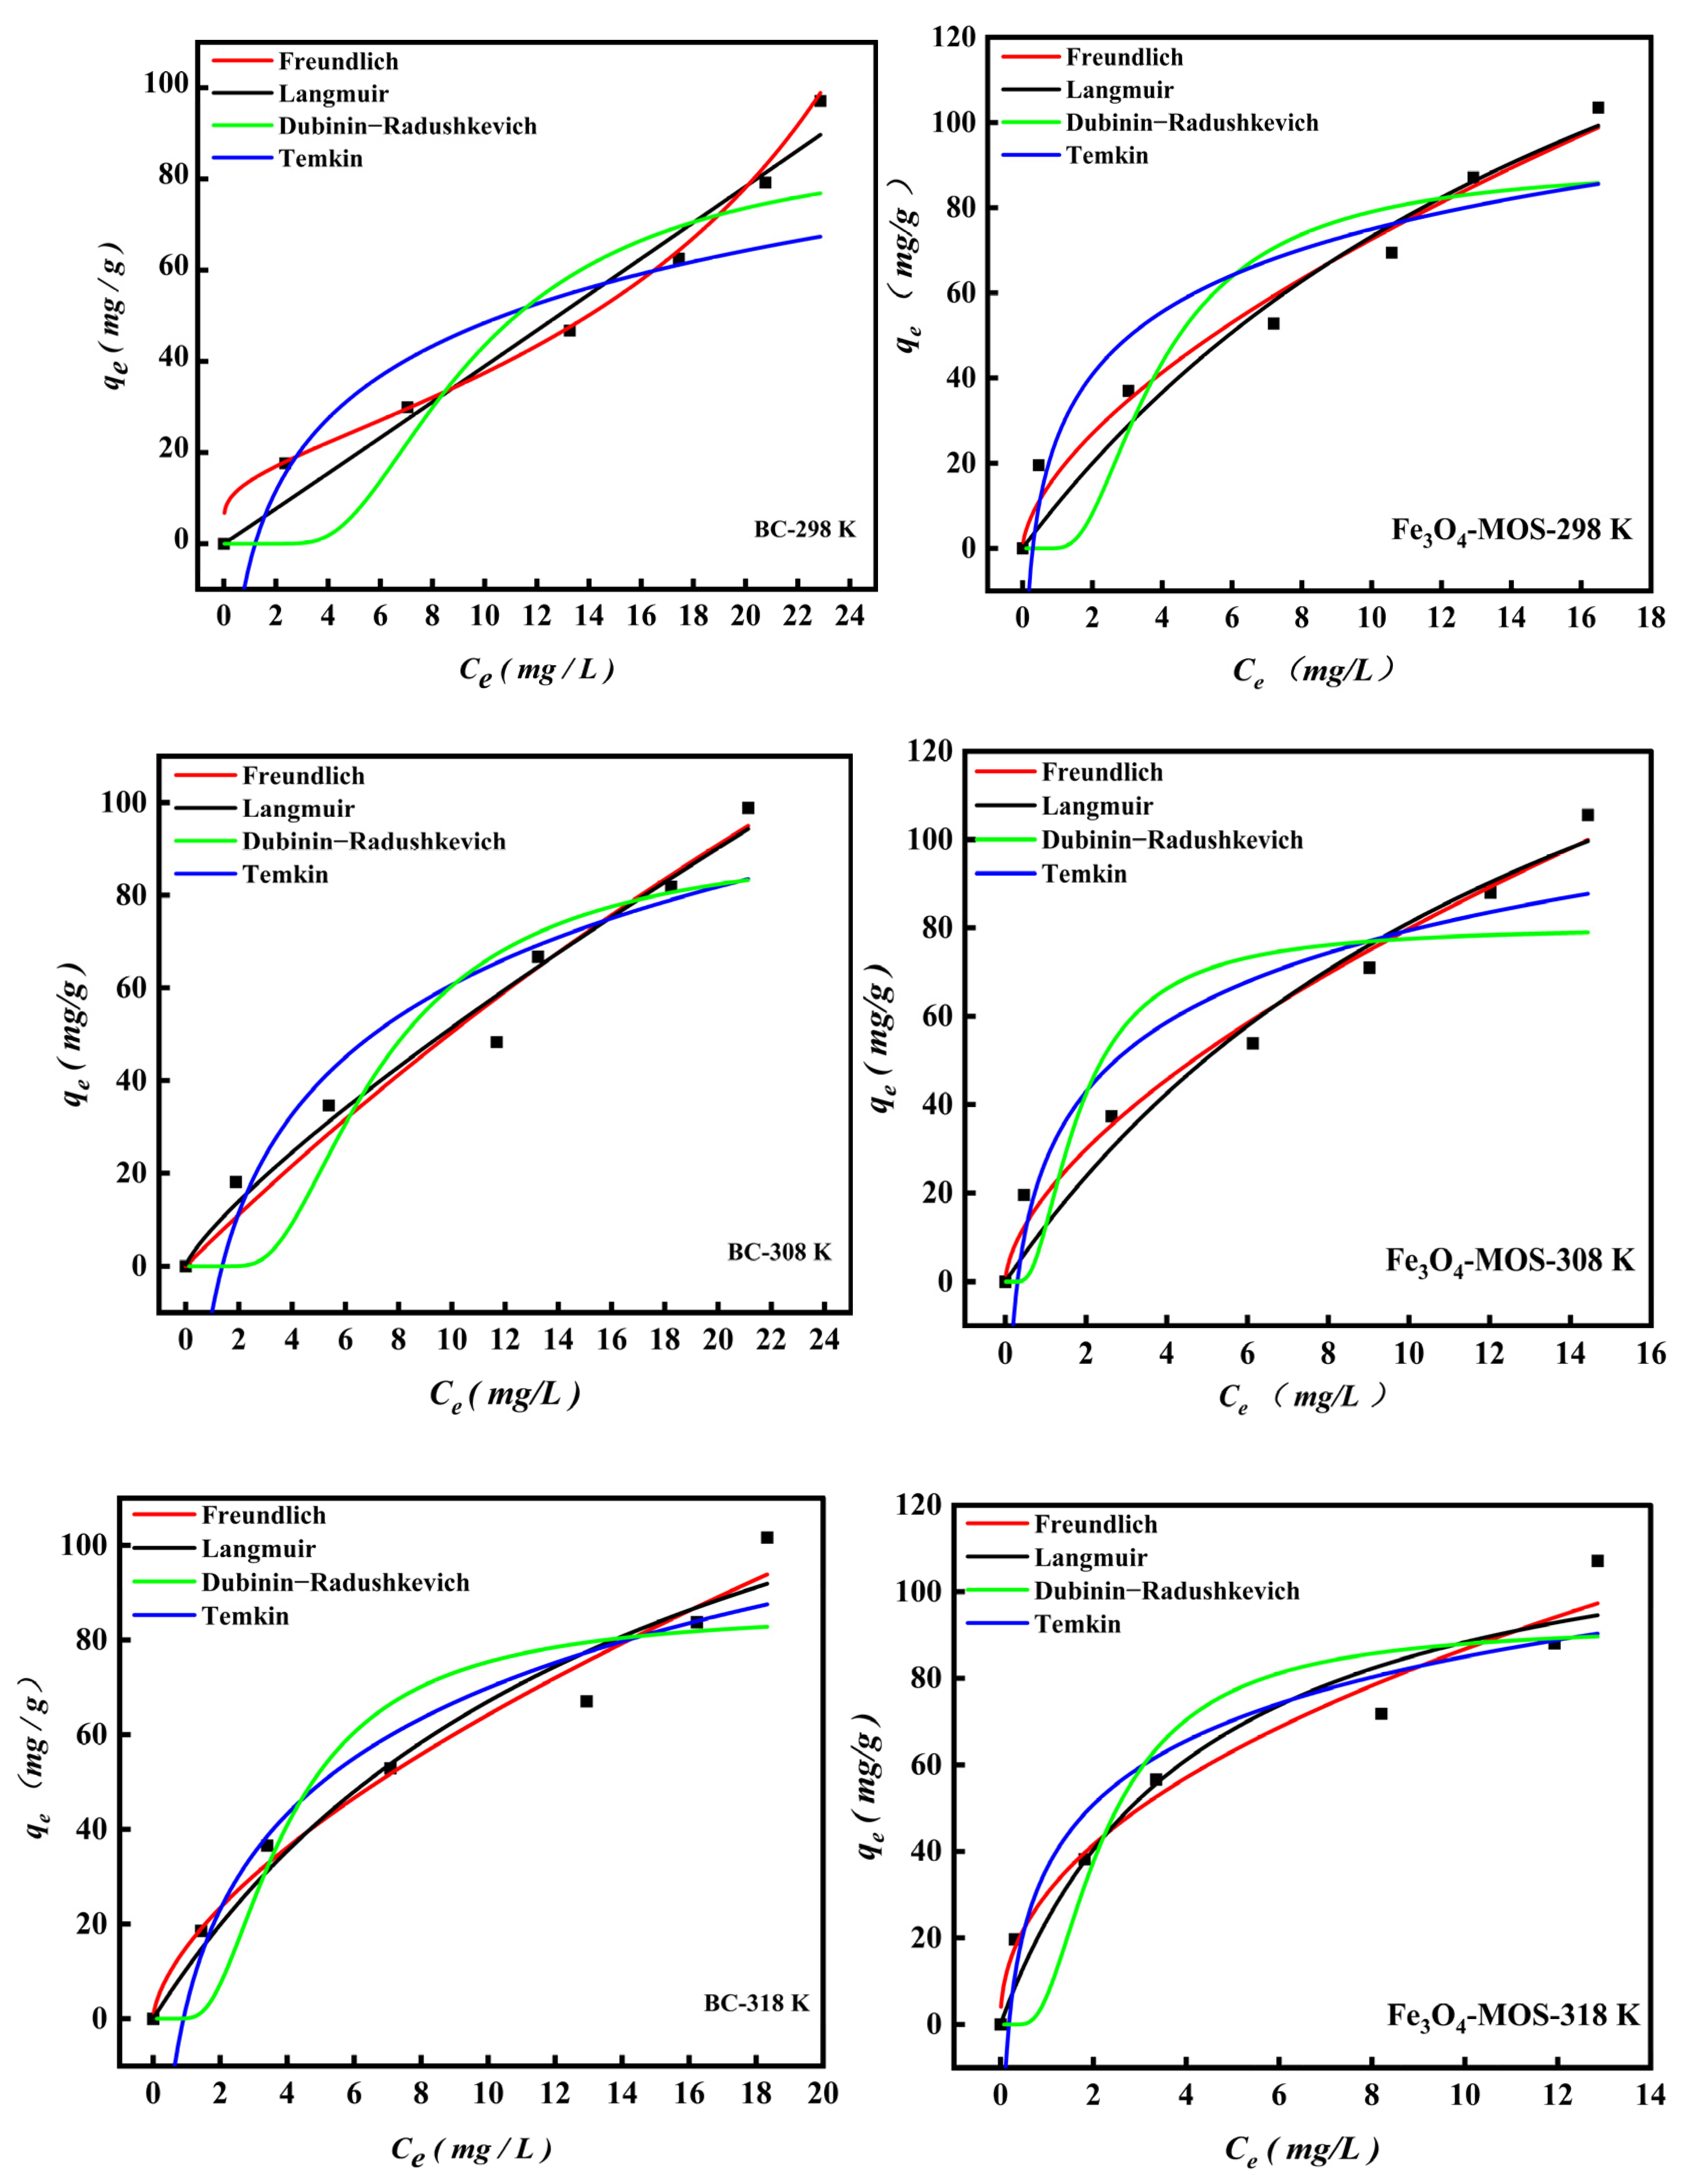
As shown in Figure 11, R2 was relatively near to 1, indicating that the experimental data were well correlated with the theoretical predictions (Table 3). According to the range of R2 of the above four models, the order is Freundlich > Langmuir > Temkin > D-R. These models explained whether BC or Fe3O4-MOS, in their adsorption of MB were non-ideal and multi-layer adsorption process on a heterogeneous surface. In addition, the high value of the n parameter in Freundlich indicated the presence of high energy sites for MB adsorption on the adsorbent surface and the value of 1/n below 1 implied a chemisorption of MB by Fe3O4-MOS and BC. As the adsorption temperature increased, the 1/n values of Fe3O4-MOS reduced from 0.60 (298 K) to 0.30 (338 K), indicating that the adsorption was more efficient at the higher temperature. Although the correlation coefficients for Langmuir isotherm (0.93–0.96) were significantly less than that of Fredunlich, the Langmuir parameter of KL represented the maximum monolayer saturation capability. As can be seen from Table 3, the values of KL gradually increased as the temperature increased, which indicated that the experimental conditions were suitable for the adsorption and the higher temperature were more favorable for the adsorption of MB on the Fe3O4-MOS and BC. Additionally, the bT value increased as the temperature rose from 298 K to 338 K, which established that the adsorption was endothermic. Furthermore, the value of mean adsorption free energy (E) calculated by D-R model determined the type of adsorption. The E values for two adsorbents were more than 8 KJ/mol, confirming the adsorption of MB on the as-prepared materials belongs to chemical adsorption process [1]. These conclusions can also be verified from the kinetic data.

3.3. Regeneration and Stability

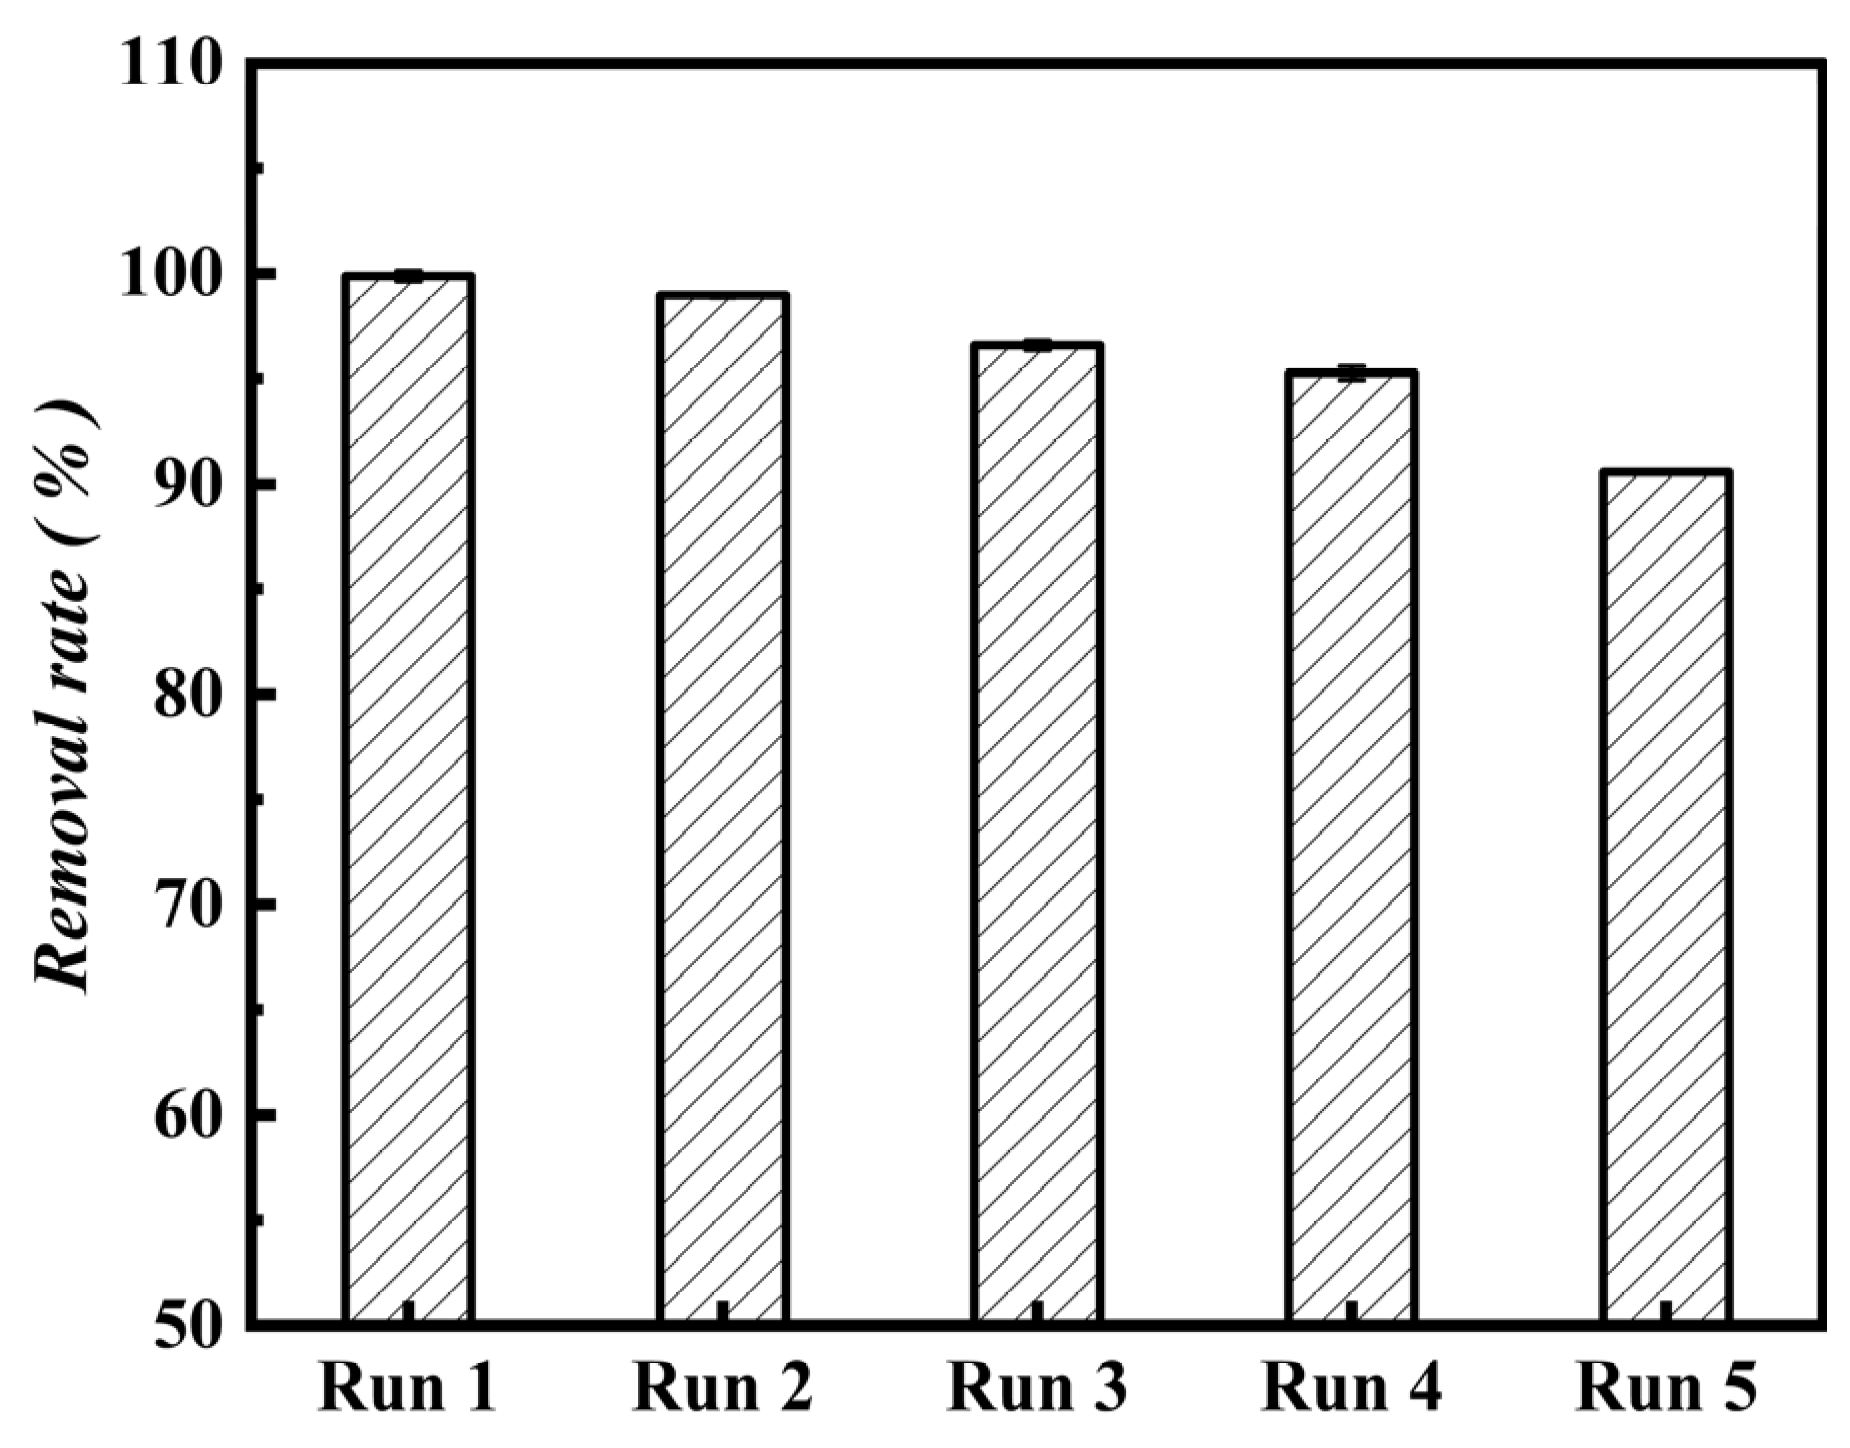
Practical efficiency and cost savings depend heavily on adsorbent’s capacity to be regenerated, reused, and steady. Previous researchers have recycled the adsorbents through washing away the adsorbed pollutants. This approach not only allows the pollutants to return to the water body, but also fails to realize the practical application goal of removing pollutants. In this study, the adsorb-saturated adsorbent was carbonized at 350 °C for 3 h, then were added at 1.0 g/L the regenerated materials to 40 mg/L MB, and reacted 120 min under 30 °C and 160 rpm/min. As shown in Figure 12, after five regeneration cycles, the rate of MB removal only went down by 9%, and the rate of MB removal was still close to 90%. Due to the dye molecules being adsorbed on the active center are separated under high temperature, the micro-pore structure of Fe3O4-MOS had no change. Fe3O4-MOS would be an excellent adsorbent for removing MB dyes from contaminated water, as shown by the collected results.
More studies have been conducted on the utilization of various magnetic biochar for the treatment of dyes in wastewater. As shown at Table 4, Sun et al. reported that Fe-modified lignin-based biochar quick adsorption could be achieved in 15 min with the MB removal efficiency of 100%, and that adsorption capacity reached 200 mg/g [31]. Microalgal biochar had the maximum adsorption capacity of 113.0 mg/g for MB, and the equilibrium time was 120 h [64]. The maximum adsorption capacities of magnetic biochar composite derived from paper waste sludge was 5.92 mg/g [65]. Wang et al. reported that the maximum MB adsorption capacities of the modified swine manure and rice straw biochar were 143.76 mg/g and 131.58 mg/g, respectively [66]. Compared with the previously reported biochar, Fe3O4-MOS was more efficient and selective in removing MB. Moreover, the cost of raw materials for Fe3O4-MOS was low. Results indicated that Fe3O4-MOS was cost-effective and had huge potential in removing MB from wastewater.

4. Conclusions

In this study, Fe3O4-MOS was successfully prepared from the agricultural waste material moringa seed shells, using the ultrasonic-assisted impregnation-pyrolysis K2CO3 and Fe3O4. Under suitable experimental conditions, the maximum adsorption capacity of MB could be 219.60 mg/g. Mechanism study indicated that pore adsorption, electrostatic interaction, hydrogen bond, and π-π interaction were the major adsorption mechanisms. Furthermore, Fe3O4-MOS could be regenerated and recycled after a simple high temperature treatment, and it exhibited a stable and good removal ability for MB. Based on the results, it was concluded that the Fe3O4-MOS could be used as an efficient and low-cost adsorbent for removal of MB from aqueous solution.

Author Contributions

Conceptualization, M.L.; methodology, M.L. and C.D.; software, M.L. and C.D.; validation, M.L. and C.D.; formal analysis, M.L. and C.D.; writing—original draft preparation, M.L. and C.D.; writing—review and editing, M.L., C.G. and L.Y. All authors have read and agreed to the published version of the manuscript.

Funding

This research was supported by the Open Project Program of Xinghuacun College of Shanxi University (Shanxi Institute of Brewing Technology and Industry) (No. XCSXU-KF-202207).

Institutional Review Board Statement

This study does not involve any human or animal testing.

Informed Consent Statement

Informed consent was obtained from all subjects involved in the study.

Data Availability Statement

All relevant data has been included in the article.

Conflicts of Interest

The authors declare no conflict of interest.

References

  1. Yagub, M.T.; Sen, T.K.; Afroze, S.; Ang, H.M. Dye and its removal from aqueous solution by adsorption: A review. Adv. Colloid Interface Sci. 2014, 209, 172–184. [Google Scholar] [CrossRef] [PubMed]
  2. Singh, K.; Arora, S. Removal of Synthetic Textile Dyes From Wastewaters: A Critical Review on Present Treatment Technologies. Crit. Rev. Environ. Sci. Technol. 2011, 41, 807–878. [Google Scholar] [CrossRef]
  3. Kalra, A.; Gupta, A. Recent advances in decolourization of dyes using iron nanoparticles: A mini review. Mater. Today Proc. 2021, 36, 689–696. [Google Scholar] [CrossRef]
  4. Zhang, W.; Wang, Y.; Fan, L.; Liu, X.; Cao, W.; Ai, H.; Wang, Z.; Liu, X.; Jia, H. Sorbent Properties of Orange Peel-Based Biochar for Different Pollutants in Water. Processes 2022, 10, 856. [Google Scholar] [CrossRef]
  5. Li, J.; Wang, R.; Zhang, D.; Su, Z.; Li, H.; Yan, Y. Copper Iodide (CuI) coating as a self-cleaning adsorbent for highly efficient dye removal. J. Alloys Compd. 2019, 774, 191–200. [Google Scholar] [CrossRef]
  6. Tkaczyk, A.; Mitrowska, K.; Posyniak, A. Synthetic organic dyes as contaminants of the aquatic environment and their implications for ecosystems: A review. Sci. Total Environ. 2020, 717, 137222. [Google Scholar] [CrossRef]
  7. Serrano-Martínez, A.; Mercader-Ros, M.T.; Martínez-Alcalá, I.; Lucas-Abellán, C.; Gabaldón, J.A.V.M. Degradation and toxicity evaluation of azo dye Direct red 83:1 by an advanced oxidation process driven by pulsed light. J. Water Process Eng. 2020, 37, 101530. [Google Scholar] [CrossRef]
  8. Alghamdi, W.; el Mannoubi, I. Investigation of Seeds and Peels of Citrullus colocynthis as Efficient Natural Adsorbent for Methylene Blue Dye. Processes 2021, 9, 1279. [Google Scholar] [CrossRef]
  9. Zeng, H.; Yu, Z.; Shao, L.; Li, X.; Zhu, M.; Liu, Y.; Feng, X.; Zhu, X. A novel strategy for enhancing the performance of membranes for dyes separation: Embedding PAA@UiO-66-NH2 between graphene oxide sheets. Chem. Eng. J. 2021, 403, 126281–126291. [Google Scholar] [CrossRef]
  10. Vantamuri, A.B.; Shettar, A.K. Biodegradation of Diazo Reactive dye (Green HE4BD) by Marasmius sp. BBKAV79. Chem. Data Collect. 2020, 28, 126281. [Google Scholar] [CrossRef]
  11. Blanchard, G.; Maunaye, M.; Martin, G. Removal of heavy metals from waters by means of natural zeolites. Water Res. 1984, 18, 1501–1507. [Google Scholar] [CrossRef]
  12. Kanakaraju, D.; bin Ya, M.H.; Lim, Y.-C.; Pace, A. Combined Adsorption/Photocatalytic dye removal by copper-titania-fly ash composite. Surf. Interfaces 2020, 19, 100534–100545. [Google Scholar] [CrossRef]
  13. Low, K.S.; Lee, C.K.; Tan, K.K. Biosorption of basic dyes by water hyacinth roots. Bioresour. Technol. 1995, 52, 79–83. [Google Scholar] [CrossRef]
  14. M-Ridha, M.J.; Hussein, S.I.; Alismaeel, Z.T.; Atiya, M.A.; Aziz, G.M. Biodegradation of reactive dyes by some bacteria using response surface methodology as an optimization technique. Alex. Eng. J. 2020, 59, 3551–3563. [Google Scholar] [CrossRef]
  15. El-Sheekh, M.M.; Gharieb, M.M.; Abou-El-Souod, G.W. Biodegradation of dyes by some green algae and cyanobacteria. Int. Biodeterior. Biodegrad. 2009, 63, 699–704. [Google Scholar] [CrossRef]
  16. Sadaf, S.; Bhatti, H.N. Batch and fixed bed column studies for the removal of Indosol Yellow BG dye by peanut husk. J. Taiwan Inst. Chem. Eng. 2014, 45, 541–553. [Google Scholar] [CrossRef]
  17. Wang, L. Application of activated carbon derived from “waste” bamboo culms for the adsorption of azo disperse dye: Kinetic, equilibrium and thermodynamic studies. J. Environ. Manag. 2012, 102, 79–87. [Google Scholar] [CrossRef]
  18. Lin, Q.; Wang, K.; Gao, M.; Bai, Y.; Chen, L.; Ma, H. Effectively removal of cationic and anionic dyes by pH-sensitive amphoteric adsorbent derived from agricultural waste-wheat straw. J. Taiwan Inst. Chem. Eng. 2017, 76, 65–72. [Google Scholar] [CrossRef]
  19. Da Rosa, M.P.; Igansi, A.V.; Lütke, S.F.; Sant’Anna Cadaval, T.R.; do Santos, A.C.R.; de Oliveira Lopes Inacio, A.P.; de Almeida Pinto, L.A.; Beck, P.H. A new approach to convert rice husk waste in a quick and efficient adsorbent to remove cationic dye from water. J. Environ. Chem. Eng. 2019, 7, 103504. [Google Scholar] [CrossRef]
  20. Afroze, S.; Sen, T.K.; Ang, M.; Nishioka, H.J.D.; Treatment, W. Adsorption of methylene blue dye from aqueous solution by novel biomass Eucalyptus sheathiana bark: Equilibrium, kinetics, thermodynamics and mechanism. Desalination Water Treatment. 2016, 57, 5858–5878. [Google Scholar] [CrossRef]
  21. Liu, Z.; Zhang, F.-S.; Sasai, R. Arsenate removal from water using Fe3O4-loaded activated carbon prepared from waste biomass. Chem. Eng. J. 2010, 160, 57–62. [Google Scholar] [CrossRef]
  22. Zhu, X.; Liu, Y.; Luo, G.; Qian, F.; Zhang, S.; Chen, J. Facile fabrication of magnetic carbon composites from hydrochar via simultaneous activation and magnetization for triclosan adsorption. Env. Sci. Technol. 2014, 48, 5840–5848. [Google Scholar] [CrossRef] [PubMed]
  23. Wang, S.; Gao, B.; Zimmerman, A.R.; Li, Y.; Ma, L.; Harris, W.G.; Migliaccio, K.W. Removal of arsenic by magnetic biochar prepared from pinewood and natural hematite. Bioresour. Technol. 2015, 175, 391–395. [Google Scholar] [CrossRef] [PubMed]
  24. Sawalha, H.; Bader, A.; Sarsour, J.; Al-Jabari, M.; Rene, E. Removal of Dye (Methylene Blue) from Wastewater Using Bio-Char Derived from Agricultural Residues in Palestine: Performance and Isotherm Analysis. Processes 2022, 10, 2039. [Google Scholar] [CrossRef]
  25. Du, H.; Zhong, Z.; Zhang, B.; Shi, K.; Li, Z. Comparative study on pyrolysis of bamboo in microwave pyrolysis-reforming reaction by binary compound impregnation and chemical liquid deposition modified HZSM-5. J. Environ. Sci. 2020, 94, 186–196. [Google Scholar] [CrossRef]
  26. Choi, J.; Nam, H.; Capareda, S.C. Effect of metal salts impregnation and microwave-assisted solvent pretreatment on selectivity of levoglucosenone and levoglucosan from vacuum pyrolysis of ashe juniper waste. J. Environ. Chem. Eng. 2019, 7, 102796–102806. [Google Scholar] [CrossRef]
  27. Guo, F.; Peng, K.; Zhao, X.; Jiang, X.; Qian, L.; Guo, C.; Rao, Z. Influence of impregnated copper and zinc on the pyrolysis of rice husk in a micro-fluidized bed reactor: Characterization and kinetics. Int. J. Hydrogen Energy 2018, 43, 21256–21268. [Google Scholar] [CrossRef]
  28. Bezerra, C.O.; Cusioli, L.F.; Quesada, H.B.; Nishi, L.; Mantovani, D.; Vieira, M.F.; Bergamasco, R. Assessment of the use of Moringa oleifera seed husks for removal of pesticide diuron from contaminated water. Environ. Technol. 2020, 41, 191–201. [Google Scholar] [CrossRef]
  29. Homem, N.C.; Vieira, A.M.S.; Bergamasco, R.; Vieira, M.F. Low-cost biosorbent based on Moringa oleifera residues for herbicide atrazine removal in a fixed-bed column. Can. J. Chem. Eng. 2018, 96, 1468–1478. [Google Scholar] [CrossRef]
  30. Reddy, D.H.; Seshaiah, K.; Reddy, A.V.; Rao, M.M.; Wang, M.C. Biosorption of Pb2+ from aqueous solutions by Moringa oleifera bark: Equilibrium and kinetic studies. J. Hazard. Mater. 2010, 174, 831–838. [Google Scholar] [CrossRef]
  31. Sun, Y.; Wang, T.; Han, C.; Lv, X.; Bai, L.; Sun, X.; Zhang, P. Facile synthesis of Fe-modified lignin-based biochar for ultra-fast adsorption of methylene blue: Selective adsorption and mechanism studies. Bioresour. Technol. 2022, 344, 126186. [Google Scholar] [CrossRef]
  32. Li, S.; Yang, F.; Li, J.; Cheng, K. Porous biochar-nanoscale zero-valent iron composites: Synthesis, characterization and application for lead ion removal. Sci. Total Environ. 2020, 746, 141037. [Google Scholar] [CrossRef]
  33. Datsyuk, V.; Kalyva, M.; Papagelis, K.; Parthenios, J.; Tasis, D.; Siokou, A.; Kallitsis, I.; Galiotis, C. Chemical oxidation of multiwalled carbon nanotubes. Carbon 2008, 46, 833–840. [Google Scholar] [CrossRef]
  34. Beamson, G.; Briggs, D.R. High resolution XPS of organic polymers. Adv. Mater. 1992, 5, 778. [Google Scholar]
  35. Zhang, Q.; Chadderdon, X.; Tang, B. Preparation of a magnetically recoverable biocatalyst support on monodisperse Fe3O4 nanoparticles. RSC Adv. 2013, 3, 9924–9931. [Google Scholar] [CrossRef]
  36. Gurav, R.; Bhatia, S.K.; Choi, T.R.; Park, Y.L.; Park, J.Y.; Han, Y.H.; Vyavahare, G.; Jadhav, J.; Song, H.S.; Yang, P.; et al. Treatment of furazolidone contaminated water using banana pseudostem biochar engineered with facile synthesized magnetic nanocomposites. Bioresour. Technol. 2020, 297, 122472. [Google Scholar] [CrossRef]
  37. Zhang, Y.; Qin, J.; Yi, Y. Biochar and hydrochar derived from freshwater sludge: Characterization and possible applications. Sci. Total Environ. 2021, 763, 144550. [Google Scholar] [CrossRef]
  38. Chen, B.; Chen, Z.; Lv, S. A novel magnetic biochar efficiently sorbs organic pollutants and phosphate. Bioresour. Technol. 2011, 102, 716–723. [Google Scholar] [CrossRef]
  39. Zhang, S.; Tao, L.; Zhang, Y.; Wang, Z.; Gou, G.; Jiang, M.; Huang, C.; Zhou, Z. The role and mechanism of K2CO3 and Fe3O4 in the preparation of magnetic peanut shell based activated carbon. Powder Technol. 2016, 295, 152–160. [Google Scholar] [CrossRef]
  40. Yang, K.; Peng, H.; Wen, Y.; Li, N. Re-examination of characteristic FTIR spectrum of secondary layer in bilayer oleic acid-coated Fe3O4 nanoparticles. Appl. Surf. Sci. 2010, 256, 3093–3097. [Google Scholar] [CrossRef]
  41. Ain, Q.U.; Rasheed, U.; Yaseen, M.; Zhang, H.; Tong, Z. Superior dye degradation and adsorption capability of polydopamine modified Fe3O4-pillared bentonite composite. J. Hazard. Mater. 2020, 397, 122758. [Google Scholar] [CrossRef] [PubMed]
  42. Sing, K.S.W. Reporting physisorption data for gas/solid systems with special reference to the determination of surface area and porosity (Recommendations 1984). Pure Appl. Chem. 1985, 57, 603–619. [Google Scholar] [CrossRef]
  43. Li, M.; Dong, C.W.W.; Shengwan, Z.; Jincai, Z. Study on the adsorption performance of Moringa seed shell biochar on Cu(2+) in solution. Chin. Agric. Sci. Bull. 2020, 36, 84–89. [Google Scholar]
  44. Chen, W.; Duan, L.; Wang, L.; Zhu, D. Adsorption of Hydroxyl- and Amino-Substituted Aromatics to Carbon Nanotubes. Environ. Sci. Technol. 2008, 42, 6862–6868. [Google Scholar] [CrossRef] [PubMed]
  45. Jia, J.; Li, K.; Lu, K.; Chai, Q. Adsorption behavior and mechanism of methylene blue onto biomass-based mesoporous acid activated carbons by microwave heating. Chin. J. Environ. Eng. 2014, 8, 909–916. [Google Scholar]
  46. Corbett, J.F. Pseudo first-order kinetics. J. Chem. Educ. 1972, 49, 663. [Google Scholar] [CrossRef]
  47. Ho, Y.S.; McKay, G. Pseudo-second order model for sorption processes. Process Biochem. 1999, 34, 451–465. [Google Scholar] [CrossRef]
  48. Weber, W.J.; Morris, J.C. Advances in Water Pollution Research: Removal of Biologically Resistant Pollutant from Waste Water by Adsorption Proceedings of 1st International Conference on Water Pollution Symposium; Pergamon Press: Oxford, UK, 1962; Volume 2, pp. 231–266. [Google Scholar]
  49. Wu, F.-C.; Tseng, R.-L.; Juang, R.-S. Characteristics of Elovich equation used for the analysis of adsorption kinetics in dye-chitosan systems. Chem. Eng. J. 2009, 150, 366–373. [Google Scholar] [CrossRef]
  50. Tan, I.A.W.; Ahmad, A.L.; Hameed, B.H. Adsorption isotherms, kinetics, thermodynamics and desorption studies of 2,4,6-trichlorophenol on oil palm empty fruit bunch-based activated carbon. J. Hazard. Mater. 2009, 164, 473–482. [Google Scholar] [CrossRef]
  51. Liu, S.; Li, J.; Xu, S.; Wang, M.; Zhang, Y.; Xue, X. A modified method for enhancing adsorption capability of banana pseudostem biochar towards methylene blue at low temperature. Bioresour. Technol. 2019, 282, 48–55. [Google Scholar] [CrossRef]
  52. Garba, Z.N.; Zhou, W.; Lawan, I.; Xiao, W.; Zhang, M.; Wang, L.; Chen, L.; Yuan, Z. An overview of chlorophenols as contaminants and their removal from wastewater by adsorption: A review. J. Environ. Manag. 2019, 241, 59–75. [Google Scholar] [CrossRef]
  53. Olu-Owolabi, B.I.; Alabi, A.H.; Diagboya, P.N.; Unuabonah, E.I.; During, R.A. Adsorptive removal of 2,4,6-trichlorophenol in aqueous solution using calcined kaolinite-biomass composites. J. Environ. Manag. 2017, 192, 94–99. [Google Scholar] [CrossRef]
  54. Agarry, S.E.; Owabor, C.N.; Ajani, A.O. Modified Plantain Peel as Cellulose-Based Low-Cost Adsorbent For The Removal of 2,6-Dichlorophenol From Aqueous Solution: Adsorption Isotherms, Kinetic Modeling, And Thermodynamic Studies. Chem. Eng. Commun. 2013, 200, 1121–1147. [Google Scholar] [CrossRef]
  55. Karthikeyan, T.; Rajgopal, S.; Miranda, L.R. Chromium(VI) adsorption from aqueous solution by Hevea Brasilinesis sawdust activated carbon. J. Hazard. Mater. 2005, 124, 192–199. [Google Scholar] [CrossRef]
  56. Liu, Y.; Liu, Y.-J. Biosorption isotherms, kinetics and thermodynamics. Sep. Purif. Technol. 2008, 61, 229–242. [Google Scholar] [CrossRef]
  57. Geng, X. Study on the fractions of thermodynamic function changes for both adsorption and desorption from a liquid-solid system. Thermochim. Acta 1998, 308, 131–138. [Google Scholar] [CrossRef]
  58. Langmuir, I. The adsorption of gases on plane surfaces of glass, mica and platinum. J. Am. Chem. Soc. 1918, 40, 1361–1403. [Google Scholar] [CrossRef] [Green Version]
  59. Freundlich, H.M. Over the Adsorption in Solution. J. Phys. Chem. A 1906, 57, 385–470. [Google Scholar]
  60. Temkin, M.I. Kinetics of ammonia synthesis on promoted iron catalysts. Acta Physicochim. 1940, 12, 327–356. [Google Scholar]
  61. Dubinin, M.M.; Kadlec, O. Novel ideas in the theory of the physical adsorption of vapors on micropore adsorbents. Carbon 1987, 25, 321–324. [Google Scholar] [CrossRef]
  62. Zhang, P.; O’Connor, D.; Wang, Y.; Jiang, L.; Xia, T.; Wang, L.; Tsang, D.C.W.; Ok, Y.S.; Hou, D. A green biochar/iron oxide composite for methylene blue removal. J. Hazard. Mater. 2020, 384, 121286. [Google Scholar] [CrossRef] [PubMed]
  63. Chen, A.H.; Chen, S.M. Biosorption of azo dyes from aqueous solution by glutaraldehyde-crosslinked chitosans. J. Hazard. Mater. 2009, 172, 1111–1121. [Google Scholar] [CrossRef] [PubMed]
  64. Wang, K.; Peng, N.; Sun, J.; Lu, G.; Chen, M.; Deng, F.; Dou, R.; Nie, L.; Zhong, Y. Adsorptive removal of cationic methylene blue and anionic Congo red dyes using wet-torrefied microalgal biochar: Equilibrium, kinetic and mechanism modeling. Environ. Pollut. 2021, 272, 115986. [Google Scholar] [CrossRef]
  65. Manoko, M.C.; Chirwa, E.M.M.; Makgopa, K. Non-demineralized paper waste sludge derived magnetic biochar as sorbs for removal of methylene blue, phosphorus, and selenate in wastewater. Clean. Chem. Eng. 2022, 3, 100048. [Google Scholar] [CrossRef]
  66. Wang, K.; Peng, N.; Sun, J.; Lu, G.; Chen, M.; Deng, F.; Dou, R.; Nie, L.; Zhong, Y. Synthesis of silica-composited biochars from alkali-fused fly ash and agricultural wastes for enhanced adsorption of methylene blue. Sci. Total Environ. 2020, 729, 139055. [Google Scholar] [CrossRef]
Scheme 1. The process of preparation of Fe3O4-MOS and BC.
Processes 10 02720 sch001
Figure 1. SEM images of BC (a,b,c) and Fe3O4-MOS (d,e,f); EDS elemental analysis of Fe3O4-MOS (g); and hysteresis curves of Fe3O4-MOS (h).
Processes 10 02720 g001aProcesses 10 02720 g001b
Figure 2. XRD patterns for biochar and magnetic moringa seed shell biochar.
Processes 10 02720 g002
Figure 3. XPS patterns of the Fe3O4-MOS full scan (a), C1S (b), O1S (c), and Fe2p (d).
Processes 10 02720 g003
Figure 4. FT–IR spectra of magnetic Fe3O4 nanoparticles, Moringa waste, BC, Fe3O4-MOS and Fe3O4-MOS adsorption.
Processes 10 02720 g004
Figure 5. N2 adsorption isotherm (a) and pore size distribution (b) of Fe3O4-MOS.
Processes 10 02720 g005
Figure 6. pHpzc of Fe3O4-MOS (a) and the effect of pH on the adsorption of MB by BC and Fe3O4-MOS (b).
Processes 10 02720 g006
Figure 7. Dosage-dependent change in MB adsorption by BC and Fe3O4-MOS.
Processes 10 02720 g007
Figure 8. Non-Linear plots of the PFO model, PSO model, the IPD model and the Elovich model for the adsorption of MB onto BC (a,c) and Fe3O4-MOS (b,d) composites at 20, 40 and 60 mg/L dye solutions.
Processes 10 02720 g008
Figure 9. Effect of the temperature for the adsorption of MB onto BC (a) and Fe3O4-MOS (b) composites at 20, 40, 60, 80and 100 mg/L dye solutions.
Processes 10 02720 g009
Figure 10. Effect of the concentration for the adsorption of MB onto BC (a) and Fe3O4-MOS (b) at 20, 40, 60, 80and 100 mg/L dye solutions.
Processes 10 02720 g010
Figure 11. Non-Linear plot of Langmuir, Fredunlich, Temkin and D-R models for the adsorption of MB onto BC and Fe3O4-MOS composites at 298 K, 308 K, 318 K, 328 K and 388 K.
Processes 10 02720 g011aProcesses 10 02720 g011b
Figure 12. The influence of cycle times on adsorption.
Processes 10 02720 g012
Table 1. Kinetic parameters of PFO model, PSO model, Elovich model and IPD model.
ModelFe3O4-MOSBC
20 mg/L40 mg/L60 mg/L20 mg/L40 mg/L60 mg/L
qe,exp (mg/g)19.7239.1858.8119.6539.2758.81
Pseudo-first order
K1 (min−1)0.270.350.530.340.420.41
qe,cal (mg/g)18.5337.4756.1918.7037.5656.63
R20.950.980.990.980.980.98
Pseudo-second order
K2 (g/mg∙min)0.020.030.030.040.030.02
qe,cal (mg/g)19.5038.4556.9019.1838.3357.83
R20.9960.980.9960.9970.9920.994
Intra-particle diffusion
C114.0829.8051.7613.9728.6747.41
Ki,10.051.010.510.862.131.33
R20.8840.9930.8940.9810.985
C28.9128.0454.5316.7234.5057.12
Ki,21.291.170.190.270.250.62
R20.9720.8940.9920.9950.900.81
Ki,30.0538.5457.890.1037.8757.77
C318.740.030.0417.710.070.05
R20.9930.9940.9940.9600.9601
Elovich
α5.44 × 1041.04 × 1083.31 × 10162.58 × 1083.87 × 10101.43 × 1011
β1.221.671.331.291.331.92
R20.9950.9940.9990.9940.9970.996
Table 2. Thermodynamic parameters.
SampleC0
(mg/L)
∆H
(KJ/mol)
∆S∆G
298 K308 K318 K328 K338 K
Fe3O4-MOS20104.51374.71−9.32−9.60−10.97−19.12−24.08
40106.17364.57−2.05−10.61−10.28−7.09−6.19
60104.84372.30−18.91−15.43−9.97−6.67−4.98
BC2029.76114.23−3.96−5.79−6.79−7.53−8.80
4035.00126.95−2.70−4.76−6.29−5.02−7.73
6027.77104.09−3.12−3.64−5.31−6.49−8.15
Table 3. The parameters of the isothermal model for adsorption of MB onto Fe3O4-MOS and BC.
ModelFe3O4-MOSBC
298 K308 K318 K328 K338 K298 K308 K318 K328 K338 K
qe,exp
(mg/g)
103.51105.57107.14108.94109.8197.1398.87101.67104.89107.44
Langmuir
kL0.050.070.240.401.301.280.010.070.010.11
qe,cal
(mg/g)
219.60205.64125.60120.10103.0488.74460.18165.61496.95196.54
R20.960.960.950.950.930.920.970.970.970.93
Freundlich
KF17.5819.5730.2239.0352.037.817.9715.1710.7224.22
1/n0.620.610.460.400.301.010.800.630.830.62
R20.960.970.960.980.990.960.960.970.960.84
Temkin
aT3.423.315.4713.6258.4538.0330.5529.1031.6647.97
bT111.55112.91124.48146.53186.6065.1583.8290.8586.1458.58
R20.900.900.930.940.960.870.910.950.890.96
Dubinin-Redushckevich
qm
(mg/g)
90.2480.3392.4593.3289.19123.10291.9586.40112.59111.39
kD2.37 × 1065.93 × 1077.84 × 1073.44 × 1076.46 × 1082.92 × 1047.06 × 1062.15 × 1065.13 × 1061.28 × 106
E459.32918.24798.601205.602782.0741.38266.12482.24312.20625
R20.860.900.890.890.860.940.860.870.930.98
Table 4. Comparison of biosorption capacities of different biosorbents for MB dye elimination.
BiosorbentAdsorption CapacityReference
Fe-modified lignin-based biochar200 mg/g[31]
Paper waste sludge biochar5.92 mg/g[65]
Modified swine manure biochar143.76 mg/g[66]
Bio-Char38 mg/g[24]
Seeds and Peels of Citrullus colocynthis18.832 mg/g, 4.480 mg/g[8]
Orange Peel-Based Biochar0.984 mg/g[4]
Novel biomass Eucalyptus sheathiana bark204.3 mg/g[20]
Fe3O4-MOS219.09 mg/gThis Study
Publisher’s Note: MDPI stays neutral with regard to jurisdictional claims in published maps and institutional affiliations.