Abstract
The data based on location/activity sensing technology is exploding and integrating multi-source data provides us with a new perspective to observe tourist behavior. On the one hand, tourist preferences can be extracted from the attractions generated by clustering. On the other hand, potentially extracted tourist information can provide decision-making support for tourism management departments in tourism planning and resource development. Therefore, developing smart tourism services for tourists and promoting the realization of “smart scenic spots.” A field survey was conducted in Zhongshan Botanical Garden, China, from 3 February to 3 April 2019. This empirical study combines a handheld GPS tracking device and questionnaire survey using SEE to optimize k-means clustering algorithm and explores the spatial–temporal behavior patterns of tourists. The results showed that tourists in the botanical garden could be divided into three behavioral patterns. They are recreation and leisure, birdwatching and photography, and learning and education. The spatial–temporal behavior patterns of different tourists have obvious differences, which provides a basis for the planning and management of smart scenic spots.
1. Introduction
“Smart” has become a new buzzword to describe technology-driven economic and social development, relying on sensors, big data, open data, and other methods [1]. While smart scenic areas stem from the smart city concept, on the one hand, they consider tourists to support mobility, resource availability and distribution sustainability, and quality of life/access [2]; on the other hand, smart garden tourism is a social phenomenon generated by the integration of information technology and tourism experience. Technology is the intermediary to focus on the experience through personalization, situational awareness, and real-time monitoring [3]. The smart park tourist experience efficiently, as the connotation is rich, can be understood as the innovation of tourism destination based on advanced technology and infrastructure, optimizing resources, increasing the tourist’s visit enthusiasm, promoting tourist interaction and blending in with the surrounding environment, and improving the quality of the park experience, thus ensuring the sustainable development of scenic spots. Tourists are active participants in the creation of smart scenic spots. They consume and create, annotate, or otherwise enhance the data that forms the basis of the experience. With the rapid development of China’s tourism industry and holiday economy, public holidays increase the number of tourists in scenic spots and decrease the quality of tourist experience, which is an important problem for tourists and scenic spot management [4,5]. Therefore, the construction of smart scenic spots based on good planning and accurate service is particularly important.
The growing popularity of location/motion-sensing technology has produced a wealth of location-based big data (LocBigData) [6], such as tracking or sensing data (for example, GPS tracking of people and other moving objects, as well as cellphone signaling data), social media data, and other geographic information data. Multiple studies have demonstrated that LocBigData can better understand human spatial–temporal behavior patterns [7], regulate and optimize landscape management services [8], improve the quality of tourists, and try to provide practical solutions to problems such as congestion and varying activity levels. Currently, the most common tracking or sensing technologies are GPS devices using the Global Navigation Satellite System and mobile phone devices. Compared with traditional data (such as questionnaires and surveys) [9], tracking or sensing data provide a more expansive and objective method [10] and can describe human behavior in space and time more completely. Such data create unprecedented opportunities for research on the construction of smart scenic spots. Mobile signaling data has the advantages of a large sample size and real-time performance, but it is difficult to obtain the data because of confidentiality and low accuracy [11]. As a new investigation method for studying individual human behavior, GPS positioning tracking has attracted extensive attention in the research field due to its portability, diversification, and availability. In terms of human behavior, GPS data tends to have better data quality in both spatial and temporal dimensions than cell phone signaling data [12]. Aczanowska studied a national park and compared a GPS track and hand-drawn map of the questionnaire to highlight the advantage of GPS in data accuracy [13]. However, the acquired GPS data cannot reveal tourists’ personal and social attributes, affecting the integrity of the analysis. Therefore, the research method needs to consider the combination of multi-source data.
As a large green space in cities, the botanical garden has been transformed into a scenic spot with diversified functions such as scientific research, protection, popular science, entertainment, and culture. In recent years, the growth of the nature tourism market (such as birdwatching tourism) [14] and popular science tourism for children has further boosted the popularity of botanical gardens. In order to survive in the ever-changing environment, it has become an effective way to construct smart scenic spot management to understand the spatial and temporal behavior patterns of tourists and adjust the spatial layout of facilities according to their preferences. Therefore, this paper takes Zhongshan Botanical Garden in China as an example, combines GPS data and traditional data, uses K-means clustering algorithm and Square Sum Error (SSE), and explores the tourist spatial–temporal behavior patterns of micro-scale scenic spots from the perspective of scenic space units, to provide decision support for the planning of smart parks. In short, the purpose of this study was to (1) conduct a field survey of tourists to discover their behavioral characteristics and demographics; (2) visually depict the spatial and temporal spatial–temporal behavior patterns of tourists; (3) provide planning strategies for smart scenic spots based on tourists’ spatial–temporal behavior patterns
2. Data and Methods
2.1. Study Area
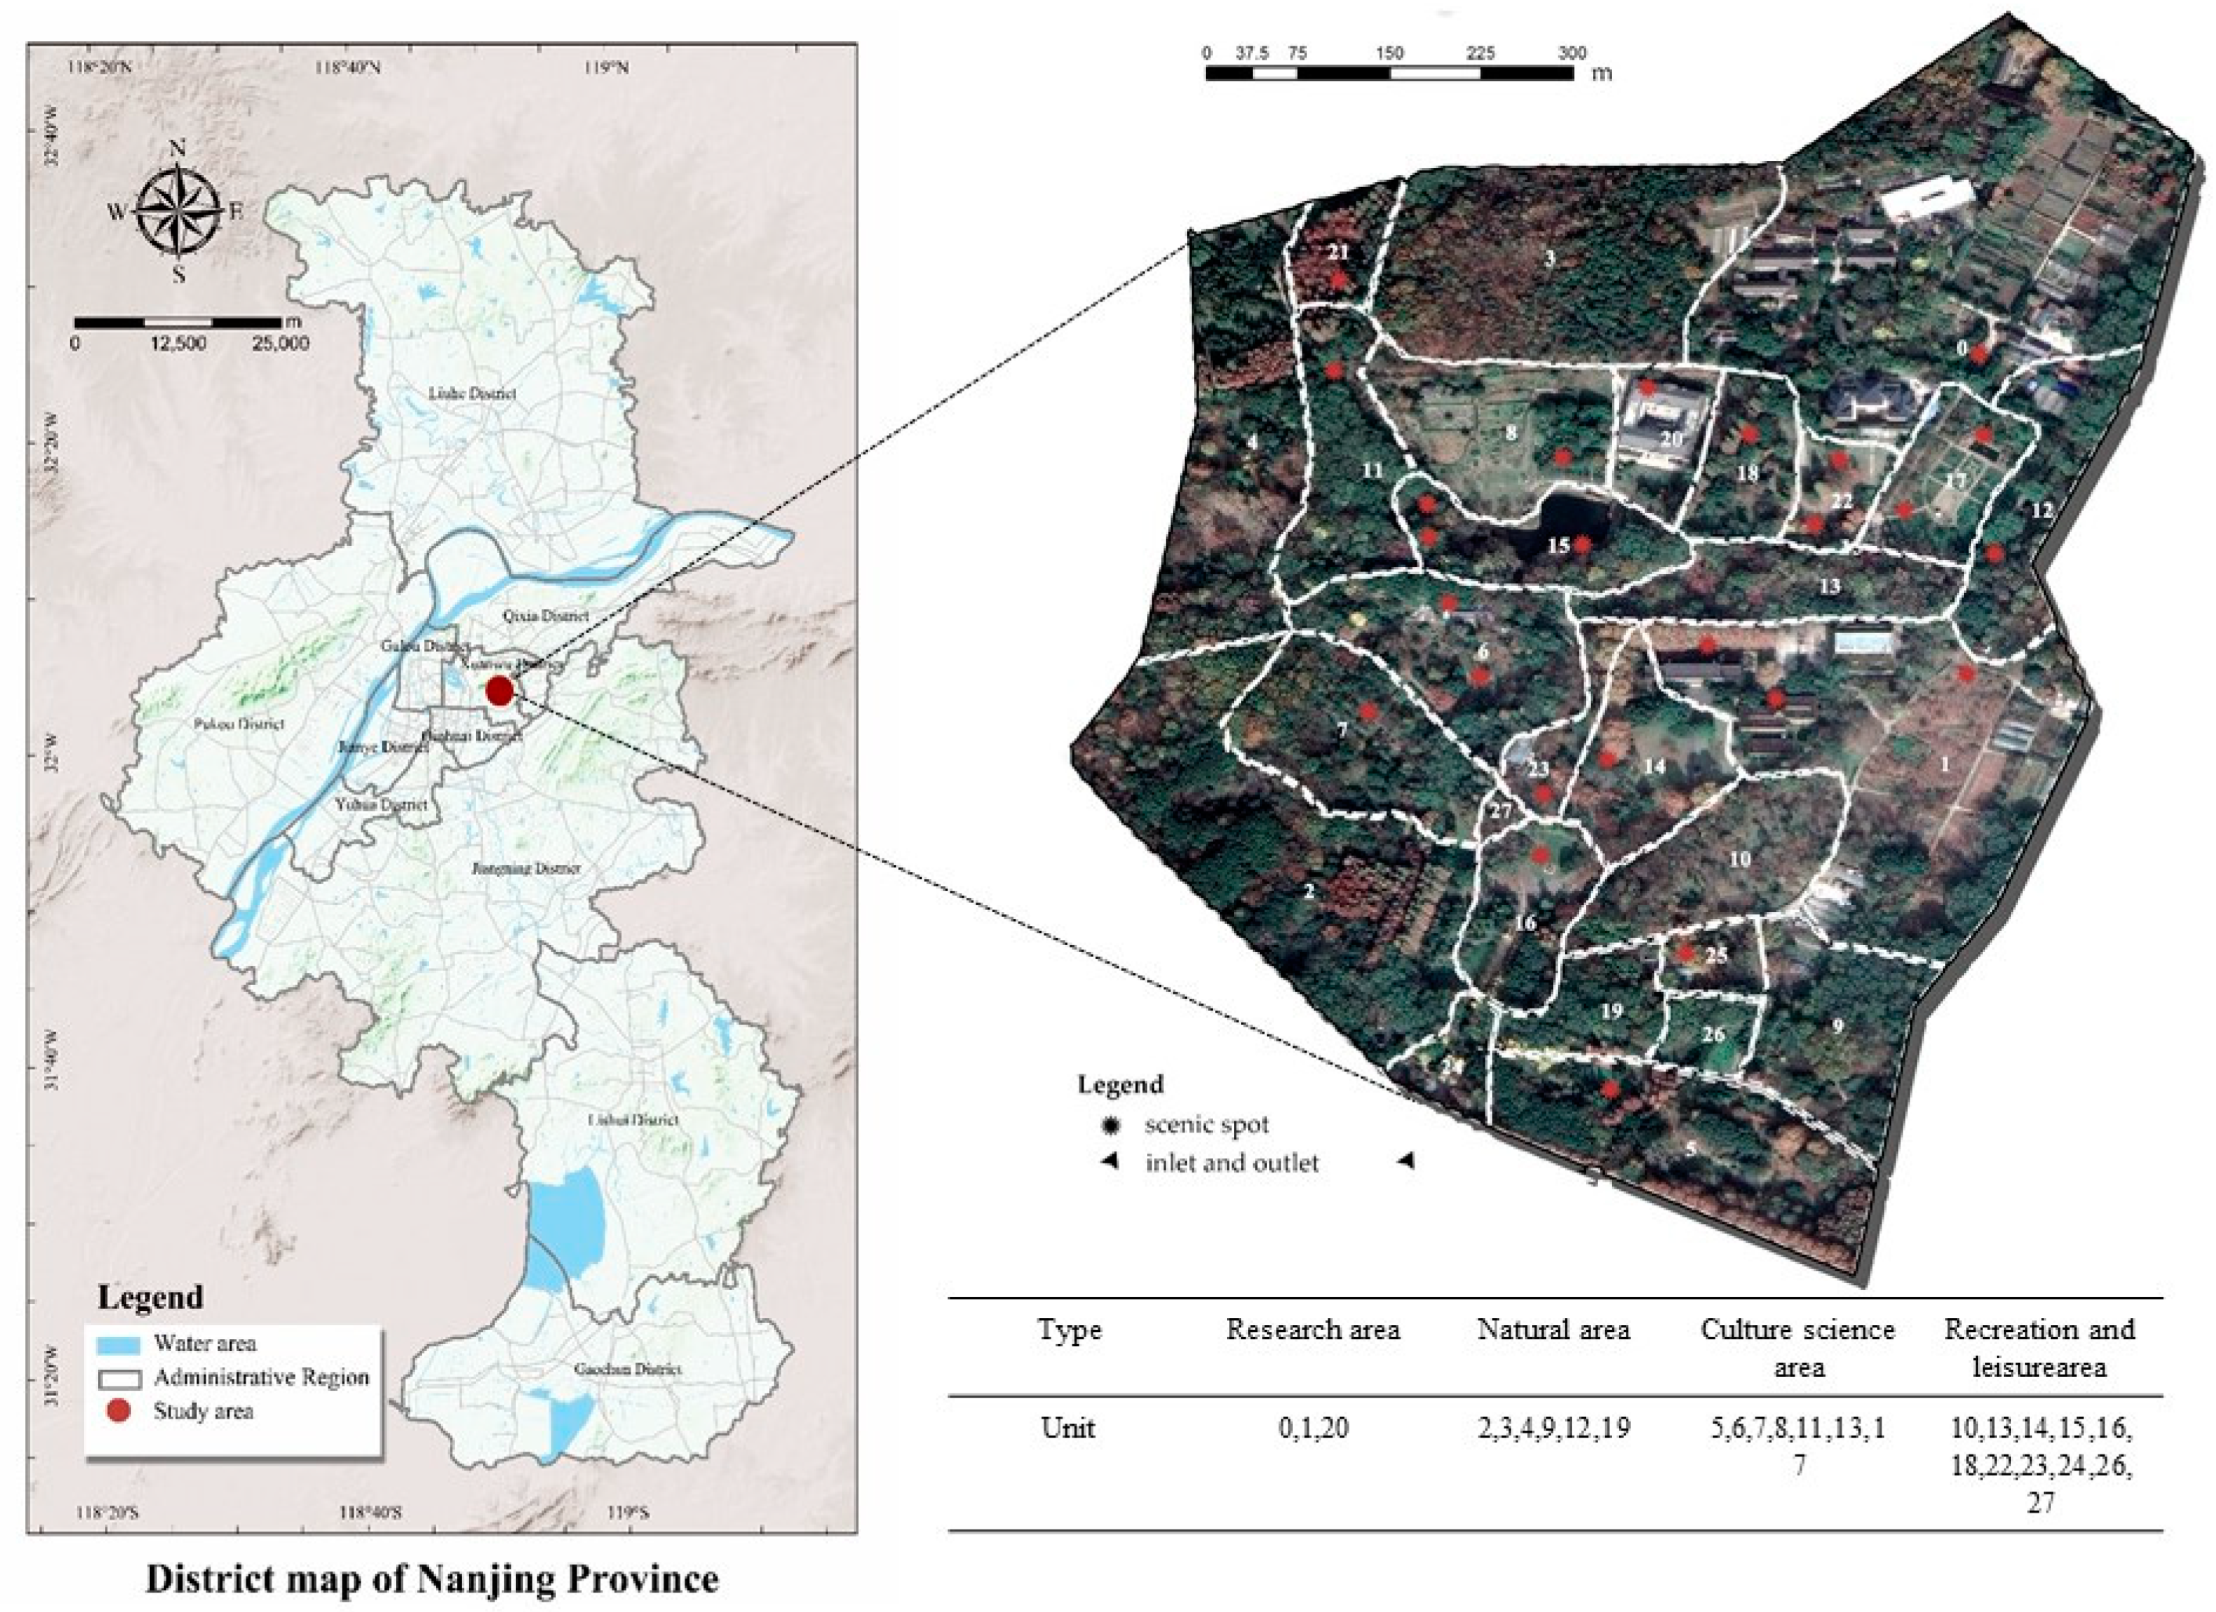
Founded in 1929, Nanjing Zhongshan Botanical Garden is located in Purple Mountain, Xuanwu District, Nanjing, also known as the Institute of Botany of the Chinese Academy of Sciences in Jiangsu Province (Figure 1). It is the first national botanical garden and one of four major botanical gardens in China [15]. Zhongshan Botanical Garden is the “National youth science and technology education base,” “national science education base,” is a collection of plant resources protection, botanical garden construction, and natural science education, one of the comprehensive public welfare institutions.
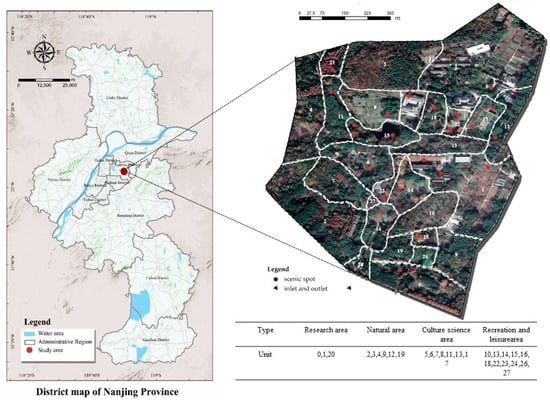
Figure 1.
Location and zoning of the study area.
Zhongshan Botanical Garden is also one of the 48 scenic spots of Jinling. It is a scenic spot with beautiful scenery and environment in China, receiving more than 300,000 tourists from home and abroad every year. This garden not only hosts over 700,000 herbariums and cultivates over 3000 species of plants, but also bird species are abundant. The garden covers an area of 186 hectares, comprising two parts. The research area used for this study was the North Garden of the Zhongshan Botanical Garden located in Nanjing, China. The North Garden is older than the South Garden. Located in the Zhongshan scenic region of Nanjing’s Xuanwu District, the botanical garden faces a mountain and a lake adjacent to the ancient city wall. In addition, this botanical garden is surrounded by universities and residences. Hence the tourists are expected to be diverse. Therefore, the research results should show clear patterns.
2.2. Data Source
A field survey was conducted, and we designed a questionnaire that would accompany the research team’s handheld GPS devices. Then, the research team surveyed travelers four times a month (including weekdays and weekends, when the weather is cloudy and sunny) from 3 February to 3 April 2019 in the Zhongshan Botanical Garden. Handheld GPS and matching questionnaires were used to obtain tourists’ spatial and temporal behavior data with personal attributes. To ensure the sample’s representativeness, researchers should not choose the respondents subjectively; therefore, the researchers in the study were instructed to go to the garden’s gate with a ready GPS device and questionnaire to find willing tourists. Volunteers were asked to bring a GPS device to the entrance to the north side of the botanical garden, return it at the end of the tour, and then complete their questionnaire. A supported GPS device recorded all participants’ temporal and spatial paths. The handheld GPS handsets (China, Victory Technology Co., Ltd.) used in this survey had a horizontal positional accuracy of 2.5 m for 95% of the tracking points. They were updated at a one-second interval, monitoring the tourist’s accurate time and location. A total of 220 sets of GPS and questionnaire data were obtained. After deviations were corrected and data format converted, the trajectories were loaded in ArcGIS Pro to generate the spatial distribution of 220 tourists’ trajectories in Zhongshan Botanical Garden.
2.3. Methods
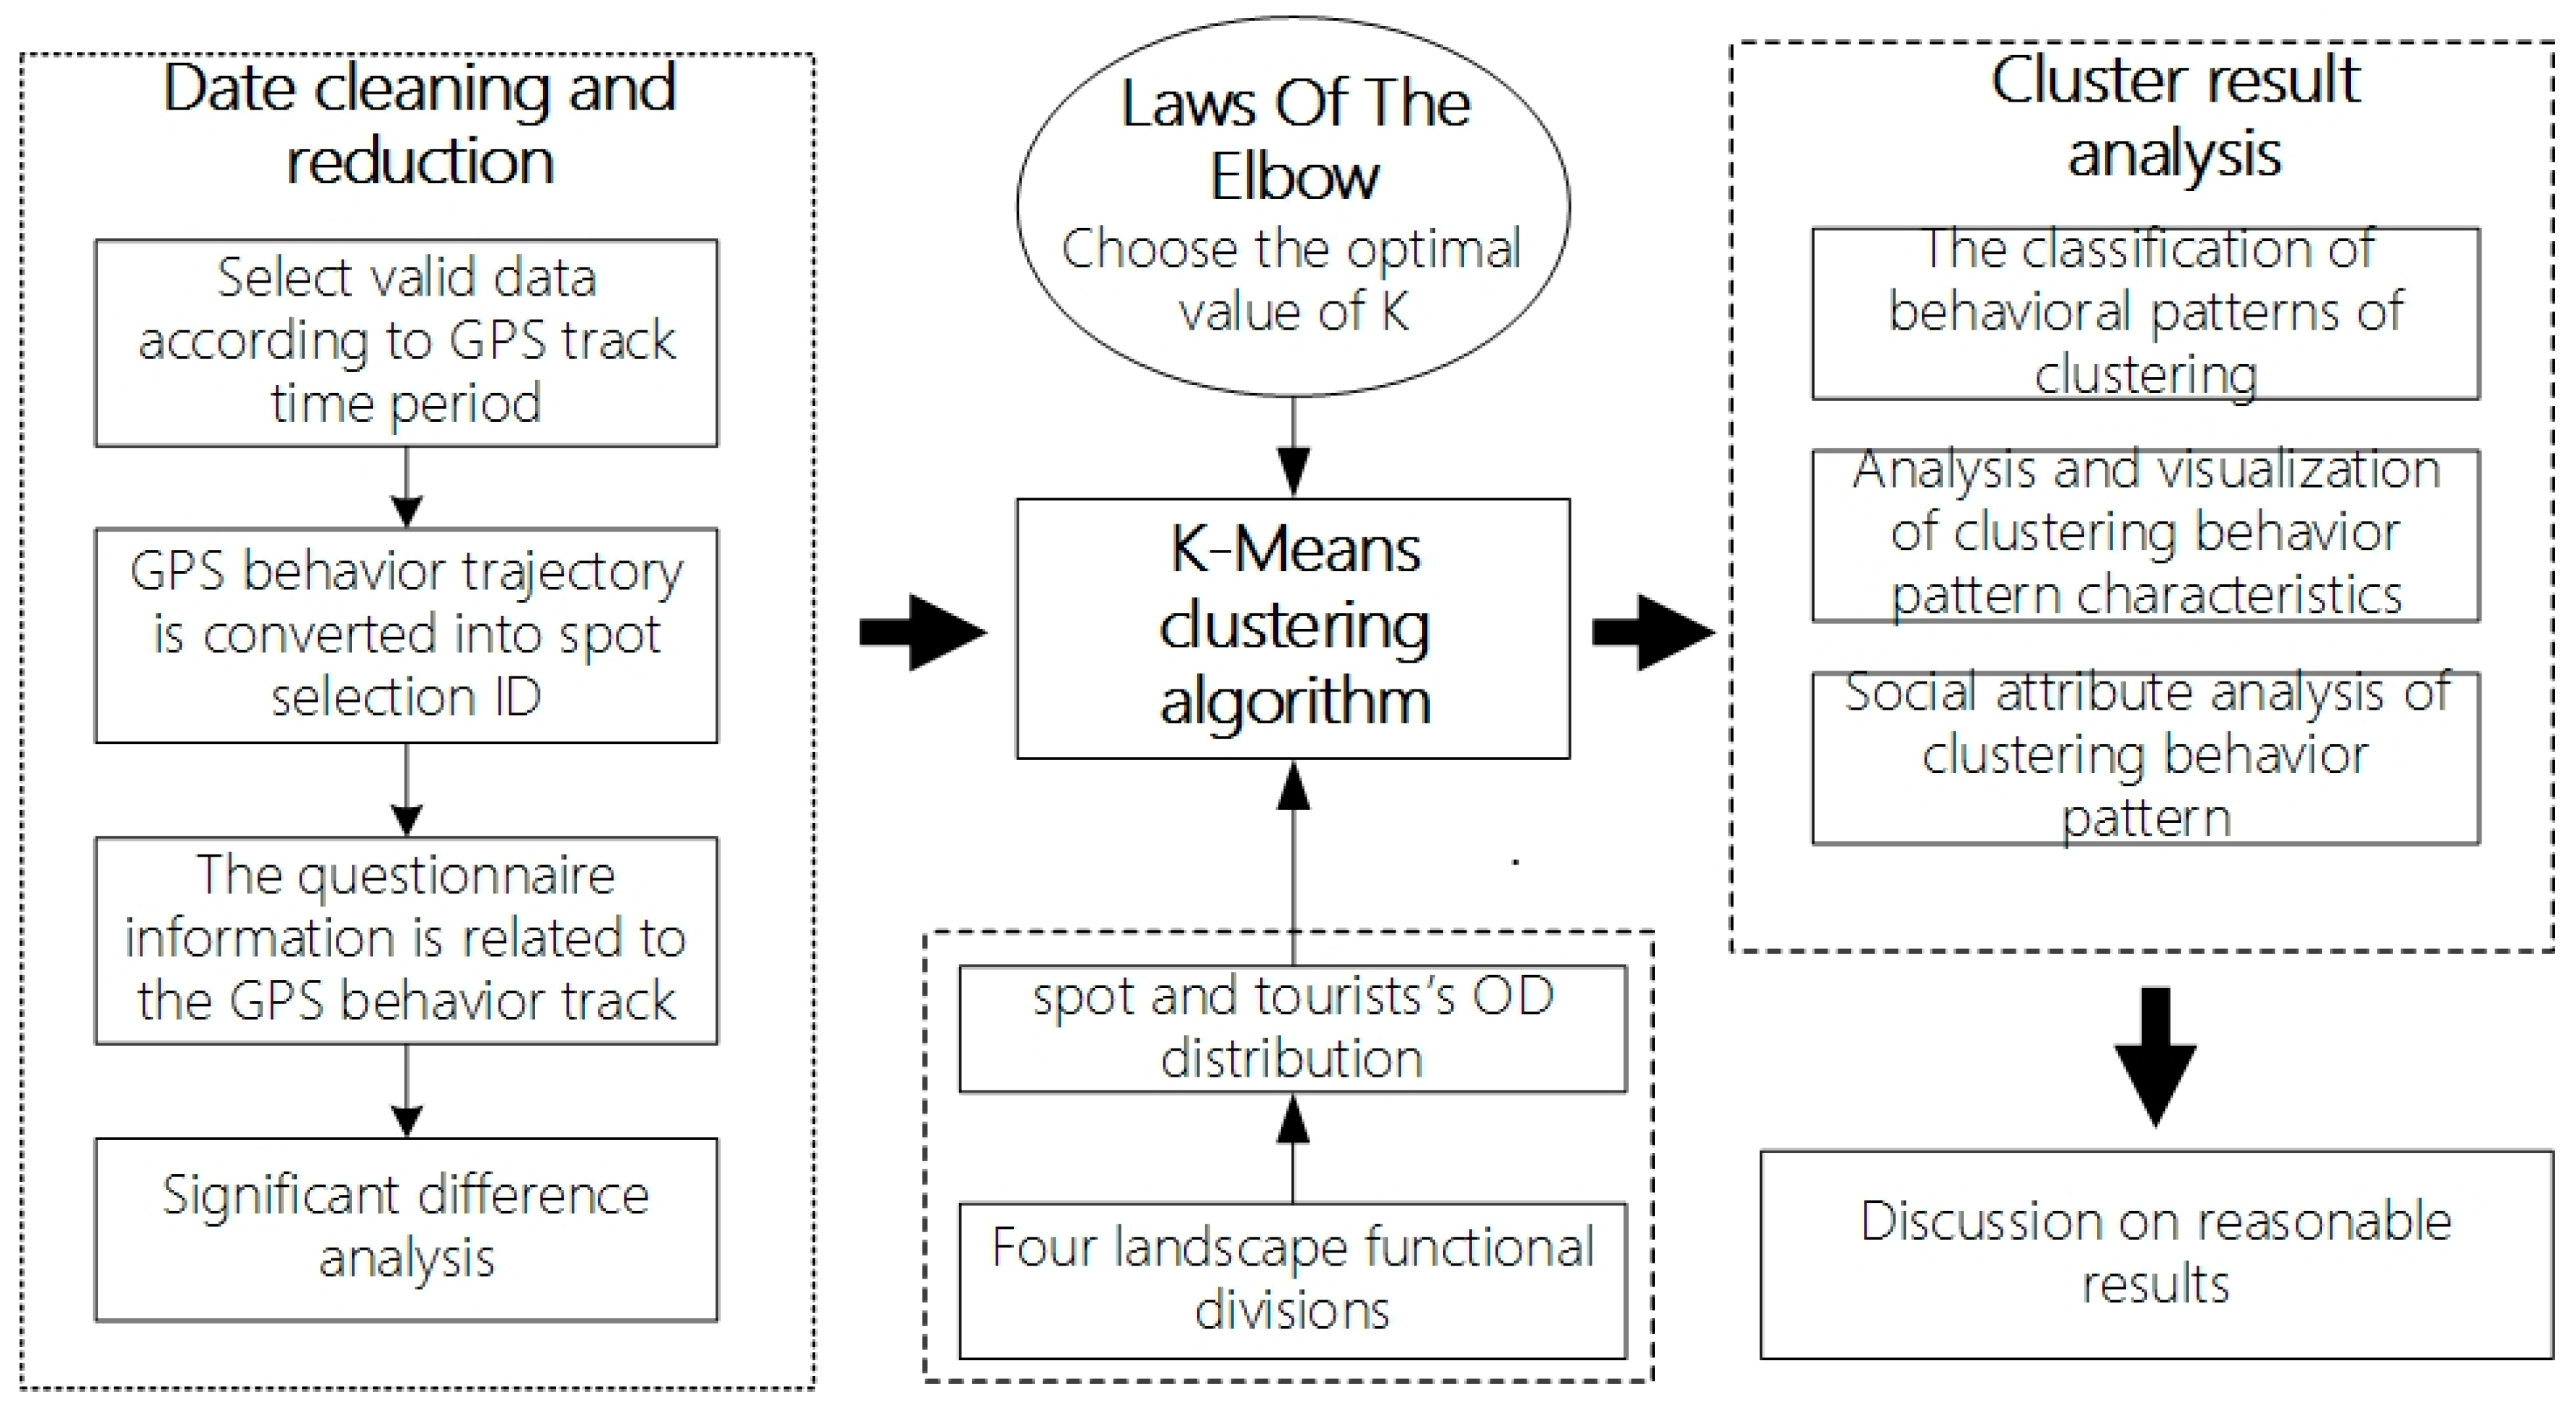
Figure 2 shows the framework of this study. The first step was the field investigation and analysis of the study area, which helped with the questionnaire design. According to the garden’s layout and local themes, we divided the North Garden into 28 units of scenic spots under four scenic zones; namely, the scientific research zone, the natural reserves zone, the culture and education zone, and the recreation and leisure zone (Figure 1). Next, we handed out GPS devices along with the questionnaires. We then extracted tourists’ movement trajectories and used the method of cluster analysis. Considering the existing feature zones of the botanical garden (study area), we classified tourists’ spatial–temporal behavior patterns in our final step. Specifically, (1) we extracted the effective movement trajectories based on the GPS recording time and labeled the scenic areas with ID tags. (2) We selected the optimal K value using the SSE method. We conducted K-means cluster analysis combined with the unit map and origin and destination (OD) distribution map of the divided scenic spots to classify tourists’ spatial–temporal behavior patterns and extract typical behavior types for visual analysis. (3) Based on the above analysis results, we provided reasonable suggestions for the construction strategy of the smart scenic spot.
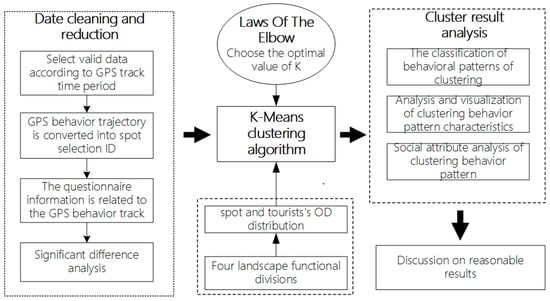
Figure 2.
Framework for the study.
2.3.1. The OD Analysis of Tourist Spatial–Temporal Behavior Chain
In the process of visiting, tourists have stay behaviors in different spaces. The stay behaviors have a certain frequency and sequence relationship, called “behavior chain.” Firstly, the serial number information of all the spatial units of tourists’ stay behavior is counted, forming the behavior chain. Secondly, each behavior chains’ departure space unit and arrival space unit are screened out from all samples’ behavior chains. Finally, the frequency of each OD selection is counted, and the OD chart is visualized. OD (origin-destination) chart is also called OD traffic volume survey; OD chart refers to the amount of traffic between the starting and ending points [16]. “O” indicates the starting place of the line and “D” indicates the line’s destination.
2.3.2. Tourist Spatial–Temporal Behavior Pattern Clustering
The clustering algorithm has been applied in many fields and has penetrated the area of tourist behavior in scenic spots [17,18,19,20]. The most widely used and relatively simple clustering method is K-means clustering. K-means clustering was first proposed by Lloyd in 1957 and was fully described and applied in research by MacQueen in 1967. Minimizing the error function aims to divide the original dataset into several clusters and calculate similarity (i.e., distance) between variables [21]. We divided the original data into a predetermined number (K) of clusters in the K-means clustering analysis. Variables of high similarity would be in the same cluster, and those of low similarity would be in different clusters. To avoid a randomly determined K leading to an optimal local solution, a K-means clustering algorithm with an SSE method (i.e., the elbow method) was used to predetermine the optimal number of clusters.
To obtain the optimal K, it was first assumed that k belonged to a set [1, M]. Next, the SSE of the data was calculated (a total of M numbers). Finally, a k-SSE curve was plotted. The SSE method equation is shown in Equation (1).
where Ci represents cluster i; p is a sample point in cluster Ci; and mi is the cluster’s centroid, the mean of all the samples in Ci. SSE is the clustering error for all the samples, which represents the accuracy of the clustering effect.
As the number of clusters, K, increases, the similarity of each cluster gradually increases, and the mean square of error and SSE decrease progressively. When K is smaller than the optimal number of clusters, K, K will increase the degree of similarity of each cluster. Therefore, the decrease in the SSE will be large. When K reaches the optimal number of clusters (i.e., k = K), the similarity of clusters obtained by increasing K will decrease rapidly. Therefore, the decrease in the SSE will slow down. As the value of K continues to grow, the curve is flat. In an elbow-shaped curve, the relationship between the SSE and K can be described. The K value at the turning point is the optimal number, K, of clusters.
After K was determined, we randomly selected data of K tourists from the 225 valid tourist data sets as the initial cluster centers. Then, SPSS software was used to calculate the clustering results. The calculation process is as follows: the distance between each tourist’s data and each cluster center was calculated, and the data of each tourist were allocated to the nearest cluster center. Subsequently, data of all tourists in each cluster were averaged, and the mean value became the new cluster center and was used to calculate the values of the standard measure function. The mean square error was generally adopted as the standard measure function [22]. The steps of allocation of tourist data to clusters and calculating new cluster centers were repeated. Finally, the clustering results were output if the values of the cluster centers and aim functions remained unchanged.
3. Results
3.1. OD Analysis of Tourists’ Spatiotemporal Behavior
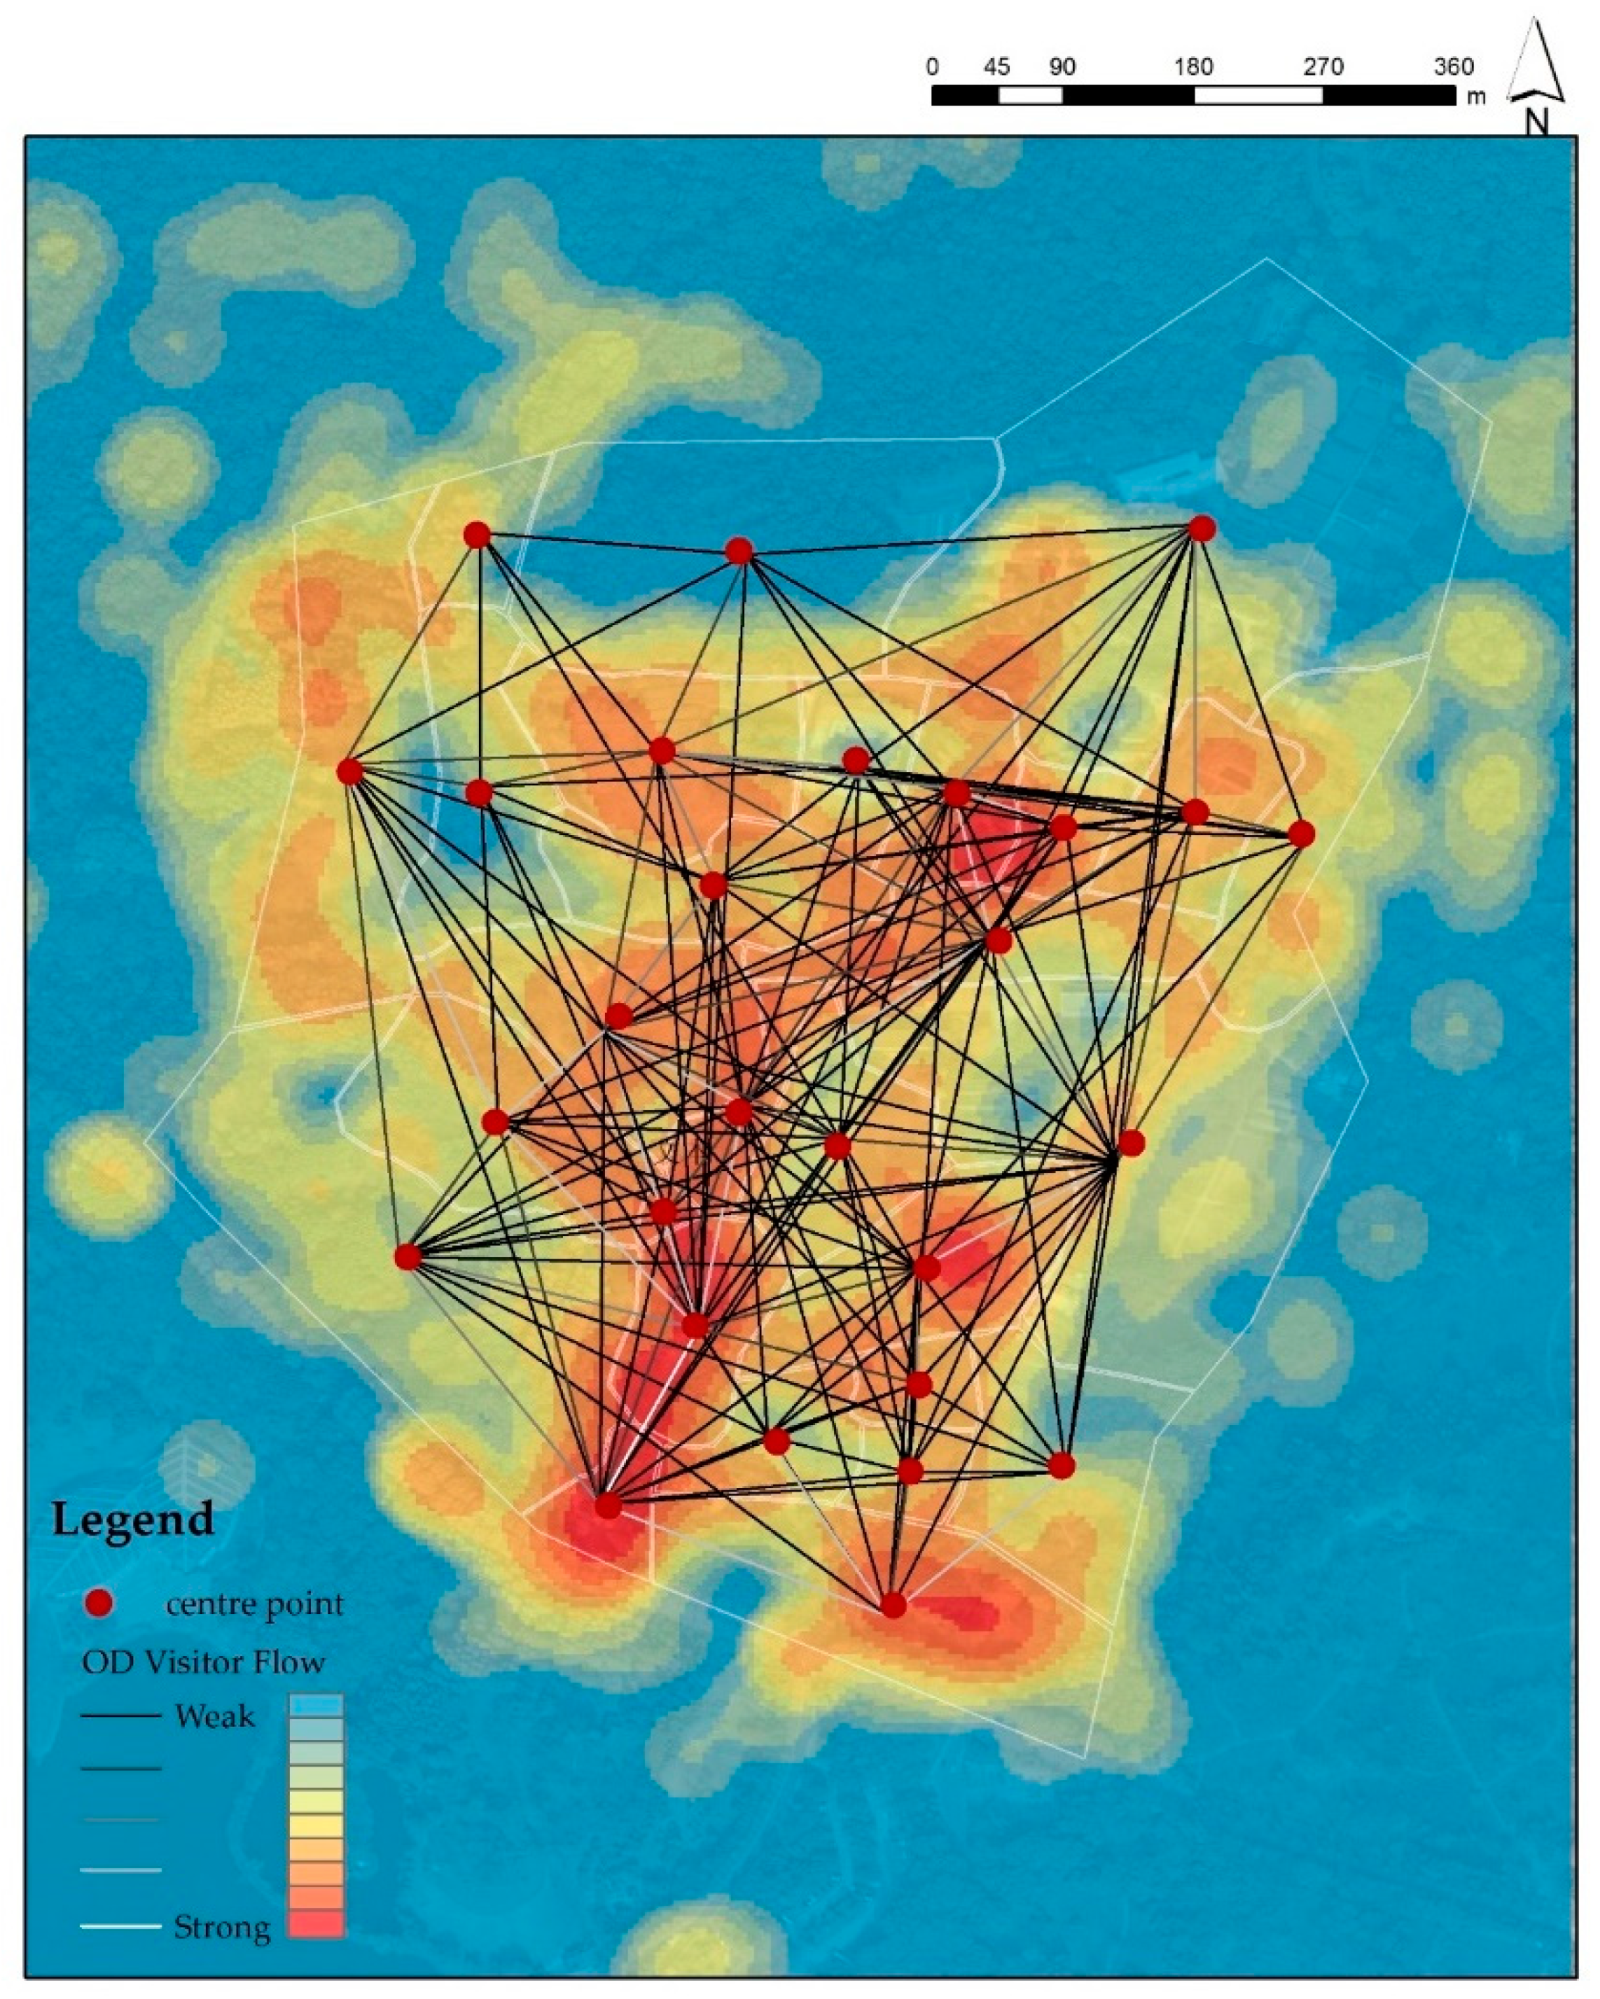
Figure 3 shows the OD map of the tourist movement trajectories. In Figure 3, the shade of the lines between two scenic units represents the degree of association between the scenic units. The lighter the color, the higher the association between the scenic units. In addition, the heat map color of red to blue shows the cumulative stop frequency of the tourists. A darker red color indicates that tourists more frequently stop there. The OD map shows that tourists were concentrated around the Sculpture of Sun Yat-sen and its surroundings, such as the System Garden and the Crepe Myrtle Garden.
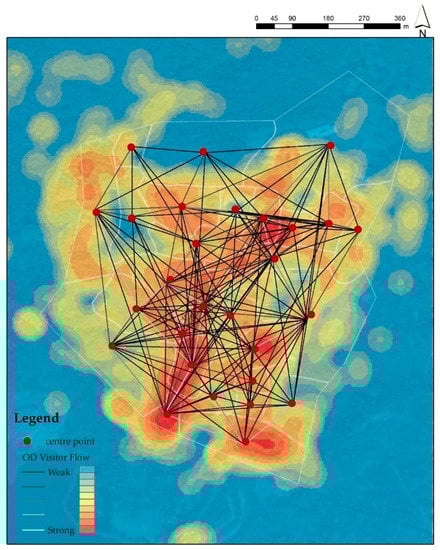
Figure 3.
Tourists OD figure.
It can be seen from the overall OD map that units 2, 3, 14, and 27 were a few of the more remote locations. The common feature of these scenic spots is a relatively low tourist rate. A statistical analysis of the GPS tracking data was conducted to evaluate the scenic units (Table 1). Scenic units with an F < 2 and p > 0.05 were removed, and the representative tourist movement trajectories were finally obtained. These scenic spots would cause no obvious differences in clustering elements and interfere with the clustering of spatial–temporal behavior patterns. Therefore, it was necessary to remove these interfering elements. Combined with statistical analysis and OD map visualization results, it was found that the results were consistent. Finally, four spatial units, namely 2, 3, 14, and 27, were deleted, and 24 spatial units were retained.

Table 1.
The difference analysis of the 28 scenic units.
3.2. Spatial–Temporal Behavior Patterns
Before conducting the cluster analysis, the number of clusters was determined by plotting K against SSE. As Figure 4 shows, the turning point is K = 3. When K < 3, there is a rapid downward trend, and when K > 3, the curve tends to be flat. Therefore, the optimal number of clusters was determined to be 3.
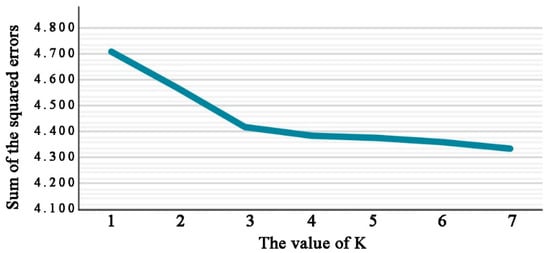
Figure 4.
The K- SSE (sum of the squared errors) curve.
The spatial–temporal behavior patterns of tourists were grouped into a single type and a mixed type. Tourists of the single type choose the same type of scenic spots, while tourists of the composite type choose two or more scenic spots during their visit. Because there were 28 scenic units, there were theoretically 15 combinations. From the SSE method, the optimal clustering number was determined to be 3. Therefore, the K-means algorithm was used to cluster three spatial–temporal behavior patterns. Then, the three scenic spot units with the highest probabilities were selected from all the various spatial–temporal behavior patterns as effective sample behavior data types. We combined these with the information obtained from the questionnaire. Therefore, three tour patterns of the tourists were obtained, namely recreation and leisure, birdwatching and photography, and learning and education. The specific characteristics of these three tour patterns are given in Table 2.
Table 2.
Three tour patterns and the visitation probabilities.
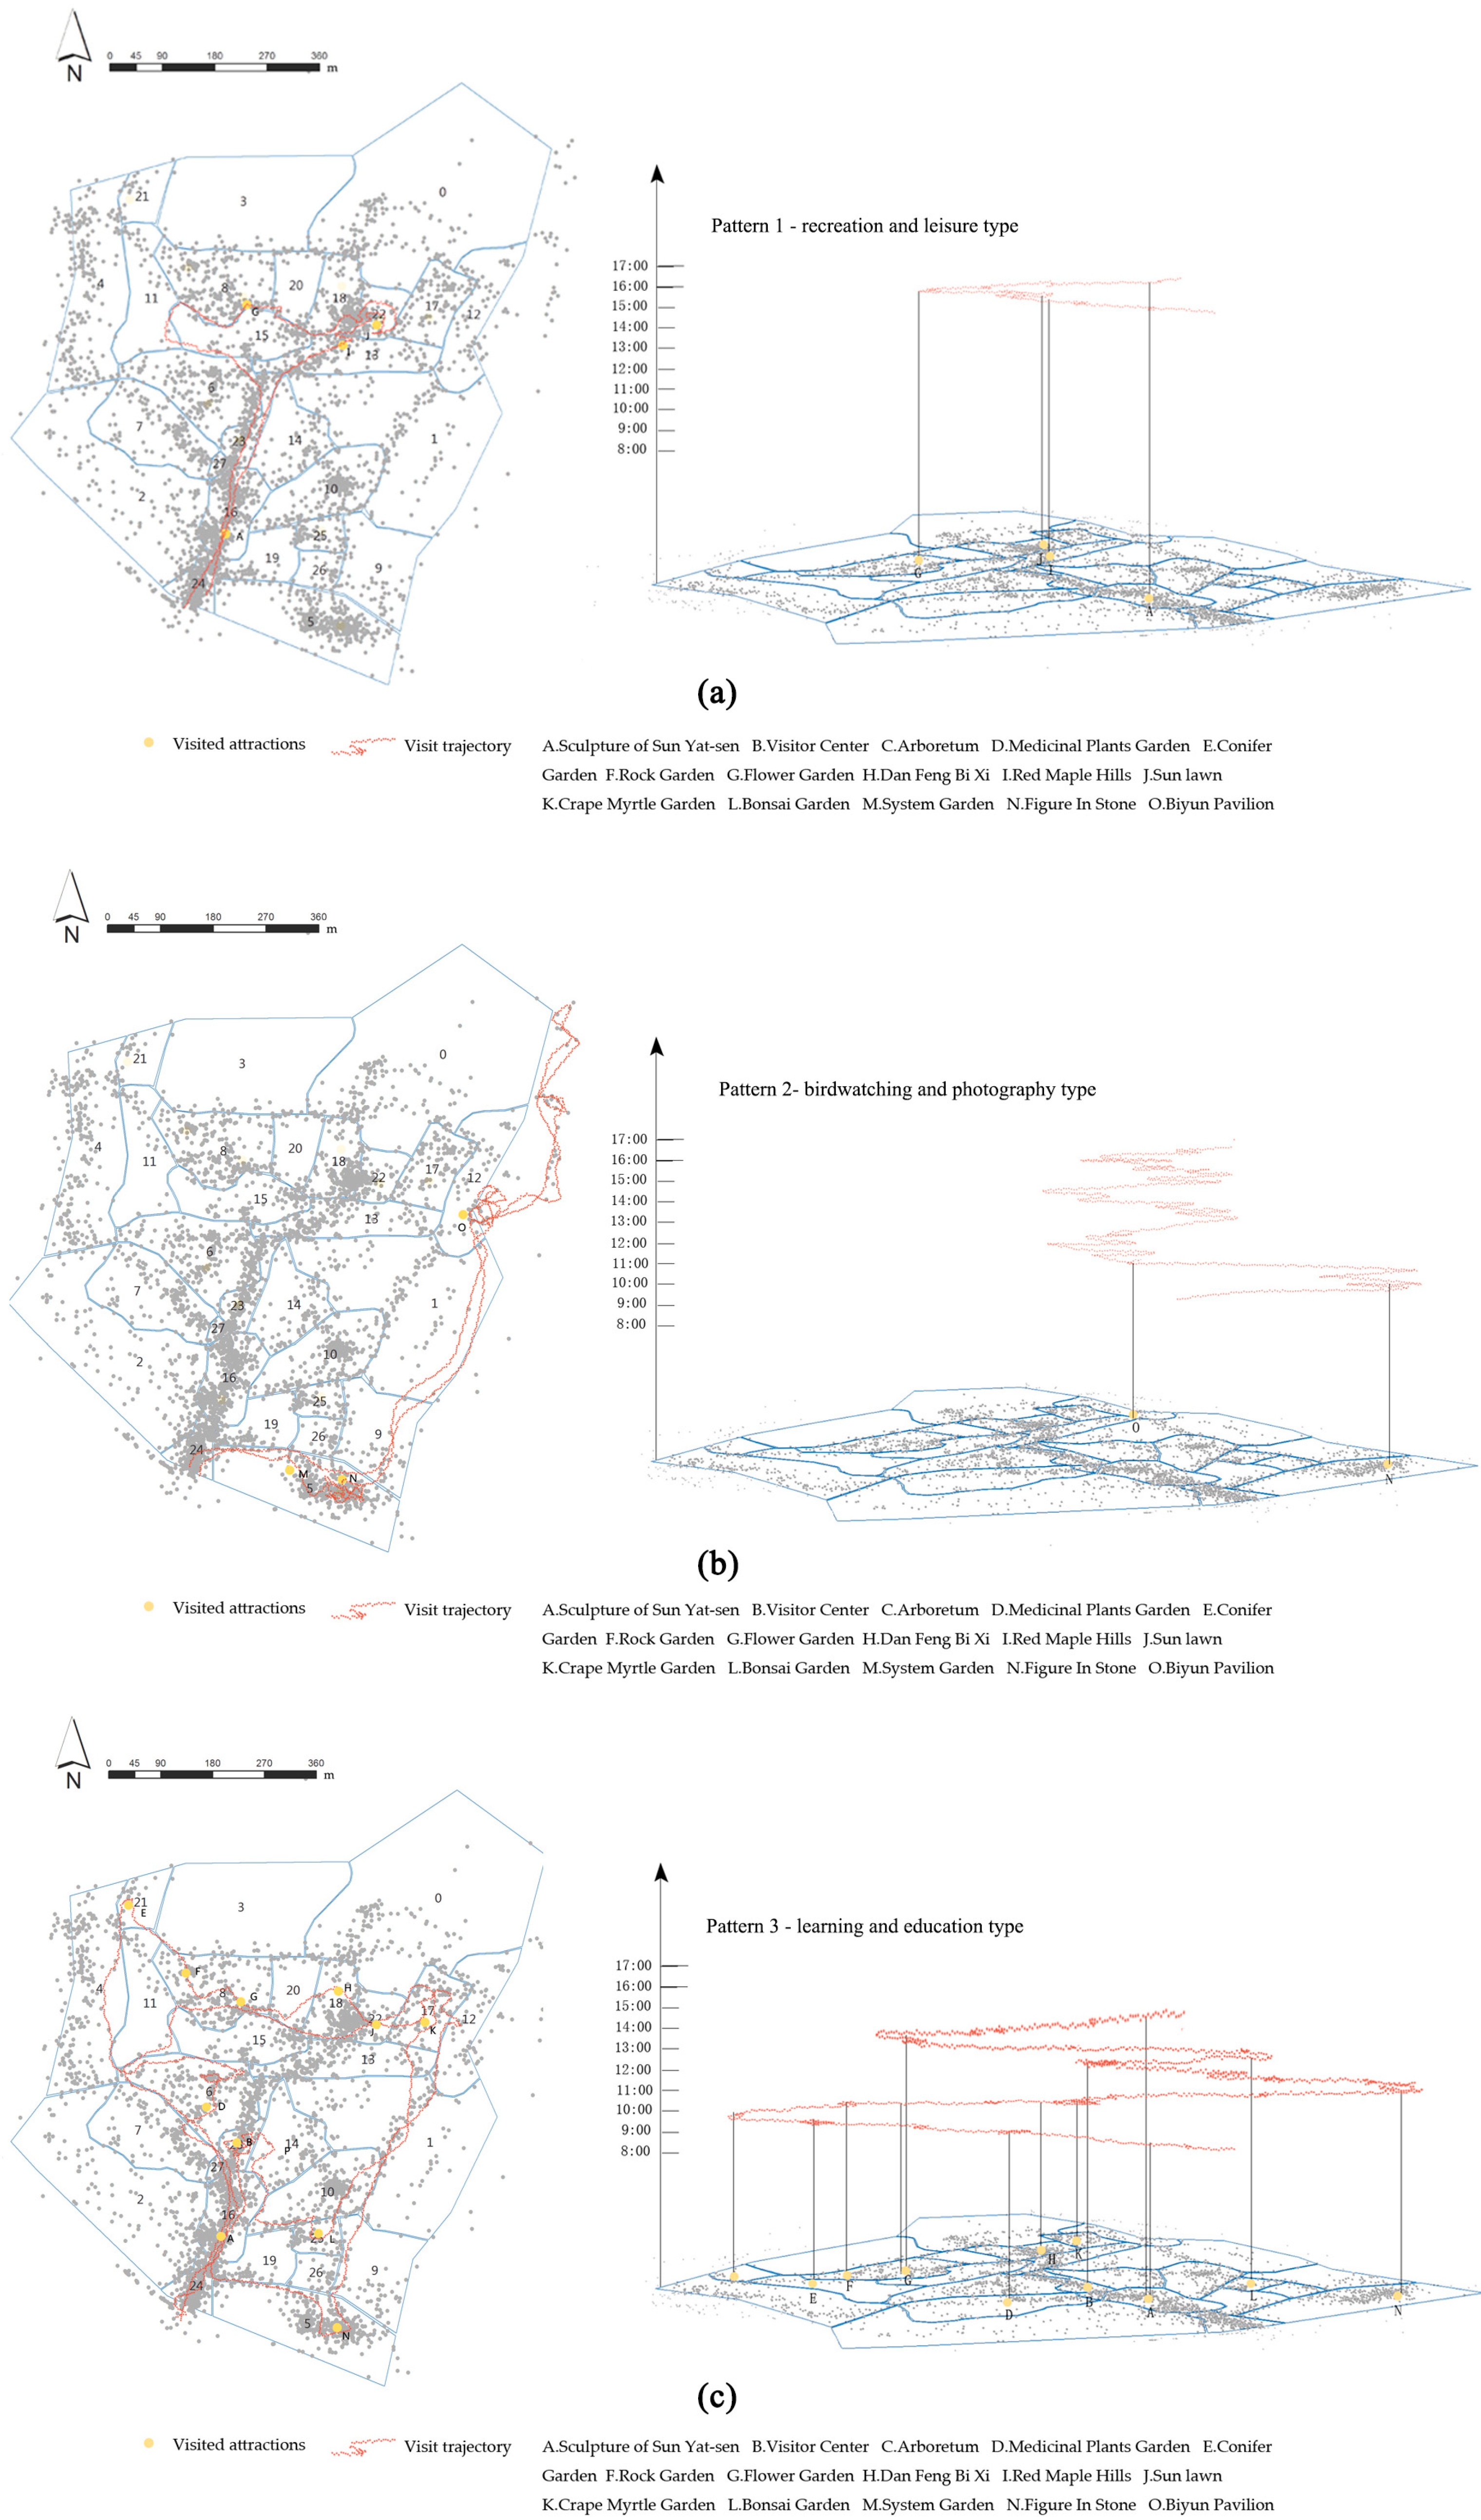
For the recreation and leisure tour pattern (type 1, Table 2), the probability of visiting units 16, 18, and 10 was 64%, 43%, and 26%, respectively. The landscape functions of these three scenic units were all recreation and leisure. Unit 16 is a major attraction around the Sculpture of Sun Yat-sen, and unit 18 is a sunny lawn, which is the only area that tourists can feed the pigeons. As the GPS tracking results show (Figure 5a), a typical tourist of this pattern started from the entrance of the North Garden at approximately 2:40 p.m., passed the Sculpture of Sun Yat-sen, and stopped at Hongfenggang for 10 min. The tourist then walked through the Crepe Myrtle Garden, arriving at the sunshine lawn at 15:20 and staying for 40 min. The tourist then walked through the Flower Garden and finally returned to the north gate of the garden along the main road.
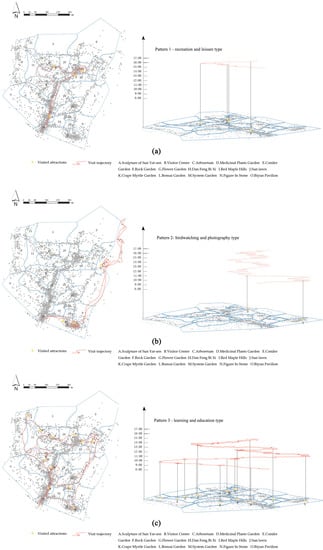
Figure 5.
Three types of tourist spatial–temporal behavior patterns (typical sample): (a) pattern 1 (recreation and leisure); (b) pattern 2 (birdwatching and photography); (c) pattern 3 (learning and education).
Most tourists chose units 5, 6, and 9 for the birdwatching and photography tour pattern (type 2, Table 2). The probability of selecting unit 5 (the System Garden) was as high as 80%. According to the questionnaire and interview, there are as many as 300 different types of birds in the botanical garden, especially the precious red-billed blue magpie in the System Garden, so there are often birdwatching groups irregularly carrying out activities. The probability of choosing units 12, 1, and 0 (in the scientific research zone) was 54%, 37%, and 36%, respectively. Because these two units are close to the Ming-Xiaoling Wall, many tourists take pictures in winter. Compared with the other two tour patterns, the tourists in this tour pattern had a higher preference for natural reserves areas and areas with tall plants. As the GPS tracking results show (Figure 5b), a typical tourist of this pattern entered the North Garden at 9:10 in the morning, passed through the System Garden to reach the Sculpture of Sun Yat-sen, and stayed for two hours. Then, the tourist walked through the Bonsai Garden and the Biyun pavilion to the well on the west outside the palace gate. The typical tourist stayed near the wall for 3.5 h and left at 5:05 p.m.
The tourists chose a wide range of scenic spots for the learning and education tour pattern (type 3, Table 2). The probability of selecting unit 16 was 73%, and other scenic units’ possibilities were nearly even. Compared with the two different tour patterns, tourists of this pattern had relatively broad experience in the garden. They also spent the longest hours in the botanical garden. As the GPS tracking results show (Figure 5c), a typical tourist of this pattern entered the North Garden at 8:40 in the morning. He reached the Medicinal Plants Garden along the main road and stayed there for 15 min. The tourist then went through the Conifer and Flower Garden, and he reached the Crepe Myrtle Garden at 10:20 and stayed for 10 min. After a long walk, the typical tourist reached the Sculpture of Sun Yat-sen at 11:10. They visited the System Garden, Bonsai Garden in turn, and Crepe Myrtle Garden again. Finally, along with the Flower Garden and Sculpture of Sun Yat-sen, he walked back to the main gate at 14:30 and left the garden.
3.3. Differences in Tourist Spatial–Temporal Behavior Patterns
According to the questionnaire statistics, 119 male and 101 female tourists took part in the survey. As shown in Table 3, the overall ratio of males to females was 55:45. The male-to-female ratio of tour pattern 1 was nearly the same as the overall ratio and the smallest among the three. In patterns 1 and 3, there were more men than women. However, in tour pattern 2, there were more women than men, showing that women were more interested in science and education, while men preferred leisure and birdwatching-related attractions.
Table 3.
Social characteristics of the tourists in different patterns.
In terms of age, the ages of tourists in pattern 2 were primarily between 19 and 35 years old (accounted for 45.2%). In comparison, the ages of tourists in patterns 1 and 3 were primarily between 36 and 65 years old, accounting for 40.2%and 40.9%, respectively. Therefore, this indicates that young tourists preferred tour pattern 2, while middle-aged and older people preferred a walk or similar leisure time in the garden. Because most tourists under the age of 18 were accompanied by their parents, this data was biased and thus removed.
Regarding the frequency, most tourists were not regular tourists. The first-time tourists primarily chose pattern 1 (81.5%). Regular daily tourists may have been residents who lived nearby. They chose pattern 1, likely because they came to breathe fresh air and do some exercise (the botanical garden allows free admission before 8:30 a.m.). The proportion of first-time tourists in pattern 1 (18.5%) was higher than that in other patterns, which shows that first-time tourists only visited special gardens along the main road and had no interest in visiting the whole garden. According to the interview records, most first-time tourists were from out of the city or were students, and they found the garden lacking clear signs and attractive attractions. Pattern 1 was slightly more frequent than the other two patterns for tourists who come every day or once a month. The reason is attributable to middle-aged and older adults who exercise in the morning. Among the tourists who visit once a week, a relatively high proportion (7.1%) exhibited pattern 2, which can be understood as birdwatching photographers mostly focusing on personal or community activities on weekends.
Tourists to the botanical garden who choose patterns 1 and 3 were mostly retirees. In pattern 2, the proportion of employees from for-profit and nonprofit organizations is relatively high, showing that they are more inclined to favor specific activities and scenic spots. Pattern 2 had the highest average visit time (2.8 h) and pattern 1 had the lowest average visit time (1.03 h).
4. Discussion
4.1. Accurate Classification of Tourist Spatial–Temporal Behavior Patterns
Researchers seem to agree that studies of spatiotemporal behavior at the micro-scale are important for location data and the construction of “smart scenic spots.” Our study demonstrates the feasibility of combining multiple data sources to explore behavioral patterns. A single data source cannot record the spatial behaviors of tourists, and technology cannot replace the traditional questionnaire that reveals the social attributes of tourists. Millonig and Gartner compared the tracking and questionnaire methods and concluded that a combined approach was more likely to produce complete behavioral characteristics [23]. In one of the few studies on tourist spatial–temporal behavior patterns using GPS, Huang could not accurately distinguish the difference in tourists’ choices of scenic spots. However, he undertook a cluster analysis on the time dimension of tourist behaviors in the Ocean Park in Hong Kong [10]. In a previous study on the spatial–temporal behavior pattern of tourists, the value of K in the clustering algorithm relied on continuous attempts at solving the value of K [24]. Compared with the method, the combination of the SSE and K-means algorithm used in the present study can more accurately select the K value and classify tourist spatial–temporal behavior patterns. From the perspective of the tourist route (Figure 6), tourists in pattern 1 mostly travel along the main road. The tour routes of tourists in pattern 3 cover the whole garden, and occasionally there are high-density areas. This can be attributed to the fact that most tourists in pattern 3 visit for science education. The three tourist spatial–temporal behavior patterns are as follows:
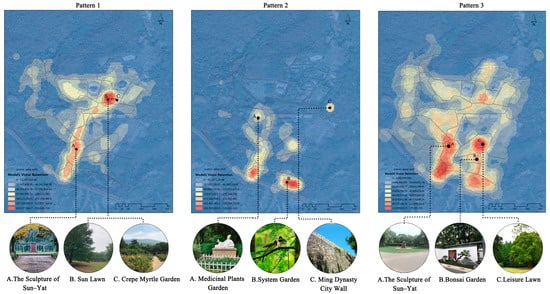
Figure 6.
Three behavioral patterns of spatial visualization.
Pattern 1: It can be seen from Figure 6 that the areas where tourists frequently stopped in pattern 1 were the statue of Sun Yat-sen, Sunshine lawn, and Rose Garden. Sun Yat-sen’s statue is an iconic destination in the scenic area so that most tourists will take photos there, and the Sunshine lawn is the only place in the garden to feed pigeons. Yao pointed out that human–human, human–animal, and human–plant interaction would make a flat site attractive and cohesive [25].
Pattern 2: The purpose of tourists in pattern 2 is to take photos of birds and the city walls. The mainstay spaces are the System Garden, Ming City Wall, and Bonsai Garden. In winter, Zhongshan Botanical Garden is free from the cold of the North and has numerous seeds, plants, and insects. It is a paradise for many types of birds.
Birdwatching, a long-standing pastime in Western countries [26], has become increasingly important in China in recent years as a new variant of nature tourism. Birding is also the epitome of ecotourism, as it is relatively unlikely to lead to negative environmental changes. Zhao classified birdwatching tourism and proposed birdwatching ecotourism strategies to cultivate the ecotourism market [27]. Liu even suggested that bird resources be utilized to build a birdwatching tourism platform to form a distinctive ecological birdwatching industry [28]. Furthermore, Zhongshan Botanical Garden is surrounded by the wall of the Ming dynasty, which is the longest, largest, and best-preserved ancient city wall in the world [29].
Pattern 3: The high stay area for tourists in pattern 3 is the statue of Sun Yat-sen, bonsai garden, and rest area. A bonsai garden is a form of the garden within a garden, which began to form in China in the 1960s. The art of bonsai can be traced back to the Eastern Han dynasty 1900 years ago [30]. It demonstrates traditional Chinese culture and aesthetics, and the garden combines landscape walls, pavilions, and corridors to construct a space with artistic appeals typically found in Chinese landscape paintings. The tourists in pattern 3 are mostly non-local tourists that choose the bonsai garden.
4.2. Strategies for Building Smart Scenic Spots
To help tourists travel through the scenic area and encourage a more even distribution of tourists, the garden can better serve tourists by establishing a guiding system (e.g., smart electronic maps and icons) that leads tourists where they might like to go. The GPS movement trajectories of tourists suggested that some were lost and trying to find their way back. Therefore, the scenic spots need to be made more identifiable. A similar study also indicated that tourists are more likely to use environments that they can easily navigate [31]. Additionally, the results showed that the garden’s vigor was not evenly distributed. Most tourists passed by them without stopping. The eastern and western parts of the garden had significantly fewer tourists. Therefore, the eastern and western parts of the garden need better attractions and better connections between the central area scenic spots with the periphery attractions. The botanical garden can provide tourists with a wide range of learning, entertainment, and fitness services.
The botanical garden can provide further differentiated services and management to enrich the experience of different visiting patterns. The differences and imbalances in the three existing spatial–temporal behavior patterns can offer references to formulating management strategies. By providing different tourism route planning to tourists of these three different patterns, space supply can be strengthened, and clear pattern selection also provides convenience to individuals. For example, for bird and photography pattern 2, Attract birders by provide ideal birding locations, birding devices, and electronic birdwatching. Sustainable development of the tourism industry for birds needs proper infrastructure and tourism activities for travelers to experience bird habitat for wild birds [14]. Studies have shown that novice birders and professional birders focus differently. Beginner birders concentrate on various activities at the site, while experienced birders frequently visit the site to track birds, and most stay overnight. As a result, well-designed birding trails can help experienced birders throughout the area. However, since birders’ skill levels are negatively correlated with their satisfaction with the plan [32], more professional birders are harder to please and require a well-designed plan. Previous studies have shown that birders are slightly older and more likely to be professional [33,34,35], highly educated, and have a higher household income than the general public. This is largely consistent with the results of this paper, except for the age of tourists regarding birding and photography. Therefore, as the visiting experience deepens their knowledge for different groups, the best strategy for experts to provide an enriching expertise may be an adaptive management approach.
In addition, holding cultural events can attract tourists to this study area [36]. As the results suggest, the learning and education tour pattern has a specific purpose, encouraging tourists to stay at a single spot for a long time. Tourists in the other two tour patterns did not last for long at any spots. Therefore, the potential of this attraction needs to be further explored. For example, cultural events can be held to attract additional tourists and meet different needs of tourists of different ages. Table 3 shows that young people and children usually are interested in cultural and educational events and hands-on activities. The elderly primarily experience the natural ecological environment, which leads to integrating the natural environment with the site space to produce more public facilities for recreation. Through the study of the correlation between the garden walking space and the walking behavior of the elderly, scholars concluded that a walking area with comfort, convenience, and a beautiful environment could promote the leisure walking activities of the elderly [37,38]. Exploring building a “smart scenic spot” centering on the interactive experience of tourists becomes possible [39].
4.3. Limitations and Future Research
This study has certain limitations that must be discussed. First, although GPS can accurately obtain tourists’ spatial and temporal tracks, some track segments are missing since there are many plants in botanical gardens, especially large trees, which interfere with the acquisition of GPS signals. Secondly, the collection of GPS data requires human and material resources. It must go through data cleaning and optimization, e.g., artificial track correction, so only a small amount of data can be processed. The format conversion and processing of the data can only be done manually. The job is so hard and time-consuming that it is hardly possible to deal with thousands of trajectories. This paper studies the relationship between the functional landscape space of the botanical garden and the spatial–temporal behavior pattern of tourists, paying attention to the common characteristics of tourists’ spatiotemporal behavior. In future research, in-depth research should be conducted on the individual spatiotemporal behavior and spatial interaction experience of different types of tourists, to provide technical support for the planning and management of smart scenic spots, especially tourist routes, and the smart guidance systems.
5. Conclusions
In this paper, a research method with tourist spatial–temporal behavior patterns as the core was proposed to promote the planning and management of smart scenic spots by creating an enhanced destination experience. Taking the Zhongshan Botanical Garden as the research object, this paper integrated multi-source data, including a questionnaire survey of tourists’ movement trajectories and social characteristics obtained by handheld GPS devices. Using the optimized clustering analysis method, cluster analysis was carried out on the tour itinerary of tourists in the scenic area. The spatial–temporal behavior pattern of tourists was obtained. The main conclusions are as follows. Based on GPS tracking and questionnaire data, the combination of the K-means clustering algorithm and SSE can effectively identify tourist spatial–temporal behavior patterns. The spatial–temporal behavior patterns of tourists in botanical gardens can be divided into three types: recreation, birdwatching and photography, and learning. There are obvious differences in their preferences and social attributes.
Based on the more accurate analysis of the spatiotemporal behavior information of individual tourists, it can provide direction for the future planning and upgrading of smart scenic spots and real-time support for the management and operation of smart scenic spots. For example, tourists can get targeted services based on their preferences, and scenic area managers can also effectively segment the market based on tourist information (such as primary and professional birdwatching groups) to control and guide the flow of tourists to reduce traffic congestion. Smart scenic spots worldwide are looking for feasible plans, but the complexity makes technology and service innovation extremely difficult. This study may provide a sufficient basis for the practice of smart scenic spots.
Author Contributions
Conceptualization, methodology, and writing—original draft preparation, J.Z.; data curation and software X.B.; visualization, L.N.; supervision, H.W. All authors have read and agreed to the published version of the manuscript.
Funding
This research was funded by the National Key R&D Program of China (No. 2019YFD1100404).
Informed Consent Statement
Informed consent was obtained from all subjects involved in the study.
Data Availability Statement
The data presented in this study are available on request from the author. The data are not publicly available due to privacy. Images employed for the study will be available online for readers.
Acknowledgments
We would like to thank the management department of the Zhongshan Botanical Garden for giving us their permission to do this research. We would also like to thank X. B., L.S. for assistance during data collection and to thank H. W. for writing suggestions.
Conflicts of Interest
The authors declare no conflict of interest.
References
- Gretzel, U.; Sigala, M.; Xiang, Z.; Koo, C. Smart tourism: Foundations and developments. Electron. Mark. 2015, 25, 179–188. [Google Scholar] [CrossRef] [Green Version]
- Hunter, W.C.; Chung, N.; Gretzel, U.; Koo, C. Constructivist research in smart tourism. Asia Pac. J. Inf. Syst. 2015, 25, 105–120. [Google Scholar] [CrossRef]
- Buhalis, D.; Amaranggana, A. Smart Tourism Destinations: Enhancing Tourism Experience through Personalisation of Services. In Information and Communication Technologies in Tourism; Tussyadiah, I., Inversini, A., Eds.; Springer: Cham, Switzerland, 2015. [Google Scholar]
- Huang, W.; Zhang, Y.; Wu, M.; Dang, A. Research on tourist behavior of smart Scenic Spot based on wifi location: A case study of Huangshan Scenic Area. Chin. Landsc. Archit. 2018, 34, 7. [Google Scholar]
- Dang, A.; Zhang, D.; Ma, Q.; Li, J. Discussion on management and service of smart scenic spots in the era of big data. J. West. Hum. Settl. Environ. 2016, 31, 6. [Google Scholar]
- Huang, H.; Gartner, G.; Krisp, J.M.; Raubal, M.; Van de Weghe, N. Location based services: Ongoing evolution and research agenda. J. Locat. Based Serv. 2018, 12, 63–93. (In Chinese) [Google Scholar] [CrossRef]
- Yao, X.; Jiang, B.; Liu, Y.; Madden, M. New insights gained from location-based social media data. Comput. Environ. Urban Syst. 2016, 58, 256–268. [Google Scholar]
- Shoval, N.; Auslander, G.; Cohen-shalom, K. What can we learn about the mobility of the elderly in the GPS era? J. Transp. Geogr. 2010, 18, 603–612. [Google Scholar] [CrossRef]
- Shoval, N.; Isaacson, M. Sequence Alignment as a Method for Human Activity Analysis in Space and Time. Ann. Assoc. Am. Geogr. 2007, 97, 282–297. [Google Scholar] [CrossRef]
- Huang, X. A study on temporal-spatial behavior pattern of tourists based on time-geography science—A case study of Summer Palace, Beijing. Tour. Trib. 2009, 24, 82–87. [Google Scholar]
- Chin, K.; Huang, H.; Horn, C.; Kasanicky, I.; Weibel, R. Inferring fine-grained transport modes from mobile phone cellular signaling data. Comput. Environ. Urban Syst. 2019, 77, 101348. [Google Scholar] [CrossRef]
- Hh, A.; Xay, B.; Jmk, C.; Bj, D. Analytics of location-based big data for smart cities: Opportunities, challenges, and future directions-sciencedirect. Comput. Environ. Urban Syst. 2021, 90, 101712. [Google Scholar]
- Taczanowska, K.; Muhar, A.; Brandenburg, C. Potential and limitations of GPS tracking for monitoring spatial and temporal aspects of visitor behaviour inrecreational areas. In Management for Protection and Sustainable Development, Proceedings of the The Fourth International Conference on Monitoring and Management of Visitor Flows in Recreational and Protected Areas, Montecatini Terme, Italy, 14–19 October 2008; IGP Industrie Grafiche Pacini: Ospedaletto, Italy, 2008; Volume 14, pp. 451–455. [Google Scholar]
- Steven, R.; Morrison, C.; Castley, J.G. Birdwatching and a vitourism: A global review of research into its participant markets, distribution and impacts, highlighting future research priorities to inform sustainable a vitourism management. J. Sustain. Tour. 2015, 23, 1257–1276. [Google Scholar] [CrossRef] [Green Version]
- Sheng, C. Nanjing Zhongshan Botanical Garden. Chin. Sci. Technol. Hist. Mater. 1982, 2, 91–97. (In Chinese) [Google Scholar]
- Wu, N.; Qian, J.; Tang, C.; Dong, L.; Zhang, R.; Li, Y.; Gao, X. Study on population travel behavior analysis based on mobile data. Mod. Comput. (Prof. Ed.) 2018, 41, 10–13. (In Chinese) [Google Scholar]
- Gong, X.; Pei, T.; Sun, J.; Luo, M. Review of the research progresses in trajectory clustering methods. Prog. Geogr. 2011, 30, 522–534. [Google Scholar]
- Wang, Z.; Fang, Z. Spatial behavior pattern and evolution characteristics of hiking tourism based on GPS: A case study of Wogong Mountain in Jiangxi Province. Areal Res. Dev. 2021, 40, 118–122. (In Chinese) [Google Scholar]
- Sugimoto, K.; Ota, K.; Suzuki, S. Visitor mobility and spatial structure in a local urban tourism destination: GPS tracking and network analysis. Sustainability 2019, 11, 919. [Google Scholar] [CrossRef] [Green Version]
- Jani, D. Segmenting tourists using sustainable values: A cluster analysis of Tanzanian inbound tourism. J. Qual. Assur. Hosp. Tour. 2018, 19, 322–340. [Google Scholar] [CrossRef]
- Han, J.; Kamber, M.; Pei, J. Data Minning—Concepts and Techniques Burlington; San Francisco: Margan Kaufmann, 2012. [Google Scholar]
- Wong, J.A.H.A. Algorithm as 136: A k-means clustering algorithm. J. R. Stat. Soc. 1979, 28, 100–108. [Google Scholar]
- Millonig, A.; Gartner, G. Shadowing-tracking-interviewing how to explore human spa-tio-temporal behaviour patterns. In Workshop on Behaviour Monitoring and Interpretation (BMI’08); Gottfried, B., Aghajan, H., Eds.; Technologie-Zentrum Informatik Berichte: Bremen, Germany, 2009; pp. 1–14. [Google Scholar]
- Li, Y.; Liu, J.; Yan, Z.; Wang, D. Spatial behavior patterns of tourists based on satellite naviga-tion data—A case study of Gulangyu. Chin. Landsc. Archit. 2019, 1, 73–77. [Google Scholar]
- Yao, X. Research on Interactive Landscape Construction in Urban Residential Areas in China. Ph.D. Thesis, Tongji University, Shanghai, China, 2007. [Google Scholar]
- Zhao, J.; Cheng, S.; Jim, H.; Min, Q. Summary on birdwatching tourism study both at home and abroad. Tour. Trib. 2006, 21, 85–90. [Google Scholar]
- Liu, N.; Wang, Q.; Ren, X.; Xia, Y. Avian resources analysis on bird-watching routes in Xinqing National Wetland Park in Heilongjiang, China. Chin. J. Wildl. Sci. 2019, 40, 422–428. [Google Scholar]
- Li, X.; Yin, X.; Wang, Y. Diversity and ecology of vascular plants established on the extant world-longest ancient city wall of Nanjing, China. Urban For. Urban Green. 2016, 18, 41–52. [Google Scholar] [CrossRef]
- John, C. Birdwatching, Twitching and Tourism: Towards an Australian perspective. Aust. Geogr. 2009, 40, 203–217. [Google Scholar]
- Zhou, W.; Xu, X. Penjing: The Chinese art of bonsai. Horttechnology 1993, 3, 150–154. [Google Scholar] [CrossRef] [Green Version]
- Aranburu, I.; Plaza, B.; Esteban, M. Sustainable cultural tourism in urban destinations: Does space matter. Sustainability 2016, 8, 699. [Google Scholar] [CrossRef] [Green Version]
- Maple, L.C.; Eagles, P.F.; Rolfe, H. Birdwatchers’ specialisation characteristics and national park tourism planning. J. Ecotourism 2010, 9, 219–238. [Google Scholar] [CrossRef]
- Burr, S.W.; Scott, D. Application of the recreational specialization framework to understanding visitors to the Great Salt lake bird festival. Event Manag. 2004, 9, 27–37. [Google Scholar] [CrossRef]
- Applegate, J.E.; Clark, K.E. Satisfaction levels of birdwatchers: An observation on the consumptive–non-consumptive continuum. Leis. Sci. 1987, 9, 129–134. [Google Scholar] [CrossRef]
- Dickinson, R.; Edmonson, B. Golden wings. Am. Demogr. 1996, 18, 47–49. [Google Scholar]
- Hvenegaard, G.T. Birder specialization differences in conservation involvement, demographics, and motivations. Hum. Dimens. Wildl. 2002, 7, 21–36. [Google Scholar] [CrossRef]
- Saleh, F.; Ryan, C. Jazz and knitwear: Factors that attract tourists to festivals. Tour. Manag. 1993, 14, 289–297. [Google Scholar] [CrossRef]
- You, H.; Long, C. Study on the relationship between walking space of park and elderly walking behavior. Jiangxi Sci. 2019, 37, 536–542. [Google Scholar]
- Zhai, Y.; Baran, P.K. Urban park pathway design characteristics and senior walking behavior. Urban For. Urban Green. 2017, 21, 60–73. [Google Scholar] [CrossRef]


Publisher’s Note: MDPI stays neutral with regard to jurisdictional claims in published maps and institutional affiliations. |
© 2022 by the authors. Licensee MDPI, Basel, Switzerland. This article is an open access article distributed under the terms and conditions of the Creative Commons Attribution (CC BY) license (https://creativecommons.org/licenses/by/4.0/).