Article

Catalytic Transformation of Biomass-Derived Glucose by One-Pot Method into Levulinic Acid over Na-BEA Zeolite

Faculty of Chemical Engineering and Technology, Cracow University of Technology, Warszawska 24, 31-155 Kraków, Poland
*
Authors to whom correspondence should be addressed.
Processes 2022, 10(2), 223; https://doi.org/10.3390/pr10020223
Submission received: 29 December 2021 / Revised: 21 January 2022 / Accepted: 24 January 2022 / Published: 25 January 2022
(This article belongs to the Special Issue Catalytic Application of Zeolite in Organic Synthesis)

Abstract

:
This article presents the results of the conversion of biomass-based glucose to levulinic acid (LA) with the use of Na-BEA commercial zeolite catalyst. For this purpose, synthetic zeolite BEA was used as a matrix. The glucose conversion process with the participation of Na-BEA zeolite allowed the following acids to be obtained: levulinic acid, lactic acid, pyruvic acid and formic acid. The highest yield of levulinic acid was achieved when processed for 1–5 h at 200–250 °C with 0.1 g and 0.6 g of Na-BEA catalyst. We also compare the one-pot heterogeneous process with similar homogeneous process using H2SO4 as catalyst.

1. Introduction

Levulinic acid (LA) has been identified as a promising biocompound derived from biomass. It is a platform molecule that is used as a precursor for pharmaceuticals, plasticizers and various other additives (Figure 1) [1,2]. It arises as a result of depolymerization and dehydration of the cellulose fraction [3]. It can be obtained through hydrolysis/dehydration of aldohexoses such as glucose and fructose, or hexose-containing polymers such as starch and cellulose.
The production of levulinic acid to date has not been significant, which comes from historical reasons relating to expensive precursor usage almost seventy years ago. Additionally, the yields and separation/purification processes lacked industrial product quality [4]. The maximum yield of LA from cellulose was 71.5%, because of the co-production of formic acid. The claimed LA yields, based on the theoretical yields [5], are significantly lowered due to the formation of soluble polymeric by-products and other undesired products cumulating during the process.
In fact, the industrial production of LA can be managed by the so-called “Biofine process” [6]. Diluted sulfuric acid serves as a catalyst in this process, which involves two separate hydrolysis reactors. Biofine Renewables LCC CO developed a process in which to obtain HMF, agricultural residues undergo hydrolysis and dehydration in a H2SO4 solution. Many feedstocks (such as paper, wood and other lignocellulosic materials) have been claimed as starting materials. The first reactor is used for the depolymerization of polysaccharides into their soluble monomers (e.g., hexoses, pentoses, HMF) with the following parameters: temperature within the range of 210–220 °C, and a pressure of 25 bar. In the first step, biomass and sulfuric acid solution are mixed and continuously supplied to a small-diameter tubular reactor that operates at a temperature within the range of 210–220 °C and a pressure of 25 bar. The product mixture is recovered and transformed into LA in a second reactor at 60% yield in relation to the monomers contained in the starting substrate, which is cellulosic biomass [7,8]. The second tank reactor operates at a temperature of 190–200 °C and a pressure of 14 bar. The first commercial-scale plant for the conversion of lignocellulosic biomass to LA was built in Italy [6] using Biofine technology with some further improvements [9]. Initially, this plant adopted Biofine technology. This was wettened with a two-reactor configuration using local tobacco chops or paper mill sludge as feedstock. However, the effectiveness of the process depends on the type of biomass. For example, tobacco chops lead to many disadvantages by the deposition of salts and humins due to the small size of the reactors. Therefore, one-pot technology, which we suggest in this paper, has many more advantages for industrial-scale LA production. However, this process is currently only being tested at the laboratory scale.
At the laboratory scale, the hydrothermal microwave-assisted catalytic conversion of waste biomass to levulinic acid has been investigated in the presence of homogeneous acid catalysts [10]. Another option, suggested in the same paper, was the use of the soluble precursor inulin to obtain levulinic acid in the presence of niobium phosphate, a heterogeneous acid catalyst which had never been used for this reaction. It opens other lines for LA production using heterogeneous catalysis, which could be more industrially valuable.
Zeolites are a class of crystalline aluminosilicates which are used as successful catalysts in many applications [1]. Many types of zeolites with a variety of pore sizes were synthetized with different frameworks such as beta (BEA), ferrierite (FER) or mordenite (MOR). Zeolites catalyze many types of hydrocarbon reactions and are therefore ideal candidates for the production of chemicals from biomass. Effective zeolite-based catalysts integrate three main functions and length scales: active sites located in micropores; access and transport provided by the introduced mesopores; and the macroscopic shape of the catalyst body. Porous zeolites with densely embedded Lewis’s acid centers (tri-coordinated lattice aluminum ions Al3+) are particularly effective in the isomerization reaction, which is the subject of this work [11]. Zeolites can be subjected to numerous modifications. One such modification is known as ion exchange (isomorphic substitution); the replacement of Si4+ with Al3+ induces the formation of a negative charge, which is neutralized by positively charged cations, e.g., Na+, Ca2+ and many others [12,13].
In other studies, levulinic acid was obtained as a result of glucose, starch and cellulose conversion in a hydrothermal process using heterogeneous Ga-MOR zeolite catalysts. The process lasted for 6 h at 175 °C with a yield of 59.9% [14]. A hybrid catalyst containing chromium chloride and an HY zeolite has been also developed, resulting in a reaction at 145.2 °C for 2.5 h with an LA yield of 55.2% [15]. Moreover, an MFI zeolite with a different silicon ratio (Si/Al = 25, 30, 80, 120, 260) has been used for the dehydration of glucose. This process was carried out at 180 °C for 8 h. An MFI zeolite with Si/Al = 30 has been found to be the most active; however, LA was obtained with a yield of 35.8% [16]. The number of Fe-HY catalysts with various percentages of iron (5–15%) has been investigated. 10% Fe-HY catalysts showed the highest catalytic efficiency of around 62% [17]. Levulinic acid has also been obtained by conversion of xylose in the presence of using alkaline zeolite catalysts. Zeolite Y was treated with sodium hydroxide with various molar concentrations (0.05 M and 0.25 M). Dealuminated Y zeolite, 0.25 M NaOH, proved to be the most effective catalyst. The product was obtained with a yield of 30.4% and a conversion of 84.3%. The process was carried out for 3 h at 170 °C [18]. The zeolite LZY has also found application in the catalytic dehydration of fructose. The process was carried out in a batch reactor at 140 °C for 15 h with an efficiency of around 43.2% [19].
The purpose of this research is to compare homogeneous H2SO4 catalysts with heterogeneous BEA zeolite catalysts used in the same one-pot conditions and similar process parameters (e.g., time of process and temperature range).

2. Materials and Methods

2.1. Catalytic Material

In this work, zeolite catalyst based on sodium version of synthetic BEA (Clariant) with physicochemical properties presented in Table 1 was used, without carrying out any modifications. The samples were dried at 100 °C for 5 h and calcinated for 5 h at 450 °C.

2.2. Characterization Methods

In order to characterize the Na-BEA zeolite, physicochemical analyses were performed on calcined samples.
X-ray powder diffraction (XRD) for zeolite catalysts was performed using a PANalytical X’Pert PRO MPD diffractometer equipped with a CuKα radiation source, at a voltage of 40 kV and an intensity of 30 mA. Scanning was performed in a continuous mode in the range of 2θ from 5 to 50°.
The morphology of the samples was examined on a scanning electron microscope (SEM) with EDS (Energy-Dispersive Spectroscopy) detector for chemical analysis, HITACHI®TM3000 with a beam voltage of 5.15 keV, magnification up to 30,000 times and a resolution of approx. 30 nm. The sample was prepared by sputtering with carbon.
Low-temperature nitrogen sorption (−196 °C) was measured on a Micromeretics ASAP 2020 sorptometer. Specific surface area was determined using the Brunauer–Emmett–Teller method in the pressure range p/p0 = 0.05–0.15, while pore size was determined using the Barrett–Joyner–Halend method based on the volume of adsorbed nitrogen, p/p0 = 0.98.
The analyzes of zeolite catalysts by the ATR–FTIR method were performed on the Thermo Scientific Nicolet iS5 FTIR spectrometer equipped with the iD7 ATR accessory and the highly sensitive DLaTGS detector. Ceramic high-energy IR radiation sources were recorded in the range of 4000–500 cm−1 with the EverGlo ™ with the beam splitter Ge/KBr Spectra.
The above methods are used for checking metal distribution and chemical state in the investigated zeolites.

2.3. Catalytic Tests

The catalytic tests were conducted by one-pot method using 0.125 M aqueous glucose solution. Glucose conversion in homogeneous conditions was performed in the temperature 220 °C for 2 h using H2SO4 (0.1, 0.2, 0.5 and 1 M solutions). Glucose conversion in heterogeneous conditions was carried out in the temperature range of 200–250 °C for 1–5 h using Na-BEA (0.1 g and 0.6 g).
In case of homogeneous process after the specified process time, the autoclave with the products was cooled and the solution was neutralized with 10% aqueous sodium hydroxide solution to pH = 7. The prepared samples were analyzed by HPLC-RID system (isocratic elution, SUPELCOGEL™ H, 6% Crosslinked HPLC Column, 30 cm × 7.8 mm, Rezex Organic acid ROA H+ 300 × 7.8 mm, column temperature 40 °C, eluent 0.005 N H2SO4).
The analysis of the obtained products during glucose conversion was performed using the HPLC technique on the Prominence Modular HPLC-RID Shimadzu. In chromatographic method, the retention times of the obtained products were compared with the retention times of the pure standard components.

3. Results

3.1. Na-BEA Characterization

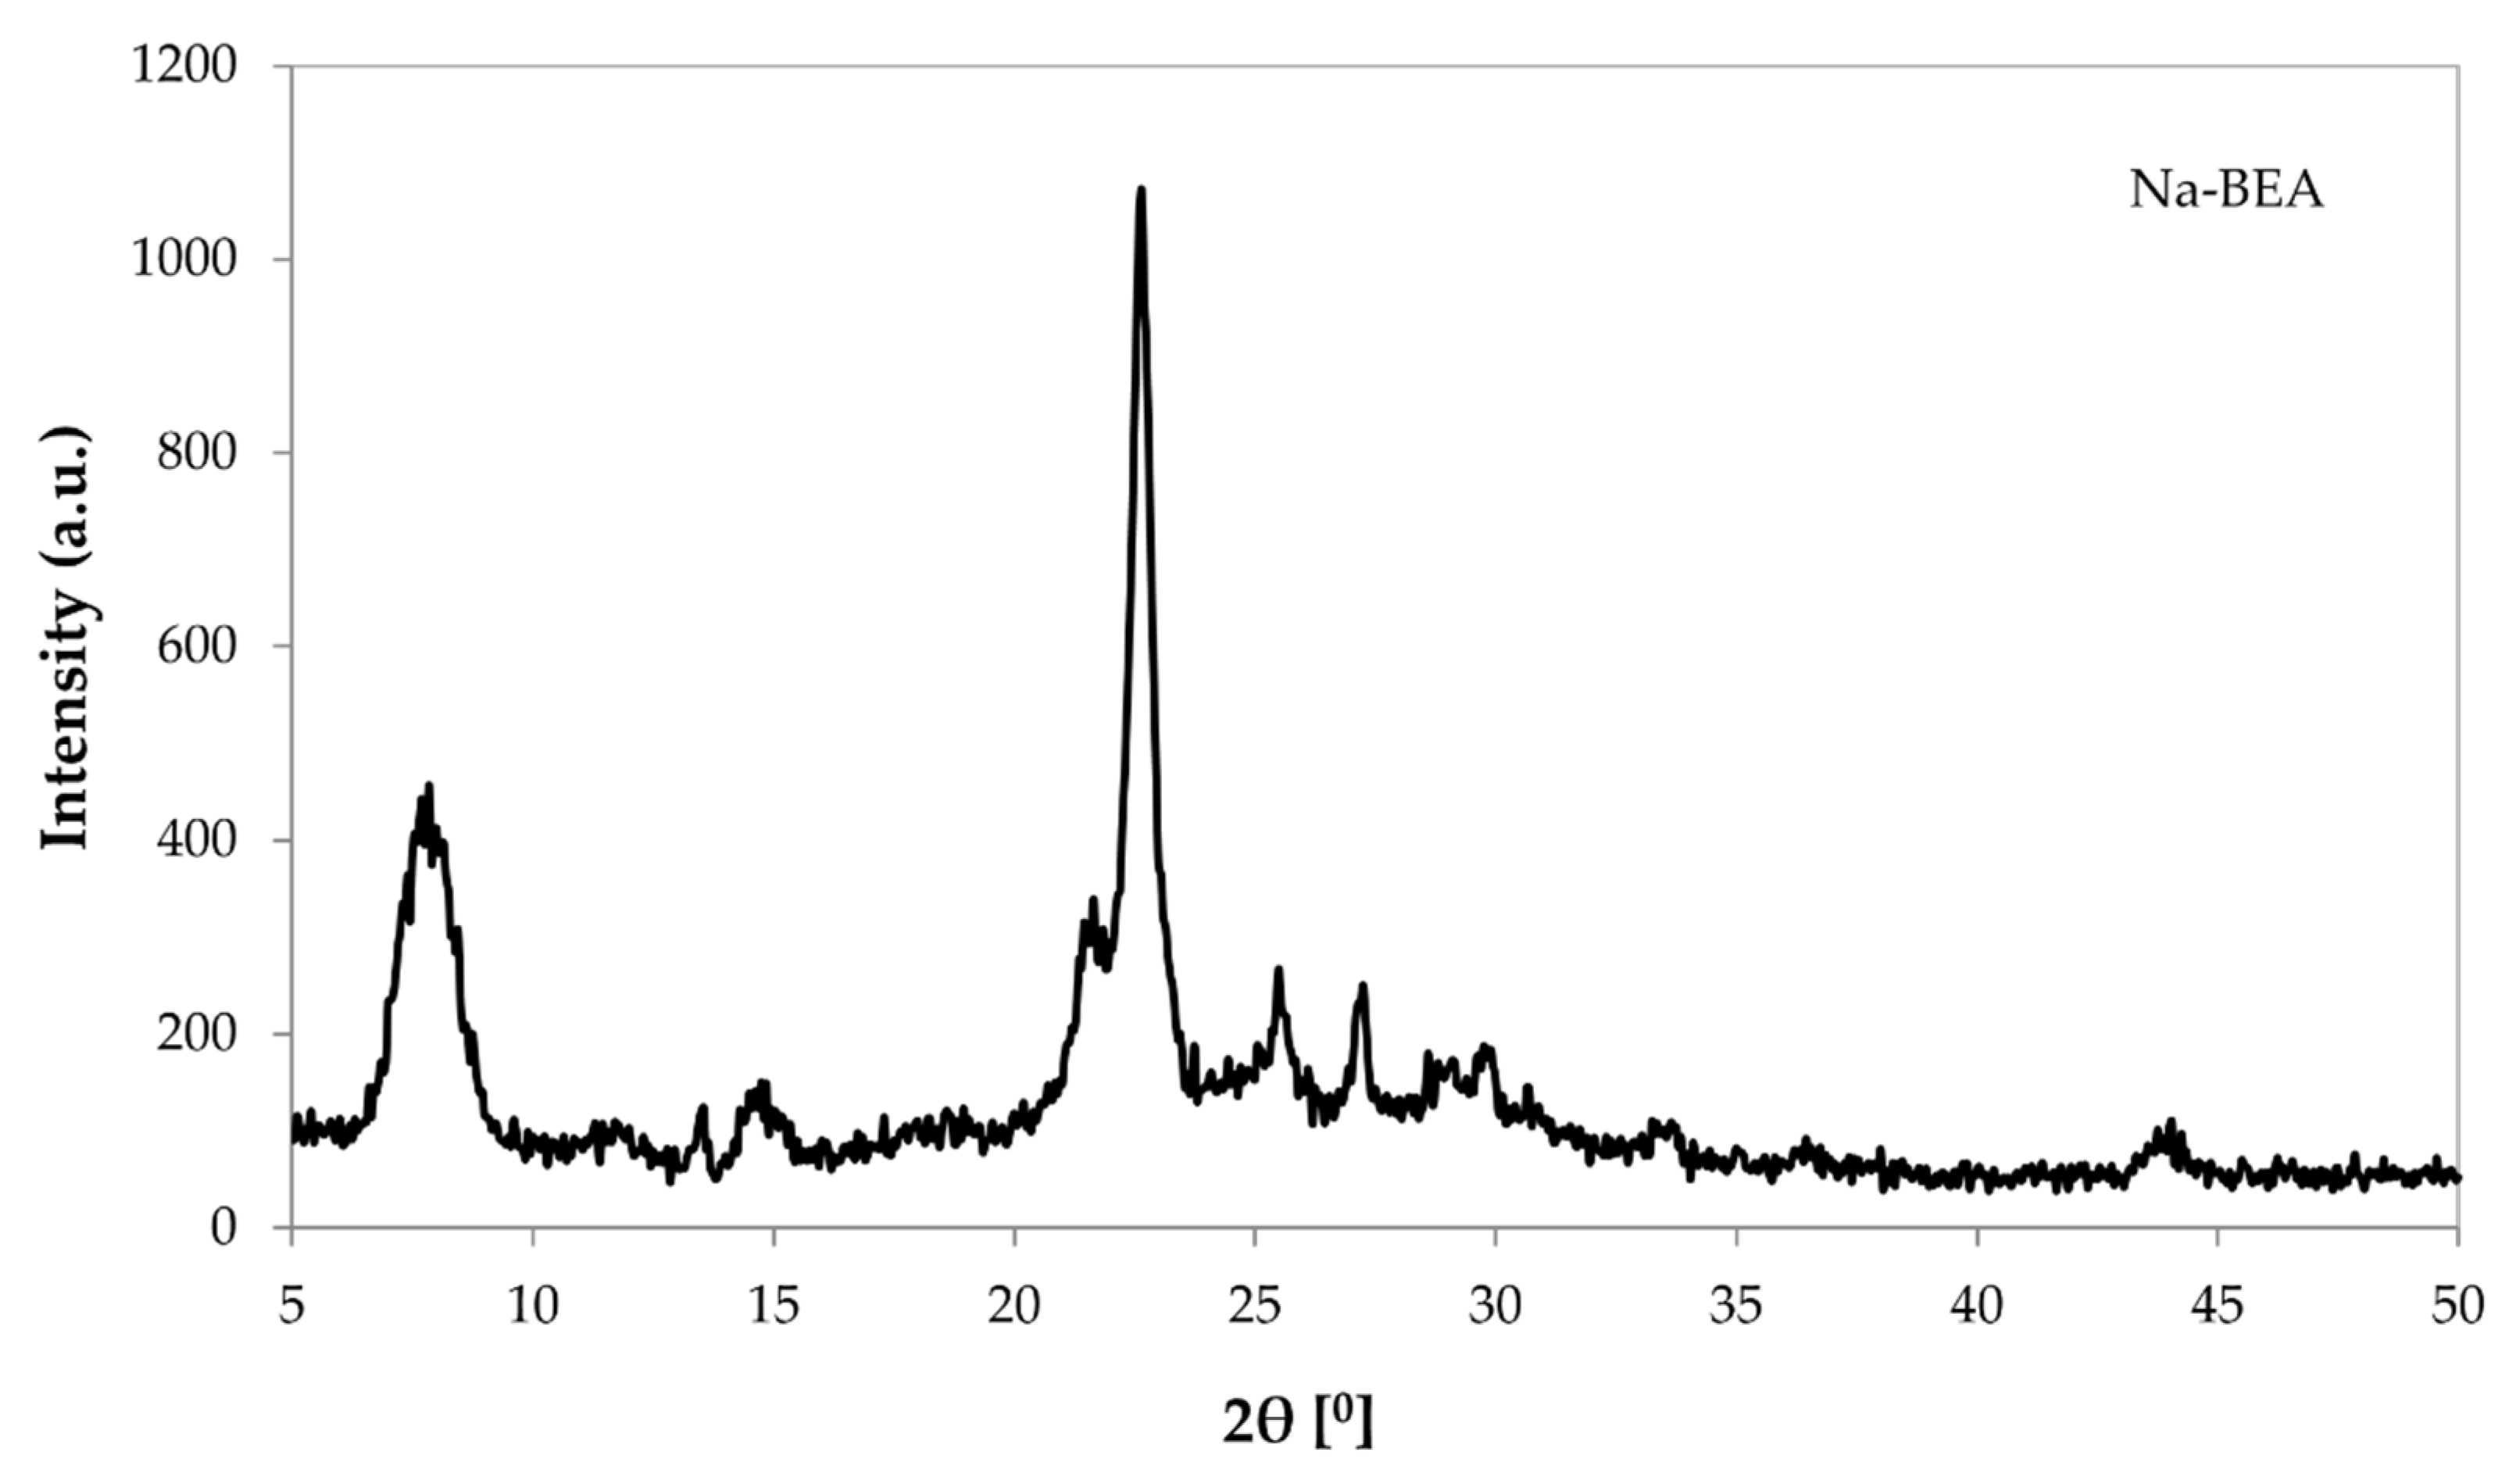
The XRD measurements were performed for control samples of Na-BEA (Figure 2). Figure 2 shows the diffractogram confirming the presence of a specific phase of zeolite BEA. The obtained diffractogram from the analysis of the Na-BEA sample was compared with the literature data. The analyzed Na-BEA zeolite after calcination shows the typical high rebound peaks (101) and (302) at about 2θ = 6–9°; 22–22.5°, which proves the material to be a highly crystalline structure. Sharp peaks are characteristic of the presence of a polymorphic structure. Additionally, the rectal peaks were observed for α-Al2O3 at 2θ = 26 and 35.5°. The observation of the peaks in the analyzed sample proves the lack of other phases in Na-BEA [20,21].
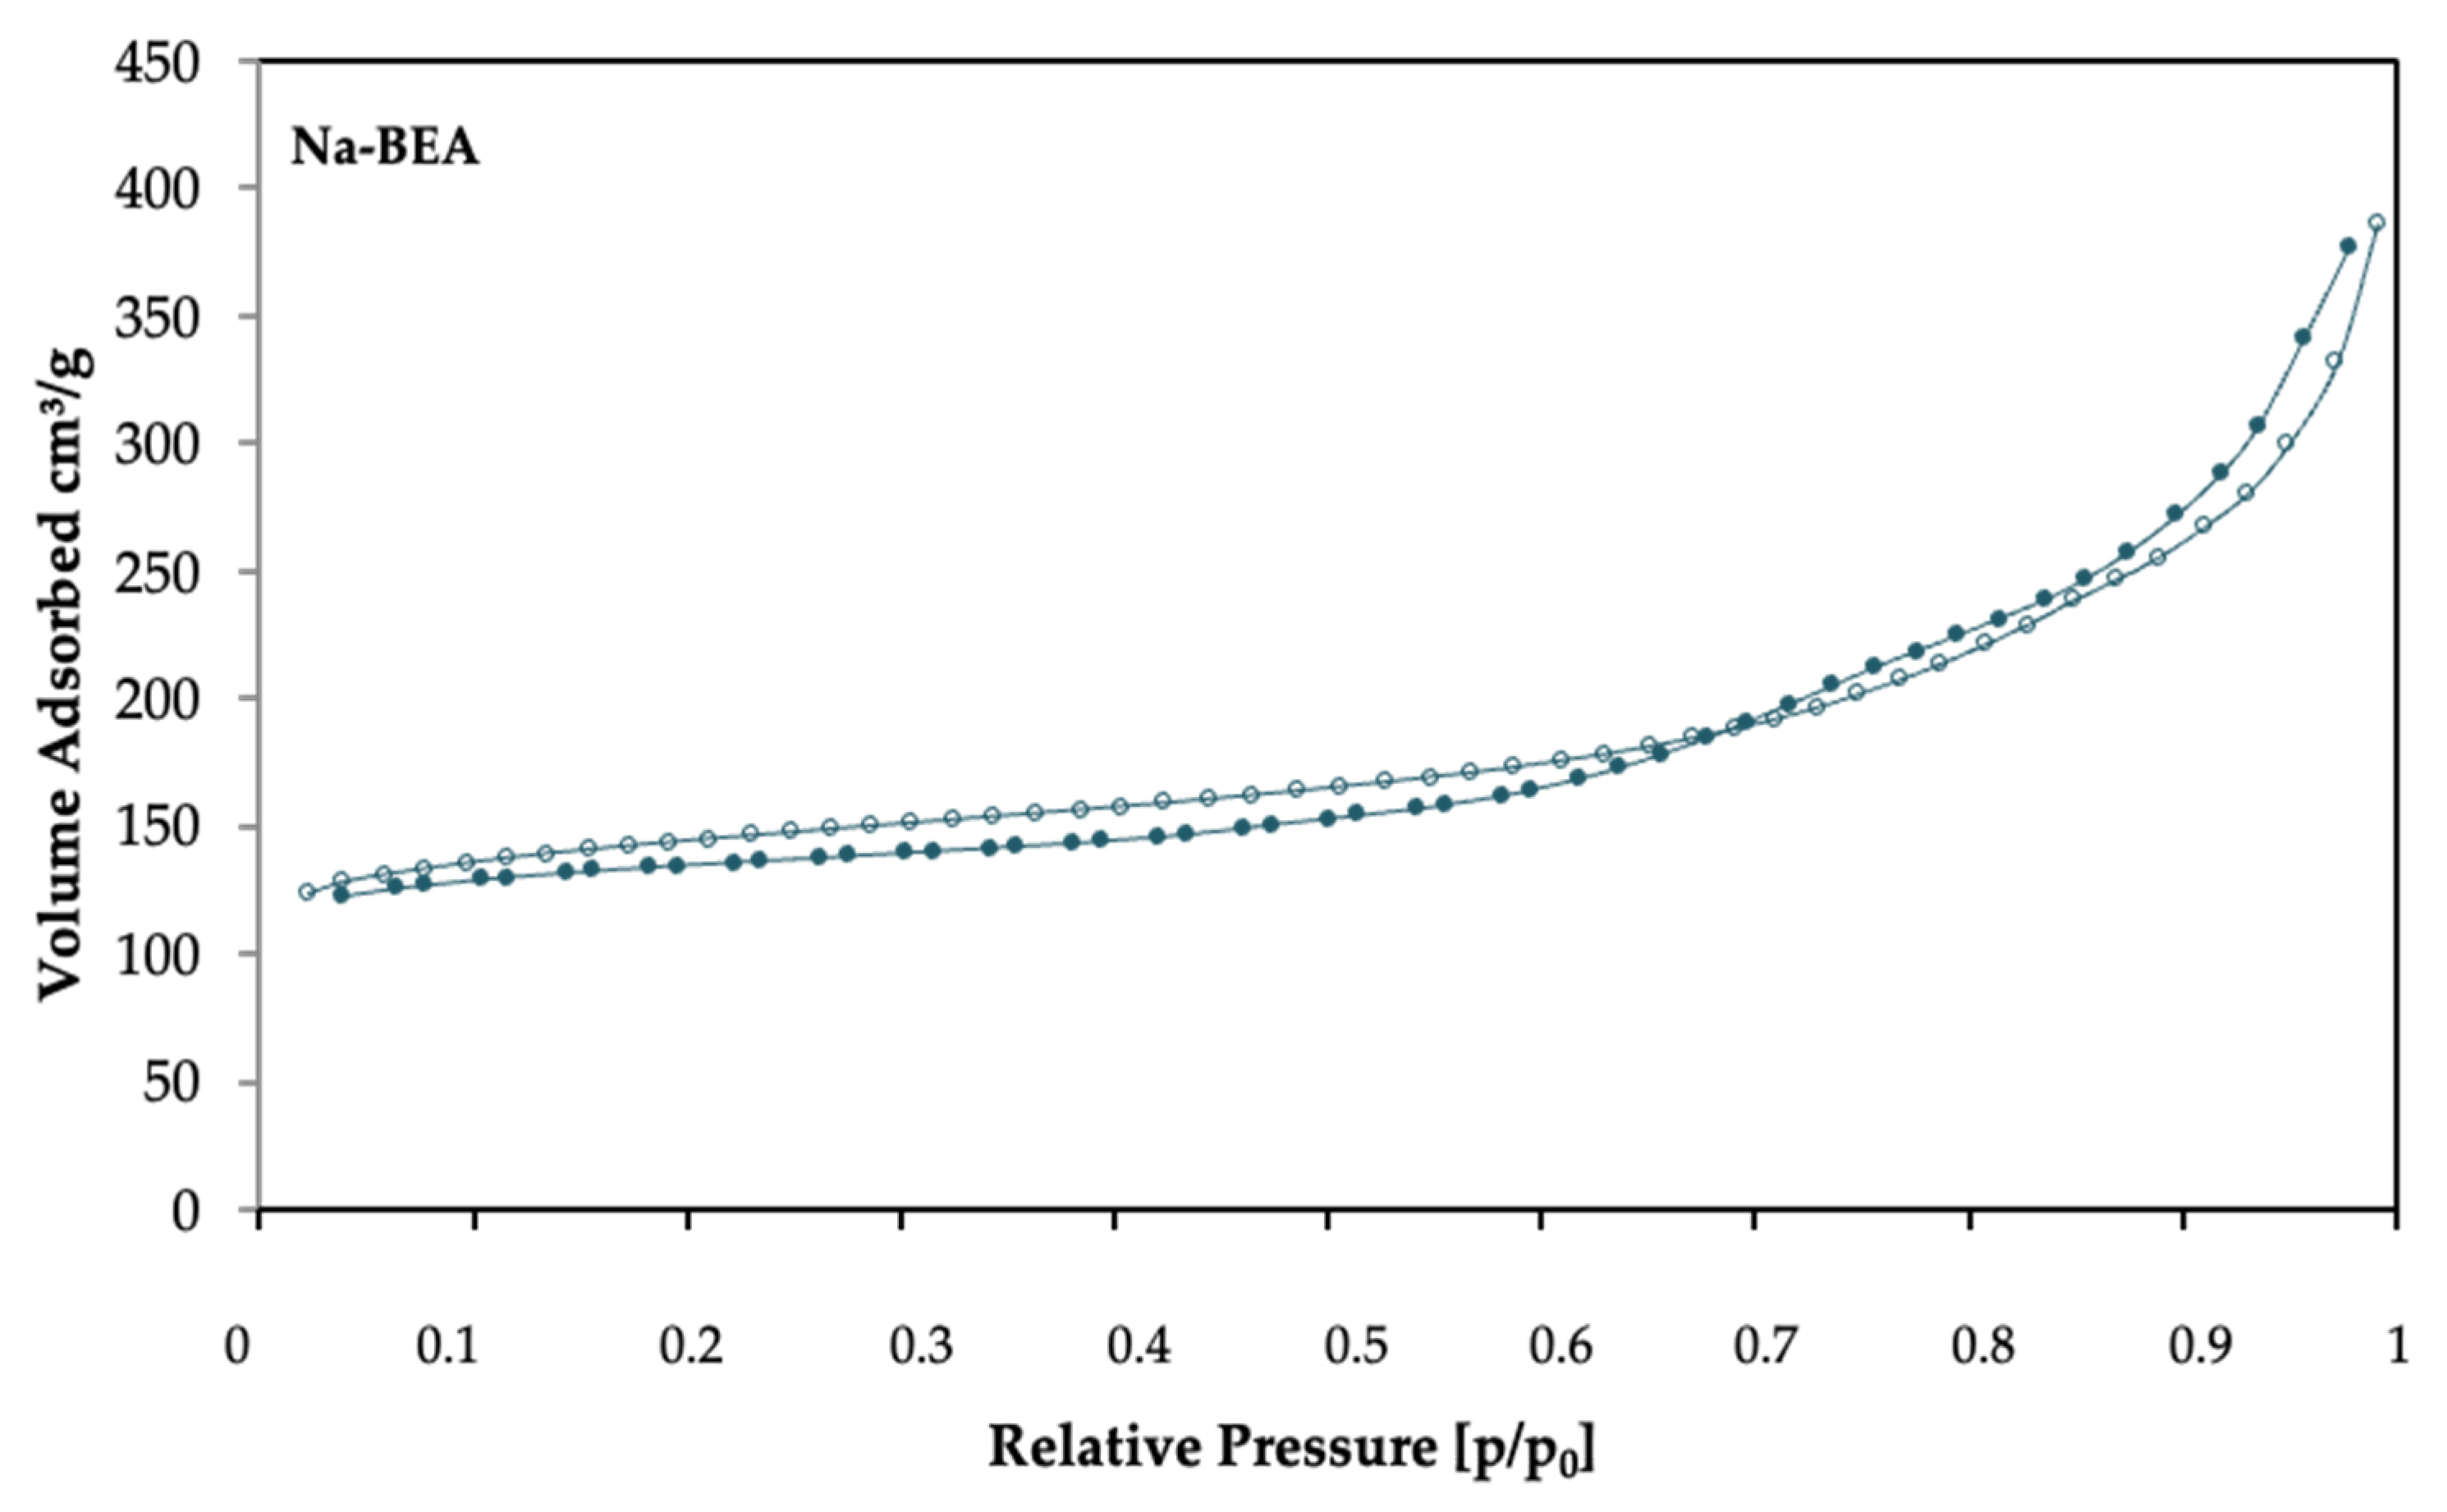
Table 2 presents the results of the BET analysis for the Na-BEA material. The specific BET surface area and the pore size of zeolite catalysts. Vp total is the total pore volume, while Vp micro is the micropore volume determined using the Saito–Foley (SF) model and calculated using the t-plot method.
The following graph (Figure 3.) shows the adsorption isotherm and nitrogen desorption isotherm for Na-BEA. The isotherm can be classified as type I (according to IUPAC) with a type H4 hysteresis loop. The studied zeolite can be characterized as a micro-mesoporous material. It can be seen that the surface area of the Na-BEA tested sample is comparable to the result presented by the manufacturer. A large development of the surface in the analyzed sample proves the presence of active centers in the form of, for example, Na+ on the surface. The size of the channels and the size of the pores in the zeolite are sufficient and do not block N2 from entering the sample interior. The volume of micro- and mesopores is presented in Table 2.
Figure 4 shows the ATR–FTIR spectrum for the Na-BEA sample. The bands present, extending between 3700–3500 cm−1, are due to stretching vibrations from the -OH group. One can also see the band around 1600 cm−1 as bending vibrations. These bands indicate the presence of hydrated Na-BEA samples [22,23]. The band above 3700 cm−1 is derived from Si-OH [24]. In turn, the adsorption band at 1500–1400 cm−1 relates to C=O stretching vibrations and probably comes from adsorbed CO2 from the atmosphere, which interacts with Na+ present in the zeolite skeleton [25]. The presence of the 800–400 cm−1 band is characterized by the presence of a skeleton consisting of tetrahedra of aluminum and silicon, forming a zeolite [26]. Correspondingly, symmetrical vibrations of the T-O-T stretching bonds can be noted, where T can be assigned to Al or Si. These vibrations were observed at the band of about 790 cm−1 and 560 cm−1. Additionally, for the 668 cm−1 band, the Si-O-M bond can be attributed, where M is the exchangeable Na+ present in the BEA zeolite [27,28].
The surface of the Na-BEA sample and its elemental composition were examined using a scanning electron microscope with an EDS detector (Figure 5). The sodium form of the BEA-type zeolite was analyzed. Local analysis of the sample showed the presence of elements such as Si, Al, O, C and Na. The elements Si, Al and O are the building blocks of zeolite. The presence of Na indicates the sodium form of the BEA zeolite. On the other hand, the presence of an element such as C on the zeolite surface is related to the earlier preparation of the sample for SEM–EDS analysis by spraying it with carbon. The amount of Na in the sample is minimal, in the range of 0.1%. However, Na is distributed over the entire surface (Figure 5b).

3.2. Catalytic Tests

Two types of catalytic tests have been performed using homogeneous (H2SO4) and heterogeneous Na-BEA zeolite catalysts.
A homogeneous process was prepared as follows: 0.1 M; 0.2 M; 0.5 M and 1 M aqueous H2SO4 (v = 20 mL), followed by the addition of 0.45 g of glucose. Four Teflon-filled autoclaves were prepared, into which aqueous solutions of sulfuric acid and the appropriate amount of glucose were transferred. The process was carried out at 220 °C for 2 h. The autoclaves were then cooled down and their solutions were neutralized with 10% aqueous NaOH solution. Samples for HPLC-RID analysis were prepared by filtering with a syringe filter with a grain size of 0.45 μm. The analysis of potential products formed during glucose conversion is summarized in Table 3.
Catalytic tests using heterogeneous Na-BEA were carried out in an autoclave with a Teflon filling. Quantities of 0.1 and 0.6 g of the catalyst and 20 mL of 0.125 M glucose solution in water were introduced. The reaction was performed at 200–250 °C for 1 h to 5 h. Samples for HPLC-RID analysis were prepared by filtering with a syringe filter with a grain size of 0.45 μm. The procedure was performed for a series of products and collected in Table 3.

4. Discussion

4.1. Homogeneous Process

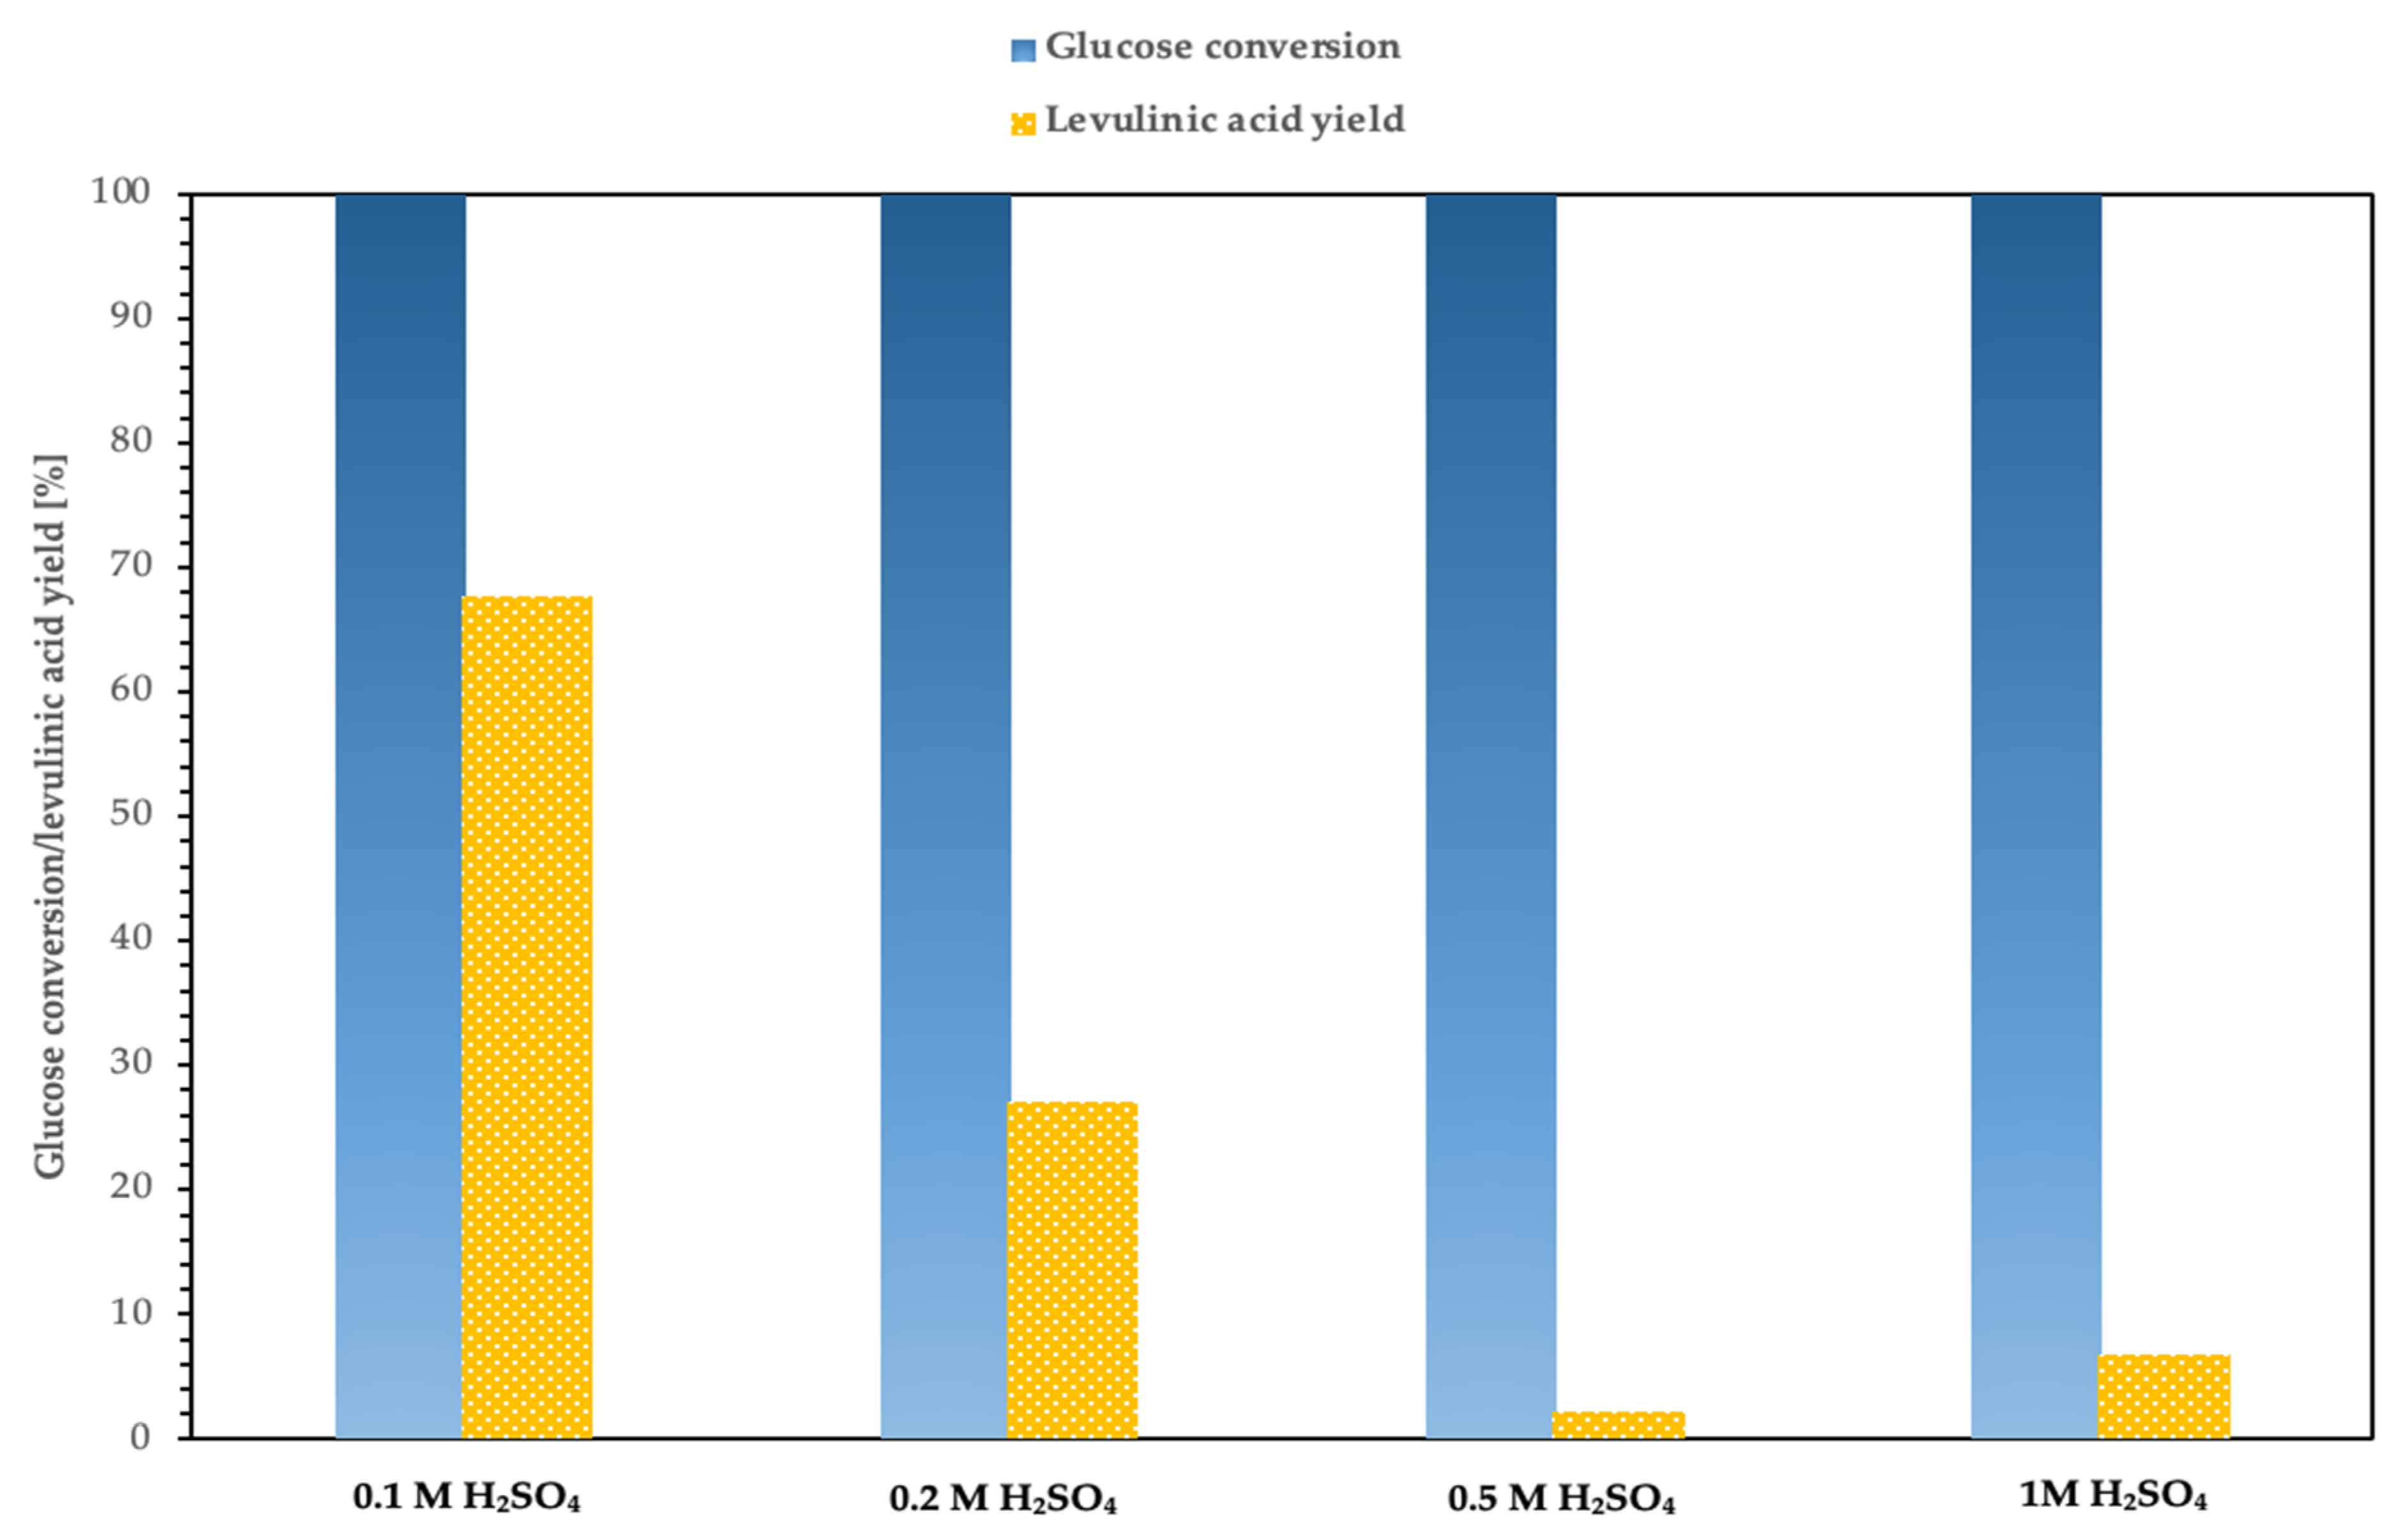
Catalytic tests in the homogenous process were performed using different aqueous solutions of sulfuric acid (VI) (H2SO4: 0.1, 0.2, 0.5 and 1 M). Based on the collected results, glucose conversion was maintained at a level of 100%. During the process, by-products such as furfural or 5-HMF were not observed. The individual changes in glucose conversion and levulinic acid yield values during its catalytic conversion process with H2SO4 acid are presented in Figure 6 (and Table 3).
High selectivity to levulinic acid is observed only with low H2SO4 catalyst concentration (0.1 M) and is equal 67.7%. Compared to the literature data, it is a very promising result.
The presence of other products in the post-reaction mixture can also be seen. The one-pot acid hydrolysis of glucose with an aqueous solution of H2SO4 also produces pyruvic acid and oxalic acid. It can also be seen that the higher the concentration of sulfuric acid (VI), the lower the selectivity to LA, and thus the proportion of products such as pyruvic acid and oxalic acid will increase. In addition, too high a concentration of H2SO4 may lead to the obtaining of levulinic acid; however, this product in a further stage, and with a large amount of [H+] derived from sulfuric acid (VI), leads to a further reaction with the formation of oxalic acid. Hence, the highest selectivity to LA can be noticed only in the range of low concentrations of sulfuric acid, used as a homogeneous catalyst in the glucose conversion process.

4.2. Heterogeneous Process

Catalytic tests with the use of a heterogeneous catalyst were also carried out. In this case, unmodified BEA zeolite in sodium form was used. Before the process, the zeolite was dried at a temperature of 100 °C for 5 h and then calcined for 5 h at a temperature of 450 °C. Catalytic tests were performed in series. Correspondingly, a one-pot conversion of glucose was carried out at the same temperatures (200–250 °C) for an appropriate time of 1–5 h using 0.1 g and 0.6 g of Na-BEA, respectively. During the process, checks were performed as to which conditions were the most favorable for obtaining LA with high yield. The degree of reaction of the raw material (glucose) and potential chemical pathways during the reaction were also checked.
On this basis, the collected glucose conversion was maintained at a level of 100%. The individual changes in glucose conversion values during its catalytic conversion process with zeolite catalysts are presented in Figure 7 (and Table 4). In order to determine the role of the heterogeneous catalyst in the reaction product distribution, the yields of levulinic acid are also plotted as a function of the time of process and catalyst weight. In most cases, conversion of glucose over Na-BEA is equal to 100%. One exception is a process running for only 1 h at a temperature of 250 °C and with 0.6 g Na-BEA, where glucose conversion equals only 78%.
In case of the 2 h and 1 h processes, the selectivity into levulinic acid changes in the range of 55.3–60.8% for 0.1 g and 61.4–62.8% for 0.6 g of Na-BEA catalyst, respectively. These results are higher than those of the literature data using MOR zeolite [14], and doubly higher than for other zeolites listed in literature [14,15,16,17,18]. In addition to levulinic acid, other products such as lactic acid (16.2–27.1%), furfural (13.4–15.8%), formic acid (8.3–12.6%) and dihydroxyacetone (4.2–11.3%) were also observed in the product mixture.
The optimal time of process is 5 h with low catalyst content (0.1 g), where selectivity into levulinic acid is 100% and a very clean product is obtained. In the case of 0.6 g of Na-BEA, the only additional product observed in the product mixture is furfural.
On the basis of the collected results from the HPLC analysis, the presence of other products can also be noticed, such as lactic acid with a selectivity of 27.1% with 0.1 g of Na-BEA (the process was carried out for 2 h at a temperature of 220 °C); formic acid with a selectivity of 16.1% with a share of 0.6 g Na-BEA (the process was carried out for 1 h at 250 °C); DHA with a selectivity of 11.3% with 0.1 g of Na-BEA (the process was carried out for 1 h at a temperature of 250 °C); and furfural with a selectivity of 16.7% with 0.6 g Na-BEA (the process was carried out for 2 h at 220 °C).
The comparison of homogeneous and heterogeneous catalysis by comparing the temporal evolution of glucose conversion as function of the solid catalyst (Na-BEA) with an acid solution (H2SO4) shows that using Na-BEA catalyst at a relatively lower temperature of 200 °C, low zeolite content (0.1 g) and 5 h process, the heterogeneous process is efficient, with 100% success in the very selective production of levulinic acid.
In order to illustrate the results obtained during the catalytic conversion of glucose via the one-pot method, diagrams of potential chemical pathways are presented below. Figure 8 shows the results of homogeneous catalysis with H2SO4 over a range of different concentrations.
On the basis of the available literature, carrying out the glucose conversion process leads to the formation of an intermediate product, gluconic acid [29]. In the case of the research carried out with the use of various concentrations of H2SO4 (Table 3) and the proposed process conditions, it can be seen that in this case, the one-pot glucose conversion reaction is 100% and no intermediate product is observed. The most advantageous condition for conducting homogeneous catalysis to LA is the use of 0.1 M H2SO4. The process yields two products, the leading of which is the desired LA. In other cases, oxalic acid appears in the post-reaction mixing. Higher concentrations of H2SO4 (0.5 M and 1 M) lead the catalytic process to two products: pyruvic acid and oxalic acid, the selectivities of which are similar in both processes. The presence of similar amounts of these two acids proves that glucose conversion with the participation of H2SO4 in higher concentrations is unfavorable for the production of LA.
Below, in Figure 9, the potential chemical pathways that may arise during glucose conversion with the participation of the heterogeneous catalyst, i.e., Na-BEA zeolite, are presented in graphic form.
During the optimization of conditions for the one-pot glucose conversion process with the aid of a catalyst, special attention was focused on the amount of Na-BEA used. Each time, 0.1 and 0.6 g were used for the process, respectively, using the same temperature and duration of the process. From the collected results, it can be seen that using different amounts of catalyst when carrying out glucose conversion at the same temperature and time gives different results. The most preferred conditions for obtaining LA are the use of 0.1 g of Na-BEA at a temperature of 200 °C for 5 h. In turn, increasing the weight of the catalyst to 0.6 g causes the process to produce an intermediate product (furfural) and additionally, lactic acid in the final products. When the process is carried out at 220 °C for 2 h, products such as levulinic acid and lactic acid are produced. During the conversion of glucose, regardless of the amount of catalyst in the post-reaction mixture, two intermediate products can be noticed: furfural and DHA. The presence of two intermediate products may indicate that the process is too short. Conversely, the conversion of glucose at 250 °C for 1 h, regardless of the amount of Na-BEA used as a catalyst, gives three products: levulinic acid, lactic acid and formic acid. It can also be seen that the lower amount of catalyst, 0.1 g, also gives an intermediate product, which is DHA. In the case of using 0.6 g Na-BEA, no intermediate products were observed. From the collected data, it can be seen that conducting heterogeneous catalysis with a smaller amount of Na-BEA under mild conditions gives LA with an efficiency of 100%.

5. Conclusions

We compare homogeneous and heterogeneous catalysis of levulinic acid conversion from biomass-derived glucose. High selectivity of levulinic acid production from glucose in case of the homogeneous process was visible only with a low H2SO4 catalyst concentration: 0.1 M after 2 h. Compared to the heterogeneous process after 2 h with 0.6 g of Na-BEA catalyst at 220 °C, results were compatible with H2SO4 (yield 62.8%).
However, the highest levulinic acid selectivity was obtained for Na-BEA catalyst after 5 h of process at 200 °C and for a lower catalyst weight (0.1 g).
The comparison of homogeneous and heterogeneous catalysis by comparing the temporal evolution of glucose conversion as a function of the solid catalyst (Na-BEA) with an acid solution (H2SO4) shows that using Na-BEA catalyst at a relatively lower temperature of 200 °C, low zeolite content (0.1 g) and 5 h of process, the heterogeneous process is 100% efficient at succeeding in the very selective production of levulinic acid. Such a result is interesting from a practical point of view due to lower energy consumption. The combination of homogeneous and heterogeneous catalysts is also of interest. Additionally, it can be seen that carrying out glucose conversion using homogeneous catalysis with the participation of H2SO4, regardless of the concentration of this acid, leads to final products without the step of obtaining intermediates such as 5-HMF, DHA or furfural. In the case of using heterogeneous catalysis, the lack of intermediate products can be observed by carrying out glucose conversion for a short time: 1 h at the highest possible temperature, 250 °C. The optimal process for the conversion of C6 sugar on the basis of the collected data is a temperature of 220 °C for 2 h with the use of low concentrations of sulfuric (VI) acid—0.1; 0.2 M for homogeneous catalysis and 0.1 g of Na-BEA zeolite at a temperature of 200 °C for 5 h for heterogeneous catalysis.

Author Contributions

Both authors declare equal contribution to the manuscript. Conceptualization, N.S., I.C.; formulation of the scientific problem and development of experimental part, N.S., I.C.; experimental tests, N.S.; catalyst preparation, N.S.; zeolite characterization, N.S.; All authors have read and agreed to the published version of the manuscript.

Funding

This article is the product of the realization of the project “Nano-design of zeolite-based catalysts for selective conversion of biomass into chemicals” sponsored by the National Centre for Research and Development (NCBiR) within the international program ERANet-LAC 3rd Multi-Thematic Joint Call 2017/2018: ERANet-LAC/3/GreenMol/3/2019 “Development of Green Molecules from Lignocellulosic Biomass for Renewable Chemistry”.

Institutional Review Board Statement

Not applicable.

Informed Consent Statement

Not applicable.

Data Availability Statement

Data is contained within the article.

Acknowledgments

We are thankful to M. Piotrowski for technical help with the chromatograph. We are grateful to the Clariant companies for supporting us with the zeolite samples.

Conflicts of Interest

The authors declare no conflict of interest.

References

  1. Czekaj, I.; Sobuś, N. Nano-Design of Zeolite-Based Catalysts for Selective Conversion of Biomass into Chemicals; Wydawnictwo PK: Kraków, Poland, 2018; ISBN 978-83-7242-785-4. [Google Scholar]
  2. Kumar, A.; Shende, D.Z.; Wasewar, K.L. Production of levulinic acid: A promising building block material for pharmaceutical and food industry. Mater. Today Proc. 2020, 29, 790–793. [Google Scholar] [CrossRef]
  3. Wang, S.; Dorcet, V.; Roisnel, T.; Bruneau, C.; Fischmeister, C. Ruthenium and Iridium Dipyridylamine Catalysts for the Efficient Synthesis of γ-Valerolactone by Transfer Hydrogenation of Levulinic Acid. Organometallics 2017, 36, 708–713. [Google Scholar] [CrossRef]
  4. Rackemann, D.W.; Doherty, W.O.S. The conversion of lignocellulosics to levulinic acid. Biofuels Bioprod. Bioref. 2011, 5, 198–214. [Google Scholar] [CrossRef] [Green Version]
  5. Hayes, D.J.; Fitzpatrick, S.; Hayes, M.H.B.; Ross, J.R.H. The Biofine process- production of levulinic acid, furfural and formic acid from lignocellulosic feedstocks. Bioref. Ind. Proc. Prod. 2006, 1, 139–164. [Google Scholar]
  6. Fugalli, S.; Raspolli Galletti, A.M.; Troiano, A. Production of levulinic acid and levulinate esters from renewable raw materials and waste products of plant origin. Italy Patent IT 2008CE0002 (to Le Calorie S.p.A., Italy), 2008. [Google Scholar]
  7. Besson, M.; Gallezot, P.; Pinel, C. Conversion of Biomass into Chemicals over Metal Catalysts. Chem. Rev. 2014, 114, 1827–1870. [Google Scholar] [CrossRef]
  8. Corma, A.; Iborra, S.; Velty, A. Chemical routes for the transformation of biomass into chemicals. Chem. Rev. 2007, 107, 2411–2502. [Google Scholar] [CrossRef]
  9. Girisuta, B.; Janssen, L.P.B.M.; Heeres, H.J. A Kinetic Study on the Conversion of Glucose to Levulinic Acid. Chem. Eng. Res. Des. 2006, 84, 339–349. [Google Scholar] [CrossRef]
  10. Hong, J.H.; Lee, M.J.; Kim, H.R.; Hwang, Y.K.; Chang, J.S.; Halligudi, S.B.; Han, Y.H. Efficient and selective conversion of methyl lactate to acrylic acid using Ca3(PO4)2–Ca2(P2O7) composite catalysts. Appl. Catal. A Gen. 2011, 396, 194–200. [Google Scholar] [CrossRef]
  11. Grzywa, E.; Molenda, J. Technologia Podstawowych Syntez Organicznych, 3th ed.; Tom 2; WNT: Warszawa, Polska, 2000. [Google Scholar]
  12. Kijeński, J.; Migdał, A.; Rejewski, P.; Kędziora, A. Przemysłowa synteza kwasu akrylowego i akrylanów—Droga do eliminacji białych plam w obszarze wytwórczym polskiego przemysłu chemicznego. Polimery 2016, 61, 702–709. [Google Scholar]
  13. Zhang, J.; Lin, J.; Peilin, C. Catalytic Dehydration of Lactic Acid to Acrylic Acid Over Sulfate Catalysts. Can. J. Chem Eng. 2008, 86, 1047–1053. [Google Scholar] [CrossRef]
  14. Zhang, J.; Zhao, Y.; Pan, M.; Feng, X.; Ji, W.; Au, C.-T. Efficient acrylic acid production through bio lactic acid dehydration over NaY zeolite modified by alkali phosphates. ACS Catal. 2011, 1, 32–41. [Google Scholar] [CrossRef]
  15. Suo, X.; Zhang, H.; Ye, Q.; Dai, X.; Yu, H.; Li, R. Design and control of an improved acrylic acid process. Chem. Eng. Res. Des. 2015, 104, 346–356. [Google Scholar] [CrossRef]
  16. Galletti, R.; Antonetti, A.M.; De Luise, C.; Licursi, V.; Di Nasso, N. Levulinic acid production from waste biomass. BioResources 2012, 7, 1824–1835. [Google Scholar]
  17. Fjermestad, T.; Svelle, S.; Swang, O. Mechanistic Comparison of the Dealumination in SSZ-13 and the Desilication in SAPO-34. J. Phys. Chem. C 2013, 117, 13442–13451. [Google Scholar] [CrossRef]
  18. Da Costa Sousa, L.; Chundawat, S.P.S.; Balan, V.; Dale, B.E. Cradle-to-grave’ assessment of existing lignocellulose pretreatment technologies. Curr. Opin. Biotechnol. 2009, 20, 339–347. [Google Scholar] [CrossRef]
  19. Malola, S.; Svelle, S.; Bleken, F.L.; Swang, O. Detailed Reaction Paths for Zeolite Dealumination and Desilication from Density Functional Calculations. Angew. Chem. Int. Ed. 2012, 51, 652–655. [Google Scholar] [CrossRef]
  20. Fatouros, D.G.; Douroumis, D.; Nikolakis, V.; Ntais, S.; Moschovi, A.M.; Trivedi, V.; Khima, B.; Roldo, M.; Nazar, H.; Cox, P.A. In Vitro and in silico investigations of drug delivery via zeolite BEA. J. Mater. Chem. 2011, 21, 7789. [Google Scholar] [CrossRef]
  21. Sakai, M.; Yasuda, N.; Tsuzuki, Y.; Matsukata, M. Organic Structure-directing Agent-free Synthesis for *BEA-type Zeolite Membrane. J. Vis. Exp. 2020, 156, e60500. [Google Scholar] [CrossRef]
  22. Gabrienko, A.A.; Lashchinskaya, Z.N.; Arzumanov, S.S.; Toktarev, A.V.; Freude, D.; Haase, J.; Stepanov, A.G. Isobutene Transformation to Aromatics on Zn-Modified Zeolite: Particular Effects of Zn2+ and ZnO Species on the Reaction Occurrence Revealed with Solid-State NMR and FTIR Spectroscopy. J. Phys. Chem. C 2021, 125, 15343–15353. [Google Scholar] [CrossRef]
  23. Zholobenko, V.; Freitas, C.; Jendrlin, M.; Bazin, P.; Travert, A.; Thibault-Starzyk, F. Probing the acid sites of zeolites with pyridine: Quantitative AGIR measurements of the molar absorption coefficients. J. Catal. 2020, 385, 52–60. [Google Scholar] [CrossRef] [Green Version]
  24. Courtney, T.D.; Chang, C.-C.; Gorte, R.J.; Lobo, R.F.; Fan, W.; Nikolakis, V. Effect of water treatment on Sn-BEA zeolite: Origin of 960 cm−1 FTIR peak. Microporous Mesoporous Mater. 2015, 210, 69–76. [Google Scholar] [CrossRef] [Green Version]
  25. Król, M.; Minkiewicz, J.; Mozgawa, W. IR spectroscopy studies of zeolites in geopolymeric materials derived from kaolinite. J. Mol. Struct. 2016, 1126, 200–206. [Google Scholar] [CrossRef]
  26. Hajjar, R.; Millot, Y.; Man, P.P.; Che, M.; Dzwigaj, S. Two Kinds of Framework Al Sites Studied in BEA Zeolite by X-ray Diffraction, Fourier Transform Infrared Spectroscopy, NMR Techniques, and V Probe. J. Phys. Chem. C 2008, 112, 20167–20175. [Google Scholar] [CrossRef]
  27. Ma, Y.-K.; Rigolet, S.; Michelin, L.; Paillaud, J.-L.; Mintova, S.; Khoerunnisa, F.; Daou, T.J.; Eng-Poh, N.G. Facile and fast determination of Si/Al ratio of zeolites using FTIR spectroscopy technique. Microporous Mesoporous Mater. 2020, 311, 110683. [Google Scholar] [CrossRef]
  28. Tabor, E.; Lemishka, M.; Sobalik, Z.; Mlekodaj, K.; Andrikopoulos, P.C.; Dedecek, J.; Sklenak, S. Low-temperature selective oxidation of methane over distant binuclear cationic centers in zeolites. Commun. Chem. 2019, 2, 71. [Google Scholar] [CrossRef]
  29. Kalhor, P.; Ghandi, K. Deep Eutectic Solvents as Catalysts for Upgrading Biomass. Catalysts 2021, 11, 178. [Google Scholar] [CrossRef]
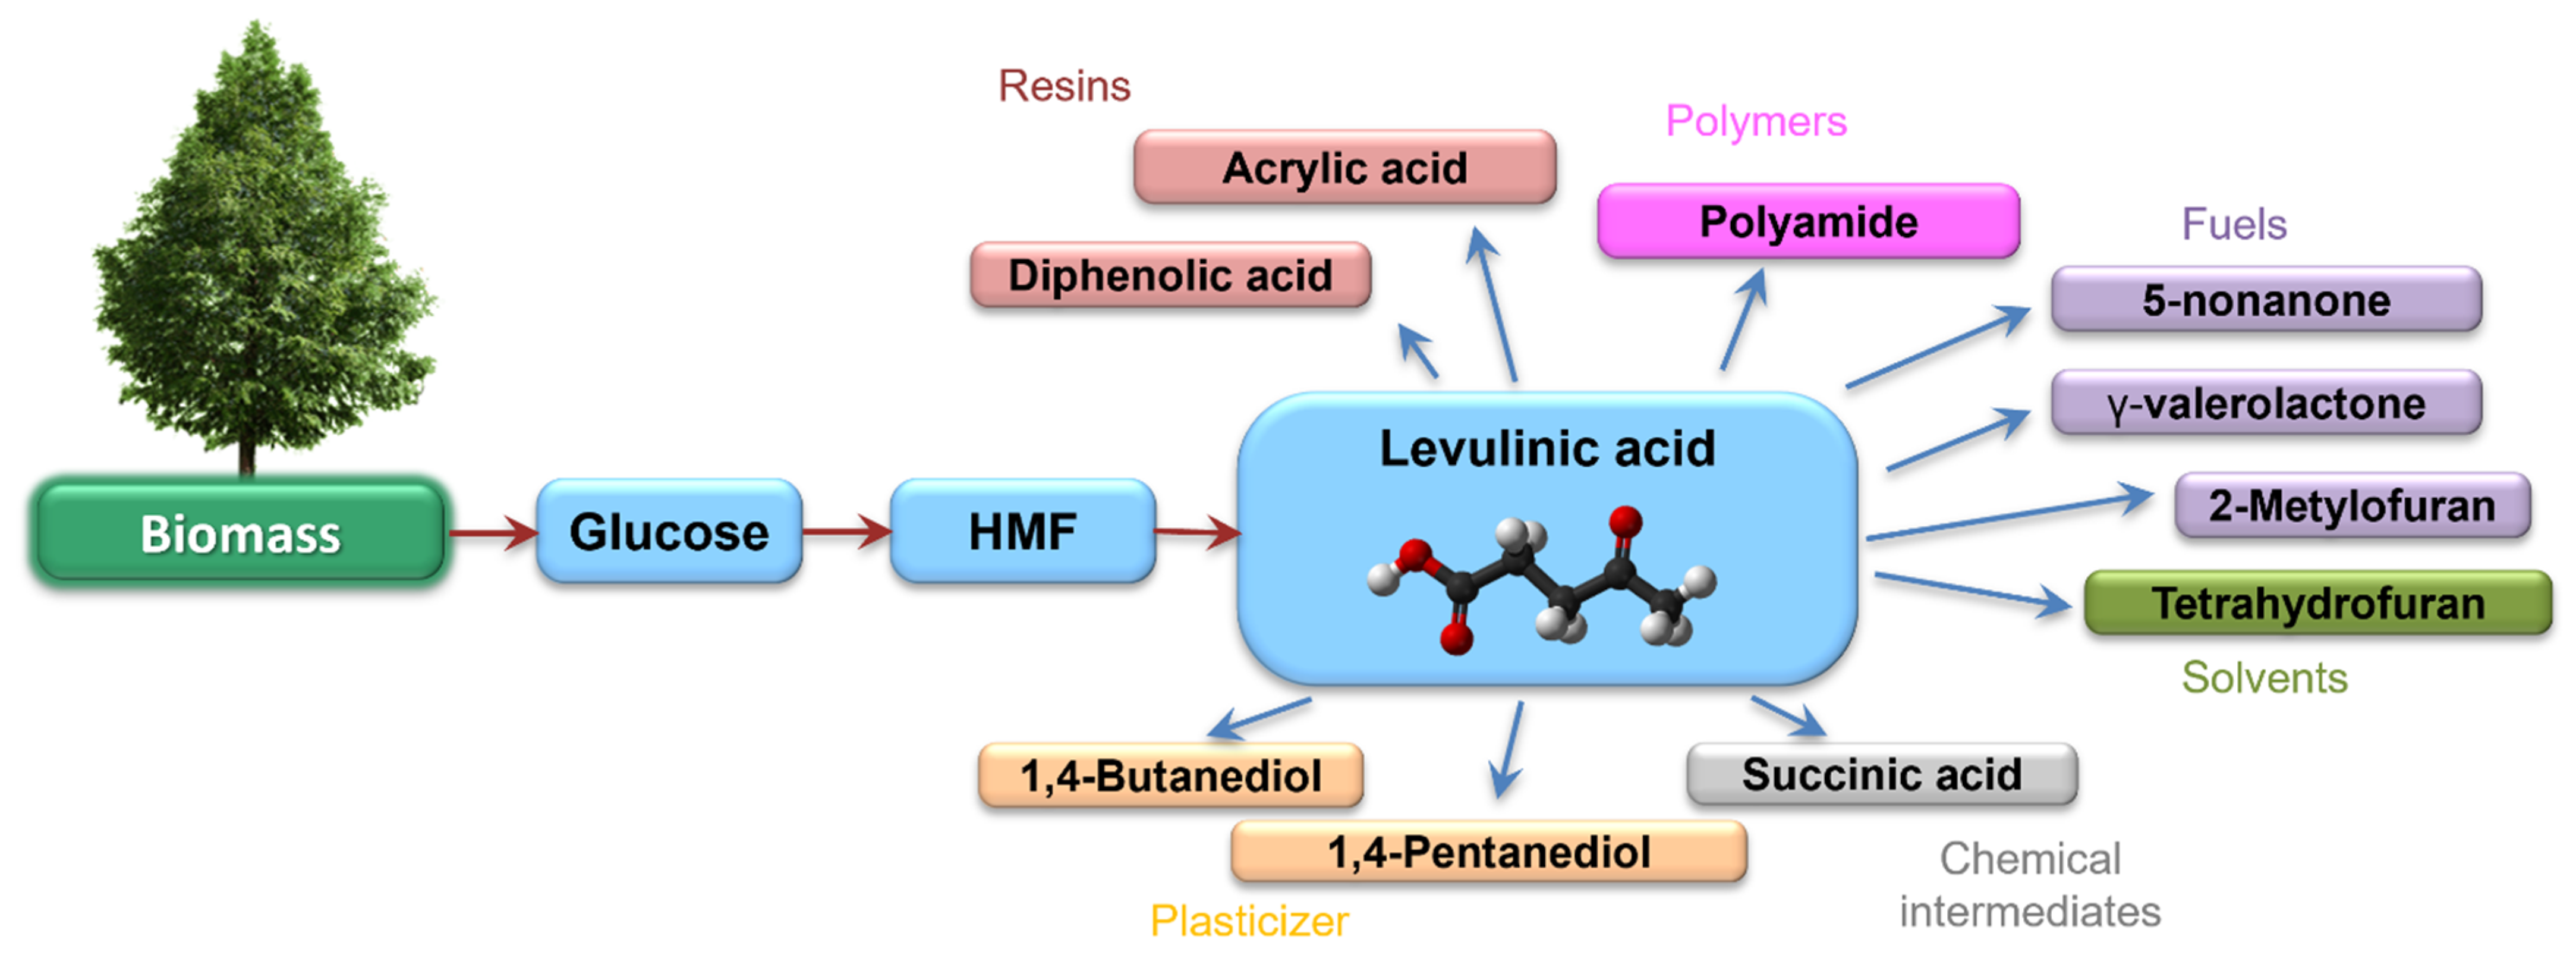
Figure 1. Scheme of reaction pathways of biomass into glucose and levulinic acid, as well as its further derivatives.
Processes 10 00223 g001
Figure 2. Diffractograms of control Na-BEA samples.
Processes 10 00223 g002
Figure 3. Nitrogen adsorption and desorption isotherms for synthetic Na-BEA zeolite.
Processes 10 00223 g003
Figure 4. ATR-FTIR for Na-BEA zeolite.
Processes 10 00223 g004
Figure 5. SEM for Na-BEA zeolite with EDS analysis (a) and distribution of Al, Si and Na in Na-BEA zeolite (b).
Processes 10 00223 g005
Figure 6. The results of HPLC analysis for the catalytic conversion of glucose using homogeneous H2SO4 catalyst in the liquid phase, 2 h process and at 220 °C.
Processes 10 00223 g006
Figure 7. The results of HPLC analysis for the catalytic conversion of glucose over Na-BEA catalyst in the liquid phase for different process time and temperature: (a) 5 h and 200 °C; (b) 2 h and 220 °C; (c) 1 h and 250 °C.
Processes 10 00223 g007
Figure 8. Summary of results based on HPLC analysis for homogeneous catalysis during glucose conversion. The results are related to the selectivity to the given product.
Processes 10 00223 g008
Figure 9. Summary of results based on HPLC analysis for heterogeneous catalysis during glucose conversion. The results are related to the selectivity to the given product.
Processes 10 00223 g009
Table 1. Physicochemical properties of the commercial zeolite BEA (Clariant).
ParametersUnit
Crystal structureIUPACBEA
BET aream2/g544
Nappm40
Cppm30
Silicon module 24.7
Table 2. BET analysis results for Na-BEA zeolite.
SampleSBET [m2/g]Vp total [cm3/g]Vp micro [cm3/g]
Na-BEA5470.600.14
Table 3. The results of HPLC analysis for the catalytic conversion of glucose using homogeneous H2SO4 catalyst in the liquid phase, 2 h process and at 220 °C.
Catalyst
Concentration [M]
GLU Conversion [%]Volume of 10% NaOH for Neutralization [mL]Selectivity [%]Yield to LA [%]
LAOthers
0.11000.3767.738.367.7
0.21000.7527.172.927.1
0.51001.882.297.82.2
11003.766.893.26.8
where others mean oxalic acid and pyruvic acid.
Table 4. The results of HPLC analysis for the catalytic conversion of glucose over Na-BEA catalyst in the liquid phase.
Catalyst Weight [g]Process Temp. [°C]Process Time [h]GLU Conversion [%]Selectivity [%]Yield to LA [%]
LALAC FADHAFUROthers
0.6200510054.819.4--15.8-64.8
0.12005100100-----100
0.6220210062.816.2-4.416.7-62.8
0.1220210055.327.1-4.213.4-55.3
0.6250177.961.422.516.1---37.2
0.1250110060.819.78.311.3 -60.8
where GLU = glucose, LA = levulinic acid, LAC = lactic acid, FA = formic acid, DHA = dihydroxyacetone, FUR = furfural.
Publisher’s Note: MDPI stays neutral with regard to jurisdictional claims in published maps and institutional affiliations.