
A Thermodynamic Analysis of Naphtha Catalytic Reforming Reactions to Produce High-Octane Gasoline

Abstract
:1. Introduction
2. Methodology
2.1. Problem Delimitation
2.2. Thermodynamic Analysis
2.3. Standard Gibbs-Energy Change of Reaction
Calculation of the Fugacity Coefficients
2.4. Composition of the Catalytic Reforming Products
3. Results and Discussion
3.1. Temperature Effect
3.2. Pressure Effect
3.3. Effect of the H2/HC Ratio
3.4. Aromatics Distribution
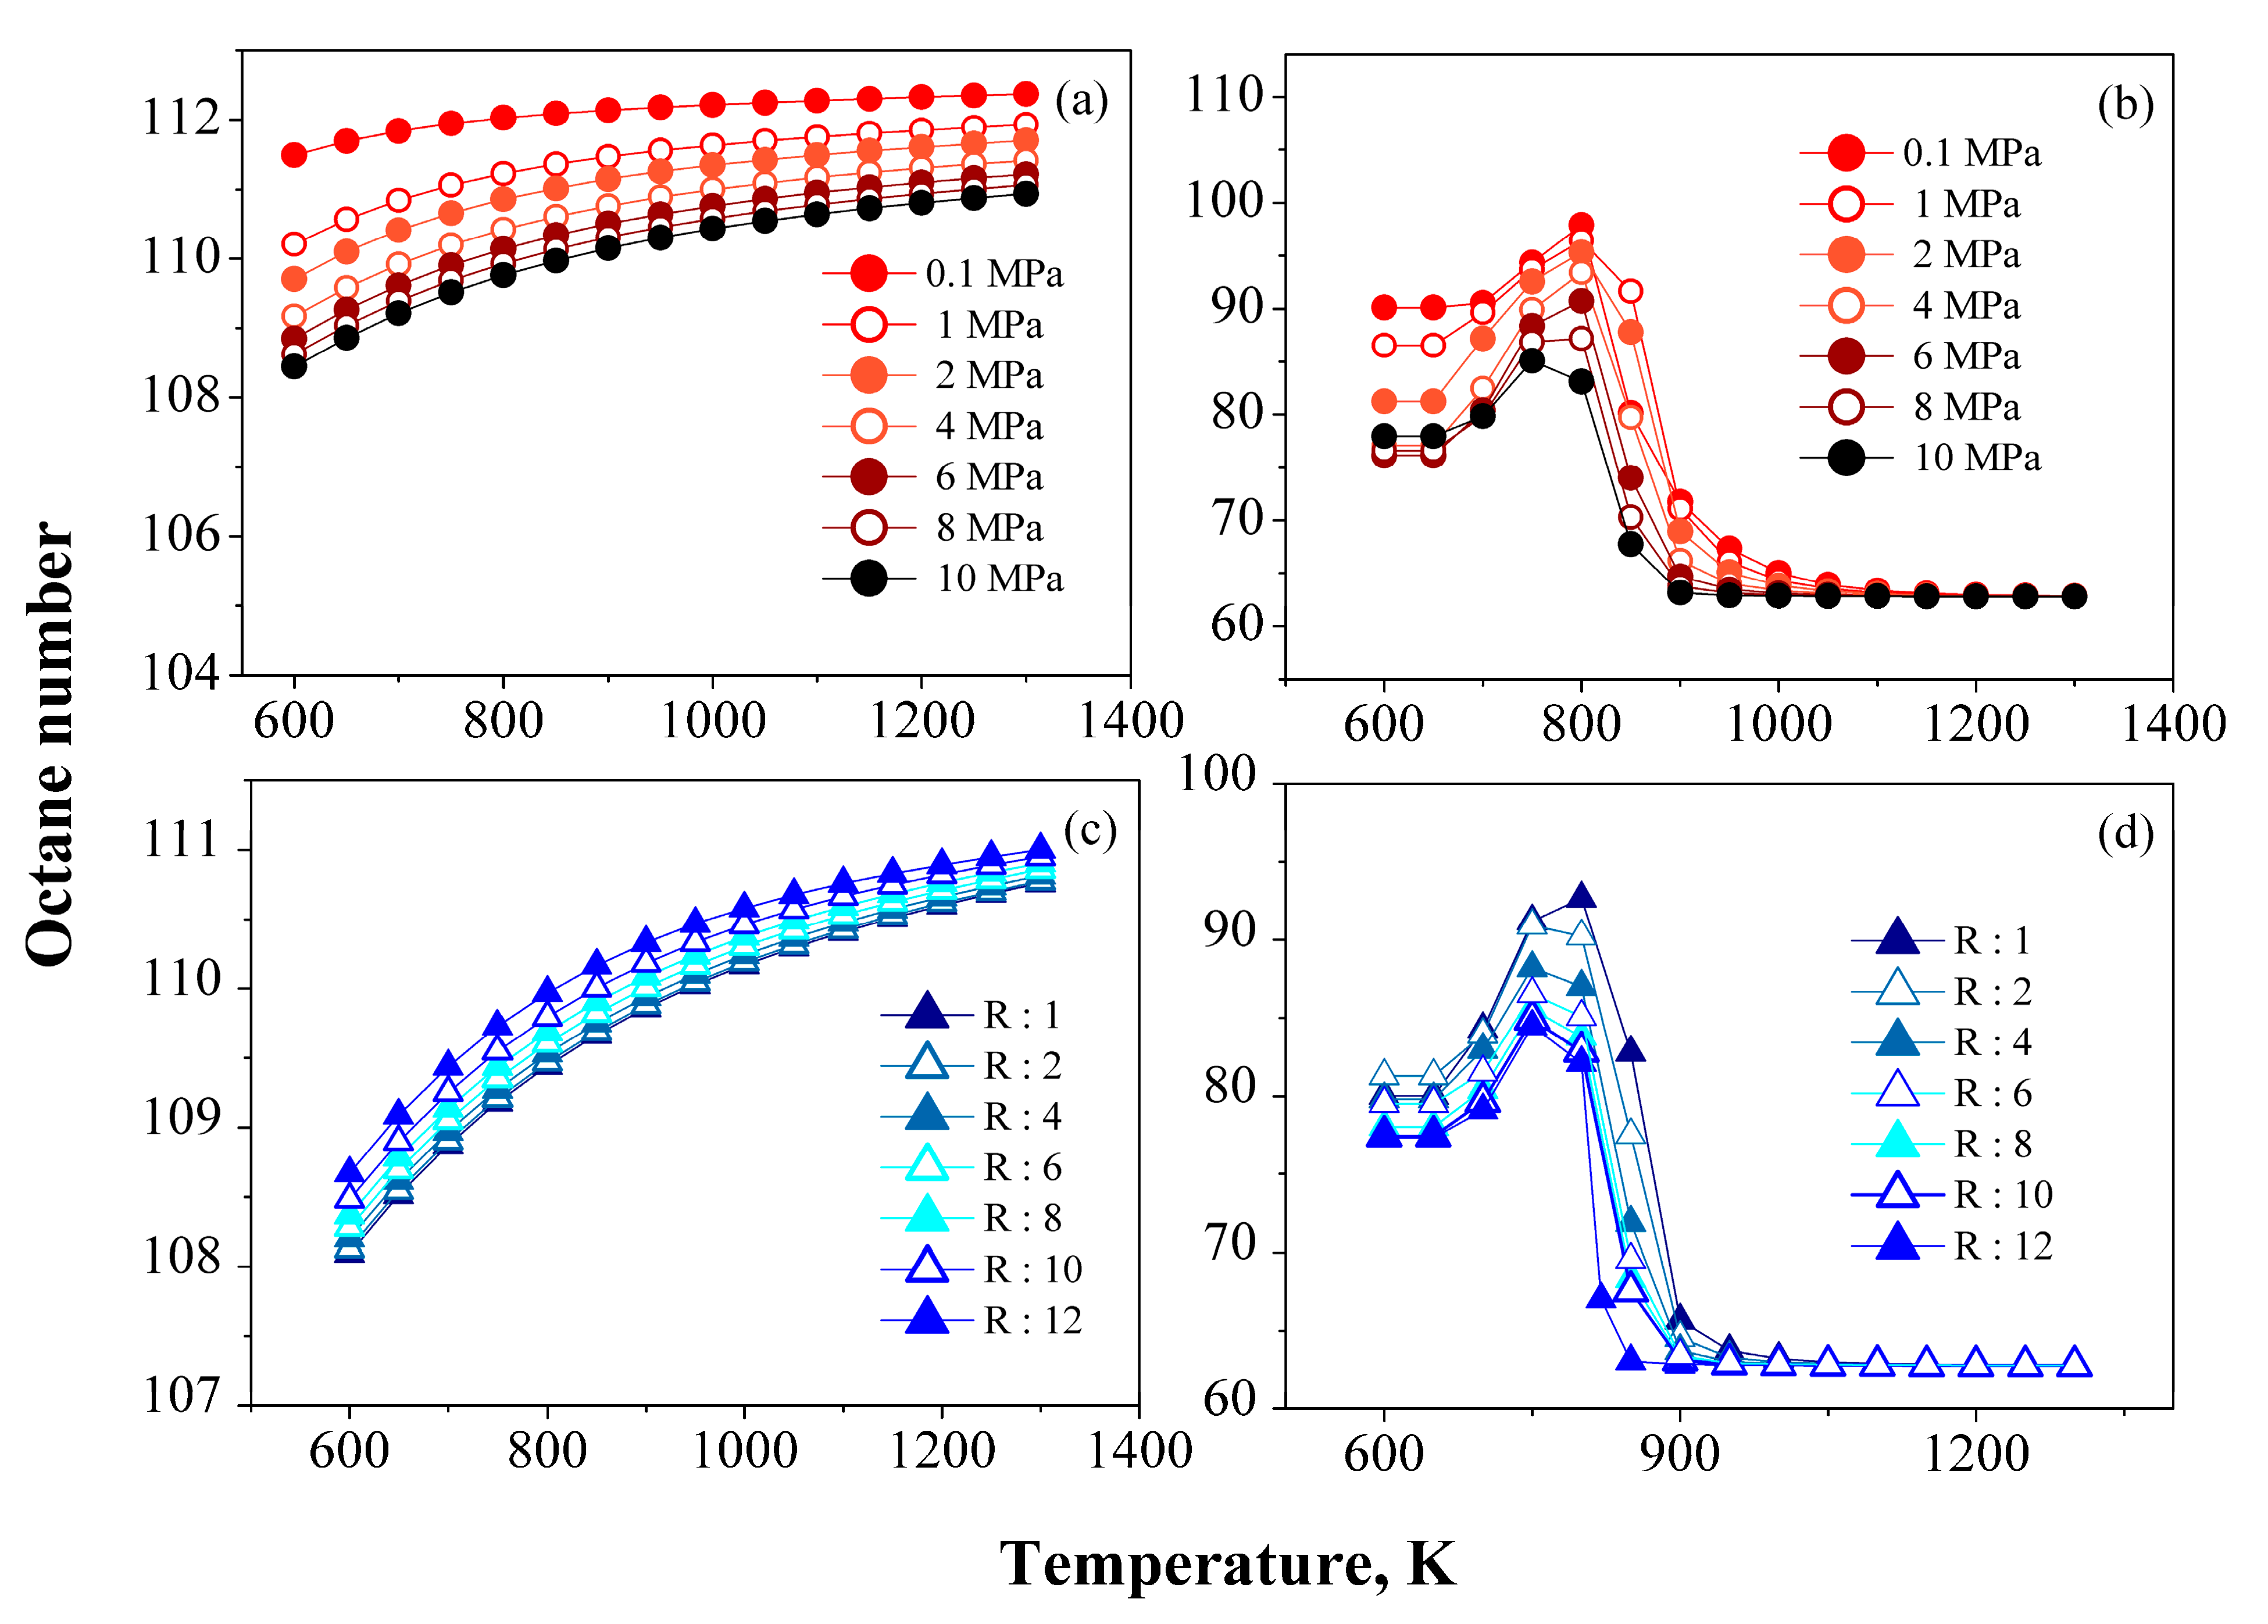
3.5. Research Octane Number
4. Conclusions
Author Contributions
Funding
Institutional Review Board Statement
Informed Consent Statement
Acknowledgments
Conflicts of Interest
Nomenclature
| Number of gram atoms of element j in a mole of species i | |
| Cross section of flow in reactor | |
| Sum of A coefficients in Table 3, according to reaction stoichiometry | |
| Matrix of ’s | |
| Sum of B coefficients in Table 3, according to reaction stoichiometry | |
| B value of the i-th component of the mixture | |
| Sum of C coefficients in Table 3, according to reaction stoichiometry | |
| Standard heat-capacity change of reaction | |
| Dehydrogenation of naphthenes | |
| Dehydrocyclization of paraffins | |
| Diameter of catalyst particle | |
| Sum of D coefficients in Table 3, according to reaction stoichiometry | |
| Activation energy | |
| Deactivation energy | |
| Sum of E coefficients in Table 3, according to reaction stoichiometry | |
| Molar flow | |
| G | Light gases in Figure 1 Superficial mass flux, kg/s·m2 in Equation (7) |
| Standard Gibbs-energy change of reaction at temperature T | |
| Standard Gibbs-energy change of reaction at reference temperature T0 (298 K) | |
| Standard Gibbs-energy change of formation of species i | |
| Standard heat of reaction at reference temperature T0 (298 K) | |
| Hydrocracking | |
| Carbon number: 6, 7, and 8+ | |
| ip | Iso-paraffins |
| Isomerization of paraffins | |
| Total number of atomic elements | |
| Equilibrium constant | |
| Deactivation constant | |
| Preexponential factor for the dehydrogenation reactions | |
| Preexponential factor for the dehydrocyclization reactions | |
| Preexponential factor for the hydrocracking reactions | |
| Preexponential factor for the isomeration reactions | |
| Deactivation order | |
| np | Normal paraffins |
| Total number of species in the reaction mixture. Naphthenes in Figure 1 | |
| Total Gibbs free energy of the system | |
| Number of moles of specie i | |
| P | Total pressure of the system |
| Partial pressure | |
| Critical pressure | |
| Reduced pressure | |
| Gas constant | |
| Reaction rate | |
| Research Octane Number | |
| t | Time-on-stream |
| Temperature of the system Temperature for RON calculations defined in Equation (28) | |
| Boiling point, K | |
| Critical temperature | |
| Reduced temperature | |
| Volumetric fraction of aromatic i | |
| Volumetric fraction of iso-paraffin i | |
| Volumetric fraction of naphthene i | |
| Volumetric fraction of normal paraffin i | |
| Volumetric fraction of olefin i | |
| Mol fraction of species i | |
| Weight of catalyst | |
| Compressibility factor | |
| Greek letters | |
| Adsorption term for the acid function | |
| Adsorption term for the metal function | |
| Viscosity of the mixture | |
| Density of the mixture | |
| Density of solid catalyst | |
| Bed void fraction | |
| Catalyst activity | |
| Fugacity coefficient of species i in the gas mixture |
References
- Maadah, G. Calculated Chemical Reaction Equilibrium for The Claus Process; Oklahoma State University: Stillwater, OK, USA, 1978. [Google Scholar]
- White, W.B.; Johnson, S.M.; Dantzig, G.B. Chemical Equilibrium in Complex Mixtures. J. Chem. Phys. 1958, 28, 751–755. [Google Scholar] [CrossRef]
- Tsanas, C. Simultaneous Chemical and Phase Equilibrium Calculations with Non-Stoichiometric Method. Ph.D. Thesis, Technical University of Denmark, Lyngby, Denmark, 2018. [Google Scholar]
- Gao, J.; Wang, Y.; Ping, Y.; Hu, D.; Xu, G.; Gu, F.; Su, F. A thermodynamic analysis of methanation reactions of carbon oxides for the production of synthetic natural gas. RSC Adv. 2012, 2, 2358–2368. [Google Scholar] [CrossRef]
- Lwin, Y. Chemical Equilibrium by Gibbs Energy Minimization on Spreadsheets. Int. J. Eng. Educ. 2000, 16, 335–339. [Google Scholar]
- Bonilla-Petriciolet, A.; Rangaiah, G.P.; Segovia-Hernández, J.G. Constrained and unconstrained Gibbs free energy minimization in reactive systems using genetic algorithm and differential evolution with tabu list. Fluid Phase Equilibria 2011, 300, 120–134. [Google Scholar] [CrossRef]
- Teh, Y.; Rangaiah, G. A Study of Equation-Solving and Gibbs Free Energy Minimization Methods for Phase Equilibrium Calculations. Chem. Eng. Res. Des. 2002, 80, 745–759. [Google Scholar] [CrossRef]
- Seider, W.D.; Widagdo, S. Multiphase equilibria of reactive systems. Fluid Phase Equilibria 1996, 123, 283–303. [Google Scholar] [CrossRef]
- Koukkari, P.; Pajarre, R. Calculation of constrained equilibria by Gibbs energy minimization. Calphad 2006, 30, 18–26. [Google Scholar] [CrossRef]
- Lwin, Y.; Ramli, W.; Daud, W.; Mohamad, A.B.; Yaakob, Z. Hydrogen production from steam methanol reforming: Thermodynamic analysis. Int. J. Hydrogen Energy 2000, 25, 47–53. [Google Scholar] [CrossRef]
- Adhikari, S.; Fernando, S.; Haryanto, A. A Comparative Thermodynamic and Experimental Analysis on Hydrogen Production by Steam Reforming of Glycerin. Energy Fuels 2007, 21, 2306–2310. [Google Scholar] [CrossRef]
- Rossi, C.; Alonso, C.; Antunes, O.; Guirardello, R.; Cardozo-Filho, L. Thermodynamic analysis of steam reforming of ethanol and glycerine for hydrogen production. Int. J. Hydrogen Energy 2009, 34, 323–332. [Google Scholar] [CrossRef]
- Wai, C.M.; Hutchison, S.G. Free energy minimization calculation of complex chemical equilibria: Reduction of silicon dioxide with carbon at high temperature. J. Chem. Educ. 1989, 66. [Google Scholar] [CrossRef]
- Figueira, C.; Soares, R.; Lobato, F.; Steffen, V. A Comparative Study of Gibbs Free Energy Minimization in a Real System Using Heuristic Methods. Comput. Aided Chem. Eng. 2009, 27, 1059–1064. [Google Scholar] [CrossRef]
- Ancheyta-Juárez, J.; Villafuerte-Macías, E. Experimental validation of a kinetic model for naphtha reforming. Stud. Surf. Sci. Catal. 2001, 615–618. [Google Scholar] [CrossRef]
- Zagoruiko, A.N.; Belyi, A.S.; Smolikov, M.D. Thermodynamically Consistent Kinetic Model for the Naphtha Reforming Process. Ind. Eng. Chem. Res. 2021, 60, 6627–6638. [Google Scholar] [CrossRef]
- Hu, Y.; Su, H.; Chu, J. Modeling, simulation and optimization of commercial naphtha catalytic reforming process. In Proceedings of the 42nd IEEE International Conference on Decision and Control (IEEE Cat. No.03CH37475), Maui, HI, USA, 9–12 December 2003. [Google Scholar] [CrossRef]
- Rodríguez, M.A.; Ancheyta, J. Detailed description of kinetic and reactor modeling for naphtha catalytic reforming. Fuel 2011, 90, 3492–3508. [Google Scholar] [CrossRef]
- Ross, J.R. Catalysis in the Production of Energy Carriers from Oil; Elsevier: Amsterdam, The Netherlands, 2018; pp. 233–249. [Google Scholar] [CrossRef]
- Rahimpour, M.R.; Jafari, M.; Iranshahi, D. Progress in catalytic naphtha reforming process: A review. Appl. Energy 2013, 109, 79–93. [Google Scholar] [CrossRef]
- Joseph, M.; Smith, C.H.; van Ness, M.; Abbott, M.; Swihart, T. Introduction to Chemical Engineering Thermodynamics, 8th ed.; McGraw-Hill: Singapore, 2018. [Google Scholar]
- Walas, S.M. Phase Equilibra in Chemical Engineering; Butterworth-Heinemann: Oxford, UK, 1985. [Google Scholar]
- Chemical & Physical Properties by Cheméo. Available online: https://www.chemeo.com/ (accessed on 14 July 2021).
- Riazi, M.R. Characterization and Properties of Petroleum Fractions, 1st ed.; ASTM: Philadelphia, PA, USA, 2005. [Google Scholar]
- Turaga, U.T.; Ramanathan, R. Catalytic Naphtha Reforming: Revisiting Its Importance in the Modern Refinery. J. Sci. Ind. Res. 2003, 62, 963–978. [Google Scholar]
- Arani, H.M.; Shirvani, M.; Safdarian, K.; Dorostkar, E. Lumping procedure for a kinetic model of catalytic naphtha reforming. Braz. J. Chem. Eng. 2009, 26, 723–732. [Google Scholar] [CrossRef]
- Taskar, U.M. Modeling and Optimization of a Catalytic Naphtha Reformer; Texas Tech University: Lubbock, TX, USA, 1996. [Google Scholar]
- Prins, R.; Schuit, G.C.A. (Eds.) Chemistry and Chemical Engineering of Catalytic Processes; (NATO ASI series. Series E: Applied sciences; Vol. 39); Sijthoff & Noordhoff: Noordwijkerhout, The Netherland, 1980. [Google Scholar]
- Rigutto, M.S.; van Veen, R.; Huve, L. Zeolites in Hydrocarbon Processing. Stud. Surf. Sci. Catal. 2007, 168, 855–913, XXVI. [Google Scholar] [CrossRef]
- Ramírez, S.; Martínez, J.; Ancheyta, J. Kinetics of thermal hydrocracking of heavy oils under moderate hydroprocessing reaction conditions. Fuel 2013, 110, 83–88. [Google Scholar] [CrossRef]
- Castañeda, L.; Muñoz, J.; Ancheyta, J. Comparison of approaches to determine hydrogen consumption during catalytic hydrotreating of oil fractions. Fuel 2011, 90, 3593–3601. [Google Scholar] [CrossRef]
- Elsayed, H.A.; Menoufy, M.F.; Shaban, S.A.; Ahmed, H.S.; Heakal, B.H. Optimization of the reaction parameters of heavy naphtha reforming process using Pt-Re/Al2O3 catalyst system. Egypt. J. Pet. 2017, 26, 885–893. [Google Scholar] [CrossRef] [Green Version]
- Fink, J. Processes. In Guide to the Practical Use of Chemicals In Refineries and Pipelines; Gulf Professional Publishing: Houston, TX, USA, 2016; pp. 185–223. [Google Scholar] [CrossRef]
- Kjell, M.; Gunn, H.H.; Anne, H.; Ingunn, T.; Knut, G.; Anders, H. Effect of Reaction Pressure on Octane Number and Reformate and Hydrogen Yields in Catalytic Reforming. Ind. Eng. Chem. Res. 1996, 35, 99–105. [Google Scholar]
- Yusuf, A.Z.; John, Y.M.; Aderemi, B.O.; Patel, R.; Mujtaba, I.M. Effect of hydrogen partial pressure on catalytic reforming process of naphtha. Comput. Chem. Eng. 2020, 143, 107090. [Google Scholar] [CrossRef]
- Mazzieri, V.A.; Grau, J.M.; Vera, C.R.; Yori, J.C.; Parera, J.M.; Pieck, C.L. Role of Sn in Pt–Re–Sn/Al2O3–Cl catalysts for naphtha reforming. Catal. Today 2005, 107-108, 643–650. [Google Scholar] [CrossRef]
- Bishara, A.; Stanislaus, A.; Hussain, S.S. Effect of feed composition and operating conditions on catalyst deactivation and on product yield and quality during naphtha catalytic reforming. Appl. Catal. 1984, 13, 113–125. [Google Scholar] [CrossRef]
- George, J.A.; Aitani, A.M. Catalytic Naphtha Reforming, 2nd ed.; Marcel Dekker, Inc.: New York, NY, USA, 2004. [Google Scholar]
 ) CH4, (
  ) H2, (
  ) C2–C5, (
  ) Paraffins, (
  ) Naphthenes, (
  ) Aromatics.
) CH4, ( ) H2, ( ) C2–C5, ( ) Paraffins, ( ) Naphthenes, ( ) Aromatics.
) Aromatics.
) CH4, ( ) H2, ( ) C2–C5, ( ) Paraffins, ( ) Naphthenes, ( ) Aromatics.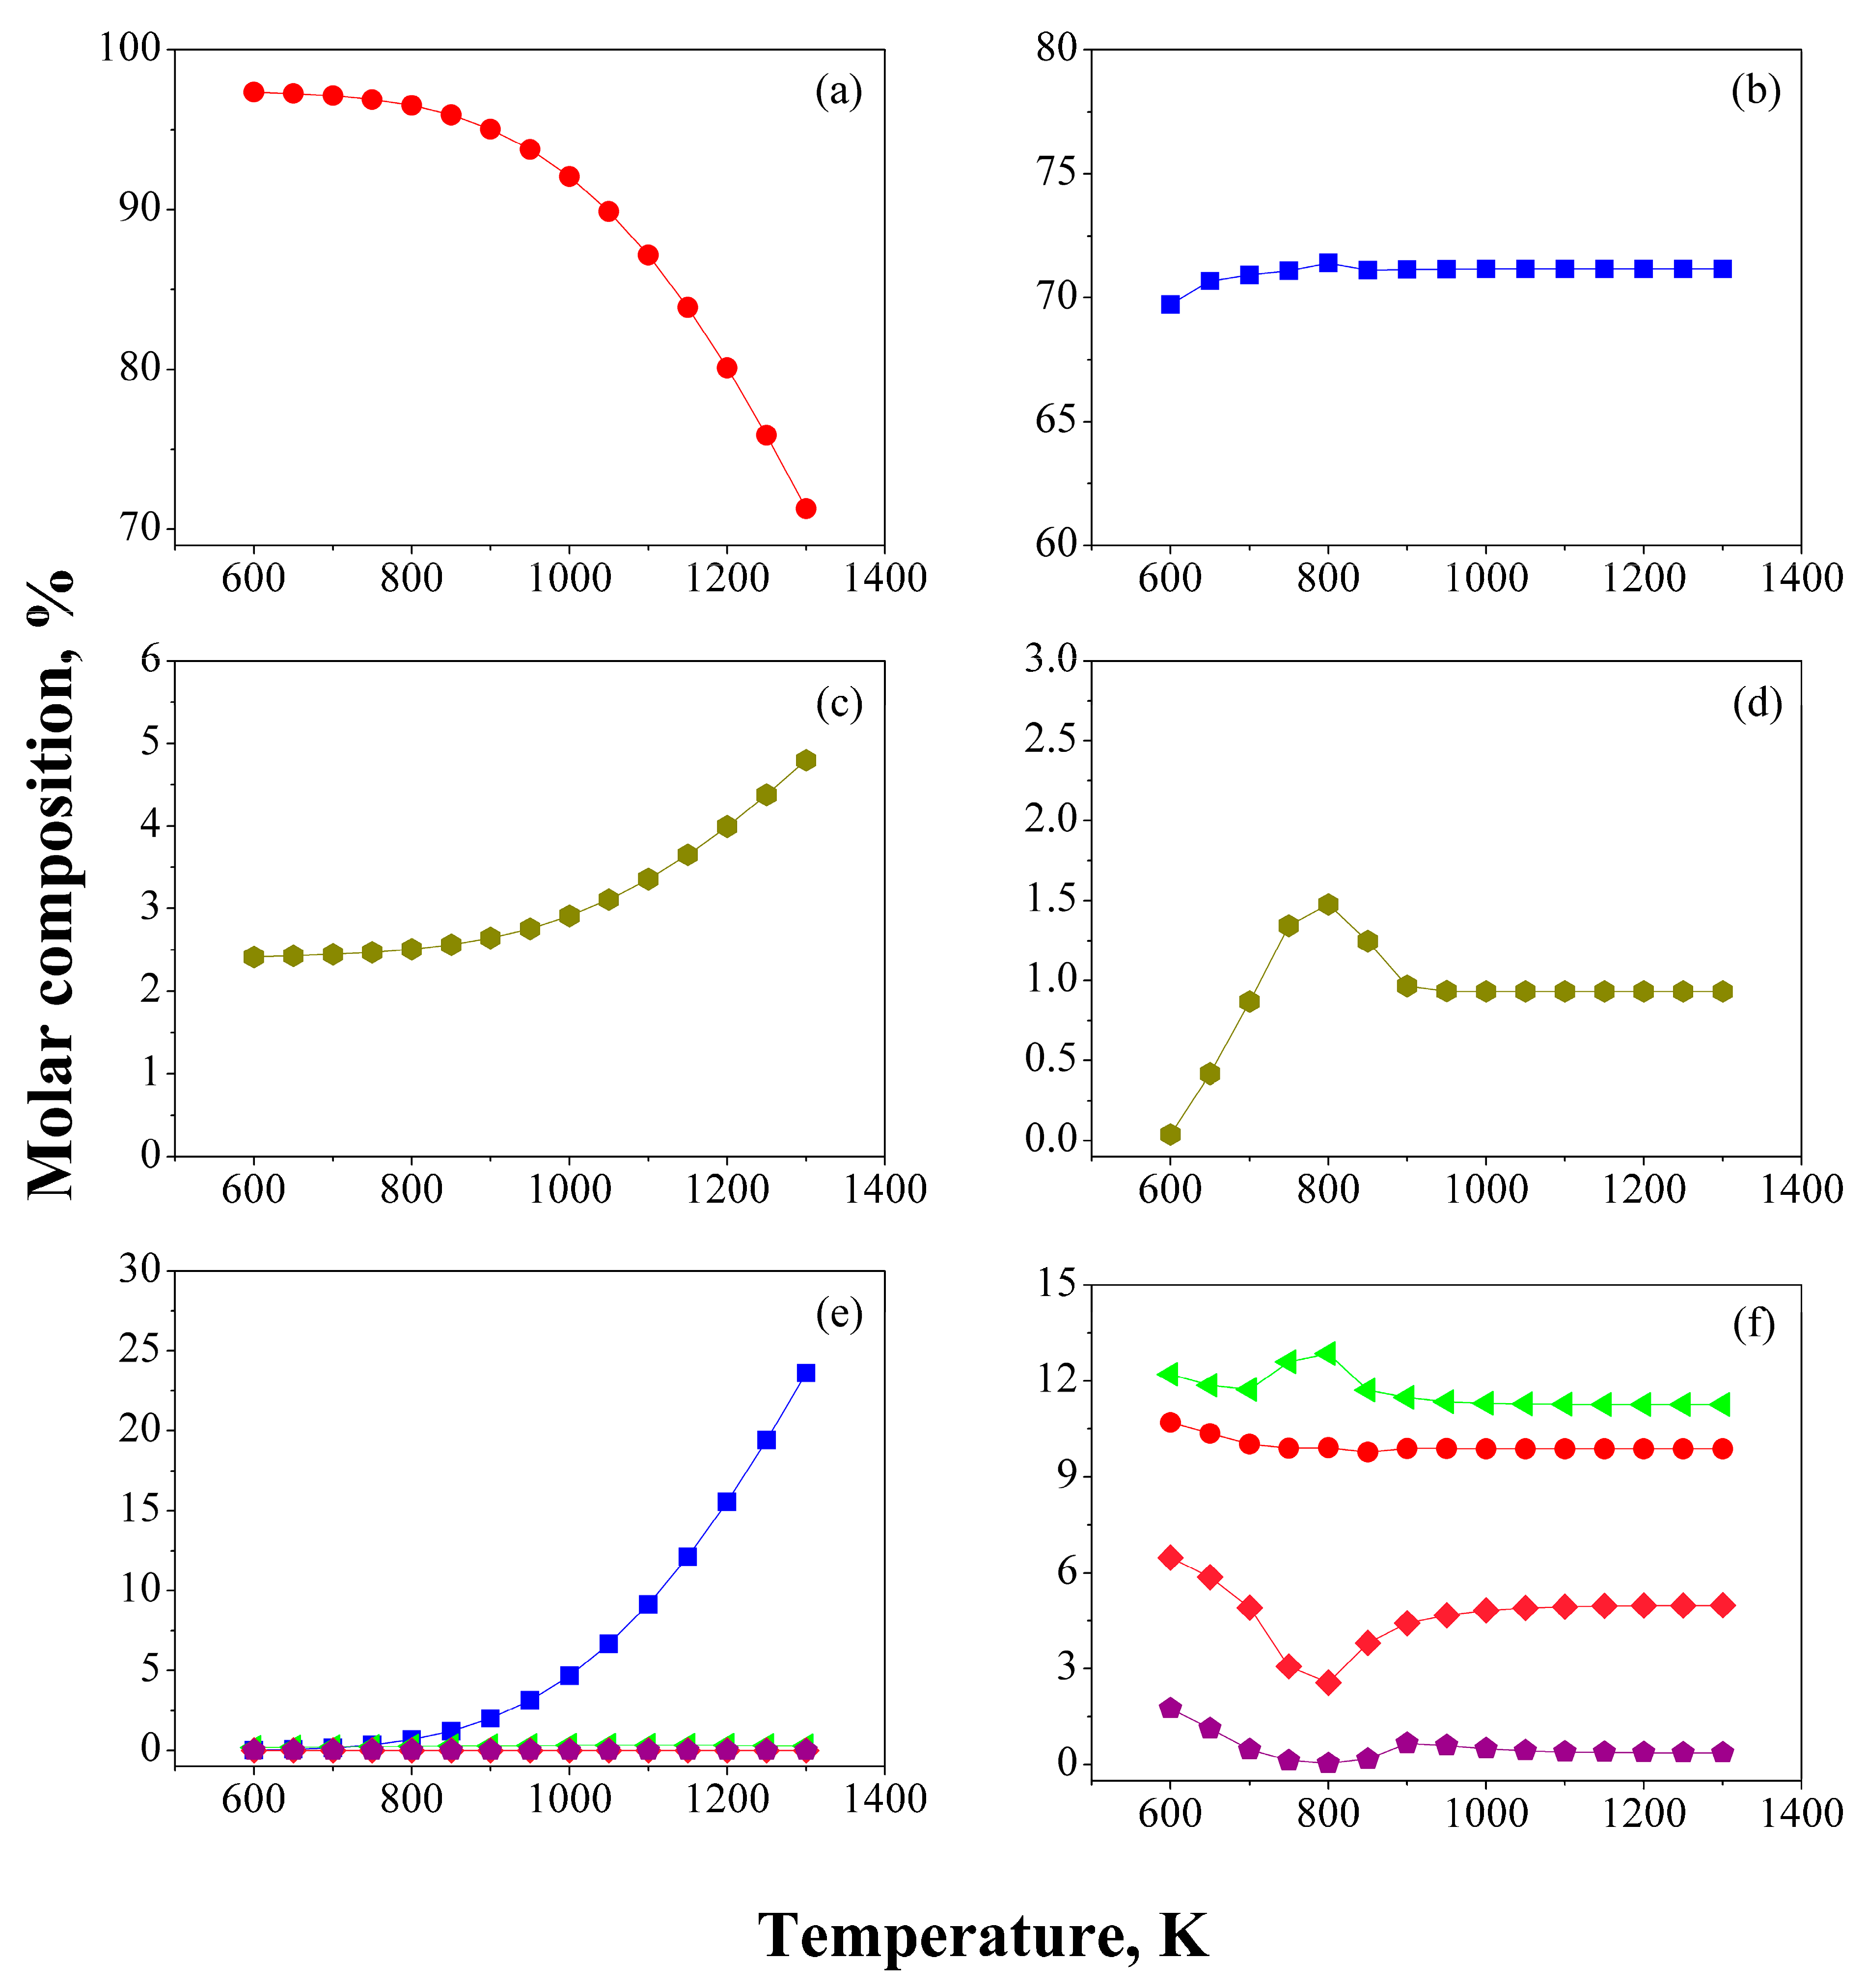 /
/  ) CH4, ( /
  ) H2, ( /
  ) C2–C5.
/ ) CH4, ( / ) H2, ( / ) C2–C5.
) C2–C5.
/ ) CH4, ( / ) H2, ( / ) C2–C5.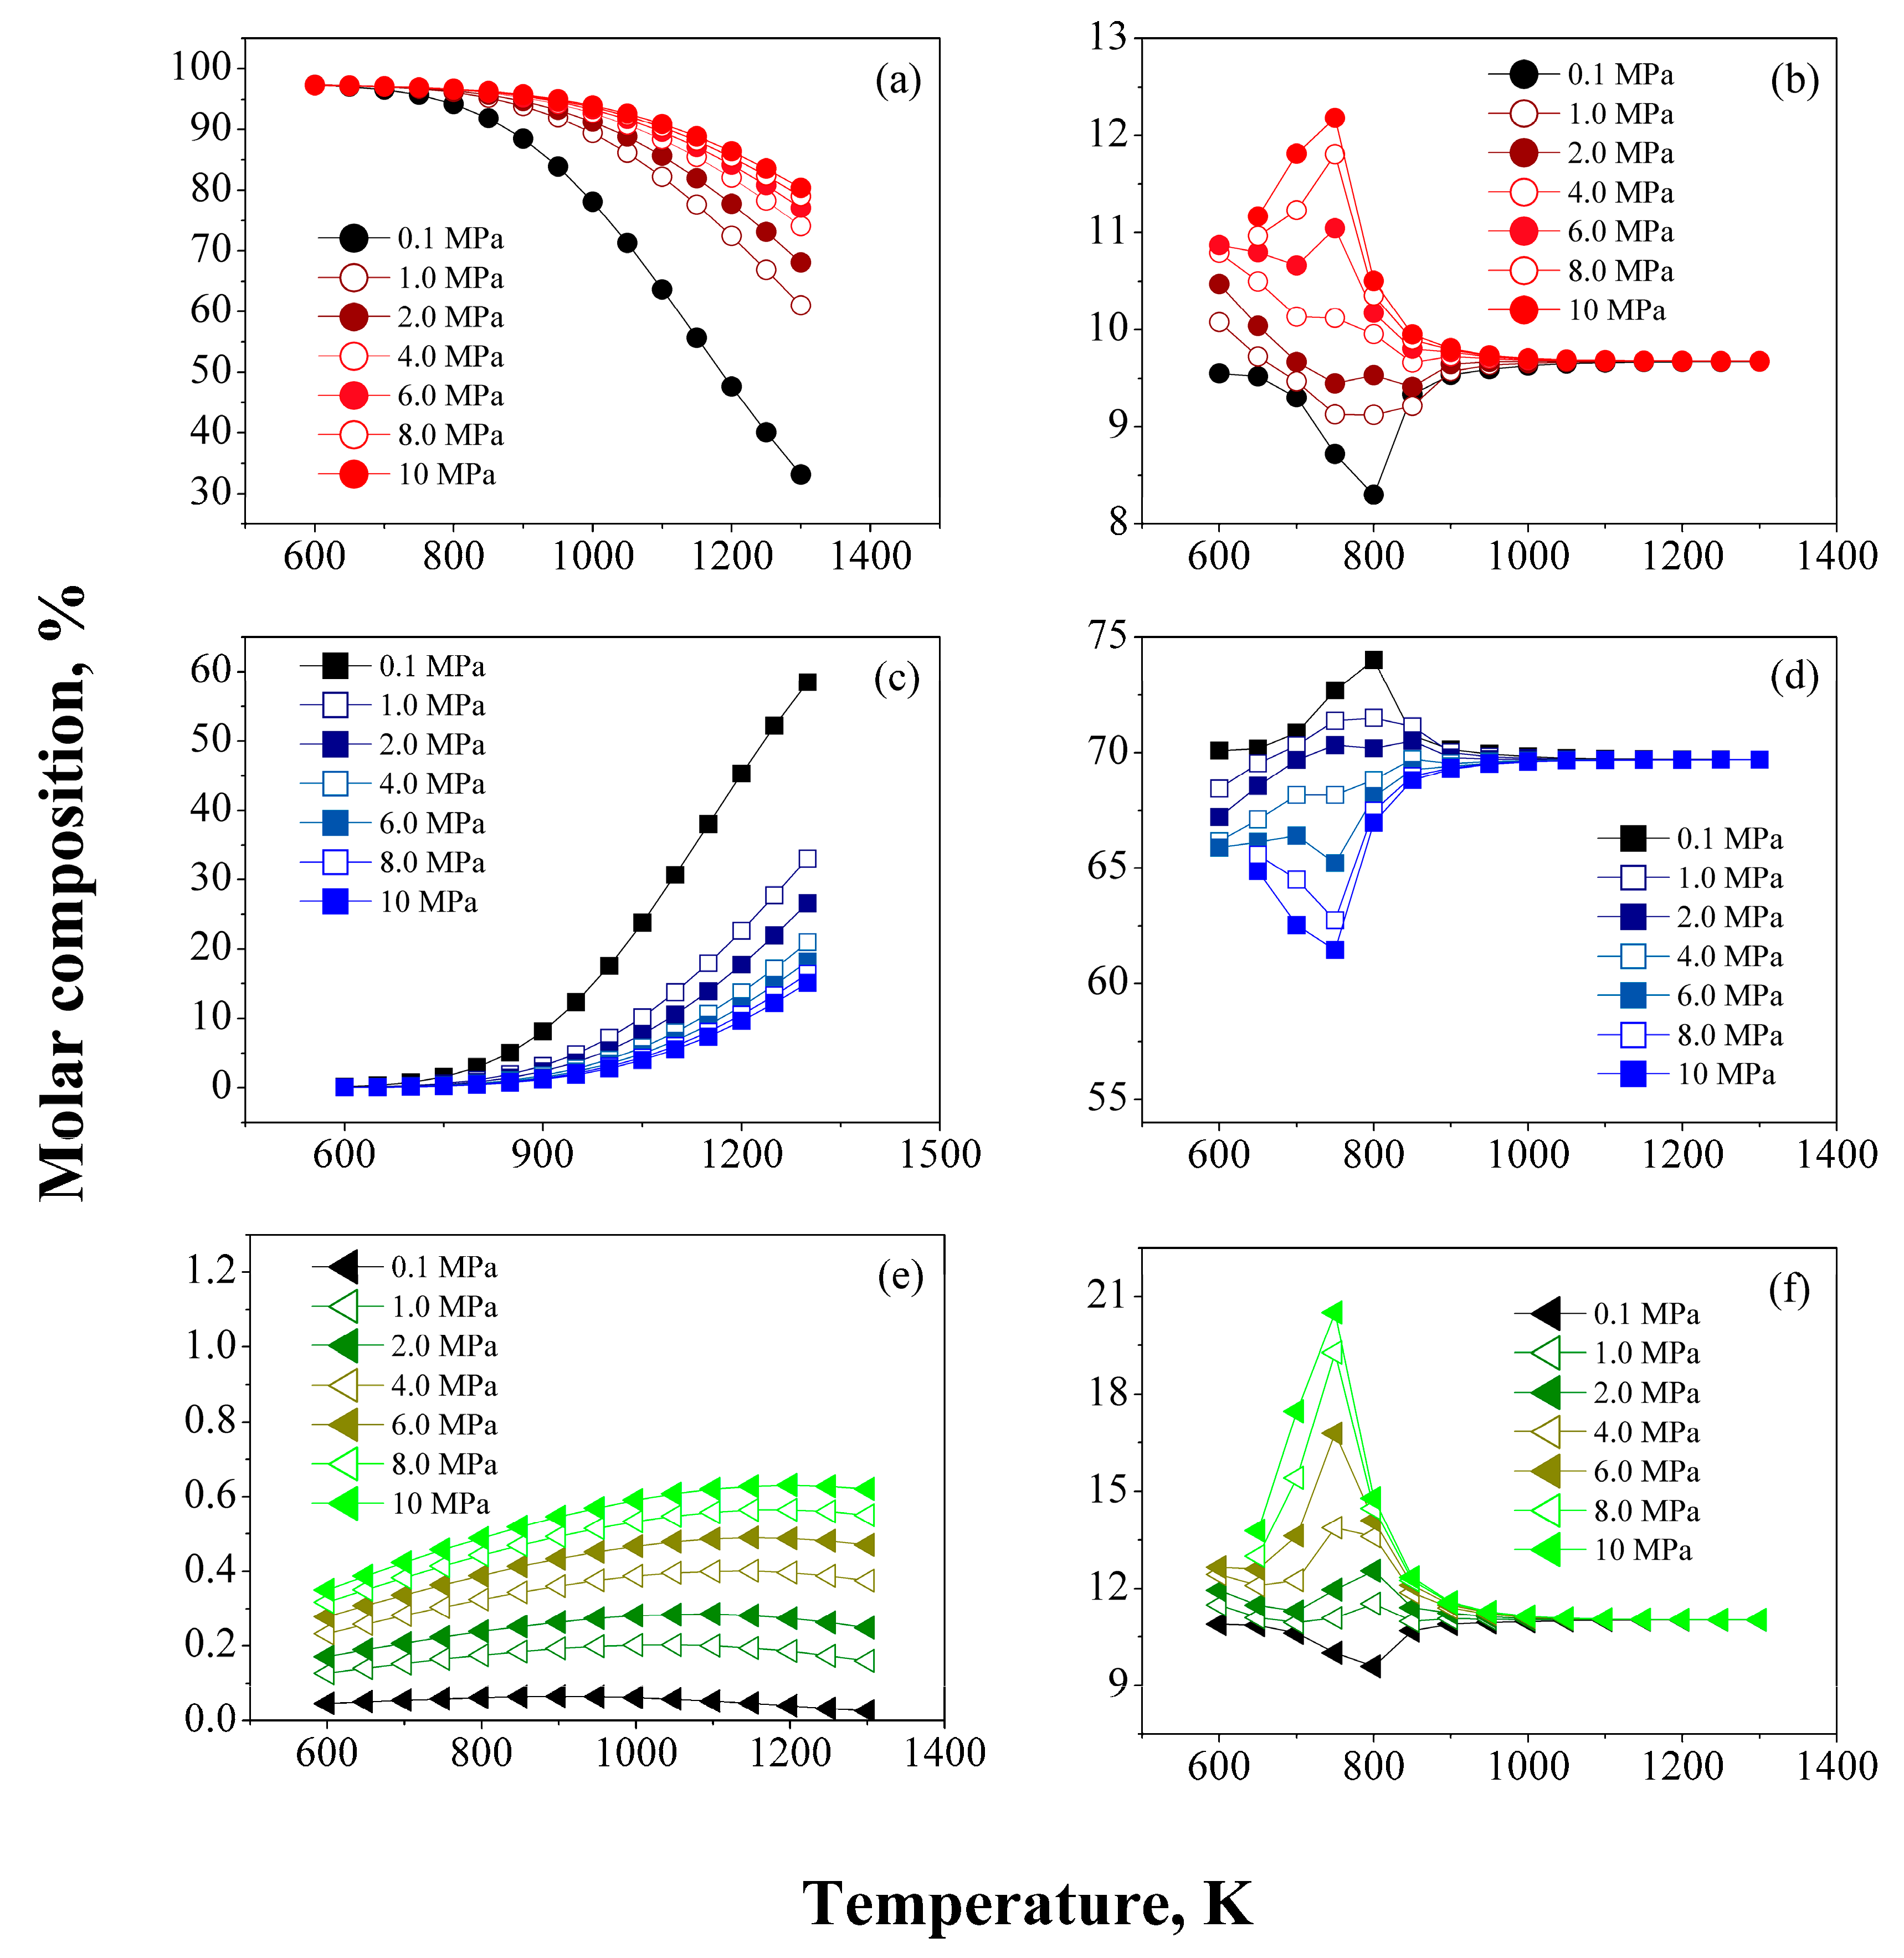 /
/  ) Paraffins, ( /
  ) Naphthenes, and ( /
  ) Aromatics.
/ ) Paraffins, ( / ) Naphthenes, and ( / ) Aromatics.
) Aromatics.
/ ) Paraffins, ( / ) Naphthenes, and ( / ) Aromatics.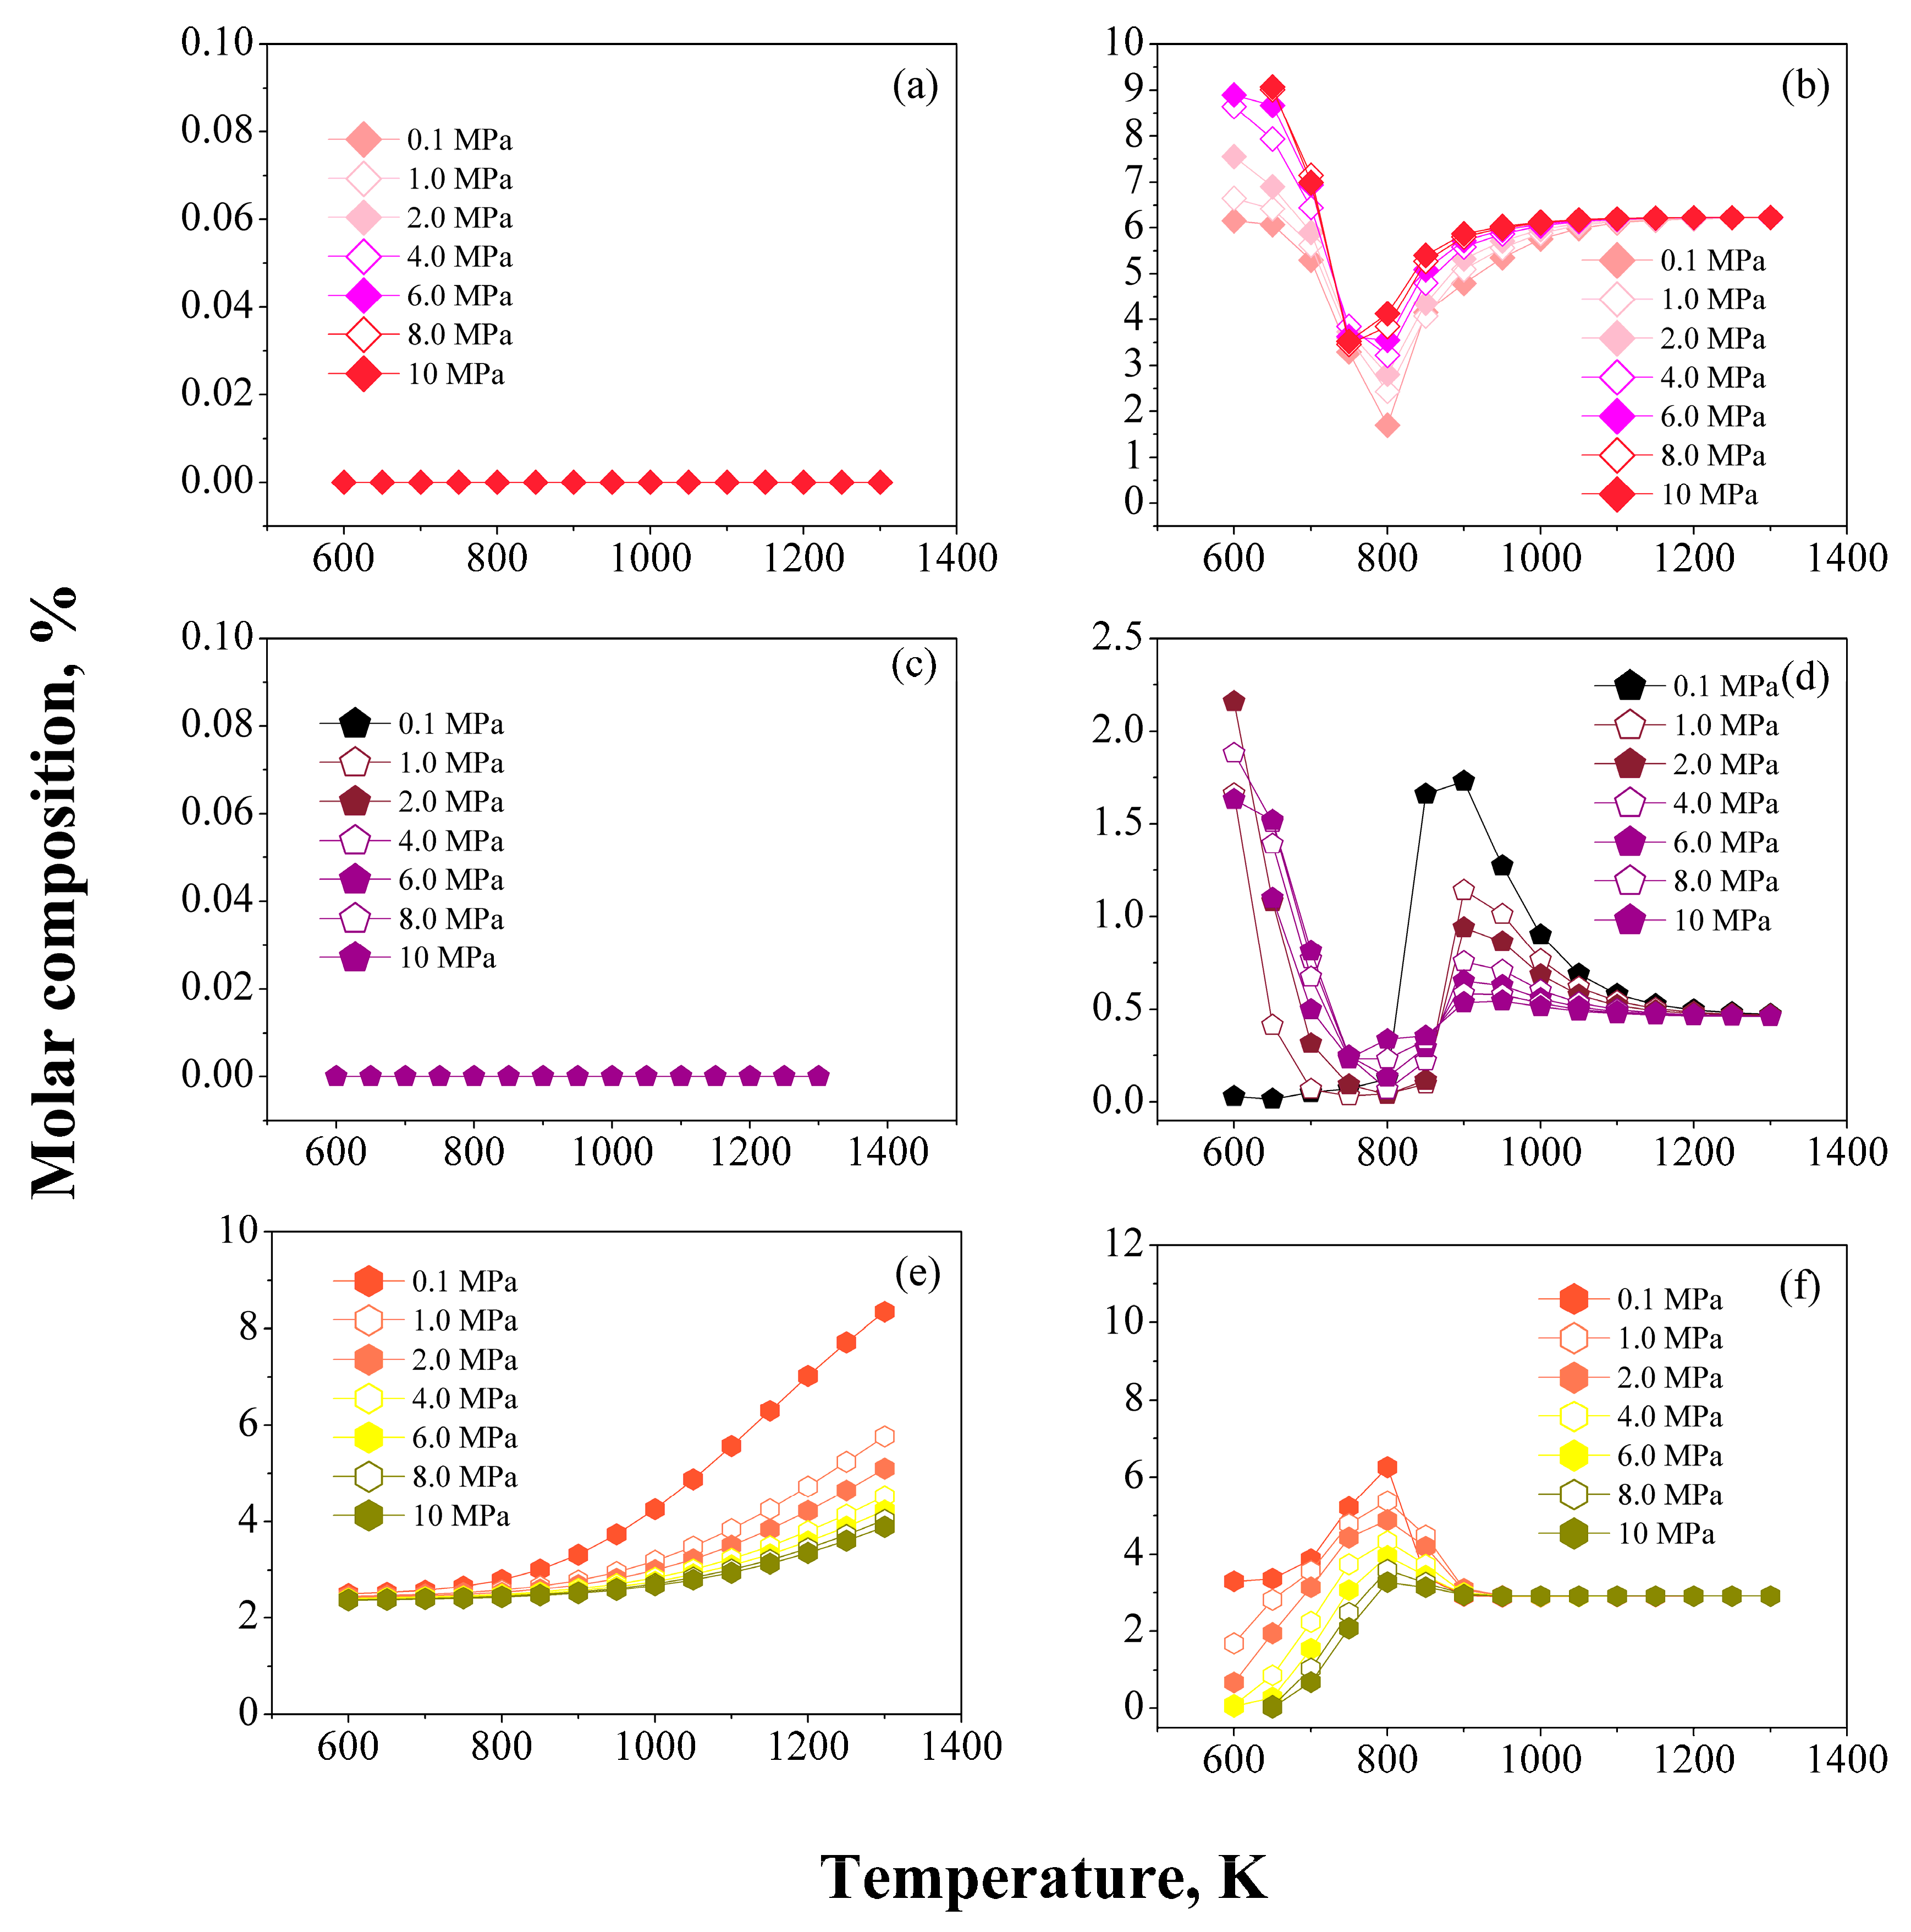 / ) CH4, ( / ) H2, ( / ) C2–C5.
/ ) CH4, ( / ) H2, ( / ) C2–C5.
/ ) CH4, ( / ) H2, ( / ) C2–C5. / ) Paraffins, ( / ) Naphthenes, and ( / ) Aromatics.
/ ) Paraffins, ( / ) Naphthenes, and ( / ) Aromatics.
/ ) Paraffins, ( / ) Naphthenes, and ( / ) Aromatics.
 /
/  ) C6 Aromatics, (
  /
/  ) C7 Aromatics, (
  /
/  ) C8 Aromatics.
/ ) C6 Aromatics, ( / ) C7 Aromatics, ( / ) C8 Aromatics.
) C8 Aromatics.
/ ) C6 Aromatics, ( / ) C7 Aromatics, ( / ) C8 Aromatics.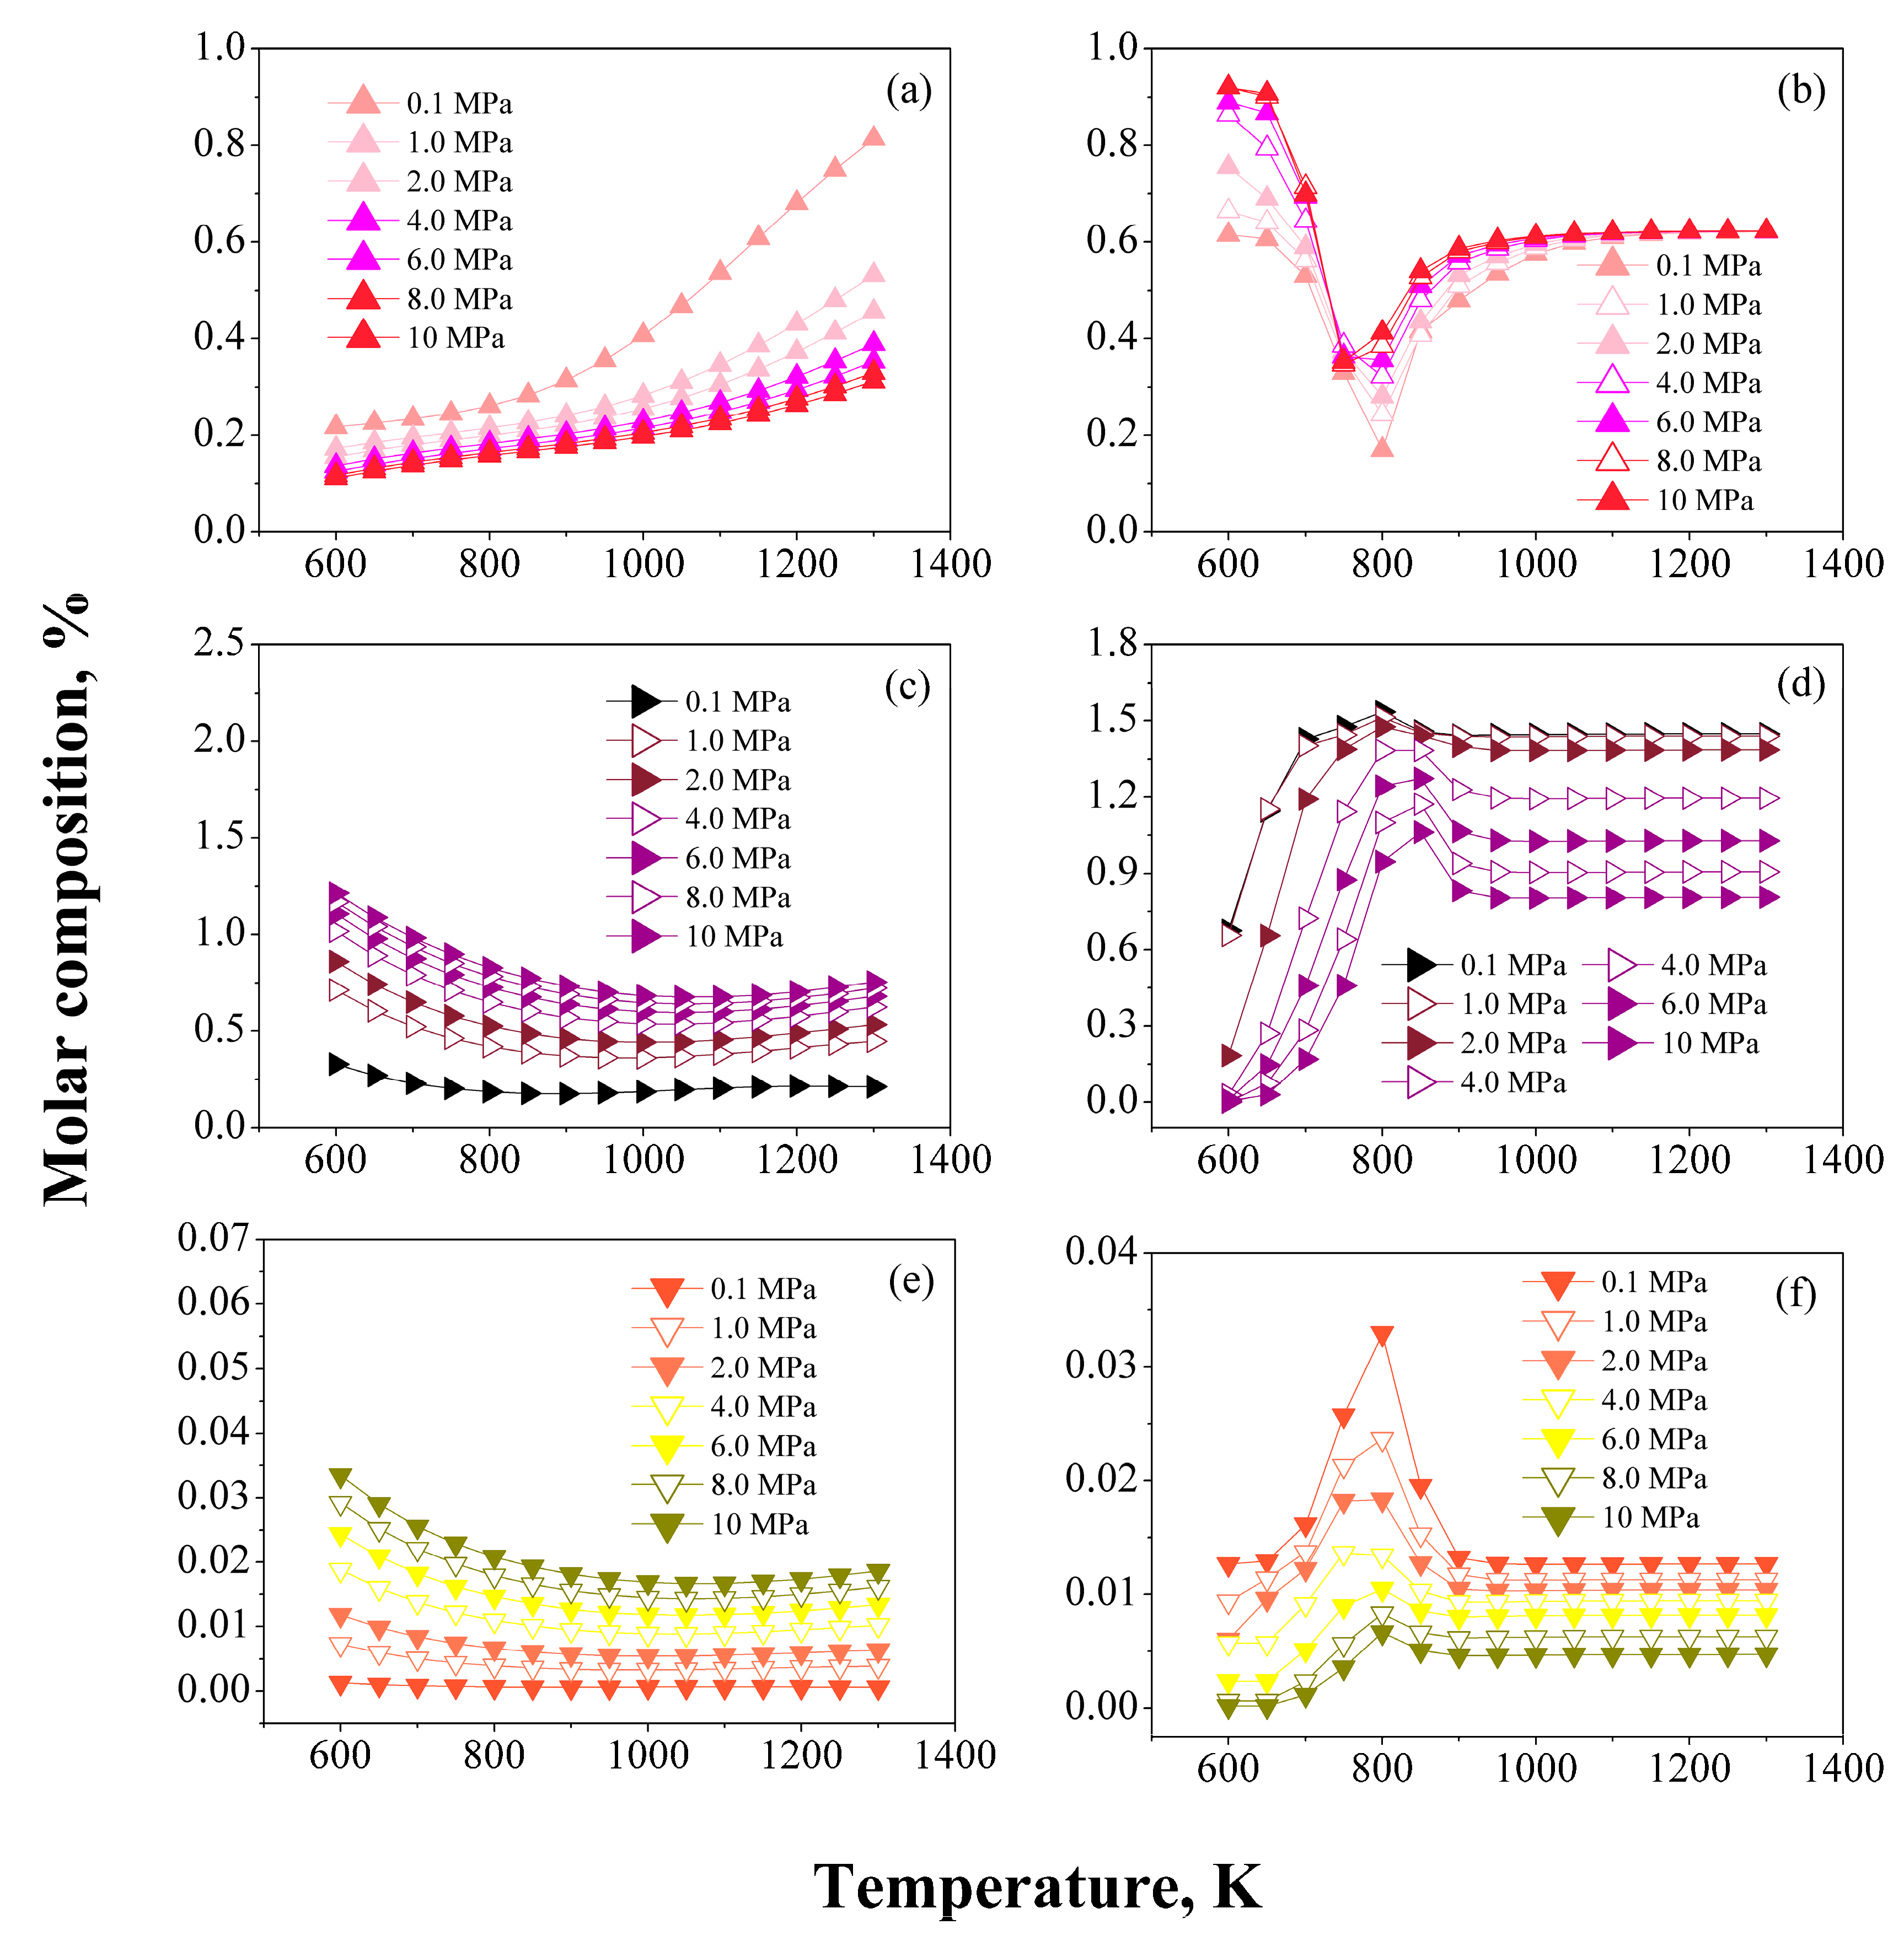 / ) C6 Aromatics, ( / ) C7 Aromatics, ( / ) C8+ Aromatics.
/ ) C6 Aromatics, ( / ) C7 Aromatics, ( / ) C8+ Aromatics.
/ ) C6 Aromatics, ( / ) C7 Aromatics, ( / ) C8+ Aromatics.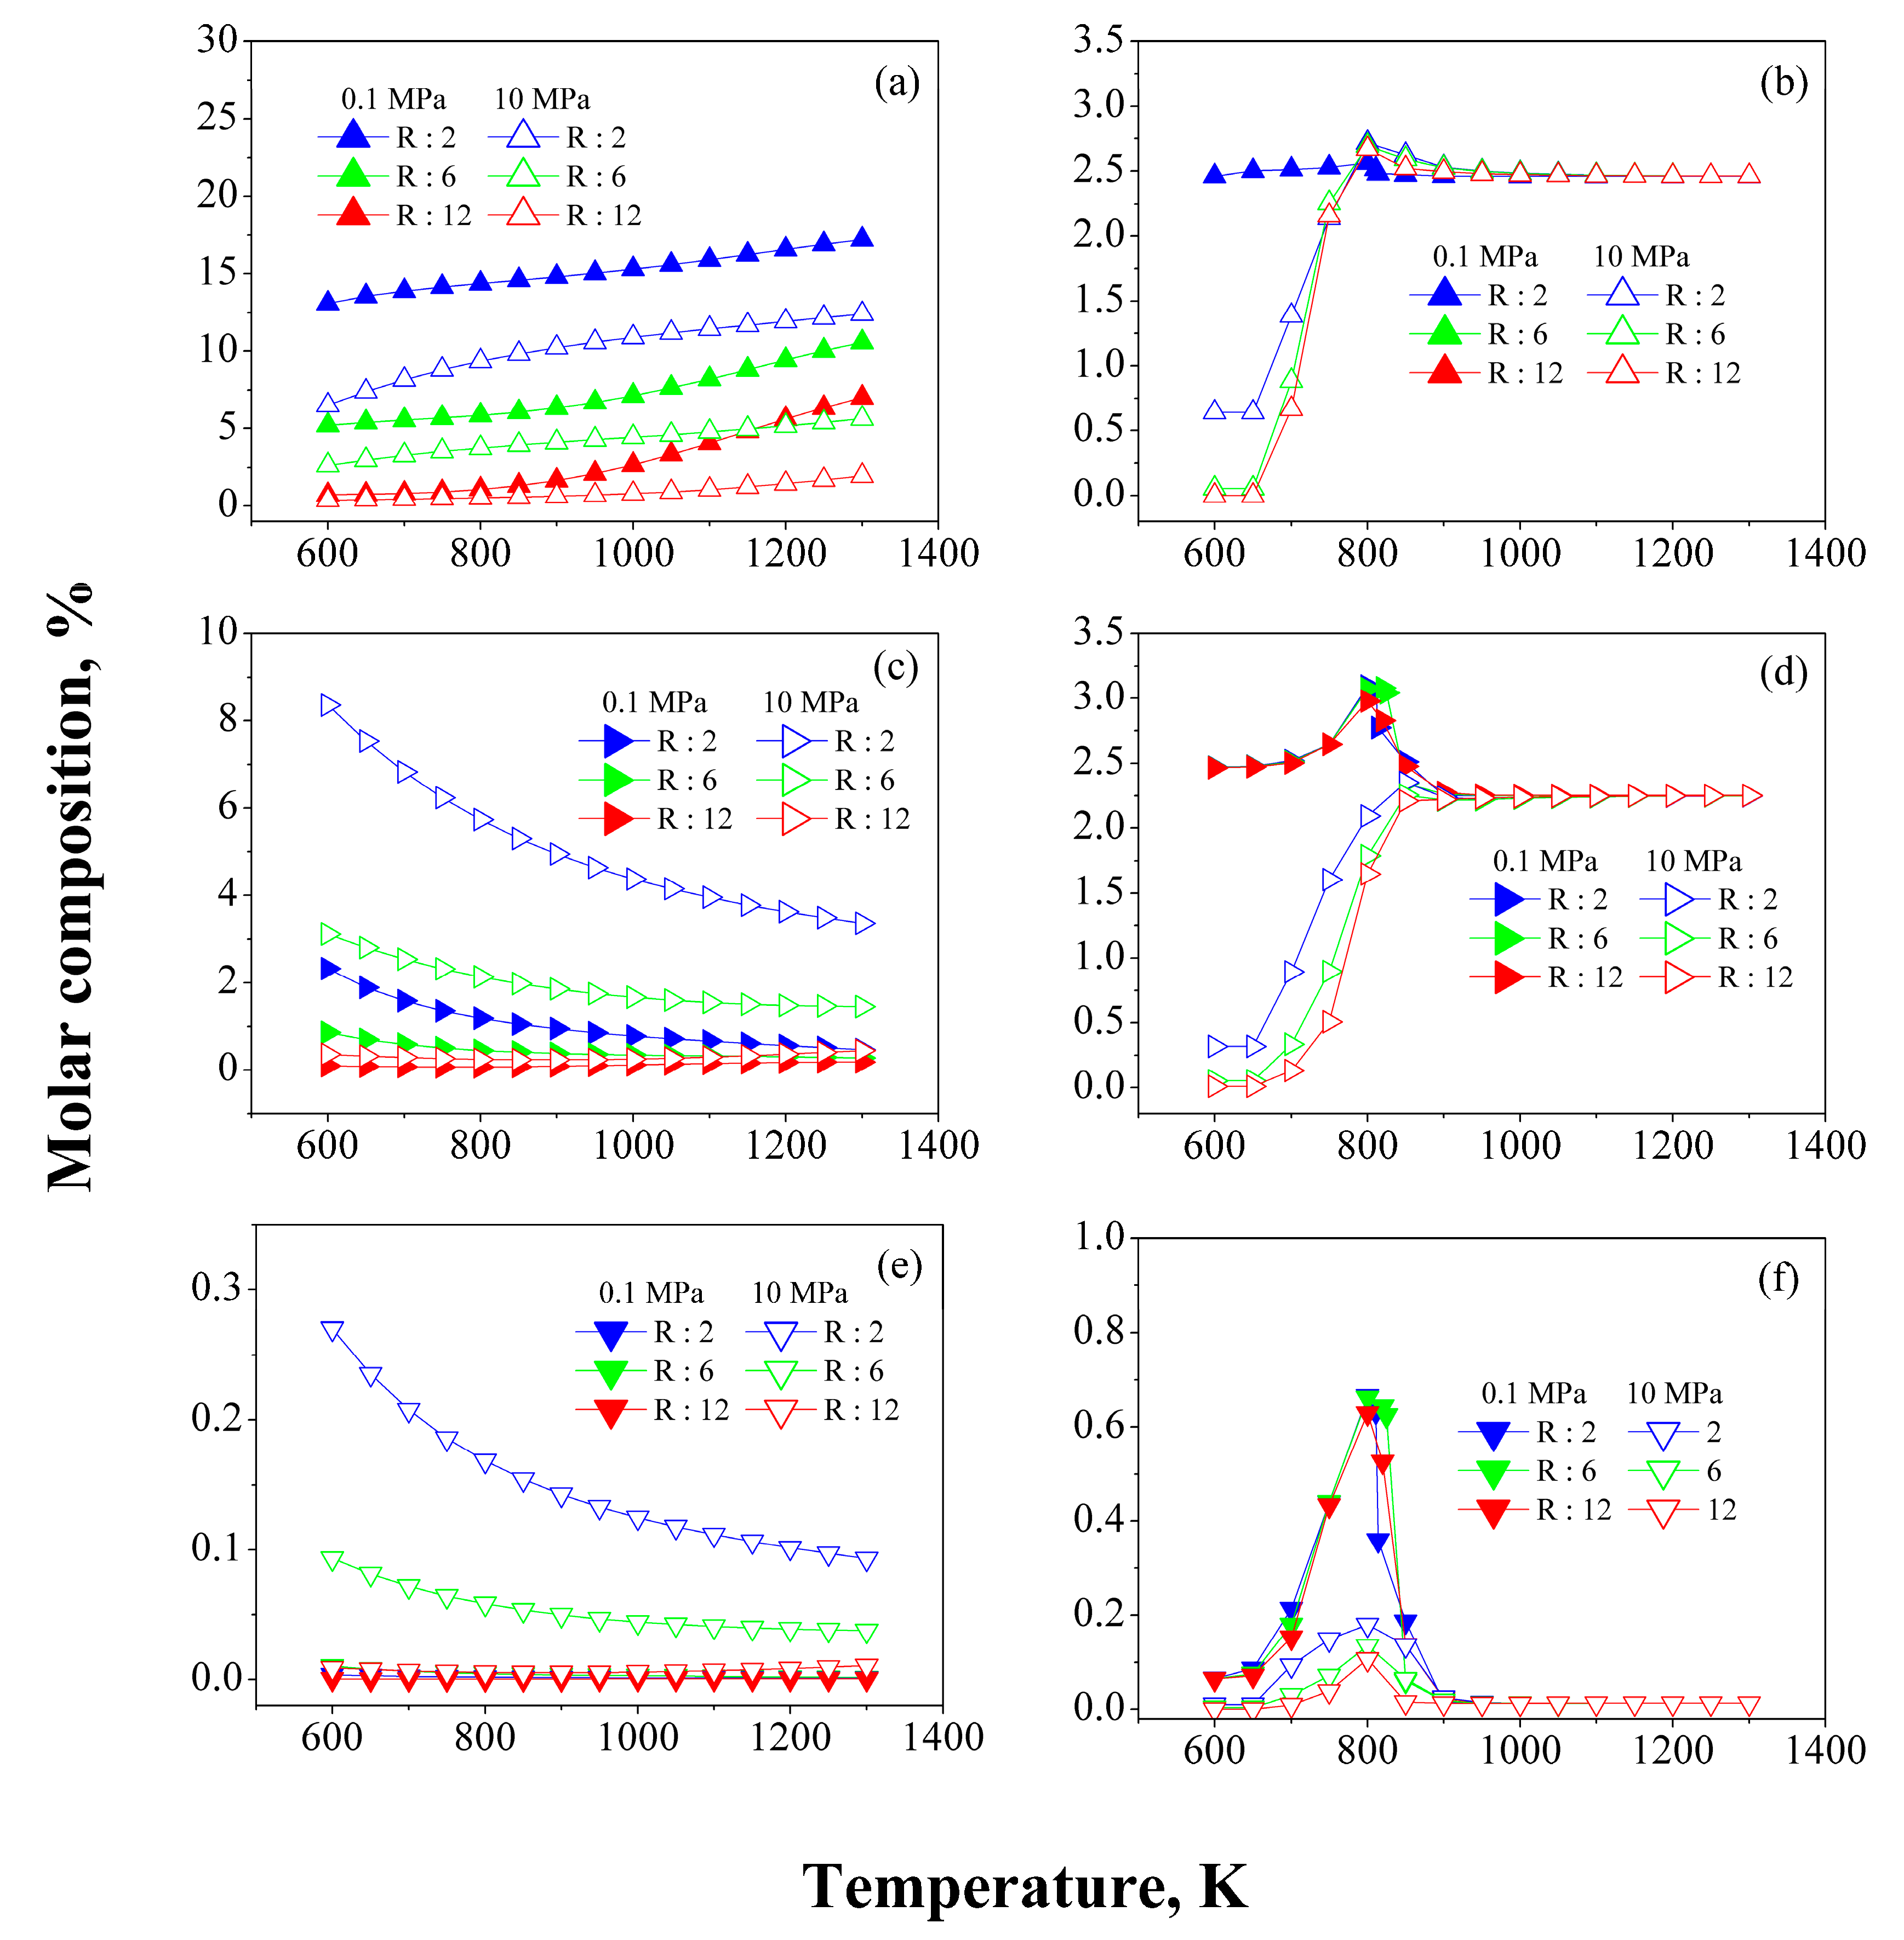

| Symbol | Model Compound | Symbol | Model Compound |
|---|---|---|---|
| Gases | Isoparaffins | ||
| H2 | Hydrogen | ip6 | 2-Methylpentane |
| C1 | Methane | ip7 | 2-Methylhexane |
| C2 | Ethane | ip8+ | 2-Methylheptane |
| C3 | Propane | Naphthenes | |
| C4 | Butane | N6 | Methylcyclopentane |
| C5 | Pentane | N7 | Methylcyclohexane |
| N8+ | Ethylcyclohexane | ||
| Paraffins | Aromatics | ||
| np6 | n-hexane | A6 | Benzene |
| np7 | n-heptane | A7 | Toluene |
| np8+ | n-octane | A8+ | Ethylbenzene |
| Compound | w | Tc, K | Pc, bar | ∆H0298, J/mol | G0298, J/mol |
|---|---|---|---|---|---|
| H2 | −0.2160 | 33.19 | 13.13 | 0 | 0 |
| C1 | 0.0120 | 190.60 | 45.99 | −74,520 | −50,460 |
| C2 | 0.1000 | 305.30 | 48.72 | −83,820 | −31,855 |
| C3 | 0.1520 | 369.80 | 42.48 | −104,680 | −24,290 |
| C4 | 0.2000 | 425.10 | 37.96 | −125,790 | −16,570 |
| C5 | 0.2520 | 469.70 | 33.70 | −146,760 | −8650 |
| ip6 | 0.3010 | 507.60 | 30.25 | −174,300 * | −2800 * |
| ip7 | 0.3500 | 540.20 | 27.40 | −196,200 * | 5620 * |
| ip8+ | 0.4000 | 568.70 | 24.90 | −215,500 * | 14,040 * |
| np6 | 0.2774 | 497.50 | 30.05 | −166,920 | 150 |
| np7 | 0.3277 | 530.37 | 27.34 | −187,780 | 8260 |
| np8+ | 0.3772 | 559.64 | 24.84 | −208,750 | 16,260 |
| N6 | 0.2300 | 532.80 | 37.85 | −108,100 * | 36,190 * |
| N7 | 0.2350 | 572.2 | 34.71 | −154,770 | 27,480 |
| N8+ | 0.2455 | 609.15 | 30.40 | −172,600 * | 40,930 * |
| A6 | 0.2100 | 562.20 | 48.98 | 82,930 | 129,665 |
| A7 | 0.2620 | 591.80 | 41.06 | 50,170 | 122,050 |
| A8+ | 0.3030 | 617.20 | 36.06 | 29,920 | 130,890 |
| Compound | A | B × 103 | C × 106 | D × 1010 | E × 1014 |
|---|---|---|---|---|---|
| C | −0.50686 | 6.45776 | −4.70494 | 15.59118 | −19.04428 |
| H2 | 3.24631 | 1.43467 | −2.89398 | 25.8003 | −73.9095 |
| C1 | 4.34610 | −6.14488 | 26.62607 | −219.29980 | 588.89965 |
| C2 | 4.00447 | −1.33847 | 42.86416 | −452.24460 | 1440.48530 |
| C3 | 3.55751 | 10.07312 | 39.13602 | −475.72200 | 1578.16560 |
| C4 | 2.91601 | 28.06907 | 15.37435 | −292.92550 | 1028.04620 |
| C5 | 4.06063 | 29.87141 | 30.46993 | −461.35230 | 1559.89710 |
| ip6 | 0.44073 | 60.77573 | −10.93570 | −180.70573 | 833.40865 |
| ip7 | 0.57808 | 70.71556 | −15.00679 | −187.48705 | 899.92106 |
| ip8+ | 0.92650 | 78.42561 | −11.24742 | −281.97592 | 1265.61161 |
| np6 | 3.89054 | 41.42970 | 24.35860 | −457.52220 | 1599.41000 |
| np7 | 4.52739 | 47.36877 | 31.09932 | −570.22085 | 1999.68224 |
| np8+ | 4.47277 | 57.81747 | 29.07465 | −621.09106 | 2265.33690 |
| N6 | −6.81073 | 80.58175 | −50.42977 | 141.93915 | −107.77270 |
| N7 | −8.75751 | 100.20540 | −62.47659 | 169.33320 | −123.27361 |
| N8+ | −5.50074 | 91.59292 | −26.04906 | −192.84542 | 1021.80248 |
| A6 | −7.29786 | 75.33056 | −69.66390 | 336.46848 | −660.39655 |
| A7 | −2.46286 | 57.69575 | −19.66557 | −106.61110 | −654.52596 |
| A8+ | 4.72510 | 9.02760 | 141.18870 | −1989.23470 | 8167.18050 |
| Model Compound | Molar Flow kmol/h | mol% | Model Compound | Molar Flow kmol/h | mol% |
|---|---|---|---|---|---|
| H2 | 4173.8 | 69.69 | ip6 | 4.53 | 0.08 |
| C1 | 579.25 | 9.67 | ip7 | 52.80 | 0.88 |
| C2 | 292.33 | 4.88 | ip8+ | 143.11 | 2.39 |
| C3 | 232.78 | 3.89 | N6 | 1.16 | 0.02 |
| C4 | 113.68 | 1.90 | N7 | 7.94 | 0.13 |
| C5 | 21.66 | 0.36 | N8+ | 18.35 | 0.31 |
| np6 | 15.83 | 0.26 | A6 | 88.50 | 1.48 |
| np7 | 65.95 | 1.10 | A7 | 81.02 | 1.35 |
| np8+ | 91.93 | 1.53 | A8+ | 4.60 | 0.08 |
| Chemical Reaction | Reaction Rate |
|---|---|
| i-C6H14 ⇌ n-C6H14 iso-hexane 2-Methylpentane | |
| i-C7H16 ⇌ n-C7H16 iso-heptane 2-Methylhexane | |
| i-C8H18 ⇌ n-C8H18 iso-octane 2-Methylheptane |
| Chemical Reaction | Reaction Rate | |||
|---|---|---|---|---|
| C6H14 n-hexane | C6H12 Methylcyclopentane | + H2 | ||
| C7H16 n-heptane | C7H14 Methylcyclohexane | + H2 | ||
| C8H18 n-octane | C8H16 Ethylcyclohexane | + H2 | ||
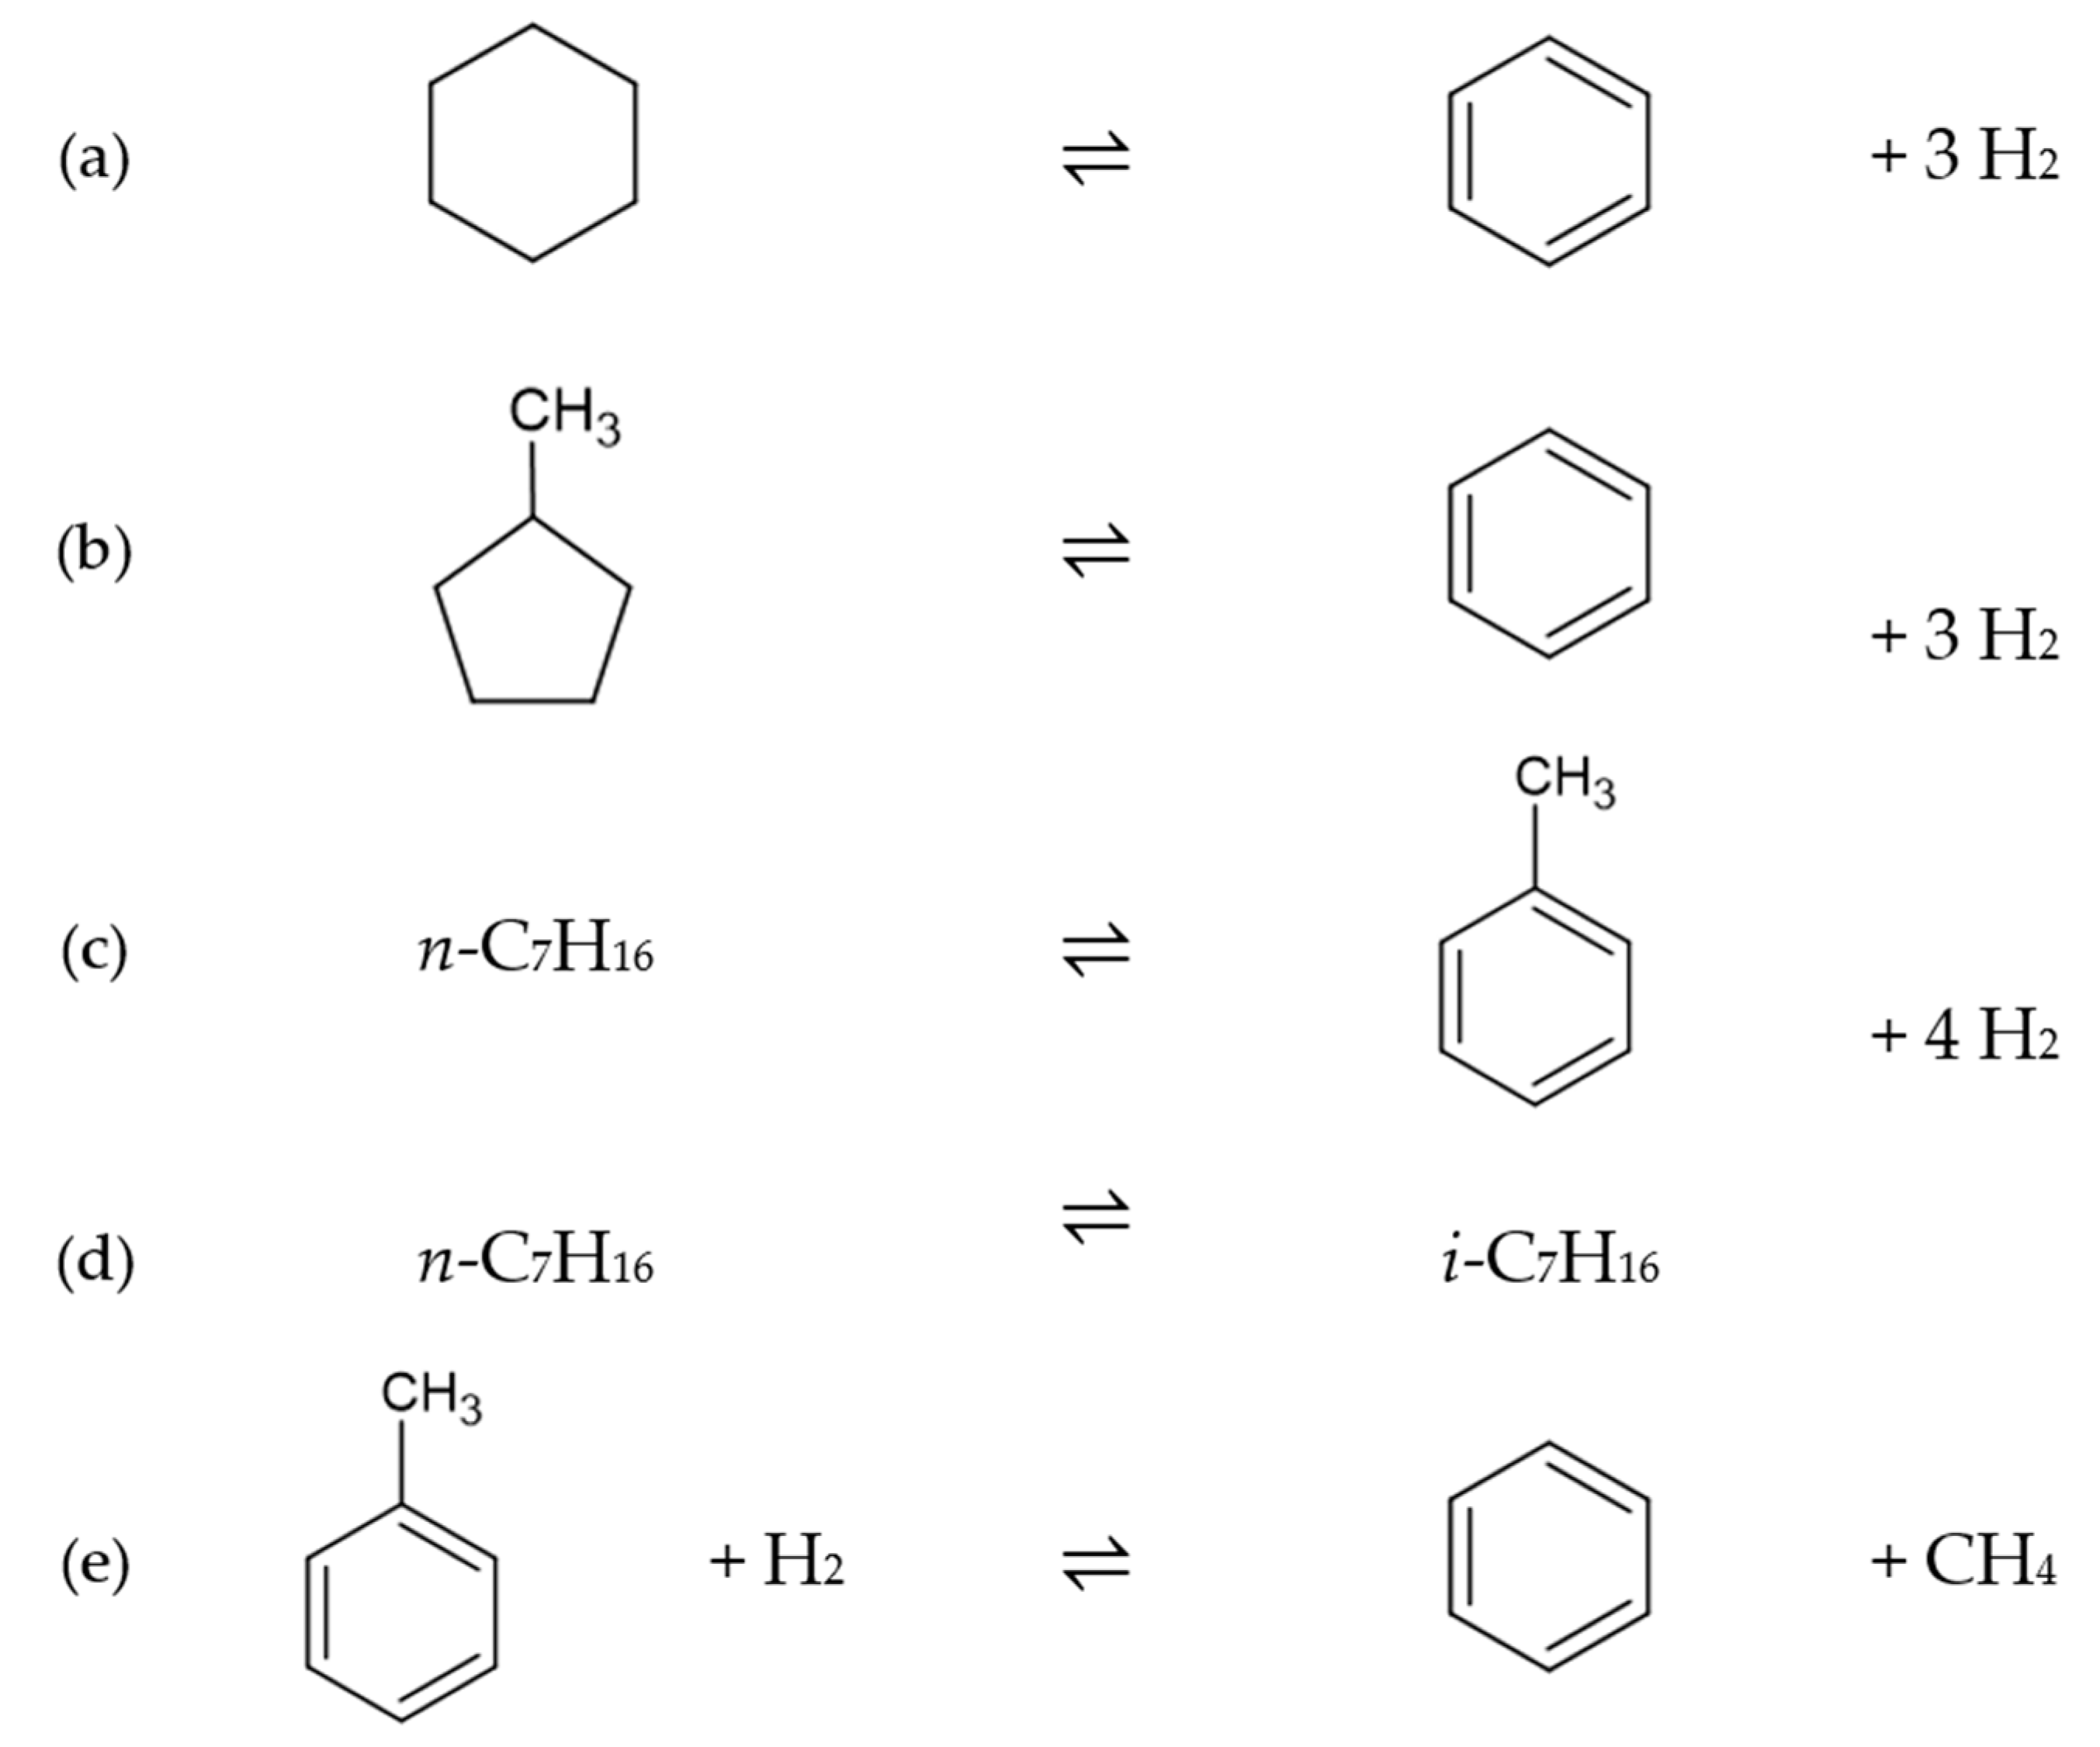
| Chemical Reaction | Reaction Rate | |||
|---|---|---|---|---|
| C6H12 Methylcyclopentane | C6H6 Benzene | + 3H2 | ||
| C7H14 Methylcyclohexane | C7H8 Toluene | + 3H2 | ||
| C8H16 Ethylcyclohexane | C8H10 Ethylbenzene | + 3H2 | ||
| Chemical Reaction | Reaction Rate | |||
|---|---|---|---|---|
| n-C5H12 + H2 → | ½ CH4 + ½ C2H6 + ½ C3H8 + ½ C4H10 | |||
| i-C6H14 + H2 → | ⅓ CH4 + ⅓ C2H6 + ⅔ C3H8 + ⅓ C4H10 + ⅓ C5H12 | |||
| i-C7H16 + H2 → | ⅓ CH4 + ⅓ C2H6 + ⅓ C3H8 + ⅓ C4H10 + ⅓ C5H12 + ⅓ i-C6H14 | |||
| i-C8H18 + H2 → | ⅟4 CH4 + ⅟4 C2H6 + ⅟4 C3H8 + ½ C4H10 + ⅟4 C5H12 + ⅟4 i-C6H14 + ⅟4 i-C7H16 | |||
| C7H8 Toluene | + H2 → | C6H6 Benzene | + CH4 | |
| C8H10 Ethylbenzene | + H2 → | ½ C7H8 Toluene + ½ C6H6 Benzene | + ½ CH4 + ½ C2H6 | |
| Molar Composition | % Abs Error | ||||
|---|---|---|---|---|---|
| Plant Data | Arani et al. | This Work | Arani et al. | This Work | |
| H2 | 68.89 | 69.02 | 68.30 | 0.19 | 0.85 |
| C1 | 9.62 | 9.56 | 9.87 | 0.62 | 2.64 |
| C2 | 5.05 | 5.29 | 5.12 | 4.75 | 1.40 |
| C3 | 4.53 | 4.36 | 4.71 | 3.75 | 4.04 |
| C4 | 2.89 | 2.87 | 2.95 | 0.69 | 2.12 |
| C5 | 1.3 | 1.16 | 1.19 | 10.77 | 8.81 |
| np6 | 0.27 | 0.23 | 0.24 | 14.81 | 10.27 |
| np7 | 0.26 | 0.26 | 0.27 | 0.0 | 4.52 |
| np8+ | 0.08 | 0.07 | 0.07 | 12.5 | 9.47 |
| ip6 | 0.63 | 0.67 | 0.65 | 6.35 | 3.83 |
| ip7 | 0.9 | 0.82 | 0.99 | 8.89 | 10.42 |
| ip8+ | 0.32 | 0.36 | 0.35 | 12.5 | 10.64 |
| N6–10 | 0.1 | 0.09 | 0.11 | 10.0 | 7.64 |
| A6 | 0.38 | 0.44 | 0.40 | 15.79 | 4.35 |
| A7 | 1.81 | 1.86 | 1.8 | 2.76 | 0.6 |
| A8+ | 2.97 | 2.94 | 2.89 | 1.01 | 2.58 |
| Hydrocarbons | a | b | c | d | e |
|---|---|---|---|---|---|
| n-Paraffins | 92.809 | −70.97 | −53 | 20 | 10 |
| Isoparaffins | |||||
| 2-Methyl-pentanes | 95.927 | −157.53 | 561 | −600 | 200 |
| 3-Methyl-pentanes | 92.069 | 57.63 | −65 | 0 | 0 |
| 2,2 Dimethyl-pentanes | 109.38 | −38.83 | −26 | 0 | 0 |
| 2,2 Dimethyl-pentanes | 97.652 | −20.8 | 58 | −200 | 100 |
| Naphthenes | −77.536 | 471.59 | −418 | 100 | 0 |
| Aromatics | 145.668 | −54.336 | 16.276 | 0 | 0 |
Publisher’s Note: MDPI stays neutral with regard to jurisdictional claims in published maps and institutional affiliations. |
© 2022 by the authors. Licensee MDPI, Basel, Switzerland. This article is an open access article distributed under the terms and conditions of the Creative Commons Attribution (CC BY) license (https://creativecommons.org/licenses/by/4.0/).
Share and Cite
Martínez, J.; Zúñiga-Hinojosa, M.A.; Ruiz-Martínez, R.S. A Thermodynamic Analysis of Naphtha Catalytic Reforming Reactions to Produce High-Octane Gasoline. Processes 2022, 10, 313. https://doi.org/10.3390/pr10020313
Martínez J, Zúñiga-Hinojosa MA, Ruiz-Martínez RS. A Thermodynamic Analysis of Naphtha Catalytic Reforming Reactions to Produce High-Octane Gasoline. Processes. 2022; 10(2):313. https://doi.org/10.3390/pr10020313
Chicago/Turabian StyleMartínez, Jeremías, María Antonieta Zúñiga-Hinojosa, and Richard Steve Ruiz-Martínez. 2022. "A Thermodynamic Analysis of Naphtha Catalytic Reforming Reactions to Produce High-Octane Gasoline" Processes 10, no. 2: 313. https://doi.org/10.3390/pr10020313
APA StyleMartínez, J., Zúñiga-Hinojosa, M. A., & Ruiz-Martínez, R. S. (2022). A Thermodynamic Analysis of Naphtha Catalytic Reforming Reactions to Produce High-Octane Gasoline. Processes, 10(2), 313. https://doi.org/10.3390/pr10020313