Abstract
As marine renewable resources begin to become a feasible energy source, it becomes crucial to investigate the nearshore impact of hydrodynamic and morphodynamic processes. As part of the implementation of turbines in the numerical modeling environment of Telemac-3D and Sisyphe modules, we conducted a 10-year run to evaluate nearshore impacts of turbines in the flow. We used five criteria to define viable locations. Turbines sites were added to a conversion energy model coupled into the hydrodynamic model in order to develop properly the flow changes towards the energy conversion process. The results revealed that in the three chosen spots, turbines were not converting equally the current energy within the site. In fact, the turbines located on the outer side of the farm developed greater conversion rates. This impacted the nearshore in the following ways: (1) the decrease in the currents intensity that generates strong adjustments in the water column, breaking the natural pattern of vertical circulation; (2) development of lateral flows that in time affects the bottom dynamics and results in changes in sediment deposition; and (3) increase in bedload transport rates around the turbine’s field due to divergence in the flow. The idealized turbines sites produced 1,775 GWh in 10 years, which could provide electricity to 54,181 residences during this period.
1. Introduction
As fossil fuel sources become depleted and their environmental effects become evident on ecosystems, the world is searching for renewable energy sources. Global interest in renewable and green energy is increasing, especially in countries that have very limited natural resources. Concerns about environmental pollution and climate change help drive interest in setting up new frontiers for renewable energy [1].
Renewable marine energy technology has undergone tremendous development over the last two decades and has found great commercial success. Several companies are developing prototypes [2]. The marine current energy is an emerging and promising renewable energy resource for electricity production. Due to the fact that marine current energy is very reliable and abundant in many regions, it makes turbines driven by marine currents an attractive form of electricity generation [3,4,5,6,7,8,9,10,11,12].
Akimoto et al. [5] proposed that the Kuroshio Current can be exploited with floating devices with a great amount of energy viability. In addition, Shirasawa et al. [10] introduced a new prototype to harvest energy from Kuroshio in a harsh 500 m deep environment. Finkl and Charlier [3] studied the impact of turbines inside the Gulf Stream, while Yang et al. [6] focused on nearshore current energy harvesting in the Florida current. Yang et al. [6] found that strong western currents deliver a strong stream among high depths far from the coast, which spreads toward the shore, promoting a highly dynamic setup nearshore in a more welcoming environment than at an open ocean.
Tseng et al. [11] pointed out that western boundary currents in major ocean basins feature maximum current speeds up to 0.6 m·s, such as the Brazil Current (BC). The Brazilian Current is the less intense western boundary current [13] when compared against the Agulhas Current [14], Gulf Stream (Cape Hatteras and Florida Straits [15,16], and Kuroshio [17]. VanZwieten et al. [18] considered all those currents with flow velocity sufficiently fast for commercial installation of electricity-generating turbines.
In Brazil, Marques et al. [4] started research for renewable sources of energy in the South Brazilian coastal currents. The initial results showed a potential area for current turbines (near 32° S and 51° W) and resulted in the development of the energy conversion module used in this study. Kirinus et al. [8] followed the prior study by investigating further where strong currents prevail and which patterns among seasonal variations promote high-energy conversion rates. Kirinus and Marques [9] performed a simulation with the presence of physical turbines in the environment to analyze changes in the current dynamics due to the presence of turbines.
Recently, Kirinus et al. [12] applied a new method to narrow even further possible renewable energy sites. This method relies on a long period of data acquisition (in this case, a numerical simulation of at least 10 years) followed by a superficial variability analysis to identify the range of influence of climatic processes in each studied region. After this first evaluation, these regions were further analyzed for the stability of the renewable source (waves and marine currents), resulting in a condensed study area.
Two constraints need to be addressed. The first is the question of how to estimate energy conversion of turbine farms with reduced impacts, and the second is how to evaluate the environmental impacts that might occur in the future. In our study, we provide recommendations on how to answer these uncertainties. In order to evaluate the power output of turbines that are numerically simulated and to minimize the assumptions and the extrapolations regularly used (i.e., integrate one tidal gauge of power production for an entire year period), we applied further an approach developed previously by Kirinus et al. [12].
The main objective of this study was to simulate turbines nearshore in the Southern Brazilian Shelf (SBS) and Southeast Brazil Bight (SBB) among the influence of the marine currents over ten years by evaluating hydrodynamic and morphodynamic impacts in the flow and aiming to show the novelty of the long period simulation methodology regarding environmental constraints [12].
2. Materials and Methods
The area of our study comprised the South–Southeastern Brazilian Shelf (Figure 1, between −21° S and −38° S), which is subdivided into the SBS and SBB due to diverging dynamic pattern behaviors. Several authors have extensively described both regions. The entire region is characterized by high seasonality of the wind fields [19] with the dominance of Northeast (NE) winds, in addition to the constant influence of BC [20].
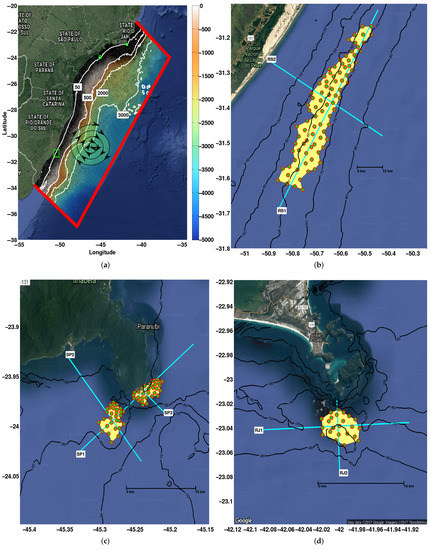
Figure 1.
(a) Study area located in the South–Southeastern Brazilian Shelf. In addition, the numerical grid used in this work with 205,617 nodes disposed in 20 vertical sigma levels. The red lines represent oceanic liquid boundaries, and the spiral represents atmospheric surface conditions. Bathymetry is shown in the colorbar and also uses isolines for 50, 500, 2000, and 3000 m. The turbines farm are set in three regions marked with green rectangles with 171 turbines, (b) where the southern farm (State of Rio Grande do Sul) possesses 87 turbines and (c) the center farm (State of São Paulo) has 61 turbines while (d) the northern farm (State of Rio de Janeiro) has 23. At each region, vertical cross sections (cyan lines) were taken for further analysis. (For interpretation of color in this Figure, the reader is referred to the web version of the article.)
The circulation in the continental shelf is dominated by the BC, which flows southward and meanders around the 200 m isobaths [21], while the inner shelf is influenced mainly by the northward flow of the Brazil Coastal Current (BCC), which transports low-salinity waters derived from the SBS [21,22].
Due to its intense circulation pattern, the South-Southeastern Brazilian Shelf presents great potential for marine current energy exploitation. However, in order to provide renewable energy and low environmental impact on the population, studies are still needed in order to improve the development and deployment of renewable devices on the Brazilian coast.
This study was developed using three-dimensional numerical modeling and direct result analysis obtained from the usage of the numerical modeling system open TELEMAC-MASCARET, version v6p3. This system uses a modular approach with Telemac-3d, the hydrodynamic module, SISYPHE, and the morphodynamic module. The energy conversion module developed at the Laboratório de Análise Numérica e Sistemas Dinâmicos (LANSD) was also used.
All equations from the modules Telemac-3d and Sisyphe, as well as parametrization, can be found in detail in Hervouet [23] and in the user manuals by Pham and Joly [24] and Tassi and Villaret [25] and Tassi and Villaret [26]. The energy conversion module was developed by Marques et al. [4] and is described further in Kirinus and Marques [9].
2.1. Simulation Setup
The Telemac-3d model solves the Navier–Stokes equations, continuity, and hydrostatic pressure by considering local variations in the free surface of the fluid. In order to solve horizontal and vertical turbulence, the k- model was applied on Telemac-3d, while the vertical discretization consists of 20 sigma levels that are distributed equally from the top to the bottom. At Sisyphe, only the bed-load transport was imposed, being the solid volume transport rate (bedload) per unit width computed with the Meyer–Peter and Müller, while the resulting bed evolution is then computed by solving the Exner equation [25].
The investigations involving energy conversion from the currents into electrical power were performed with the energy module [4]. This module uses the turbine standard equation to calculate the electric power from the incident flow velocity (Equation (1)):
where P is the power converted in , is the efficiency coefficient, A is the rotor area (m), v is the inflow velocity (m.s, and is the specific mass of the water (kg·m). The parametrization used in the simulations is the start-in speed of 0.2 m·s, and the cut-off speed is 1.5 m·s, resulting in a nominal power of 242 kW, since the turbine height was considered 20 m while the turbine ray was 10 m and the efficiency coefficient () was equal to 0.35 [9]. The turbine is numerically programmed to behave as a Gorlov turbine [26] attached to the oceanic floor that is able to convert energy from any incoming current direction.
In order to investigate the potential for energy conversion and the influence of the installation of energy converters in the natural hydrodynamic processes of the study region, two simulations (A and B) were carried out over a 10-year period. In simulation (A), we first applied the double coupling (hydrodynamic–morphodynamic); afterward in simulation (B), we used the full coupling with the energy conversion module.
Simulation A was conducted by using only hydrodynamic and morphodynamic processes in order to detail the area of study while being undisturbed. In simulation (B), the turbines were imposed in the most viable spots according to Kirinus et al. [12] in order to evaluate the influence of turbines in the flow and sediments.
2.2. Defining Energy Conversion Sites
In order to create a farm of turbines, we defined the positioning of the turbines with five criterions: (1) bathymetry, (2) coastal proximity, (3) frequency of high velocity, (4) seasonal and monthly variability, and (5) distance from each turbine:
- Bathymetry ranging from 30 to 90 m;
- The distance from the coast is imperative in reducing cabling costs, rendering the project feasible;
- A frequency analysis was performed to select zones with current velocity up to 0.30 m·s;
- Seasonal and monthly variabilities according to the Cornett [27] index of variability, performed for the study region [12], where the lower variability represents higher stability of the selected spot;
- Regarding the frontal and lateral distance among turbines is imperative for increasing farm power conversion. These distances vary with the incident flow, according to Myers and Bahaj [28]. The lateral turbulent effect is able to reach 3 diameters of distance from the turbine, while the frontal turbulence varies from 6 to 10 times in diameter [29].
We applied these criteria in the study area and implemented 171 turbines among three regions selected as most viable for current energy conversion (Figure 1b–d). We chose positioning based on these factors: the residual average flow of each region in terms of first-generation arrays and the offset dual-row and second generation of turbines [30]. The site of the southern turbines (Figure 1b) was placed 20 km off the coast of Rio Grande do Sul State (RS); this site contains 87 turbines in a 440 km area, mainly disposed among the 50 and 70 m isobath. The average distance from each turbine is 1.5 km lateral with 3.0 km frontal distance.
The center farm (Figure 1c) has 61 turbines within an area of 13.78 km, with mean lateral and frontal distance near 0.5 km, enclosed with the 40 and 50 m isobath, and 500 m apart from the São Sebastião Island in São Paulo State (SP). In addition, the northern site farm (Figure 1d), situated 1 km towards the south shore of Arraial do Cabo in Rio de Janeiro State (RJ), has 23 turbines between de 70 and 90 m isobath, with a total area of 10 km with the turbines spaced laterally at 600 m and 800 m frontally.
2.3. Initial and Boundary Conditions
All data used to prepare initial or boundary conditions were obtained from open access global source data, such as HYCOM (HYbrid Coordinate Ocean Model), NCEP/NCAR Reanalysis from NOAA (National Oceanic and Atmospheric Administration), WW3 (WAVEWATCH III), and OTPS (Oregon State University Tidal Prediction Software Global Tidal Solutions).
Telemac-3d is the central module of the coupling where the atmospheric superficial conditions were imposed in all the mesh (Figure 1, black spiral arrows), with NCEP/NCAR Reanalysis from NOAA winds, air temperature, and atmospheric pressure. These data were imposed every 6 h in order to promote better weather influence in the study area.
HYCOM results from NCODA (Navy Coupled Ocean Data Assimilation) offer great horizontal resolutions (0.083° in mid latitudes) and reliable data since its products are assimilated with observational data [31]. Datasets from salinity, temperature, and velocity were interpolated in the oceanic boundary conditions (Figure 1, red lines) during the entire period of simulation.
Furthermore, the tides were imposed directly on Telemac-3d [32], with the results from the OTPS Global Tidal Solutions [33] developed by the Oregon State University.
In the Sisyphe module, no external conditions were applied, and only regular parametrization was applied. A homogeneous sediment distribution was imposed in the entire numerical domain with 2 mm in grain size. This assumption was adopted due to the lack of sediment data from the study area.
Full calibration and validation were thoroughly performed for the study area in a previous study, which can be found in Kirinus et al. [12].
3. Results and Discussion
3.1. Turbine Farm Performance
We performed a power analysis during the 10-year simulation period. After analyzing the mean power converted for each turbine along with the entire simulation (Figure 2), it is clear that even though each site belongs to a different location, we observed a pattern in the energy converted from the currents.
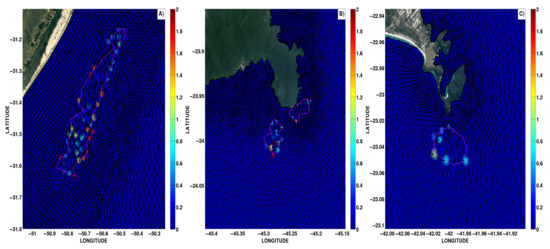
Figure 2.
Mean power (kW·day) of turbines at each site for the 10 — year simulation: (A) RS, (B) SP, and (C) RJ. Magenta lines represents the boundary contour of the turbines farm.
The most energetic turbines were the ones positioned among the boundary of the sites, which are directly influenced by the main stream flow from the currents, while the inner turbines received a depleted velocity due to loss for energy conversion for the outer turbines.
At the RS site (Figure 2A), only a few boundary turbines achieved a high mean power conversion of 2 kW·day, with the southwestern inner turbines (31.5° S~31.6° S) reaching values up to 1 kW·day. The SP turbines site (Figure 2B) presents a varying pattern in energy conversion. While the southern farm delivered more power, the northern site showed poor mean performance. The same low average power output was observed in the RJ turbine farm (Figure 2C). In all turbine sites (Figure 2), the average current direction was southward; this was due to the overall dominance of northerly winds associated with the presence of the Brazil Current (BC) as a main current influence for coastal dynamics [34,35].
Evaluating the turbines as a bundle offered the possibility to understand better the energy conversion of each site. In Table 1, values for mean, standard deviation, and maximum and integrated power are presented. The RS site delivered high mean power daily (45.30 kW·day) in comparison to the other sites where the SP and RJ outputs were 49% and 85% lower than RS. This comparison is uncertain because all sites have different turbine numbers and locations. The standard deviation (Std) associated with the maximum (Max) values registered provided a different view of the sites because the Std showed a huge variation range; this meant that despite the low average, in time, the sites could present periods of higher energy conversion.

Table 1.
Sites power analysis. Mean, standard deviation (Std), maximum (Max), and integrated (Int) power were compared against each site.
In addition, the Max values of the SP and RJ sites are close (Table 1), with the RS site producing almost 539 kW·day in contrast with SP and RJ, 237 and 258 kW·day, respectively. From these small differences in maximum power output, we might infer that the incident currents’ output presents varying velocity peaks since the SP site had 61 turbines while RJ had 23, and the difference in maximum power produced among them is only 8.68%.
These minor range variations in maximum values exist due to the BC velocity changing mildly with latitude. According to da Silveira et al. [36], where at 29~31° S (RS), the maximum BC velocity varies around 0.70~0.80 m·s, while in ~24° S (SP), the maximum velocity fluctuates around ~0.75 m·s; finally, at the RJ site (~23° S), the maximum varies around 0.50~0.70 m·s.
In order to describe the period of time that each site converts a range of power, we used the probability density function. In Figure 3, the RS site was able to sustain greater conversion rates than the other sites, while the RJ site presented a higher incidence (65%) of low energy production. In terms of stability of conversion throughout time, the RS site is a more reliable environment for energy conversion, whereas the RJ site could be a possible place for small turbine installation.
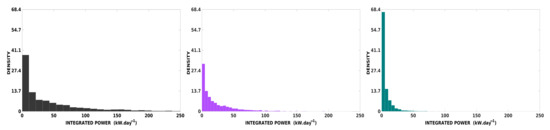
Figure 3.
Probability density function of each site comparing percentage of time with the power output (kW·day). (left) RS, (middle) SP, and (right) RJ.
We tracked the cumulative power produced by each site during the 10-year period. Over 10 years, the RS site reached 16.55 MW, while the SP site achieved 8.38 MW, and RJ delivered 2.47 MW of integrated power (Table 1). The relationship among the sites can be observed in the temporal series of integrated power (Figure 4), because the RS and SP sites behave almost with the same conversion tendency. In contrast, the RJ site delivered low mean values during the entire simulation.
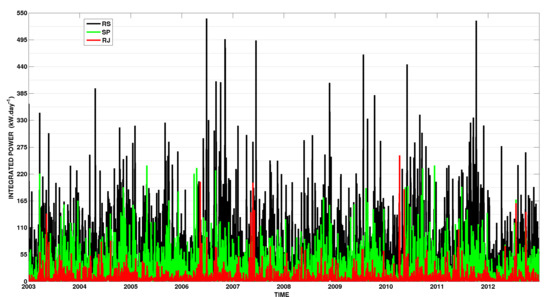
Figure 4.
Time series of integrated power (kW·day) considering entire sites. For interpretation of color in this Figure, the reader is referred to the web version of the article. These data are available as Supplementary Materials File on this article.
In terms of energy production, these turbines’ setup delivers equivalent energy to 1451 GWh for the RS site, while for SP and RJ the output is 735 and 246 GWh, respectively, resulting in 2432 GWh in 10 years. According to the Brazilian energy balance report [37], the average energetic residential consumption is around 273 kWh·month; this means that 74,000 residences can be maintained with this energy over 10 years. In these calculations, no losses were taken into account.
Not all extracted power will be converted into electric output from the turbines; however, Hagerman et al. [38] (apud. Bane et al. [13]) estimated the percentage of losses such as mechanical losses in the drive train that connects the rotor blades to the generator (5%), electrical and mechanical losses in the generator (10%,) and losses within the power conditioning equipment that connects the generator to the cables that reach the onshore power grid (10%). In addition, Ortega-Achury et al. [39] estimated additional losses for transmission at 2%.
These losses, in total, will account for a delivered electrical power loss of approximately 27% from the original turbine power output [13]. Accordingly, the total available energy production can be assumed to be around 1775 GWh during the entire period, which means up to 54,181 residences could receive this electricity over 10 years.
Temporal variability analysis was carried out in the RS, SP, and RJ sites to unravel the power spectra of the dynamic patterns involved in these areas. The wavelet analysis is useful to demonstrate the occurrence of the most important events of energy conversion in time scales through local and global power spectrum [40,41].
The integrated wavelet analysis was performed in the three selected sites. The local and global wavelet power for integrated power converted resulted in similar patterns. In this manner, only the time series of the SP site was selected to represent the analysis. The highest power conversion that resulted from the high current intensity impacted the local power spectrum of wavelet analysis (Figure 5) with 95% confidence for cycles occurring from 1 to 16 days. In addition, temporal scales of occurrence shorter than 8 days dominated the period, caused mostly by the cyclic changes of wind direction.
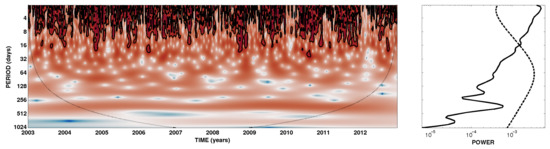
Figure 5.
(Left panel) Local wavelet power spectrum for the time series of power converted at SP site using Morlet wavelet. Thick contour lines enclose regions of greater than 95% confidence for a red-noise process with a lag-1 coefficient of 0.90. Cross-hatched regions indicate the cone of influence where edge effects become important. (Right panel) Global wavelet power spectrum where values above tendency dashed line represent 95% of confidence. The dotted lines represent the cone of influence and inside it are the regions where effects become important (for interpretation of color in this Figure, the reader is referred to the web version of the article).
This pattern of time variability for wind-driven coastal circulation over the SBS is similar to that verified by Marques et al. [4], Kirinus et al. [8], Kirinus and Marques [9], Soares et al. [34], Toldo et al. [42], Soares et al. [43], Marques et al. [44], Parise et al. [45], Marques et al. [46,47], Costa and Moller [48], Marques [49], Andrade et al. [50]. This region is influenced strongly by the passage of frontal meteorological systems, generating further changes in wind direction and intensity of currents. On the other hand, despite the differing latitude, temporal variability behaves the same according to Pereira et al. [51], Truccolo [52] for the Santa Catarina State and according to Dottori and Castro [19] for São Sebastião Island.
Additionally, wind-driven coastal currents have been studied greatly in the SBS, corroborating the major cycles of hydrodynamic patterns correlated with winds and the passage of meteorological fronts [35,53,54,55,56,57,58].
In order to determine if either site is appropriate for further development, physical and morphodynamical environmental assessments should be performed as advised by several authors [3,4,59,60,61,62,63,64] who are concerned about the indiscriminate propositions of renewable energy projects.
3.2. Environmental Impacts
The positioning of marine renewable energy technology, such as a current turbine, will change the circulation of the undisturbed flow. Once the available energy is removed to generate electricity, circulation, sediment transport, and mixing processes will be altered for each site. These changes, along with the amount of energy removed, can affect drastically the marine environment [1].
In order to investigate the naturally occurring sediment transport regime inside the proposed sites, a coupled hydrodynamic and morphodynamic model was set up with and without the turbines (case A and B). In both cases, the complex patterns of sediment evolution were treated as driven only by currents and tides, disregarding wave effects. In these cases, the environmental impacts will consist of morphodynamic changes before and after turbine implementation.
The RS region (Figure 6) presented an increase in the mean superficial velocity intensity towards the turbines’ area (magenta boundary line), with average values around 0.15 m·s. The mean current direction was predominantly southward (Figure 6a). This velocity arrangement produced a deposition pattern towards the coast as shown by the bedload integrated transport (Figure 6b, isolines), which increased nearshore to values greater than 5 cm·s; this sediment was transported by the strong mean bed shear stress (closer to 0.6 N·m) in the area of the turbines caused by the intense current velocity.
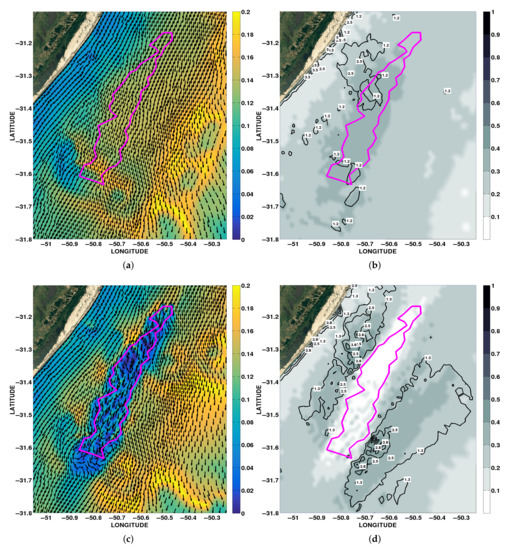
Figure 6.
Rio Grande do Sul turbines site. Simulation without the presence of turbines (upper panel) and with the turbines (lower panel), as the sites are represented by the magenta boundary line. (a,c) Mean superficial velocity (m·s) with mean direction in vectors; (b,d) bed shear stress (N·m) in black and white colormap with integrated bedload transport (cm·s) in black isolines.
As the turbines were added, surface velocity was depleted (Figure 6c), although several gyre-like structures appeared inside the site. This can be correlated with the residual flow patterns from the upstream conversion displaying wake zones. In the nearfield of the site (31.6° S~31.7° S), a shadowing effect was observed with almost 10 km because of the turbines’ presence. In addition, as the current core diverged from turbine conversion, the growth in surface velocity became noteworthy in the west flank of the site.
The morphodynamic changes are noteworthy as the bed shear stress was reduced to almost zero in the entire site, while an increase in the parameter was noticeable in the west and east ends of the site, with values changing from 0.2 to 0.5 N.m (Figure 6d). The switch in velocity, combined with the bed shear stress changes, impacts the bedload transport. This created two zones of deposition across the site borders. Notwithstanding, the sediment flow towards the coast drastically increased.
For the SP site, the undisturbed simulation (Figure 7, upper panel) presented a strong coastal current (up to 0.16 m·s) closely attached to the São Sebastião Island shoreline, which regulates the current direction around it. Similarly, the bed shear stress followed the surface current pattern with low values inside island-protected areas. At the tip of the headland, values up to 0.5 N·m were observed in the same spot as a high bedload transport of 5 cm·s occurred due to the high dynamics associated with this spot.
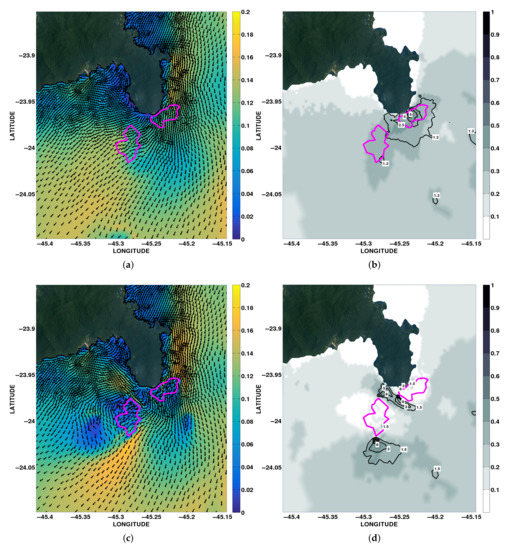
Figure 7.
São Paulo turbines site. Simulation without the presence of turbines (upper panel) and with the turbines (lower panel), as the sites are represented by the magenta boundary line. (a,c) Mean superficial velocity (m·s) with mean direction in vectors; (b,d) bed shear stress (N·m) in black and white colormap with integrated bedload transport (cm·s) in black isolines.
The inclusion of turbines in these minor regions (two magenta polygons) caused drastic changes in the mean surface hydrodynamics not only in intensity but also in direction (Figure 7c). Within the turbine sites, intensity depletion occurred due to loss for conversion, although other spots of decreasing intensity were observed near the sites. In addition, a fast jet-like structure (0.15 m·s) developed among the two minor sites, directing the flow northwest towards the island; likewise, another intensified flow was observed on the southeast side (24°~24.05° S) of the southern turbine site with velocities around 0.18 m·s.
The morphodynamical changes from the inclusion of turbines were considerable. The bedload transport rates (Figure 7d, isolines) increased at the tip of the headland to 6 cm·s, while in between and south of the sites, a large amount of transport was observed. Bed shear stress changes developed due to velocity changes; high values of bed shear stress (0.6 N·m) presented beneath those jet-like flows, while quasi-null values appeared inside the turbine sites.
The RJ site (Figure 8) was marked by strong surface mean velocity (0.20 m·s) with a predominantly southward direction that is weaker only at the inner bays and at the southwest side of the Arraial do Cabo peninsula. The morphodynamic arrangement followed the intensity of the flow with high bed shear stress (0.4 N·m) across and after the site zone and low values in the bays, with predictions of bedload flow spreading towards the beaches (Figure 8b). However, a high load of sediments was transported in the near-field turbines site due to high surrounding velocities.
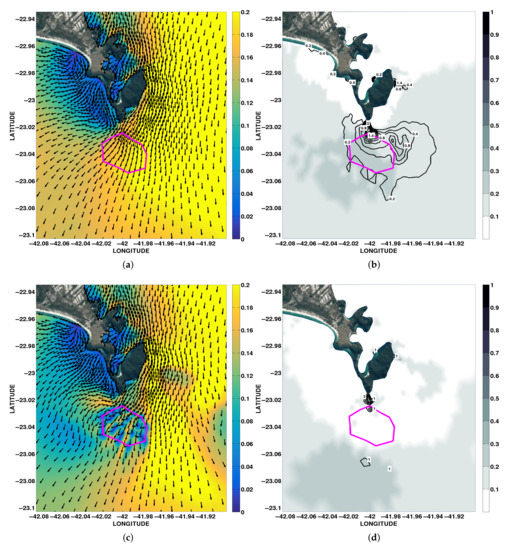
Figure 8.
Rio de Janeiro turbines site. Simulation without the presence of turbines (upper panel) and with the turbines (lower panel), as the sites are represented by the magenta boundary line. (a,c) Mean superficial velocity (m·s) with mean direction in vectors; (b,d) bed shear stress (N·m) in black and white colormap with integrated bedload transport (cm·s) in black isolines.
By approaching the turbines scenario (Figure 8, lower panel), it became clear that the disturbance promoted by the turbines in the mean surface velocity (Figure 8c) produced a wake street downstream and a bifurcation in the current core direction. This resulted in a divergence of flow with intensified jets west and east of the site. The bottom behavior changed as well, with a major decrease in bed shear stress closer to the southern Arraial do Cabo coastline and also eastward from the site, with 0.4 N·m southwards. This decrease promoted an accumulation of bedload in the south (1 cm·s) and north (3 cm·s) of the site near the coastline.
Several spatial patterns of net transport direction can be recognized with the presence of turbines. First, the net sediment transport was dominantly coastward (Figure 6, in RS), retained in the middle of the sites or offshore (Figure 7, at SP), or at last retained at the coast with mild transport offshore (Figure 8, at RJ). Second, the losses of velocity for energy conversion affected drastically the bed shear stress, which changed the bottom dynamics entirely. This generated a well-developed new pattern of transport that had not been observed in the undisturbed simulation (case A).
In this scenario, the combined effects of astronomical and meteorological forces were considered, with wind-induced currents being extremely significant in shallow waters, thereby influencing the bottom morphodynamic evolution. For bottom evolution, we observed that the presence of turbines created an increase/decrease in the velocity of currents and caused higher erosion/deposition regions.
The influences on the water column are focused on a transect approach (Figure 1b–d) where vertical sections were taken from the sites along shore and cross shore. Figure 9, Figure 10 and Figure 11 comprise colored surfaces representing the intensity and the vectors indicate the direction of the current velocity.
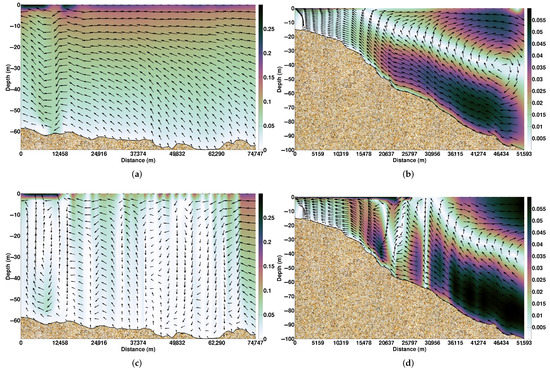
Figure 9.
Vertical cross sections for the Rio Grande do Sul turbines site; colored surface shows mean velocity (m·s) while vectors show direction. Simulation without the presence of turbines (upper panel) and with the turbines (lower panel). (a,c) Refers to RS1 transect; (b,d) refers to RS2 transect. See Figure 1b. for a better location of the transects.
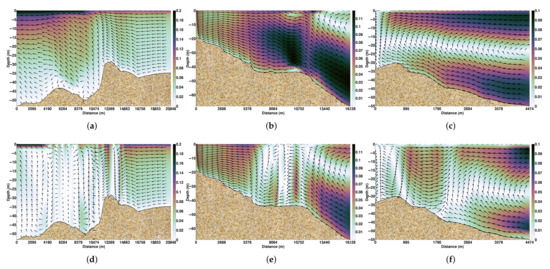
Figure 10.
Vertical cross sections for the São Paulo turbines site; colored surface shows mean velocity (m·s) while vectors show direction. Simulation without the presence of turbines (upper panel) and with the turbines (lower panel). (a,d) Refers to SP1 transect; (b,e) refers to SP2 transect; (c,f) refers to SP3 transect. See Figure 1c. for a better location of the transects.
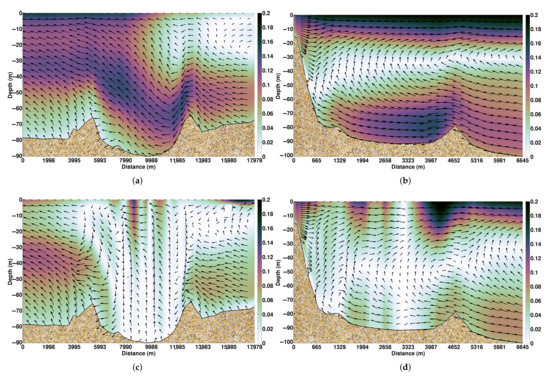
Figure 11.
Vertical cross sections for the Rio de Janeiro turbines site; colored surface shows mean velocity (m·s) while vectors show direction. Simulation without the presence of turbines (upper panel) and with the turbines (lower panel). (a,c) Refers to RJ1 transect; (b,d) refers to RJ2 transect. See Figure 1d. for a better location of the transects.
In order to consider the case without turbines, we analyzed the RS vertical cross sections (Figure 9a,b). In the along shore transect (RS1), the entire water column current direction was southwards, with high velocities (0.30 m·s) in the surface decaying in intensity towards the bottom. The cross section (Figure 9b, RS2) showed typical behavior of a western shoreline in the south hemisphere under a period of continued influence by northern winds; the vertical circulation pattern resulted in an upwelling condition with a surface transport offshore.
The vertical hydrodynamic effects of adding turbines broke down the normal current direction and intensity, developing (Figure 9c, RS1) strong vertical gradients along shore. These vertical gradients later influenced the bed shear stress because velocity was depleted after energy conversion. In the cross shore vertical section (Figure 9d, RS2), the regular transport balance was interrupted with the presence of the turbines, which compromised vertical circulation. This resulted in bottom current intensification towards the coast, which in time increased bedload transportation.
Due to the SP site being separated into two turbine farms, three transects were analyzed. First, the non-disturbed simulation showed a dominant southward current with high intensity in the surface layer (Figure 10, at 0.2 m·s, SP1). In addition, an interesting feature was observed at the middle of the cross section. A crest slope at 12,569 m (with 30 m depth, due to shoreline steeping bathymetry), followed by a wide 2 km gap (with 50 m depth), created strong vertical circulation. Within this gap, fast bottom current intensity flowed toward the São Sebastião Island, developing high bedload and bed elevation rates (Figure 7).
Due to the topography mentioned above, the vertical cross section SP2 (Figure 10b) showed dynamic bottom circulation with velocity around 0.12 m·s and with main direction headed for the island shore. In addition, the northern site cross section SP3 (Figure 10c) presented a regular wind-dominated upwelling pattern with residual surface currents offshore, while the bottom currents flowed against the coastline.
The hydrodynamic aspect of the flow changed greatly with the presence of the turbines (Figure 10, lower panel). The south-directed current (Figure 10d) was abruptly interrupted by the turbines’ velocity sink from conversion, developing vertical, low-velocity structures. This promoted unbalanced flows through the bottom gap and resulted in increased bottom velocity. The increased bottom velocity intensified sediment transport in this channel (as seen in Figure 7e,f).
For SP2 transect, the high lateral velocity observed before the turbines were deployed is now absent due to the presence of the turbines. Consequently, this reduced the flow input towards the coast. As for the SP3 transect (Figure 10f), the flow was partially divided for the turbines, developing a discontinuity in the water column residual flow towards the ocean. This division in two recirculation cells developed a sedimentation setup within the shoreline island with 6 cm.s bedload rates (Figure 7e) and also promoted a widening span of sediment offshore (Figure 7d).
The RJ site (Figure 11) has a distinct feature; the turbines were settled in a dome-shaped topography—bounded with the 70 m isobath and deepened to 90 m. Surface stream flows usually lost velocity as the bottom slopes developed vertical circulation, as observed in Figure 11a (at 12,000 m). This strong bottom circulation influenced high bed shear stress in this transect (Figure 8b). The vertical cross section (Figure 11b, RJ2) presented strong surface velocity gradients due to the conformation of the Arraial do Cabo east shoreline. In addition, this created intense bottom circulation as this region is known for severe upwelling events [20].
As expected, energy conversion extracted great amounts of momentum from the water column, impacting greatly the vertical circulation in the region (Figure 11c), while the flow developed by the bottom topography was lost due to energy conversion. Vertical circulation increased, while circulation in the bottom depleted, reducing the bed shear stress (Figure 8e). Finally, the RJ2 transect showed an attenuated bottom and surface circulation, which may result in upwelling breakage in the region.
The South–Southeastern Brazilian Continental Shelf has been described from the geomorphological point of view by Zembruscki [65], who divided the area into four sectors: the Cabo Frio-Cabo de São Tomé Sector, the SBB, the Florianópolis-Mostardas Sector, and the Rio Grande Cone. The turbine sites studied in this article occur in two of these sectors, which differentiate themselves in geomorphological, hydrodynamic, and sedimentological characteristics.
The SBB corresponds to the arc-shaped sector, ranging from latitude 22° S to 28° S, comprising the SP and RJ turbine sites. The shelf width varies between 70 and 230 km with shelf break located between 120 and 180 m. In terms of local features, this sector is characterized by the presence of channels, which may or may not be related to deeper canyons presented on the continental slope, and they represent the main drainage systems developed during low sea level periods [66].
According to Nagai et al. [67], the hydrodynamic processes in the SBB, oceanic water mass dynamics, and shelf circulation are the main controlling factors for sediment distribution in the upper continental margin, resulting in the establishment of differences in sedimentation rates. Moreover, Michaelovitch de Mahiques et al. [68] stated that sedimentation rates are greater near Arraial do Cabo and southeast of São Sebastião Island; despite this, SP and RJ sites present differing characteristics.
The hydrodynamic dominant conditions in the inner shelf of São Sebastião Island is the offshore flow of the BC meanders, which is enhanced by the Coastal Waters motion northwards; also, the inner shelf flow is strongly dominated by wind-driven and wave-driven currents [68]. In addition, the combination of dynamic processes and complex bottom and coastline morphologies yields the transport of suspended terrigenous material to deeper areas of the shelf [69].
While the RJ site sedimentary processes seem to be influenced by the Brazil Current (BC) flow along the Southwestern Atlantic continental margin [70,71], the interaction between coastlines change southwards and, wind direction enhanced the upwelling of the South Atlantic Central Water and, consequently, increases deposition.
The other sector defined in the aforementioned work by Zembruscki [65] is the Rio Grande Cone sector, which is the southernmost and most irregular region of the Southern Brazilian shelf, situated at 28° S to 35° S, containing the RS turbine farm. Its width varies from 100 to 200 km with a shelf break lying at between 100 and 160 m and is characterized by the presence of elongated sand banks.
Due to the presence of Patos Lagoon, in the SBS there is a great amount of terrigenous sediment from riverine discharge being advected towards Patos Lagoon Plume into the inner continental shelf [44]. Apart from this process, the bottom dynamics and sediment transport are mainly promoted by wind-driven currents and waves [46,72].
The residual currents in the RS cases showed that the currents were strongly influenced by the wind direction. Marques et al. [46] showed that the wind setup was the primary mechanism that controlled the mesoscale dynamics of the SBS. As the wind changed direction and increased in intensity, coastal currents were usually driven in the same direction as the wind, and the fluid motion followed the dominant wind setup.
Notwithstanding, the remobilization of sediments is favored by the generally turbulent bottom-currents, which are locally enhanced along a steep slope (such as SBB). Accordingly, lower flow velocities are related to smoother slopes (such as SBS) ([73], apud [74]).
Regarding the presence of turbines, one turbine impact will be localized (<1 km), while arranging devices in arrays or farms increases significantly the potential impact to regional (1–10 km) or far-field scales (>10 km) [75], where sediment dynamics could become important [76]. As concluded by Ross et al. [77], when using the TELEMAC model coupled with suspended sediments, morphological changes are expected to occur over time, resulting in sediment accumulation and new bottom features as observed in Figure 6b,d.
Turbines in the marine environment are expected to increase erosion near the rotor, suspend sediments, and transport those sediments downstream. A turbine array may transport sediments farther [1]. In a series of experiments in a long flume with turbines [78], the velocity decreased in the entire water column, as observed in cross section analysis; the velocity was severely depleted by the turbines in all water columns, despite their location; and no flow recovery was recorded after 12.5 diameters downstream from the turbine. In addition, an erosion area with a horseshoe shape (scour) was generated near the turbine.
When the morphodynamics change as a result of an object or structure, the process is referred to as scour [75]. For the marine renewable energy industry, morphodynamics and scour are important for determining scales and rates of accretion and erosion as a direct result of any device, array, or tidal range scheme development [79].
According to Júnior and Moisés G. Tessler [80], only 161 sediment samples were collected during the Brazilian research program REVIZEE (Assessment of the Sustainable Potential of Living Resources in the Exclusive Economic Zone, in portuguese Avaliação do Potencial Sustentável de Recursos Vivos na Zona Econômica Exclusiva), this database being the most comprehensive to date. In the REVIZEE report, the RS site of the turbines showed a dominance of fine sediments, while the SP region has a small area of clay in addition to fine sediments. The RJ region not only presents an extent area with coarse sand but also presents spots of clay and fine sediments.
Due to the vast study area (approximately 2000 km per 700 km wide) and the lack of precise grain size data, some changes are expected in the deposition pattern if more sedimentary data are added to the model. If local riverine or estuarine discharges would be added, small-scale turbulent and mixing patterns would become important for sediment deposition. Fluvial fine sediment input throughout riverine discharge could increase suspended sediment concentrations and alter grain size distributions.
Adding turbines to the environment removes part of the kinetic energy from coastal currents, generating divergence, convergence, and wake zones in accordance with the dominant direction of the currents [4]. This decrease in current intensity promotes an increase in total suspended matter at the site. The residual effect associated with the presence of turbines could be more related to sediment selection with a predominance of coarse sediments nearby the site while fine sand and silt will deposit farther away, increasing bed evolution. Waves will also enhance sediment dispersion.
Extracting energy from the marine environment will clearly alter local and possibly regional hydrodynamics and morphodynamics. Although, for most extraction scenarios, the influence on currents is likely to be very small over time and the influence on bed shear stress will be greater [75]. A farm with 100 turbines or fewer presents very few system-wide effects, making changes to the physical system less of a concern for decision makers [81,82], while more small scale studies are highly recommended in order to fully comprehend every process related to each conversion equipment and its desired location.
4. Conclusions
In this study, we presented a proposal for the usage and impacts of marine current renewable turbines in the South–Southeastern Brazilian Inner Shelf. Proceeding with 10 years of simulation using reliable data, we were able to simulate the coastal currents affecting the studied region and assess the real output that the currents offer for energy production. Three regions were considered viable for the application of marine current turbines, and they are outlined as follows:
- Rio Grande do Sul turbines farm: The greatest site studied with 440 km of area, accounting for 87 turbines.
- The extracted power from this site on average was 45.30 kW·day, reaching a maximum power output of 539 kW·day produced during the entire period 16.55 MW.
- The RS site presented noteworthy morphodynamical changes due to the presence of turbines. The bed shear stress was reduced to almost zero in the entire site due to surface velocity depletion. Allied with bed shear stress reduction, two zones of deposition across the borders of the site appeared.
- São Paulo turbines farm: within an area of 13.78 km, 61 turbines were defined.
- The mean power obtained from this site was 22.94 kW·day, reaching maximum power output of 237.47 kW·day and generating 8.38 MW over 10 years.
- The presence of the turbines caused drastic changes in the mean surface hydrodynamics. This affected considerably the morphodynamic processes, such as increased bedload rates southeast of São Sebastião Island. Bed shear stress changed to almost zero values inside the turbine sites.
- Rio de Janeiro turbines farm: 23 marine turbines were set inside a 10 km region.
- For this farm, the average power was 6.75 kW·day reaching maximum power output of 258.09 kW·day and producing almost 2.47 MW during the entire simulation.
- The turbines caused disturbances in the mean surface velocity, which generated wake street patterns downstream and also a bifurcation/divergence in the current’s core direction. This impacted the bottom behavior as well. A major decrease in bed shear stress promoted an accumulation of bedload in the south and north of the site near the coastline.
The power analysis demonstrated that the total energy output is outstanding (approximately 1775 GWh) and is able to supply 54,181 residences. The average residual surface current direction corroborated with the literature as a mean flow southwards, while the bottom evolution was also impacted by the development of new zones of sediment erosion and deposition nearshore, guided by the hydrodynamic changes.
Speaking in terms of three dimensions, towards the vertical cross sections, the flow behavior presented disturbances as expected. The entire water column was highly affected by energy conversion from the turbines, creating vertical circulation that increased lateral flow. This also affects sediment transport towards the bottom.
In summary, the dynamic forces that affected the RS and SP sites were the wind-driven circulations acting on the inner portions of the shelf, while in the RJ site, the Brazil Current meandering is the most important hydrodynamic factor that determined sedimentation in the area.
Although this study addressed the environmental impact of marine current turbine farms over 10 years, it is still challenging to propose the usage of marine current turbine farms while developing methods to reduce its environmental impact. A consensus exists among researchers that physical oceanographic processes play a critical role in structuring the flow pattern of turbines in the extraction of kinetic energy. Perhaps a more systemic review is needed. Oceanographic, sedimentological, and biological processes are indubitably intertwined and must be considered together for a proper understanding of the physical processes and ecosystem dynamics that are impacted by marine turbines.
In future studies, we will aim at some differing approaches: (1) compiling data from sediment grain size in all Brazilian Continental Shelf, while adding the influence of waves into the model towards the usage of the TOMAWAC module in order to improve the bottom transport; (2) including the suspended load in the total sediment transport in order to accurately account for suspended matter around turbines and its vicinity impacts regarding a wider range of grain sizes; (3) an impact absent in this work is the influence on biological processes, which will be drastically affected (benthic community); (4) increasing mesh definitions around the sites in order to study scour in-site; and (5) a cost/material assessment must be performed, ensuing liability. Following these paths, efforts to improve location positioning towards the main stream incident flow shall be increased for future works.
Supplementary Materials
The following supporting information can be downloaded at: https://www.mdpi.com/article/10.3390/pr10020340/s1, Supplementary Materials File: Planilha1.
Author Contributions
Conceptualization, E.d.P.K. and W.C.M.; methodology, E.d.P.K. and W.C.M.; validation, E.d.P.K. and W.C.M.; formal analysis, E.d.P.K., P.H.O., and W.C.M.; investigation, E.d.P.K. and P.H.O.; resources, W.C.M.; data curation, E.d.P.K. and P.H.O.; writing—original draft preparation, E.d.P.K.; writing—review and editing, E.d.P.K. and P.H.O.; visualization, E.d.P.K. and P.H.O.; supervision, W.C.M.; project administration, W.C.M.; funding acquisition, E.d.P.K. and W.C.M. All authors have read and agreed to the published version of the manuscript.
Funding
This research was funded by Conselho Nacional de Desenvolvimento Científico e Tecnológico (CNPq) under contract 304227/2016-1 and by the Fundação de Amparo à Pesquisa do Estado do Rio Grande do Sul (FAPERGS) that sponsored this research under contracts 17/2551-001159-7 and the Coordenação de Aperfeiçoamento de Pessoal de Nível Superior—Brasil (CAPES—Finance Code 001) for bursaries related to Programa Nacional de Pós Doutorado.
Institutional Review Board Statement
Not applicable.
Informed Consent Statement
Not applicable.
Data Availability Statement
Data regarding Figure 4 are available in this article.
Acknowledgments
Special thanks to the Supercomputing Center of the Federal University of Rio Grande do Sul (CESUP-UFRGS) and the Sdumont Supercomputer from the Laboratório Nacional de Computação Científica (LNCC) (project INFOCOS-SDUMONT-2020-#207998 ), where most of the computational work was performed. Furthermore, E.K. would like to make a tribute to Professor and Advisor Wiliam Correa Marques, whose passing caused by COVID-19 complications was a huge loss to friends and family, in addition to the University and entire academic community.
Conflicts of Interest
The authors declare no conflict of interest.
References
- Copping, A.; Sather, N.; Hanna, L.; Whiting, J.; Zydlewski, G.; Staines, G.; Gill, A.; Hutchison, I.; O’hagan, A.M.; Simas, T.; et al. Annex IV 2016 State of the Science Report: Environmental Effects of Marine Renewable Energy Development Around the World; Technical Report; Implementing Agreement on Ocean Energy Systems: Paris, France, 2016. [Google Scholar]
- Ng, K.W.; Lam, W.H.; Ng, K.C. 2002–2012: 10 Years of Research Progress in Horizontal-Axis Marine Current Turbines. Energies 2013, 6, 1497–1526. [Google Scholar] [CrossRef]
- Finkl, C.W.; Charlier, R. Electrical power generation from ocean currents in the Straits of Florida: Some environmental considerations. Renew. Sustain. Energy Rev. 2009, 13, 2597–2604. [Google Scholar] [CrossRef]
- Marques, W.C.; Fernandes, E.H.L.; Malcherek, A.; Rocha, L.A.O. Energy converting structures in the Southern Brazilian Shelf: Energy Conversion and its influence on the hydrodynamic and morphodynamic processes. J. Earth Sci. Geotech. Eng. 2012, 1, 61–85. [Google Scholar]
- Akimoto, H.; Tanaka, K.; Uzawa, K. A conceptual study of floating axis water current turbine for low-cost energy capturing from river, tide and ocean currents. Renew. Energy 2013, 57, 283–288. [Google Scholar] [CrossRef]
- Yang, X.; Haas, K.A.; Fritz, H.M. Evaluating the potential for energy extraction from turbines in the gulf stream system. Renew. Energy 2014, 72, 12–21. [Google Scholar] [CrossRef]
- Goundar, J.N.; Ahmed, M.R. Marine current energy resource assessment and design of a marine current turbine for Fiji. Renew. Energy 2014, 65, 14–22. [Google Scholar] [CrossRef]
- Kirinus, E.D.P.; Marques, W.C.; Jung, B.M.; Stringari, C.E.; Matzenauer, H.B. Evaluating current power availability for energy conversion along the Southern Brazilian Shelf. Int. J. Mar. Energy 2015, 10, 97–112. [Google Scholar] [CrossRef]
- Kirinus, E.D.P.; Marques, W.C. Viability of the application of marine current power generators in the south Brazilian shelf. Appl. Energy 2015, 155, 23–34. [Google Scholar] [CrossRef]
- Shirasawa, K.; Tokunaga, K.; Iwashita, H.; Shintake, T. Experimental verification of a floating ocean-current turbine with a single rotor for use in Kuroshio currents. Renew. Energy 2016, 91, 189–195. [Google Scholar] [CrossRef]
- Tseng, R.S.; Chang, Y.C.; Chu, P.C. Use of Global Satellite Altimeter and Drifter Data for Ocean Current Resource Characterization. In Marine Energy Renewable: Resource Characterization and Physical Effects, 1st ed.; Yang, Z., Copping, A., Eds.; Springer: Seattle, WA, USA, 2017; Chapter 7; pp. 159–177. [Google Scholar]
- Kirinus, E.D.P.; Oleinik, P.H.; Costi, J.; Marques, W.C. Long-term simulations for ocean energy off the Brazilian coast. Energy 2018, 163, 364–382. [Google Scholar] [CrossRef]
- Bane, J.M.; He, R.; Muglia, M.; Lowcher, C.F.; Gong, Y.; Haines, S.M. Marine Hydrokinetic Energy from Western Boundary Currents. Annu. Rev. Mar. Sci. 2017, 9, 105–123. [Google Scholar] [CrossRef] [PubMed]
- Bryden, H.L.; Beal, L.M.; Duncan, L.M. Structure and Transport of the Agulhas Current and Its Temporal Variability. J. Oceanogr. 2005, 61, 479–492. [Google Scholar] [CrossRef]
- Halkin, D.; Rossby, T. The Structure and Transport of the Gulf Stream at 73° W. J. Phys. Oceanogr. 1985, 15, 1439–1452. [Google Scholar] [CrossRef]
- Leaman, K.D.; Molinari, R.L.; Vertes, P.S. Structure and Variability of the Florida Current at 27° N: April 1982–July 1984. J. Phys. Oceanogr. 1987, 17, 565–583. [Google Scholar] [CrossRef]
- Zhu, X.H.; Kaneko, A.; Saito, T.; Gohda, N. Kuroshio Stream path variation and its associated velocity structures south of Shikoku, Japan. Geophys. Res. Lett. 2001, 28, 4615–4618. [Google Scholar] [CrossRef]
- VanZwieten, J.H.; Duerr, A.E.S.; Alsenas, G.M.; Hanson, H.P. Global ocean current energy assessment: An initial look. In Proceedings of the 1st Marine Energy Technology Symposium (METS13) Hosted by the 6th Annual Global Marine Renewable Energy Conference, Washington, DC, USA, 15–17 April 2013. [Google Scholar]
- Dottori, M.; Castro, B.M. The response of the Sao Paulo Continental Shelf, Brazil, to synoptic winds. Ocean Dyn. 2009, 59, 603–614. [Google Scholar] [CrossRef]
- Castro, B.M. Summer/winter stratification variability in the central part of the South Brazil Bight. Cont. Shelf Res. 2014, 89, 15–23. [Google Scholar] [CrossRef]
- De Souza, R.B.; Robinson, I.S. Lagrangian and satellite observations of the Brazilian Coastal Current. Cont. Shelf Res. 2004, 24, 241–262. [Google Scholar] [CrossRef]
- Möller, O.O.J.; Piola, A.R.; Freitas, A.C.; Campos, E.J.D. The effects of river discharge and seasonal winds on the shelf off southeastern South America. Cont. Shelf Res. 2008, 28, 1607–1624. [Google Scholar] [CrossRef]
- Hervouet, J.M. Free Surface Flows: Modelling with the Finite Element Methods; Wiley & Sons: Chichester, UK, 2007. [Google Scholar]
- Pham, C.T.; Joly, A. Telemac Modelling System: Telemac-3D Software—Operating Manual; Technical Report; EDF: Chateau, France, 2016. [Google Scholar]
- Tassi, P.; Villaret, C. Sisyphe v6.3 User’s Manual; Technical Report; EDF: Chateau, France, 2014. [Google Scholar]
- Gorlov, A. Tidal Energy. In Elements of Physical Oceanography: A Derivative of the Encyclopedia of Ocean; Academic Press: Cambridge, MA, USA, 2001; pp. 2955–2960. [Google Scholar] [CrossRef]
- Cornett, A.M. A Global Wave Energy Resource Assessment. In Proceedings of the Eighteenth International Offshore and Polar Engineering Conference, Vancouver, BC, Canada, 6–11 July 2008; Volume 8, p. 9. [Google Scholar]
- Myers, L.; Bahaj, A.S. Simulated electrical power potential harnessed by marine current turbine arrays in the Alderney Race. Renew. Energy 2005, 30, 1713–1731. [Google Scholar] [CrossRef]
- Giles, J.; Myers, L.; Bahaj, A.; Shelmerdine, B. The dowstream wake response of marine current energy converters operating in shallow tidal flows. In World Renewable Energy Congress; Marine and Ocean Technology: Linköping, Sweden, 2011; pp. 2270–2277. [Google Scholar]
- Myers, L.E.; Bahaj, A.S. An experimental investigation simulating flow effects in first generation marine current energy converter arrays. Renew. Energy 2012, 37, 28–36. [Google Scholar] [CrossRef]
- Cummings, J.; Carroll, S. Software User’s Manual for the Navy Coupled Ocean Data Assimilation (NCODA) System; Technical Report; Naval Research Laboratory: Monterey, CA, USA, 2006. [Google Scholar]
- Pham, C.T.; Lyard, F. Use of tidal harmonic constants databases to force open boundary conditions in TELEMAC. In XIX TELEMAC-MASCARET User Conference; Bourban, S., Durand, N., Hervouet, J.M., Eds.; HR Wallingford: Oxford, UK, 2012; pp. 165–172. [Google Scholar]
- Egbert, G.D.; Erofeeva, S.Y. Efficient Inverse Modeling of Barotropic Ocean Tides. Am. Meteorol. Soc. 2002, 19, 183–204. [Google Scholar] [CrossRef]
- Soares, I.D.; Kourafalou, V.; Lee, T.N. Circulation on the western South Atlantic continental shelf: 2. Spring and autumn realistic simulations. J. Geophys. Res. 2007, 112, C04003. [Google Scholar] [CrossRef]
- Cerda, C.; Castro, B.M. Hydrographic climatology of South Brazil Bight shelf waters between Sao Sebastiao (24° S) and Cabo Sao Tome (22° S). Cont. Shelf Res. 2014, 89, 5–14. [Google Scholar] [CrossRef]
- Da Silveira, I.C.A.; Schmidt, A.C.K.; Campos, E.J.D.; de Godoi, S.S.; Ikeda, Y. A corrente do Brasil ao largo da costa leste brasileira. Rev. Bras. Oceanogr. 2000, 48, 171–183. [Google Scholar] [CrossRef]
- EPE. Balanço Energético Nacional 2017: Ano Base 2016; Technical Report; Empresa de Pesquisa Energética: Rio de Janeiro, Brazil, 2017. [Google Scholar]
- Hagerman, G.; Polagye, B.; Bedard, R.; Previsic, B. Methodology for Estimating Tidal Current Energy Resources and Power Production by Tidal in-Stream Energy Conversion (TISEC) Devices; Technical Report; Rep. EPRI-TP-001 NA Rev 2; Electric Power Research Institute: Palo Alto, CA, USA, 2006. [Google Scholar]
- Ortega-Achury, S.L.; McAnally, W.H.; Davis, T.E.; Martin, J.L. Hydrokinetic Power Review; Technical Report; Bagley College of Engineering: Starkville, MS, USA, 2010. [Google Scholar]
- Torrence, C.; Compo, G.P. A practical guide to wavelet analysis. Bull. Am. Meteorol. Soc. 1998, 79, 61–78. [Google Scholar] [CrossRef]
- Liu, Y.; Liang, X.S.; Weisberg, R.H. Rectification of the bias in the wavelet power spectrum. J. Atmos. Ocean. Technol. 2007, 24, 2093–2102. [Google Scholar] [CrossRef]
- Toldo, E.J.; Almeida, L.; Dillenburg, S.; Tabajara, L.; Borghetti, C. Parâmetros MorfodinâMicos e Deriva Litorânea da Praia de Tramandaí—RS. Geosul 1993, 8, 75–88. [Google Scholar]
- Soares, I.D.; Kourafalou, V.; Lee, T.N. Circulation on the western South Atlantic continental shelf: 1. Numerical process studies on buoyancy. J. Geophys. Res. 2007, 112, C04002. [Google Scholar] [CrossRef]
- Marques, W.C.; Fernandes, E.H.; Monteiro, I.O.; Möller, O.O. Numerical modeling of the Patos Lagoon coastal plume, Brazil. Cont. Shelf Res. 2009, 29, 556–571. [Google Scholar] [CrossRef]
- Parise, C.K.; Calliari, L.J.; Krusche, N. Extreme Storm Surges in the South of Brazil: Atmospheric Conditions and Shore Erosion. Braz. J. Oceanogr. 2009, 57, 175–188. [Google Scholar] [CrossRef]
- Marques, W.C.; Fernandes, E.H.L.; Moller, O.O. Straining and advection contributions to the mixing process of the Patos Lagoon coastal plume, Brazil. J. Geophys. Res. 2010, 115, C06019. [Google Scholar] [CrossRef]
- Marques, W.C.; Fernandes, E.H.L.; Moraes, B.C.; Möller, O.O.; Malcherek, A. Dynamics of the Patos Lagoon coastal plume and its contribution to the deposition pattern of the southern Brazilian inner shelf. J. Geophys. Res. Ocean. 2010, 115, C10045. [Google Scholar] [CrossRef]
- Costa, R.L.; Moller, O.O. Study of the structure and variability of currents in the area of the inner shelf off Rio Grande (RS, Brazil), southwest of the South Atlantic during spring-summer 2006–2007. J. Integr. Coast. Zone Manag. 2011, 11, 273–281. [Google Scholar] [CrossRef]
- Marques, W.C. The temporal variability of the freshwater discharge and water levels at the Patos Lagoon, Brazil. Int. J. Geosci. 2012, 3, 22456. [Google Scholar] [CrossRef]
- Andrade, M.; Toldo, E.J.; Nunes, J.C. Variabilidade das correntes na plataforma interna ao largo de Tramandaí, RS durante o verão de 2014. Pesqui. Geociências 2016, 43, 289–298. [Google Scholar] [CrossRef]
- Pereira, M.D.; Schettini, C.A.F.; Omachi, C.Y. Caracterização de feições oceanográficas na plataforma de Santa Catarina através de imagens orbitais. Rev. Bras. Geofísica 2009, 27, 81–93. [Google Scholar] [CrossRef]
- Truccolo, E.C. Assessment of the wind behavior in the northern coast of Santa Catarina. Rev. Bras. Meteorol. 2011, 26, 451–460. [Google Scholar] [CrossRef]
- Stech, J.L.; Lorenzzetti, J.A. The response of the South Brazil Bight to the passage of wintertime cold fronts. J. Geophys. Res. 1992, 97, 9507. [Google Scholar] [CrossRef]
- Castro, B.M.; Lee, T.N. Wind-forced sea level variability on the southeast Brazilian shelf. J. Geophys. Res. 1995, 100, 16045. [Google Scholar] [CrossRef]
- Castelao, R.M.; Barth, J.A. Upwelling around Cabo Frio, Brazil: The importance of wind stress curl. Geophys. Res. Lett. 2006, 33, L03602. [Google Scholar] [CrossRef]
- Castro, B.M.; Lorenzzetti, J.A.; da Silveira, I.C.A.; de Miranda, L.B. Estrutura termohalina e circulação na região entre o Cabo de São Tomé (RJ) e o Chuí (RS). In O Ambiente Oceanográfico da Plataforma Continental e do Talude na Região Sudeste-sul do Brasil; Rossi-Wongtschowski, C.L.D.B., Madureira, L.S., Eds.; Edusp: São Paulo, Brazil, 2006; Chapter 1; pp. 11–120. [Google Scholar]
- Palma, E.D.; Matano, R.P. Disentangling the upwelling mechanisms of the South Brazil Bight. Cont. Shelf Res. 2009, 29, 1525–1534. [Google Scholar] [CrossRef]
- Matano, R.P.; Palma, E.D.; Piola, A.R. The influence of the Brazil and Malvinas Currents on the Southwestern Atlantic Shelf circulation. Ocean Sci. 2010, 6, 983–995. [Google Scholar] [CrossRef]
- Swisher, J.N.; Jannuzz, G.S.D.M.; Redlinger, R.Y. Tools and Methods for Integrated Resource Planning: Improving Energy Efficiency and Protecting the Environment; United Nations Environmental Programme: Nairobi, Kenya, 1997. [Google Scholar]
- EMEC. Environmental Impact Assessment (EIA) Guidance for Developers at the European Marine Energy Centre; European Marine Energy Centre: Stromness, UK, 2005; p. 22. [Google Scholar]
- Dolman, S.; Simmonds, M. Towards best environmental practice for cetacean conservation in developing Scotland’s marine renewable energy. Mar. Policy 2010, 34, 1021–1027. [Google Scholar] [CrossRef]
- Shields, M.A.; Woolf, D.K.; Grist, E.P.M.; Kerr, S.A.; Jackson, A.C.; Harris, R.E.; Bell, M.C.; Beharie, R.; Want, A.; Osalusi, E.; et al. Marine renewable energy: The ecological implications of altering the hydrodynamics of the marine environment. Ocean Coast. Manag. 2011, 54, 2–9. [Google Scholar] [CrossRef]
- Vennell, R. Estimating the power potential of tidal currents and the impact of power extraction on flow speeds. Renew. Energy 2011, 36, 3558–3565. [Google Scholar] [CrossRef]
- Fallon, D.; Hartnett, M.; Olbert, A.; Nash, S. The effects of array configuration on the hydro-environmental impacts of tidal turbines. Renew. Energy 2014, 64, 10–25. [Google Scholar] [CrossRef]
- Zembruscki, S.G. Geomorfologia da Margem Continental sul Brasileira e Das Bacias Oceânicas Adjacentes; Technical report; Projeto REMAC: Rio de Janeiro, Brazil, 1979. [Google Scholar]
- De Mahiques, M.M.; Sousa, S.H.D.M.E.; Furtado, V.V.; Tessler, M.G.; Toledo, F.A.D.L.; Burone, L.; Figueira, R.C.L.; Klein, D.A.; Martins, C.C.; Alves, D.P.V. The Southern Brazilian shelf: General characteristics, quaternary evolution and sediment distribution. Braz. J. Oceanogr. 2010, 58, 25–34. [Google Scholar] [CrossRef]
- Nagai, R.; Ferreira, P.; Mulkherjee, S.; Martins, M.; Figueira, R.; Sousa, S.; Mahiques, M. Hydrodynamic controls on the distribution of surface sediments from the southeast South American continental shelf between 23°S and 38°S. Cont. Shelf Res. 2014, 89, 51–60. [Google Scholar] [CrossRef]
- Michaelovitch de Mahiques, M.; Almeida da Silveira, I.C.; de Mello e Sousa, S.H.; Rodrigues, M. Post-LGM sedimentation on the outer shelf–upper slope of the northernmost part of the São Paulo Bight, southeastern Brazil. Mar. Geol. 2002, 181, 387–400. [Google Scholar] [CrossRef]
- De Mahiques, M.M.; Mishima, Y.; Rodrigues, M. Characteristics of the sedimentary organic matter on the inner and middle continental shelf between Guanabara Bay and São Francisco do Sul, southeastern Brazilian margin. Cont. Shelf Res. 1999, 19, 775–798. [Google Scholar] [CrossRef]
- Stramma, L.; England, M. On the water masses and mean circulation of the South Atlantic Ocean. J. Geophys. Res. Ocean. 1999, 104, 20863–20883. [Google Scholar] [CrossRef]
- Campos, E.J.D.; Velhote, D.; da Silveira, I.C.A. Shelf break upwelling driven by Brazil current cyclonic meanders. Geophys. Res. Lett. 2000, 27, 751–754. [Google Scholar] [CrossRef]
- Marques, W.C.; Stringari, C.E.; Eidt, R.T. The Exchange Processes of the Patos Lagoon Estuary – Brazil: A Typical El Niño Year versus a Normal Meteorological Conditions Year. Adv. Water Resour. Prot. 2014, 2, 11–20. [Google Scholar]
- McCave, I. Erosion and deposition by currents on submarines slopes. Bull. L’Institut Géologie Bassin D’Aquitaine 1982, 31, 47–55. [Google Scholar]
- Franco-Fraguas, P.; Burone, L.; Mahiques, M.; Ortega, L.; Urien, C.; Muñoz, A.; López, G.; Marin, Y.; Carranza, A.; Lahuerta, N.; et al. Hydrodynamic and geomorphological controls on surface sedimentation at the Subtropical Shelf Front / Brazil–Malvinas Confluence transition off Uruguay (Southwestern Atlantic Continental Margin). Mar. Geol. 2014, 349, 24–36. [Google Scholar] [CrossRef]
- Neill, S.P.; Robins, P.E.; Fairley, I. The Impact of Marine Renewable Energy Extraction on Sediment Dynamics. In Marine Energy Renewable: Resource Characterization and Physical Effects2, 1st ed.; Yang, Z., Copping, A., Eds.; Springer: Seattle, WA, USA, 2017; Chapter 12; pp. 279–304. [Google Scholar]
- Ahmadian, R.; Falconer, R.A. Assessment of array shape of tidal stream turbines on hydro-environmental impacts and power output. Renew. Energy 2012, 44, 318–327. [Google Scholar] [CrossRef]
- Ross, L.; Sottolichio, A.; Huybrechts, N.; Brunet, P. Tidal turbines in the estuarine environment: From identifying optimal location to environmental impact. Renew. Energy 2021, 169, 700–713. [Google Scholar] [CrossRef]
- Ramírez-Mendoza, R.; Amoudry, L.; Thorne, P.; Cooke, R.; Simmons, S.; McLelland, S.; Murphey, B.; Parsons, D.; Jordan, L.; Vybulkova, L. Impact of Scaled Tidal Stream Turbine over Mobile Sediment Beds. In Proceedings of the 11th European Wave and Tidal Energy Conference, Nantes, France, 6–11 September 2015; pp. 1–6. [Google Scholar]
- Whitehouse, R.; Sutherland, J.; O’Brien, D. Seabed scour assessment for offshore windfarm. In Proceedings of the Third International Conference on Scour and Erosion, Amsterdam, The Netherlands, 1–3 November 2006; CURNET: Gouda, The Netherlands, 2006; pp. 1–22. [Google Scholar]
- Figueiredo, A.G.; Tessler, M.G. Topografia e composição do substrato marinho da região Sudeste-Sul do Brasil. In Série documentos Revizee: Score Sul, 1st ed.; Rossi-Wongtschowski, C.L.D.B., Ed.; Instituto Oceanográfico—USP: Sao Paulo, Brazil, 2004; p. 65. [Google Scholar]
- Yang, Z.; Wang, T.; Copping, A.; Geerlofs, S. Modeling of in-stream tidal energy development and its potential effects in Tacoma Narrows, Washington, USA. Ocean Coast. Manag. 2014, 99, 52–62. [Google Scholar] [CrossRef]
- Yang, Z.; Wang, T. Modeling the Effects of Tidal Energy Extraction on Estuarine Hydrodynamics in a Stratified Estuary. Estuaries Coasts 2015, 38, 187–202. [Google Scholar] [CrossRef]


Publisher’s Note: MDPI stays neutral with regard to jurisdictional claims in published maps and institutional affiliations. |
© 2022 by the authors. Licensee MDPI, Basel, Switzerland. This article is an open access article distributed under the terms and conditions of the Creative Commons Attribution (CC BY) license (https://creativecommons.org/licenses/by/4.0/).