Abstract
Oil fields in Romania were active in the period 1900–2020, some of which will close due to declining oil production and especially due to reduced processing after the application of European Community recommendations to give up fossil fuels and the use of renewable fuel. The rehabilitation of the soil affected by hydrocarbon pollution is carried out with public funds. This is why, when transferring the land to the local community, an oil pollution assessment study is carried out. If the hydrocarbon content is less than 1000 mg/kg dry matter, the soil is not depolluted. In the Moinesti oil area, Romania, against the background of the increased incidence of breast cancers in women who worked in oil facilities, a study was conducted on the natural radioactivity of abandoned oil areas. The results of this analysis are presented and discussed in this article. It is the first study of radioactivity of the oil tank farm affected by oil pollution, its purpose being to draw attention in detecting radioactive elements when handing over land affected by oil pollution (but which respects the maximum levels of pollutant) to the local community.
1. Introduction
Exploitation of deposits of raw materials may cause exposure to ionizing radiation of workers and the environment, due to the presence of naturally occurring radioactive materials, the most exposed sectors being [,,]:
- oil and gas production,
- geothermal energy production,
- coal-fired power plants,
- groundwater filtration installations,
- extraction of ores other than uranium ores.
As can be seen from NORM (Naturally Occuring Radioactive Materials) standards, oil and gas extraction is an industry that can radioactively pollute the work environment.
A risk assessment for radioactive exposure [,,] identifies the oil and gas extraction industry as an industry with:
- -
- low risk of internal exposure of workers due to closed processing of these products,
- -
- high risk of internal exposure of workers due to the need to measure flows and the quality of final products and extraction products,
- -
- medium risk in case of environmental pollution, as the crude oil and gas processing systems have an environmental protection management system.
The first articles on the identification of radioactive pollution in the oil and gas industry were published in 1904 [] when radionuclide Ra-226 has been identified during separation of natural gas from crude oil.
In Romania, the effects of radioactive radiation on employees and the resident population in oil and natural gas extraction areas were analyzed after the closure of oil fields (as a result of the increase in diseases in the area) [].
European Community has European Council issued directives to identify minimum levels of exposure by naturally radioactive materials and radiological risk for the employees or the population [].
Radionuclides identified as occurring in hydrocarbon explorations and extractions processes in higher concentration values are Ra-226, K-40, and Ac-228 [,,,,].
Their half-life is very long, and they are present in the earth’s crust with activity concentration that depends on the type of rock.
Hydrocarbon exploration and exploitation processes achieve NORM accumulation through the following potential routes of exposure [,,]:
- -
- detritus resulting from well drilling,
- -
- the drilling fluid used to make the wells,
- -
- field water,
- -
- accumulated sediments, such as sand and sludge deposited in separators and storage tanks,
- -
- crusts formed on pipelines and in reinforcements (Figure 1),
- -
- condensed gases,
- -
- the fluid used in the interventions and repairs to the wells.
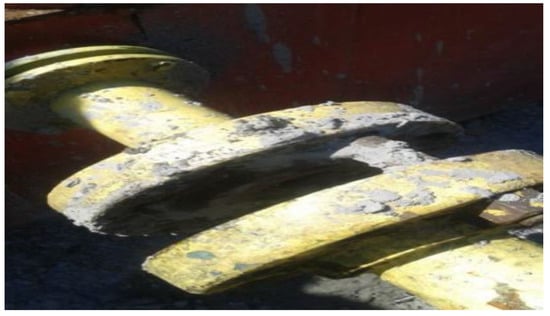
Figure 1.
Crust of oil installations (photo provided by Stefan Petrache) [].
The natural radioactivity of the Moinesti geological area has been studied.
The Moinești area is located in the northeast of Romania, being an area with crude oil, gas, and coal deposits, exploited since 1600 (geographical coordinates 46°30′48″ N 26°35′51″ E).
In the last period of time, due to the reduction of crude oil quantities and the reduction of the use of coal, most of the oil, gas, and coal operations have been abandoned.
Magma from the volcanic mountains (Harghita) was detected in the coal mines, located about 10 km from the oil extraction area.
These radioactive elements were transported by oil during its extraction.
Crude oil from the Oligocene geological era was extracted from 21 wells at depths of 280–1024 m and treated at an oil tank farm.
In this article, the authors aimed for:
- Detection of the presence of radioactive elements in the areas where the extracted crude oil has been treated and stored,
- analysis of radioactive elements present in the area of abandoned tank farms for the treatment and storage of extracted crude oil,
- the level of pollution with radioactive elements in the area of treatment and storage of the extracted crude oil,
- the level of pollution with radioactive elements in the Moinești extraction area.
2. Materials and Methods
The apparatus used to measure the Equivalent Dose (H) was the computerized portable radiation contaminant INSPECTOR (Geiger–Mueller tube to detect radiation-IMI Inspector Alert) and the VICTOREEN 451P ionization chamber dosimeter.
Gamma dose flow rates were measured by measuring the area of interest.
In the area of interest, we collected samples by soil at 5 cm and 100 cm depth.
For equipment, the determination was made at their contact and at a distance of 100 cm and a height of 150 cm.
The apparatus used to measure the Equivalent Dose Rate (H—the dose absorbed in the tissue or organ, weighted by the type and quality of radiation R) was the computerized portable radiation contaminant INSPECTOR (Geiger–Mueller tube to detect radiation-IMI Inspector Alert).
To perform soil spectrometric analyses, 50 soil samples were taken from 25 sampling points, from depths of 5 cm and 100 cm, respectively.
The soil samples were prepared in the laboratory in order to determine the concentration of gamma-emitting radionuclides.
The samples were dried in an oven at 100 °C, after which it was crushed and homogenized. These were taken mainly around installations with a high potential for NORM contamination and from areas where NORM contamination was identified following the measurement of radiation fields.
The analysis was performed by gamma spectrometry, by the multichannel analyzer spectrometric chain technique with a germanium detector.
Each measurement performed was repeated at least 5 times.
The arithmetic mean was calculated and the relative error of these measurements compared to the average value was established, being 1%.
The collected samples were divided into 5 analysis cells, and also the relative error was determined compared to the average value (being 0.08%).
3. Measuring Results
The measurement and sampling points within the analysis area (a crude oil and gas treatment plant and a storage facility for petroleum products) are shown in Table 1.

Table 1.
Equivalent Dose Rate (H) values of the equipment.
The presence of radionuclides in the soil samples is listed in Table 2.
Table 2.
Activity concentrations (Bq/kg) of Ra-226, Ac-228 and K-40 in soils.
Table 3 shows the concentration of natural radionuclides for the study area.
Table 3.
Natural radionuclide concentrations for the year 2020 in the city area at 100 mm depth and 5 km north of oil tank farm [].
The natural background dose rate for a neighboring area not affected by NORM contamination is 0.110 μSv/h [,].
4. Evaluation of the Dose of Ground Exposure to Personnel and the Resident Population
Exposure to contaminated soil for park staff and residence population is analysis in concordance with Radioactively Contaminated Land Exposure Assessment Method (RCLEA), recommended by the Department of Environment Food and Rural Affairs for Environment Food and Rural Affairs (DEFRA) in the UK [].
The scenario used to calculate the effective annual doses for employees was based on the following assumptions:
- -
- for the calculation of the annual effective dose, the area most polluted with radioactive elements was taken, namely point 7 and a depth of 100 cm,
- -
- soil contamination with radionuclides: Ra-226 (activity concentration 5203 Bq/kg), Ac-228 (activity concentration 468 Bq/kg) and K-40 (activity concentration 1018 Bq/kg),
- -
- contaminated area: 970 m2,
- -
- type of land: commercial/industrial,
- -
- type of building: concrete/brick,
- -
- age of the recipient: adult,
- -
- sex of the recipient: male.
The routes of exposure are as follows:
- -
- external irradiation of the whole body,
- -
- soil ingestion,
- -
- external irradiation of the skin,
- -
- inhalation,
- -
- inhalation of Rn-222 gas inside the building.
The resulting effective annual dose was 22 mSv/annum, with the following contributions:
- -
- External irradiation of the whole body: 1.24 · 10−1 mSv/annum,
- -
- Soil ingestion: 3.05 · 10−3 mSv/annum,
- -
- External irradiation of the skin: 5.56 · 10−5 mSv/annum,
- -
- inhalation: 7.10 · 10−4 mSv/annum,
- -
- Rn-222 gas inhalation inside the building: 2.20 · 10 mSv/qn.
The scenario used to calculate the effective annual doses for population was based on the following assumptions:
- -
- contaminated area: 107 m2,
- -
- type of land: residential with products grown at home,
- -
- type of building: wood,
- -
- age of the recipient: infant,
- -
- sex of the recipient: female.
The routes of exposure are as follows:
- -
- external irradiation of the whole body,
- -
- ingestion of external skin irradiation of the skin,
- -
- inhalation,
- -
- vegetable intake,
- -
- ingestion of soil on plants,
- -
- inhalation of Rn-222 gas inside the building.
The resulting effective annual dose was 5.8 mSv/annum, with the following contributions:
- -
- External irradiation of the whole body: 4.01 · 10−1 mSv/annum,
- -
- Soil ingestion: 3.71 · 10−3, mSv/annum,
- -
- External irradiation of the skin: 2.39 · 10−5, mSv/annum;,
- -
- inhalation: 6.55 · 10−4, mSv/annum,
- -
- Rn-222 gas inhalation inside the building: 5.75 · 10 mSv/annum.
5. Analysis of the Correlation between Radionuclide Activity Concentrations and Dosing Rates from Contact Equipment
In order to observe the dispersion of the determined concentrations of the three radionuclides in part, for the depths of 5 cm and 100 cm, we analyzed the correlation of the data series (Figure 2, Figure 3 and Figure 4):
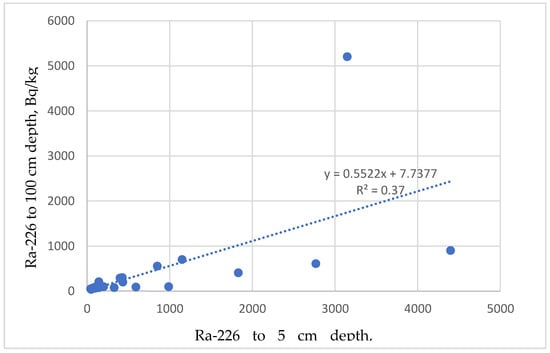
Figure 2.
Variation of natural radionuclide concentrations (Ra-225) to 5 and 100 cm depth.
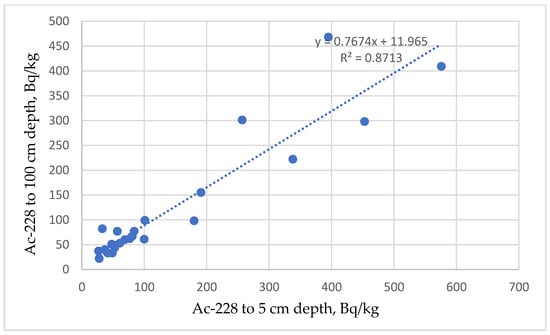
Figure 3.
Variation of natural radionuclide concentrations (Ac-228) to 5 and 100 cm depth.
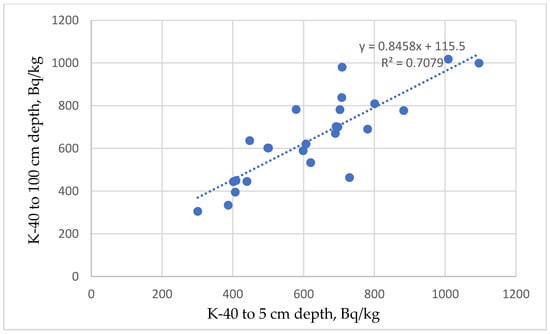
Figure 4.
Variation of natural radionuclide concentrations (K-40) to 5 and 100 cm depth.
- -
- r(Ra-226_5, Ra-226_100) = 0.6083,
- -
- r(Ac-228_5, Ac-228_100) = 0.9334,
- -
- r(K-40_5, K-40_100) = 0.8414.
We also analyzed the correlation for the Equivalent Dose Rate (H) data series (at contact and 100 cm) (Figure 5):
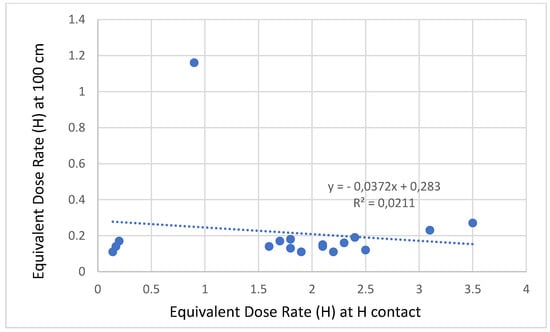
Figure 5.
Equivalent Dose Rate (H) to H contact and 100 cm.
- -
- r(Equivalent Dose Rate (H) at contact, Equivalent Dose Rate (H) at 100 cm) = 0.145.
The first three data series show a strong correlation, which confirms the dependence on radionuclides contamination of the soil, for depths of 5 cm and 100 cm (Figure 2, Figure 3 and Figure 4):
- -
- r(Ra-226_5, Ra-226_100) = 0.6083 shows a positive correlation between bot variables. The regression line shows that concentrations at 5 cm depth are greater than at 100 cm. This is consistent with vertical migration of Ra-226, but the bigger fraction remains at 5 cm depth (Figure 2).
- -
- r(Ac-228_5, Ac-228_100) = 0.9334 shows a strong positive correlation. The regression line shows that concentrations at 5 cm depth are slightly bigger than at 100 cm. This is consistent with vertical migration of Ac-228, but the fraction at 5 cm depth is slightly bigger (Figure 3).
- -
- r(K-40_5, K-40_100) = 0,8414, shows a strong positive correlation. The regression line shows that K-40 concentration at 5 cm and 100 cm depth are very similar. This is consistent with the conservative abundance of K in nature (Figure 4).
The analysis of soil samples from a depth of 100 cm suggests that a deep contamination can be discussed, this being present on the entire depth, in differentiated layers (Figure 5).
6. Areas of Radioactive Pollution
In order to establish the area contaminated with NORM, the following steps were completed:
- -
- scale definition of the perimeter of the fleet of separators—tanks,
- -
- division of the perimeter into 1 m × 1 grids,
- -
- DDE dispersion measurement for each perimeter,
- -
- performing three measurements for each perimeter at four time periods on the day of collection (6:00 a.m., 12:00 a.m, 6:00 p.m. and 12:00 p.m.),
- -
- statistical verification of the data collected (reading error was below 1%),
- -
- sampling and analysis,
- -
- integration of data collected by full perimeter scanning with previously collected data.
- -
- The measurements were aimed at:
- -
- integration of DDE values for equipment at their contact and at a distance of 100 cm,
- -
- integration of DDE values for measuring points at a height of 5 cm and 100 cm, respectively,
- -
- integration of the concentration values of the three radionuclides for the sampling points, respectively, Ra-226, Ac-228, and K-40, for the depths of 5 cm and 100 cm.
The collected data were graphically integrated with the help of a software developed by the authors and which has the role of graphically drawing the scanned environmental measurements. In addition, the exclusion perimeter was achieved by summing the radioactive elements and joining the maximum points.
The DDE dispersion map at a height of 5 and 100 cm (Figure 6 and Figure 7) highlights the influence of soil contamination with NORM on the values determined by area dosimetric measurements.
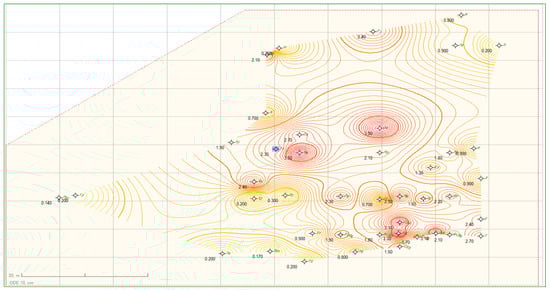
Figure 6.
Modeling the dispersion of the Equivalent Dose Rate in contact with the equipment.
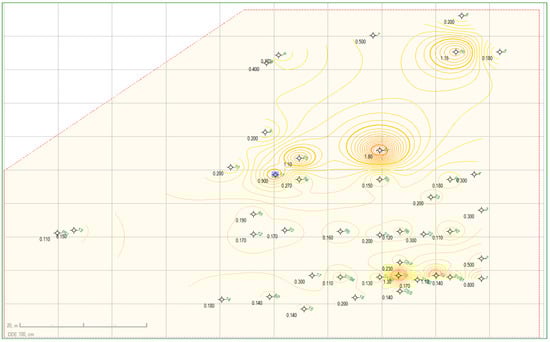
Figure 7.
Modeling the dispersion of the Equivalent Dose Rate at 100 cm from the equipment.
Figure 8, Figure 9, Figure 10, Figure 11, Figure 12 and Figure 13 show the dispersion maps for the concentrations of radionuclides Ra-226, Ac-228 and K-40, within the perimeter of the park (tank farm), for depths of 5 cm and 100 cm, respectively.
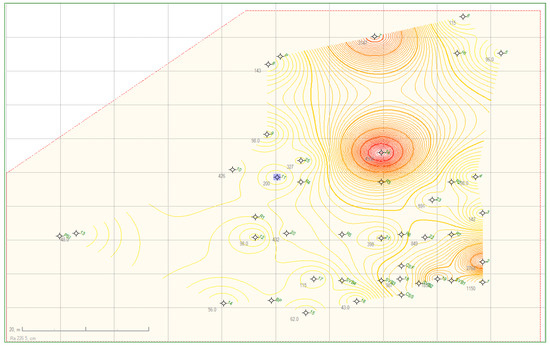
Figure 8.
Dispersion map of Ra-226 at a depth of 5 cm.
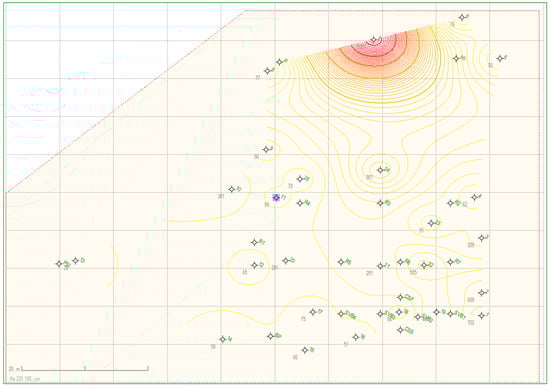
Figure 9.
Dispersion map of Ra-226 at a depth of 100 cm.
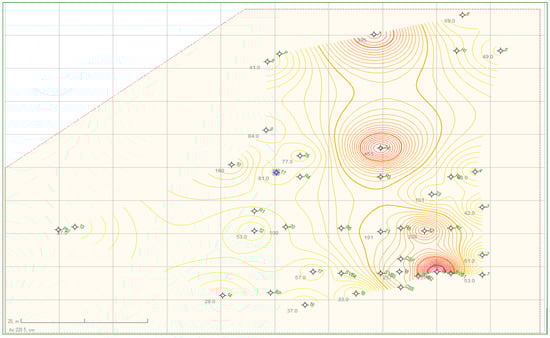
Figure 10.
Dispersion map of Ac-228 at a depth of 5 cm.
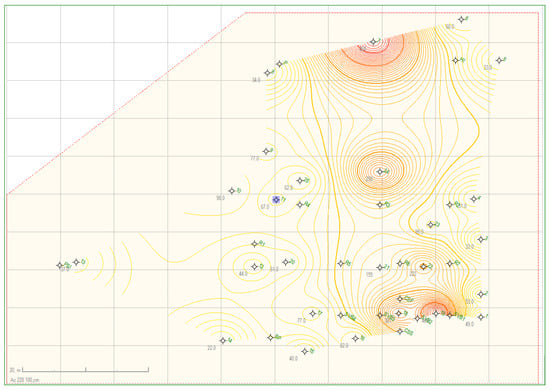
Figure 11.
Dispersion map of Ac-228 at a depth of 100 cm.
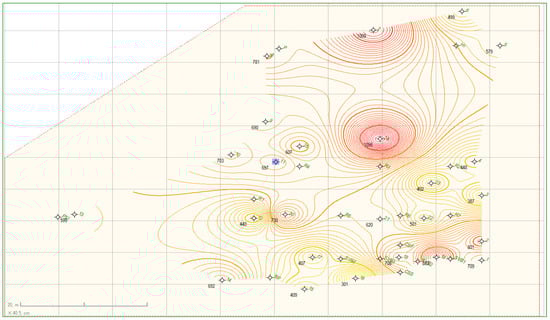
Figure 12.
Dispersion map of K-40 at a depth of 5 cm.
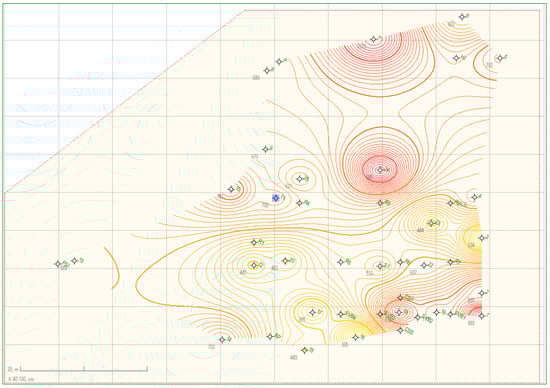
Figure 13.
Dispersion map of K-40 at a depth of 100 cm.
7. Discussion
The extraction of crude oil took place between 1960–2000, after which it was abandoned.
No soil decontamination was performed because the concentration in petroleum substances was below the intervention threshold, i.e., below 1000 mg/kg dry matter (the land being a less sensitive area) [,].
This soil area is at this moment public property being identified as a playground.
Considering the results of the research carried out in the case study, the following recommendations can be formulated:
- -
- prohibiting public access to the contaminated area until decommissioning and carrying out soil remediation works (Figure 14),
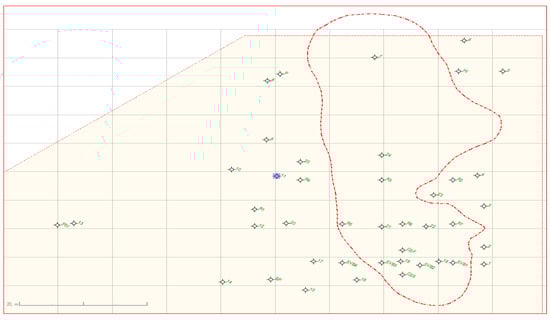 Figure 14. Map of the surface contaminated with radionuclides.
 - -
- limiting the access of park employees to the contaminated area and their dosimetric monitoring for a period of at least one year, in order to have a projection on the annual absorbed dose,
- -
- decommissioning of equipment under radiological control and their transport for decontamination, within authorized locations for these types of activities.
As can be seen, the extraction of crude oil entails radioactive pollution.
Analyzing the state of radioactive pollution of the land, we observe the following:
- For Ra-226, most sampling points have concentrations above the national allowed limit of 76 Bq/kg, except points number 4, 5, 12, 13, 14, 15, 16, and 17.
- However, all values determined for Ra-226 are at least 399% higher than the natural background (9.76 Bq/kg).
- For the radionuclide concentration for K-40, the allowed limit (259.09 Bq/kg) is exceeded by at least 118%.
- The concentration of Ac-228 exceeds the allowed limit (15.05 Bq/kg) by at least 142%.
- The most visible pollution is in the area of the pump and biphasic separators where there have usually been leaks of gases and liquids into the ground and absorbed by the vegetation (Figure 14).
Author Contributions
Conceptualization, S.P. and T.C.; methodology, O.V.S.; software, T.C.; validation, S.P., O.V.S. and A.E.S.; formal analysis, T.C.; investigation, T.C.; resources, T.C.; data curation, T.C.; writing—original draft preparation, T.C.; writing—review and editing, T.C.; visualization, S.P.; supervision, O.V.S.; project administration, T.C.; funding acquisition, T.C. All authors have read and agreed to the published version of the manuscript.
Funding
This research received no external funding. This project was part of the doctoral and postdoctoral research program.
Institutional Review Board Statement
The study was conducted in accordance with the Declaration of Helsinki, and approved by the Ethics Committee of Ovidius University.
Informed Consent Statement
Informed consent was obtained from all subjects involved in the study.
Data Availability Statement
The data contained in this study are original and are part of the environmental protection analysis, without affecting companies, local communities and government authorities. The study is in accordance with the legislation in force, being in accordance with the requirements of the local community and sustainable development policies.
Conflicts of Interest
The authors declare no conflict of interest.
References
- Council Directive 2013/59/EURATOM of 5 December 2013. Laying Down Basic Safety Standards for Protection against the Dangers Arising from Exposure to Ionising Radiation, and Repealing Directives 89/618/Euratom, 90/641/Euratom, 96/29/Euratom, 97/43/Euratom and 2003/122/Euratom. Available online: https://eur-lex.europa.eu/legal-content/en/ALL/?uri=CELEX%3A31999R2587 (accessed on 22 September 2021).
- Petrache, Ş. The Environmental Impact of NORM for an Oil and Gas Production Facility. In Proceedings of the 2nd International Colloquium Energy and Environmental Protection, Ploieşti, România, 9–11 November 2016; pp. 20–24. [Google Scholar]
- Sharma, P.V. Environmental and Engineering Geophysics; Cambridge University Press: Cambridge, UK, 1997; pp. 22–45. [Google Scholar]
- International Atomic Energy Agency. Radiation Protection and the Management of Radioactive Waste in the Oil and Gas Industry; International Atomic Energy Agency: Vienna, Austria, 2003; pp. 1–30, (Safety reports series), no. 34, STI/PUB/1171; ISBN 92-0-114003–7. ISSN 1020–6450. [Google Scholar]
- European Commission. Current Practice of Dealing with Natural Radioactivity from Oil and Gas Production in EU Member States; Final Report; European Commission: Brussels, Belgium, 1997; pp. 1–40. [Google Scholar]
- Conference of Radiation Control Program Directors, Inc. E-42 Task Force Report: Review of TENORM in the Oil&Gas Industry; Conference of Radiation Control Program Directors, Inc.: Frankfort, KY, USA, 2015; pp. 5–50. [Google Scholar]
- Petrache, Ş. Problems in well drilling abandonment programs-radioactivity aspects. In Proceedings of the Balkan Mining Congress, Petroşani, România, 20–23 September 2015. [Google Scholar]
- Petrache, Ş. Environment Aspects of Oil Exploration and Exploitation Abandonment. Ph.D. Thesis, Oil and Gas University, Ploiesti, România, 2021. [Google Scholar]
- Naturally Occurring Radioactive Material (NORM VI). In Proceedings of the Sixth International Symposium on Naturally Occurring Radioactive Material, Organized by The Hassan II University of Mohammedia and the Cadi Ayyad University of Marrakesh in Cooperation with the International Atomic Energy Agency, Marrakesh, Morocco, 22–26 March 2010; pp. 103–109.
- Național Comision of Radiaoctivity Worker. NSR-01 Norms to Radioactivity Measurenment; Național Comision of Radiaoctivity Worker: Bucureşti, Romania, 2000; pp. 20–60. [Google Scholar]
- International Association of Oil&Gas Producers. Report 412: Managing Naturally Occuring Radioactive Material (NORM) in the Oil and Gas Industry; International Association of Oil&Gas Producers: London, UK, 2016; pp. 100–200. [Google Scholar]
- Environment Agency. The Radioactively Contaminated Land Exposure Assessment Methodology—Technical Report; CLR-14 Version 1.2 May 2011; Environment Agency: London, UK, 2014; pp. 1–40. Available online: https://assets.publishing.service.gov.uk/government/uploads/system/uploads/attachment_data/file/316279/Radioactively_Contaminated_Land_Exposure_Assessment_Methodology_Technical_Report.pdf (accessed on 22 September 2021).
Publisher’s Note: MDPI stays neutral with regard to jurisdictional claims in published maps and institutional affiliations. |
© 2022 by the authors. Licensee MDPI, Basel, Switzerland. This article is an open access article distributed under the terms and conditions of the Creative Commons Attribution (CC BY) license (https://creativecommons.org/licenses/by/4.0/).