Abstract
Matrix-assisted laser desorption/ionization mass spectrometry (MALDI-MS) is an advanced technique that uses minimum fragmented ions from complex molecules for mass spectrometry (MS) analysis (tissue profiling by mass spectrometry). It is able to analyze spatially resolved tissue or tumor sections at the molecular level. It has become a valuable tool for tumor and tissue imaging, due to its ease of operation and high mass resolution, but it still has vast room for development in the instrumentation of larger proteins in some tissues. In this review, we focus on the main components of MALDI-MS instrumentation, sample handling and processing, the working principle of MALDI-MS, and its applications in diagnostic and prognostic assessments, tumor removal and drug development. Although it is less effective at detecting larger proteins in some tissues, it still shows huge potential because of its advancements in instrumentation and processing protocols. This article may benefit those who have interests in MALDI-MS for tissue or tumor imaging.
1. Introduction
Matrix-assisted laser desorption/ionization (MALDI) is an ionization process that utilizes a laser irradiation absorbing matrix to produce minimum fragmented ions from complex molecules for mass spectrometry (MS) analysis (tissue profiling by mass spectrometry). In 1994, the first use of MALDI-MS in an imaging context, for matrix crystals containing the neuropeptide P, was reported by Spengler et al. [1] (Small molecule MALDI MS imaging: Current technologies and future challenges). With the development of MALDI-MS, its application areas have rapidly expanded. MALDI-MS is a powerful analytical technique that combines the high sensitivity and selectivity of mass spectrometry with the spatial distribution data of molecules in tumors or tissues [2]. It is target free; therefore, it does not need to choose a certain protein analyte ahead of time. Although biased detections may occur sometimes, it is fully multiplex, and it measures all ions from a tissue sample simultaneously. Therefore, using MALDI-MS, protein localization can be determined, with molecular specificity, directly from tissue parts [1]. Furthermore, since the MALDI laser does not ablate any of the tissue, and molecules are desorbed from the surface, cellular and molecular integrity is maintained, with minimal effects on most of the cells. Oppenheimer’s report provides an overview of the workflow of the analysis, providing a detailed introduction of the instrumentation and applications to clinical oncology and pharmaceutical development [3]. As a general outline, the analysis uses a matrix that absorbs energy at the irradiating laser’s wavelength. The sample molecule is combined with the matrix, then dried on an electrically conductive glass slide. Matrix–analyte co-crystals develop during the drying process. Such crystals are then exposed to UV laser light, allowing the sample molecule to desorb and ionize. Then, in a time-of-flight (TOF) mass analyzer, a mass-to-charge (m/z) ratio is generated [4]. Finally, a 2D ion intensity map can be constructed based on the signals obtained at x, y coordinates. It should be noted that, due to the limited coverage of various aspects, such as data analysis techniques and other types of detectors, the TOF mass analyzer within this paper only represents one representative example of MALDI imaging.
This article overviews the sample preparation for MALDI-MS, the three main components, and the principle of MALDI-MS for tissue or tumor imaging, and explores its limitations and future applications in diagnostic and prognostic assessments, tumor removal and drug development.
2. Sample Handling and Processing
2.1. Tissue Storage
After a tissue or tumor sample is extracted, it needs to be frozen immediately to maintain its morphology and prevent protein degradation, which is essential to keep the sample in a native condition. Next, aluminum foil is used to wrap the tissue biopsy loosely. To store the sample for a longer time, the temperature should be kept at −80 °C or lower [3], which can preserve tissue or tumor samples in a native state for over a year. In addition to this method, the tissue can also be preserved by submerging it in formalin or a variety of alcohols [3]. The tissue is typically preserved as paraffin blocks. This method is called fixation. Freshly frozen and FFPE tissues are commonly used for MALDI imaging. [4].
2.2. Sectioning
The next process is sectioning the tissue specimens. For most applications, the tissue is cut into 5–20 µm-thick slices at −15 °C. The thickness and cutting temperature are based on the type of tissue. It is crucial to use an embedding medium to keep the specimen in place on a cryostat head during the cutting process [5].
2.3. Mounting
After sectioning, the tissue section needs to be mounted. The tissue sections should be placed on a cooled target plate that has a similar temperature to the previously sliced section. Next, the tissue section can be steadily warmed by placing a hand under the plate. The surface needs to be electrically conductive to allow for the high voltage potential from the ion source of MALDI-MS. Indium tin oxide (ITO)-coated glass slides are very suitable for this kind of analysis [6].
2.4. Pretreatment of Samples
Sample pretreatments are useful for improving the sensitivity of the interest analytes prior to matrix implementation. The pretreatment measures include the removal of impurities, on-tissue digestion, and on-tissue derivatization. Salts and fats affect the analysis of proteins and peptides [7]. The normal protocol requires a 30 s wash in 70% ethanol, a 30 s wash in 90% ethanol, and a final 30 s wash in 95% ethanol. Then, the sample is dried. This washing technique will remove all impurities from the sliced samples, without disrupting the texture of the tissues [8]. For on-tissue digestion, this washing technique is especially beneficial for the study of the samples because the peptide fragments need to be released from the cross-linked tissue [8]. During this procedure, trypsin solution is added to the samples; wet samples are kept in a humid environment at room temperature, or 37–50 °C, to preserve the surface solution and provide adequate time for the peptide fragments to be released [4,9]. For on-tissue derivatization, the washing technique is performed by manually spraying TCDI on the tissue sections. Then, the matrix is added to the tissue section by sublimation [8].
2.5. Matrix Deposition
A chemical matrix can absorb the laser irradiation and transports the sample to a gas phase, facilitating the mechanism of ionization [10]. 2,5-dihydroxybenzoic acid (DHB) [11], α-cyano-4-hydroxycinnamic acid (CHCA) [12], and 3,5-dimethoxy-4-hydroxycinnamic acid (SA, sinapinic acid) [13] are three commonly used matrices. There are two methods to apply matrices. One method is continuous manual matrix coating, and the other method is discrete matrix coating, utilizing automatic matrix spotting tools, such as robotic sprayers. For manual matrix deposition, droplets as tiny as 200 nL can be deposited onto the sections. Normally, the sections need to be spotted twice, in order to enhance the crystal density. The MALDI crystals will form after the solvent has evaporated completely [8].
2.6. Staining
Staining is an optional step; however, it is necessary to identify the interested parts of the tissues. It can be performed before the application of the matrix to the tissue [5]. However, staining procedures have variables that may alter the molecular composition of the tissues or tumors. Alternatively, section staining can be performed after MALDI−MS analysis [6]. Hematoxylin and eosin (H&E) staining is a common protocol to color sections. Prior to H&E staining, the matrices must be removed from the sections by submerging the sections in a 70% ethanol solution, as most matrices are soluble in a diluted ethanol solution. After the matrices have been removed, the sections need to be dehydrated in graded ethanol. Finally, the sections can be stained [14,15].
3. Instrumentation
Most MALDI-MS imaging work is performed by a time-of-flight (TOF) instrument because the high mass-to-charge (m/z) ratio values of this type of mass spectrometer are suitable for large molecules, such as proteins. Although MALDI-MS instruments have been commercialized now, improvements in these instruments are still in progress. Zavalin et al. demonstrated a new transmission geometry MALDI source, and the capability of this system was demonstrated by imaging an axon fiber at a step size of 2.5 μm. Generally, a mass spectrometer has the following three main components: the ion source, the mass analyzer and the detector. The ion source is used for the creation and fragmentation of ions. The analyzer is used to separate the ions, and there is usually a reflectron to improve the mass resolving power of the analyzer. Ions are separated by their mass-to-charge ratio, spatially or in time. The detector is used to measure the quantities of separated ions.
3.1. Ion Source (MALDI)
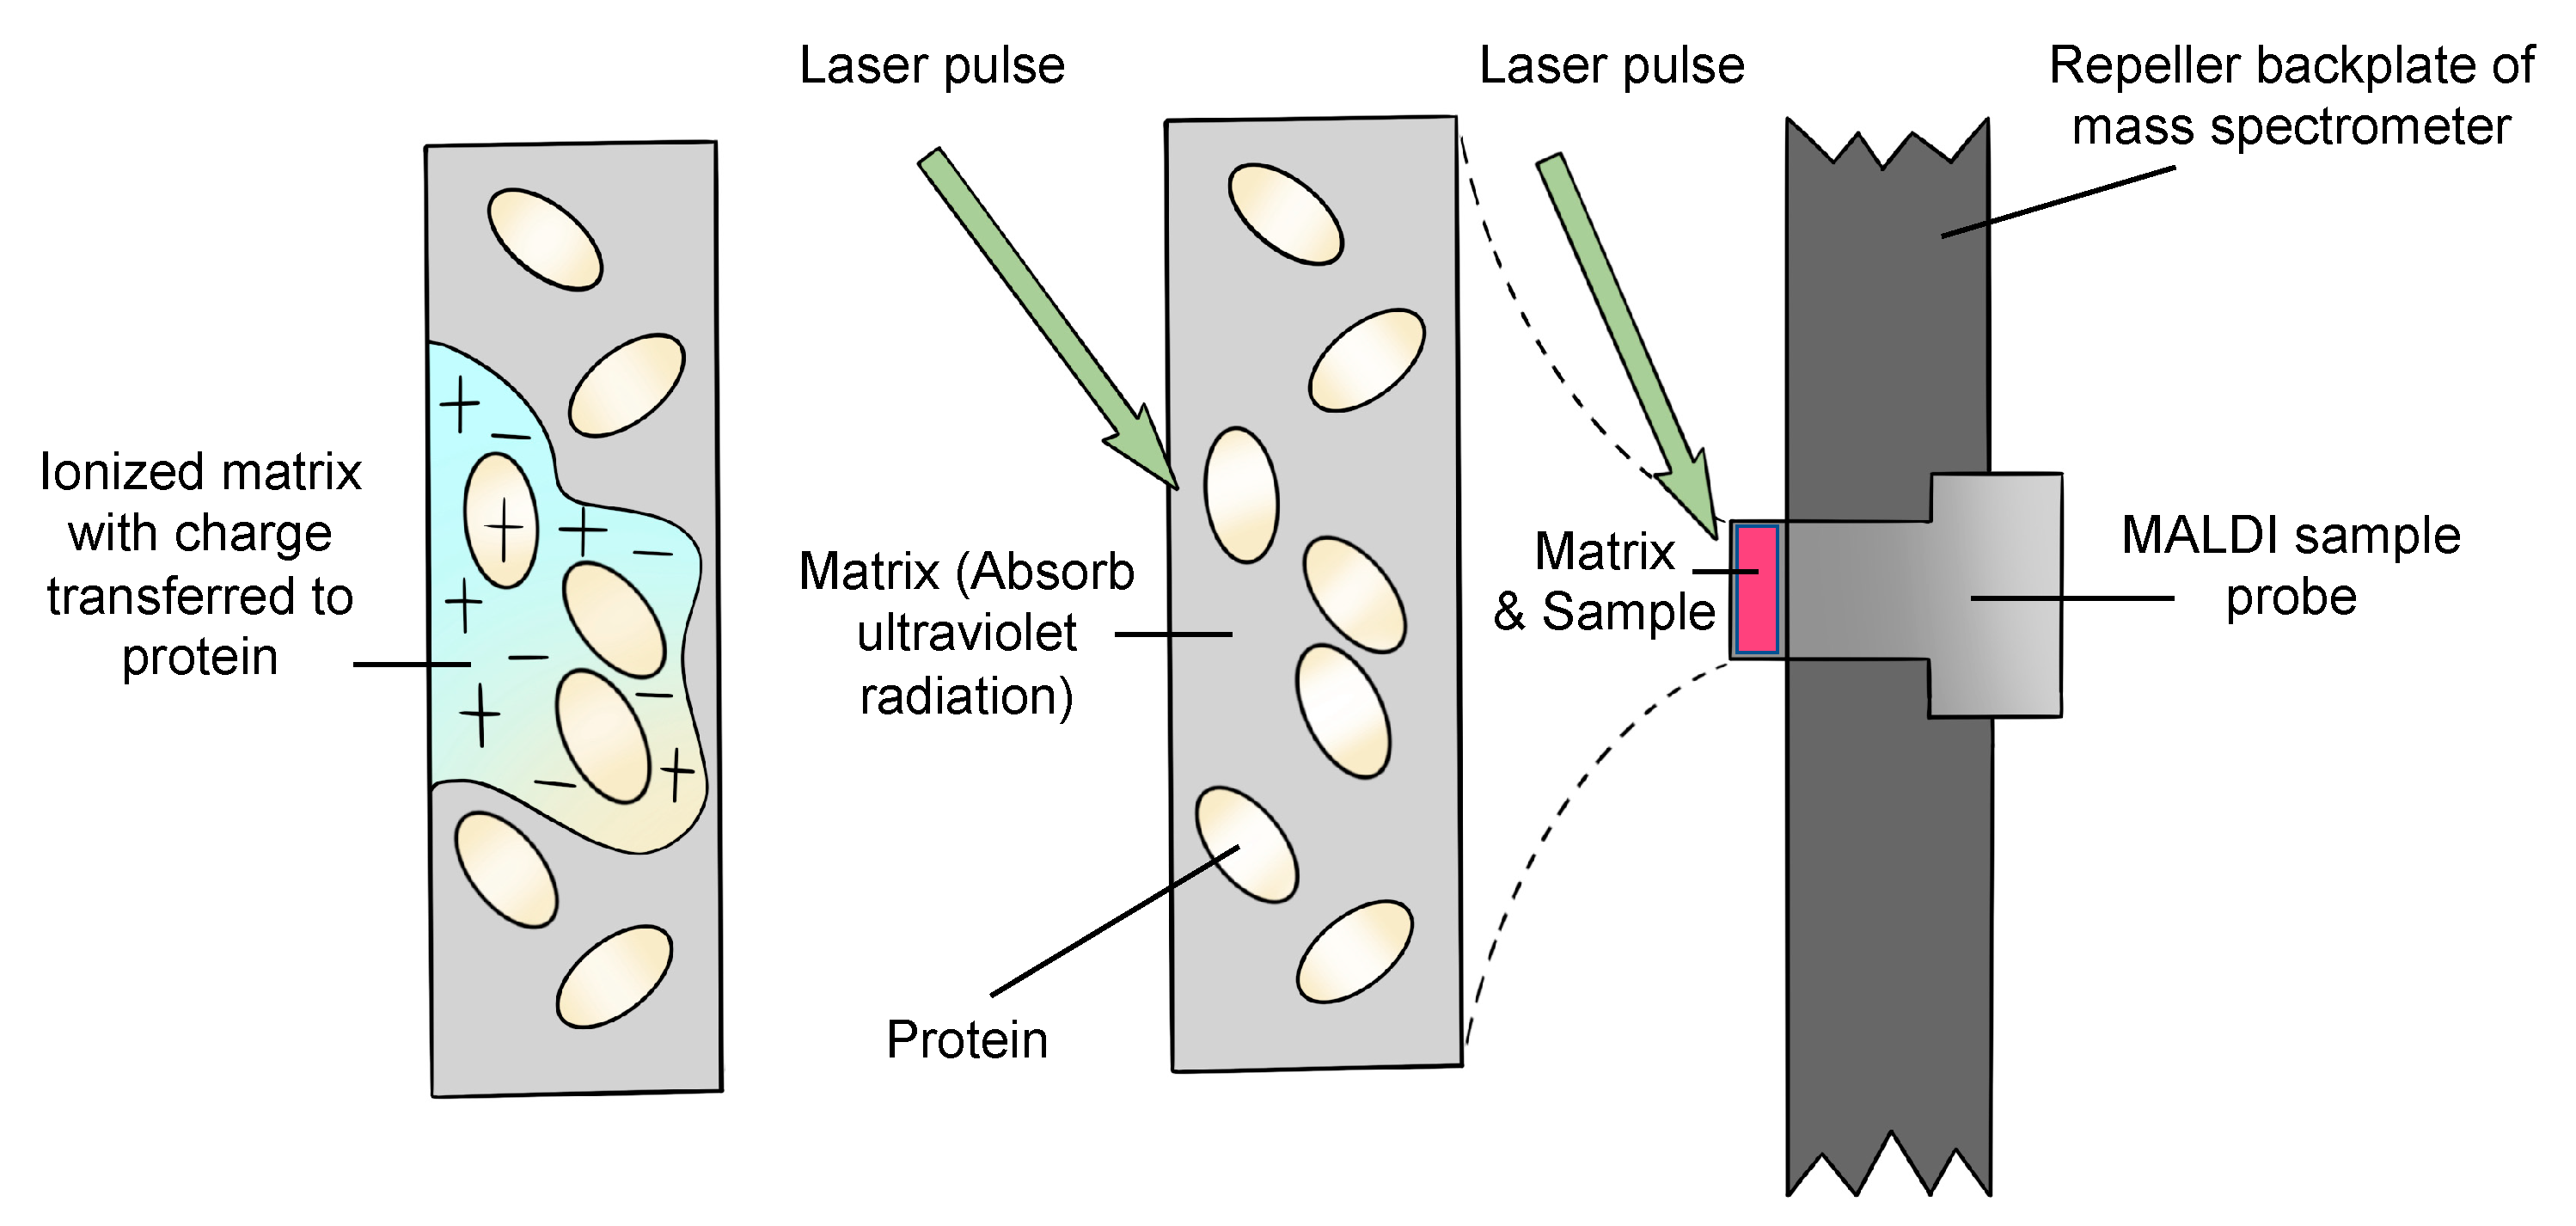
Matrix-assisted laser desorption/ionization (MALDI) is an ion source that utilizes a laser irradiation absorbing matrix to produce minimum fragmented ions from complex molecules [1]. Firstly, the emission of a UV laser beam to the matrix–analyte mixture leads to desorption and ablation of the top layer of the matrix. The matrix is ionized by adding a proton, or losing a proton, during the absorption of the laser radiation. After the matrix is desorbed, ionized and ablated, a hot plume that includes neutral molecules and matrix ions, and protonated and deprotonated matrix molecules, is generated. Secondly, the analyte is ionized by transferring the charges from the matrix. Quasimolecular ions are produced after this step. To date, MALDI ion sources can be used in a high vacuum environment or under atmospheric pressure [16]. A general description of how the analytes are ionized is shown in Figure 1 [17].
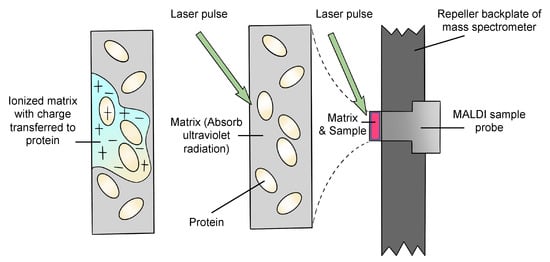
Figure 1.
Schematic diagram of the general procedure of ionization.
3.2. Mass Analyzer
The pulsed nature of laser desorption renders MALDI ion sources ideal for time-of-flight (TOF) analyzers [18]. After the ions are produced by the ion source, they move to the mass analyzer, which separates the ions. At approximately 3000 to 20,000 times per second, 20,000 V is added to the backplate to accelerate the ions to the drift region from the source region. If the kinetic energies of the ions are the same when they are ejected from the source, on the TOF mass spectrometer, they can be observed as just a straight tube between the source and the detector on two sides. In this situation, ions ejected from the source transmit to the detector, according to their mass. The lighter ions move quicker and vice versa. However, normally, the ions do not have identical kinetic energies because the ions formed next to the backplate are accelerated by a larger voltage, and will gain more kinetic energy, than those positioned closer to the grid. In addition, the kinetic energies are distributed unequally among the ions [17]. As a result, ions may enter the detector at the same time, though they have different m/z ratios. To overcome this problem, a reflectron (or ion mirror) can be added to the mass analyzer. The design of the TOF mass spectrometer is shown in Figure 2 [18]. The reflectron is a sequence of hollow rings, kept at a progressive positive potential, and a grid whose potential is more positive than the accelerated potential on the source backplate. When the ions enter the reflectron region, they are decelerated, stopped and reflected out to the left. Faster ions, with more kinetic energy, migrate deeper through the reflectrons and vice versa. Then, all ions with the same mass enter the grid at the same moment, even though their kinetic energies are not identical.
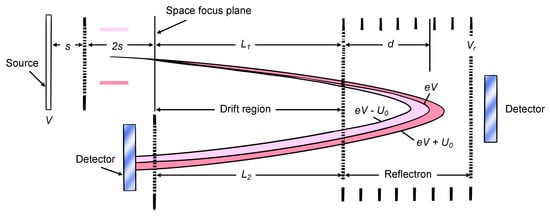
Figure 2.
The schematic diagram of TOF mass spectrometer including “reflectron” [18].
3.3. Detector
The detector is the last part of a mass spectrometer. It plays a crucial role in the mass spectrometer. It tracks and records the induced charges as the ions move through, or reach, a surface [16]. There are many kinds of detectors, such as the electron multiplier, Faraday cup, photographic plate, scintillation counter and channel electron multiplier, etc. [19]. An effective detector should have high amplification, a fast time response, low noise, a high collection capacity, low expense, low response spread, the same response for all masses, a wide dynamic range, long-term reliability, and the ability to be mounted outside the vacuum [20,21]. There is not a certain type of detector that is required to complete tumor or tissue imaging using MALDI-MS. All these detectors have their own advantages and drawbacks. Finally, a spectrum of the signal intensity of the ions vs. the mass-to-charge ratio is displayed by the detector [22,23].
4. Principle of MALDI-MS for Tissue or Tumor Imaging
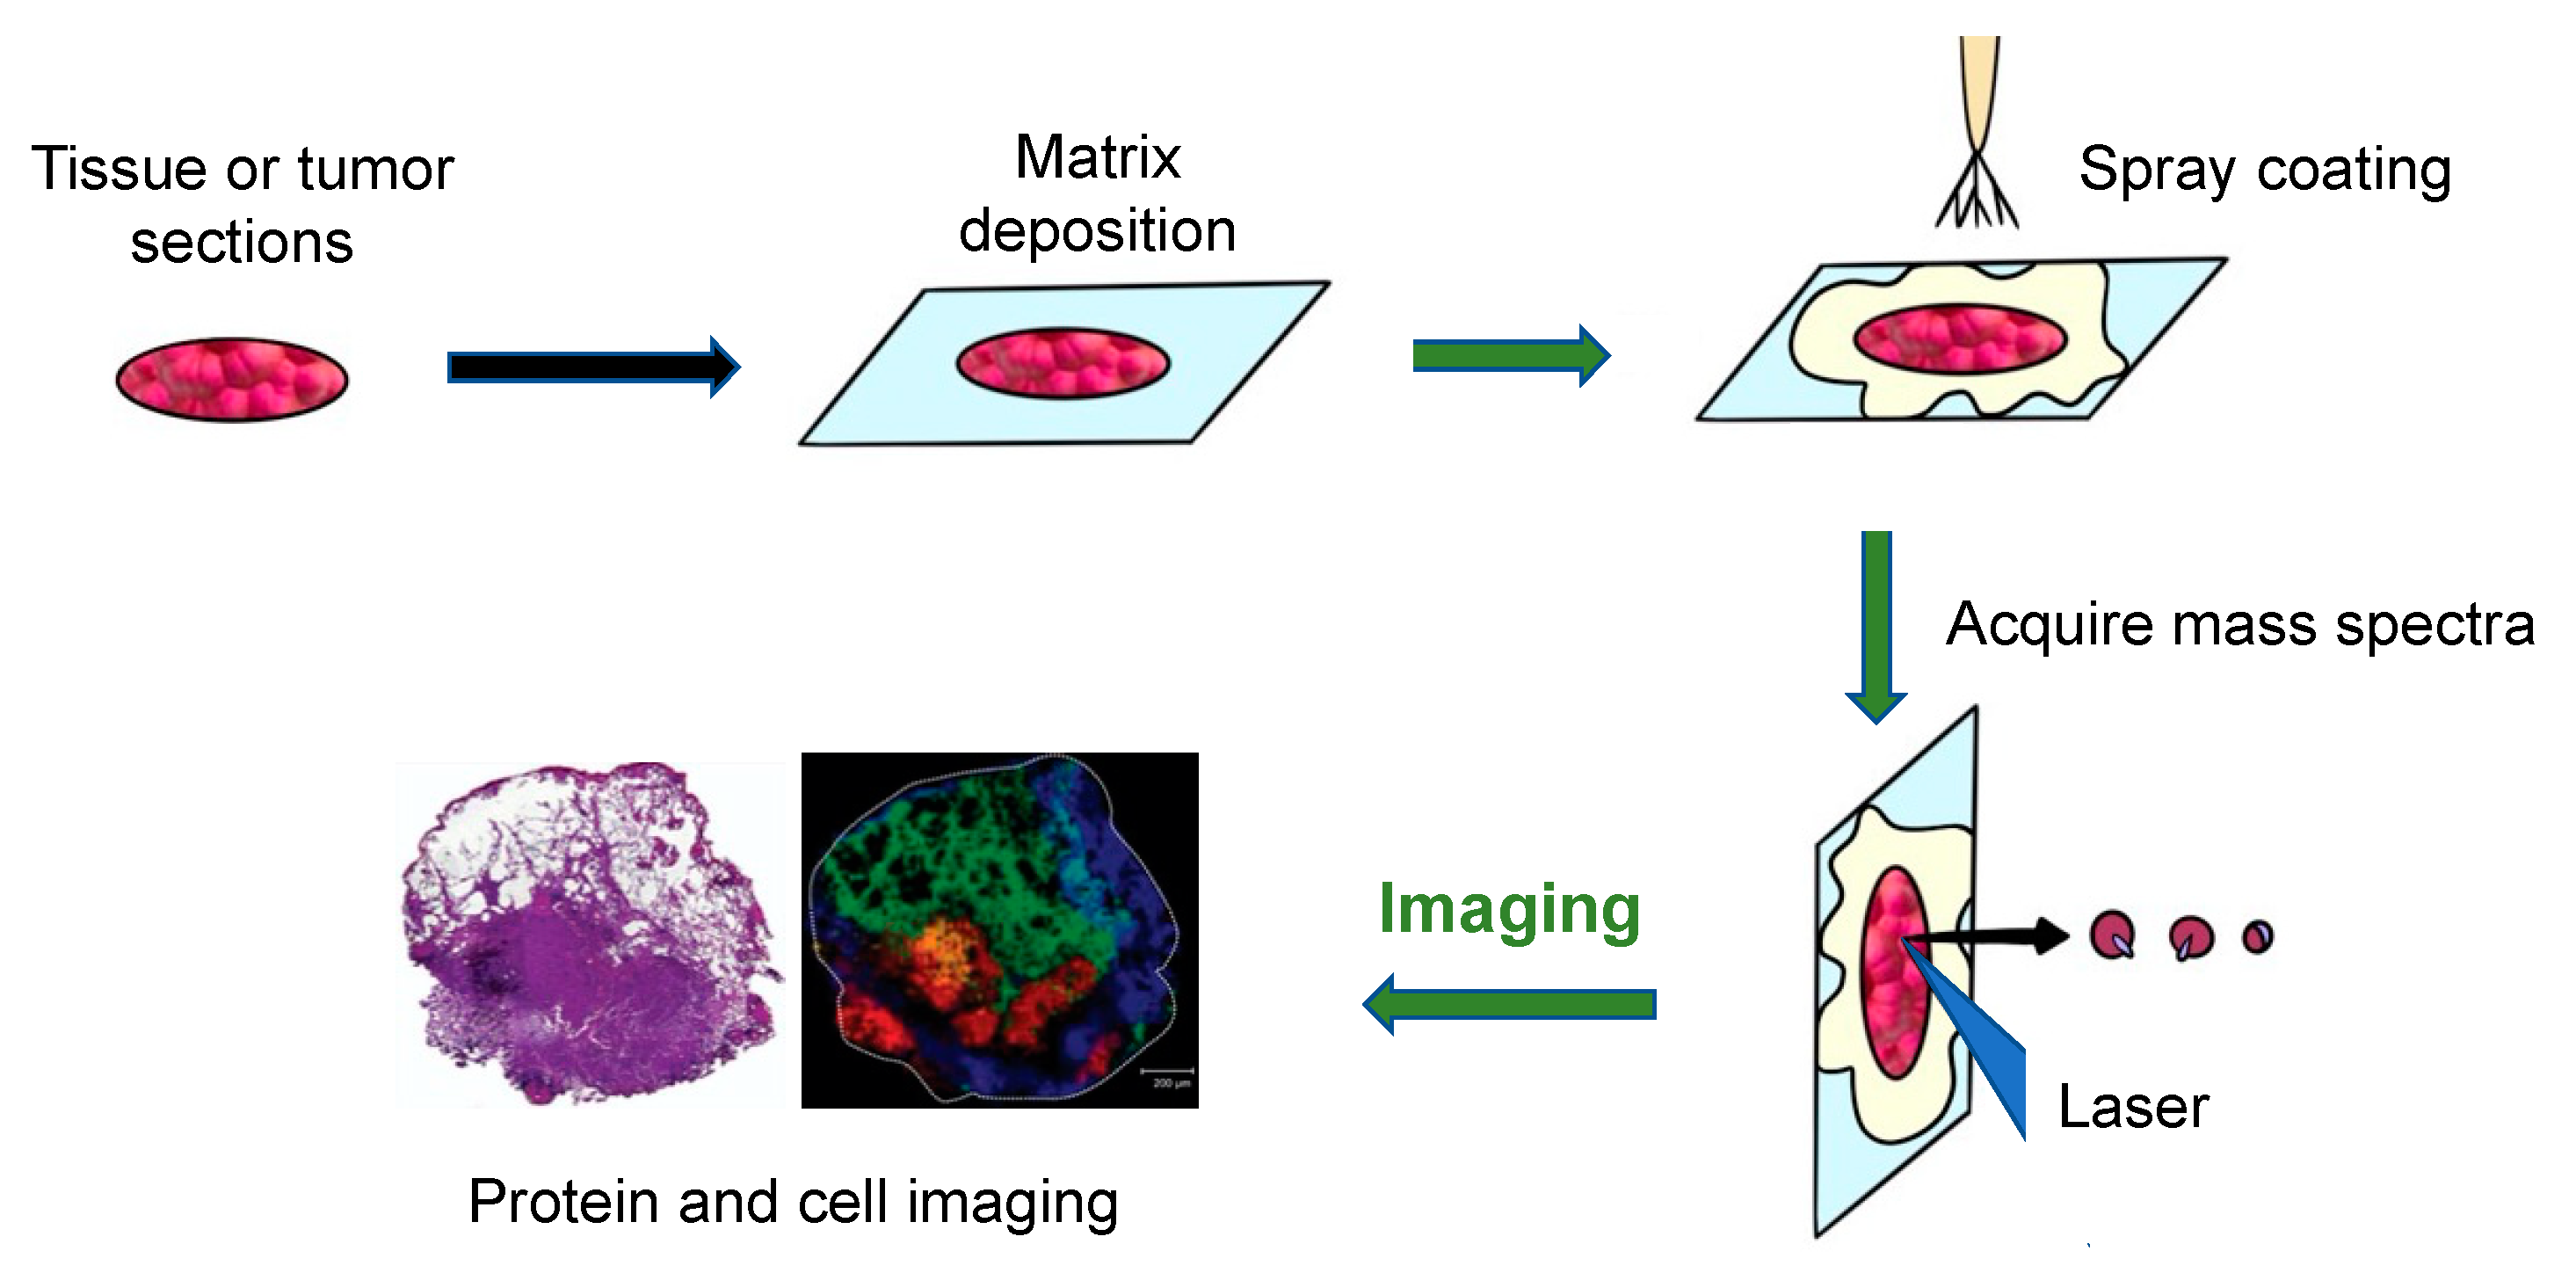
The general workflow of how MALDI-MS works to produce images of tumors and tissue is shown in Figure 3 [24]. Firstly, a sliced tissue or tumor is pretreated, and a matrix is needed to cover it. Then, the mass spectrometer analyzes the tissue specimen (with a spatial resolution varying from approximately 200 μm to 20 μm), producing a mass spectrum for each measurement spot.
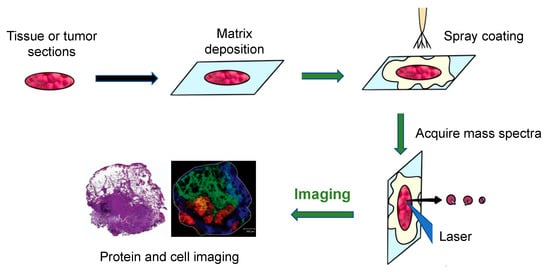
Figure 3.
The principal workflow of the MALDI imaging and profiling experiments [24].
An Ultraflex II MALDI-TOF-MS (Bruker Daltonics, Billerica, MA, USA), equipped with a SmartBeam TM laser, can be used for tissue or tumor imaging. Using this machine, a total of 400 laser shots are obtained for each matrix spot, in increments of 50 shots, starting at the middle of each spot and randomly rastering at various locations inside the spot. An evaluation of the relative coordinates of each matrix spot from the optical picture of the MALDI plate is required for automated acquisition of the profile. Then, the x, y coordinates of each spot are written on a file in the native target geometry of the mass spectrometer control program. Three positions from the outer corners of the array are chosen for final alignment of the plate [3]. Finally, plotting the intensities of each signal at its x, y coordinates can create a two-dimensional morphological image of the ion profiles. Since the sliced tissue or tumor can be stained, the observed mass signals can then be observed as color intensity maps and can be used to investigate molecules in certain cell types. Using these colored signals, the distribution of different molecules in the tissues can be visualized [8].
5. Limitations and Future Applications
MALDI-MS analyses are successful for most tumors and tissues. Due to the limitation of the article length, the protocol described above is only suitable for peptides (proteins), but is not suitable for small molecules. Similarly, the method that describes rinsing with ethanol and adding trypsin are optional for proteins targeted by MALDI-MS, but not for small molecules. Moreover, it is less effective at detecting larger proteins in some tissues because the mass range of such a methodology is limited by laser ionization and ablation processes, which lead to the fragmentation of larger molecules, such as cytokines, growth factors, enzymes and receptors that have molecular weights exceeding 25 kDa, and because MALDI-MS is vulnerable to detector saturation when studying complicated mixtures. This limitation could be overcome by using a high mass detector, but this would generate a significant chemical background, which would affect any losses of sensitivity. Hence, a high mass detector that can withstand the high chemical background of MALDI-MS is required [22]. In addition, due to the limitations of this mini-review, only limited coverage of various aspects, such as data analysis techniques and detector coverage, is included within this paper. Such examples may only indicate the distribution of three molecules, rather than illustrating how to use the technique to diagnose via tumor subtyping.
5.1. Diagnostic and Prognostic Assessment in Clinical Pathology
Recently, MALDI-MS has been applied to cancer research, including human non-small-cell lung tumors, gliomas, breast cancer and ovarian tumors. The general method employed by these studies is to compare the mass spectral characteristics (m/z peaks) with a range of patient data, to classify specific molecular alterations related to disease progression [21]. The spatial proteomic characterization of tissue and tumor recognition contributes to better diagnoses and individual predictive trends of therapy response [23].
Generally, 1 μL of extracted serum peptide may be mixed with 1 μL of saturated α-cyano-4-hydroxycinnamic acid matrix (dissolved with 0.1% trifluoroacetic acid, 50% acetonitrile), spotted on a target plate and dried at room temperature; the target plate is placed in the mass spectrometer; the instrument is calibrated with standards, and then the standards are detected to obtain a mass-to-charge ratio (m/z) peptide peak, consisting of different mass-to-charge ratios (m/z). The mass spectra of the peptide peaks with different mass-to-charge ratios (m/z) are then obtained. In order to avoid system errors and human errors, standards (peptide mixtures) are used before each specimen is tested, and the specimens are only tested when the results are consistent with the composition of the standards, indicating that the test system is working properly, thus ensuring reliable and reproducible results.
One segment example of lung cancer tissue, displaying various areas identified by the distinct molecular content of the tissue, is shown in the bottom right of Figure 3 [24]. The left side of the figure shows the H&E staining of the segment after MALDI-MS analysis. The right side of the figure shows a fibrotic region of the tumor cells (m/z = 1117.1, yellow), a tumor region (m/z = 1822.5, red), a non-tumor region (m/z = 1530.4, blue), and a peritumoral inflammatory field (m/z = 1429.1, green). This example illustrates how to use the technique to diagnose disease.
5.2. Tumor Removal
In clinical oncology, completely removing tumors is crucial. Research shows that some of the tumor’s molecular features are represented in histologically healthy tissue neighboring the tumors, due to molecular modifications before phenotypic changes. MALDI-MS can aid in the interpretation of alterations in tumors and neighboring healthy tissues’ environments, as well as provide an approximation of how far these changes extend beyond the histologically defined margins [25]. As a result, the tumors can be resected completely.
5.3. Drug Development
MALDI-MS can be used to investigate the distribution of drugs in human and animal tumor tissues [26]. This technique has improved selectivity and sensitivity, which is ideal for analyzing how effective drugs are and for improving drug design. One study used MALDI-MS to deliver paclitaxel to a mouse with a tumor. Paclitaxel (PTX) was combined with micelle (NK105) and delivered to the tumor tissue of the mouse. Using MALDI-MS, this section was compared with the tumor section treated with PTX alone, as well as the untreated mouse. The PTX concentration delivered from NK105 was significantly higher than the free PTX and untreated tumor tissue, meaning that the anticancer efficacy of NK105 is higher than PTX alone [27].
6. Conclusions
MALDI-MS is a powerful analytical technique that has become a valuable tool for tumor and tissue imaging, due to its ease of operation and high mass resolution, but it still has vast room for development in instrumentation for larger proteins in some tissues. Overall, the potential of MALDI-MS for tumor and tissue imaging is high, and advancements in instrumentation and processing protocols can offer new developments and observations for molecular processes, including for health and disease.
Author Contributions
Conceptualization, J.W. and Y.L.; methodology, J.W. and Z.R.; software, J.W. and Y.L.; validation, J.W., Z.R. and P.X.; formal analysis, Y.L.; investigation, Z.R. and P.X.; resources, J.W. and Y.L.; data curation, J.W. and Y.L.; writing—original draft preparation, J.W., Z.R. and P.X.; writing—review and editing, Z.R. and Y.L.; visualization, J.W. and Y.L.; supervision, Y.L.; project administration, Y.L.; funding acquisition, Y.L. All authors have read and agreed to the published version of the manuscript.
Funding
This research received no external funding. And the APC was funded by Wu, J., Rong, Z. and Li, Y.
Institutional Review Board Statement
Not applicable.
Informed Consent Statement
Not applicable.
Data Availability Statement
All data related to this study are publicly available upon reasonable request to the corresponding author.
Conflicts of Interest
The authors declare no conflict of interest.
References
- Gessel, M.; Norris, J.; Caprioli, R.M. MALDI imaging mass spectrometry: Spatial molecular analysis to enable a new age of discovery. J. Proteom. 2014, 107, 71–82. [Google Scholar] [CrossRef] [PubMed] [Green Version]
- Hillenkamp, F.; Karas, M.; Beavis, R.C.; Chait, B.T. Matrix-assisted laser desorption/ionization mass spectrometry of biopolymers. Anal. Chem. 1991, 63, 1193–1203. [Google Scholar] [CrossRef]
- Oppenheimer, S.R.; Mi, D.; Sanders, M.E.; Caprioli, R.M. Molecular Analysis of Tumor Margins by MALDI Mass Spectrometry in Renal Carcinoma. J. Proteome Res. 2010, 9, 2182–2190. [Google Scholar] [CrossRef] [PubMed] [Green Version]
- Du, Y.; Du, Y.; Cui, M.; Liu, Z. Characterization of the Noncovalent Interactions between Lysozyme and Panaxadiol Glycosides by Intensity-Fading—Matrix-Assisted Laser Desorption Ionization—Mass Spectrometry (IF-MALDI-MS). Anal. Lett. 2021, 54, 2387–2394. [Google Scholar] [CrossRef]
- Chaurand, P.; Latham, J.C.; Lane, K.B.; Mobley, J.; Polosukhin, V.V.; Wirth, P.S.; Nanney, L.B.; Caprioli, R.M. Imaging Mass Spectrometry of Intact Proteins from Alcohol-Preserved Tissue Specimens: Bypassing Formalin Fixation. J. Proteome Res. 2008, 7, 3543–3555. [Google Scholar] [CrossRef] [Green Version]
- Treu, A.; Römpp, A. Matrix ions as internal standard for high mass accuracy matrix-assisted laser desorption/ionization mass spectrometry imaging. Rapid Commun. Mass Spectrom. 2021, 35, e9110. [Google Scholar] [CrossRef]
- Wang, C.; Bi, H.; Xie, J. Visualization of the Distance among Fishes by MALDI MS for Rapid Determination of the Taxonomic Status of Fish Fillets. J. Agric. Food Chem. 2020, 68, 8438–8446. [Google Scholar] [CrossRef]
- Norris, J.; Caprioli, R.M. Analysis of Tissue Specimens by Matrix-Assisted Laser Desorption/Ionization Imaging Mass Spectrometry in Biological and Clinical Research. Chem. Rev. 2013, 113, 2309–2342. [Google Scholar] [CrossRef] [Green Version]
- Lemaire, R.; Desmons, A.; Tabet, J.C.; Day, R.; Salzet, M.; Fournier, I. Solid Ionic Matrixes for Direct Tissue Analysis and MALDI Imaging. Anal. Chem. 2006, 78, 809–819. [Google Scholar] [CrossRef] [Green Version]
- Karas, M.; Krüger, R. Ion Formation in MALDI: The Cluster Ionization Mechanism. Chem. Rev. 2003, 103, 427–440. [Google Scholar] [CrossRef]
- Tsuchida, S.; Umemura, H.; Nakayama, T. Current Status of Matrix-Assisted Laser Desorption/Ionization–Time-of-Flight Mass Spectrometry (MALDI-TOF MS) in Clinical Diagnostic Microbiology. Molecules 2020, 25, 4775. [Google Scholar] [CrossRef] [PubMed]
- Beavis, R.C.; Chaudhary, T.; Chait, B.T. α-Cyano-4-hydroxycinnamic acid as a matrix for matrixassisted laser desorption mass spectrometry. Org. Mass Spectrom. 1992, 27, 156–158. [Google Scholar] [CrossRef]
- Beavis, R.C.; Chait, B.T.; Standing, K.G. Matrix-assisted laser-desorption mass spectrometry using 355 nm radiation. Rapid Commun. Mass Spectrom. 1989, 3, 436–439. [Google Scholar] [CrossRef] [PubMed]
- Zhang, X.; Wu, C.; Tan, W. Brain Lipid Dynamics in Amyloid Precursor Protein/Presenilin 1 Mouse Model of Early Alzheimer’s Disease by Desorption Electrospray Ionization and Matrix Assisted Laser Desorption Ionization–Mass Spectrometry Imaging Techniques. J. Proteome Res. 2021, 20, 2643–2650. [Google Scholar] [CrossRef] [PubMed]
- Chaurand, P.; Norris, J.L.; Cornett, D.S.; Mobley, J.A.; Caprioli, R.M. New Developments in Profiling and Imaging of Proteins from Tissue Sections by MALDI Mass Spectrometry. J. Proteome Res. 2006, 5, 2889–2900. [Google Scholar] [CrossRef]
- Han, X. Lipidomics: Comprehensive Mass Spectrometry of Lipids; Wiley: Hoboken, NJ, USA, 2016. [Google Scholar]
- Harvey, J. Analysis of carbohydrates and glycoconjugates by matrix-assisted laser desorption/ionization mass spectrometry: An update for 2013–2014. Mass Spectrom. Rev. 2018, 37, 353–491. [Google Scholar] [CrossRef] [PubMed]
- Lan, J.; Zenobi, R. Characterizing the iron loading pattern of ferritin using high-mass matrix-assisted laser desorption ionization mass spectrometry. Rapid Commun. Mass Spectrom. 2019, 33, 1855–1860. [Google Scholar] [CrossRef] [PubMed]
- Mamyrin, B.A.; Karataev, V.I.; Shmikk, D.V.; Zagulin, V.A. Mass reflection: A new nonmagnetic time-of-flight high resolution mass- spectrometer. Sov. Phys. Tech. JETP 1973, 37, 5. [Google Scholar]
- Khatri, N.; Gupta, A.; Taneja, R.; Bilandi, A.; Beniwal, P. A Review on Mass Spectrometry Detectors. Int. Res. J. Pharm. 2012, 3, 33–42. [Google Scholar]
- Thurner, G.C.; Debbage, P. Molecular imaging with nanoparticles: The dwarf actors revisited 10 years later. Histochem. Cell Biol. 2018, 150, 733–794. [Google Scholar] [CrossRef] [Green Version]
- Yang, J.; Caprioli, R.M. Matrix pre-coated targets for high throughput MALDI imaging of proteins. Biol. Mass Spectrom. 2014, 49, 417–422. [Google Scholar] [CrossRef] [PubMed] [Green Version]
- Schaepe, K.; Bhandari, D.R.; Werner, J.; Henss, A.; Pirkl, A.; Kleine-Boymann, M.; Rohnke, M.; Wenisch, S.; Neumann, E.; Janek, J.; et al. Imaging of Lipids in Native Human Bone Sections Using TOF–Secondary Ion Mass Spectrometry, Atmospheric Pressure Scanning Microprobe Matrix-Assisted Laser Desorption/Ionization Orbitrap Mass Spectrometry, and Orbitrap–Secondary Ion Mass Spectrometry. Anal. Chem. 2018, 90, 8856–8864. [Google Scholar] [CrossRef] [PubMed]
- Balluff, B.; Schöne, C.; Höfler, H.; Walch, A. MALDI imaging mass spectrometry for direct tissue analysis: Technological advancements and recent applications. Histochem. Cell Biol. 2011, 136, 227–244. [Google Scholar] [CrossRef] [PubMed]
- Wu, N.; Jiao, L.; Bütikofer, M.; Zeng, Z.; Zenobi, R. High-Mass Matrix-Assisted Laser Desorption/Ionization Mass Spectrometry for Absolute Quantitation of Noncovalent Protein–Protein Binding Interactions. Anal. Chem. 2021, 93, 10982–10989. [Google Scholar] [CrossRef]
- Römpp, A.; Spengler, B. Mass spectrometry imaging with high resolution in mass and space. Histochem. Cell Biol. 2013, 139, 759–783. [Google Scholar] [CrossRef] [Green Version]
- Yasunaga, M.; Furuta, M.; Ogata, K.; Koga, Y.; Yamamoto, Y.; Takigahira, M.; Matsumura, Y. The significance of microscopic mass spectrometry with high resolution in the visualisation of drug distribution. Sci. Rep. 2013, 3, 3050. [Google Scholar] [CrossRef]

Publisher’s Note: MDPI stays neutral with regard to jurisdictional claims in published maps and institutional affiliations. |
© 2022 by the authors. Licensee MDPI, Basel, Switzerland. This article is an open access article distributed under the terms and conditions of the Creative Commons Attribution (CC BY) license (https://creativecommons.org/licenses/by/4.0/).