Article

Rapid Quantitative Determination of Multiple Pesticide Residues in Mango Fruits by Surface-Enhanced Raman Spectroscopy

1
Institute of Chemistry, Vietnam Academy of Science and Technology, 18 Hoang Quoc Viet St., Cau Giay District, Hanoi 10000, Vietnam
2
University of Science and Technology, Hanoi (USTH), 18 Hoang Quoc Viet St., Cau Giay District, Hanoi 10000, Vietnam
3
Hanoi Medical University, 1 Ton That Tung, Dong Da District, Hanoi 10000, Vietnam
4
Vietnam Academy of Science and Technology, Graduate University of Science and Technology, 18 Hoang Quoc Viet St., Cau Giay District, Hanoi 10000, Vietnam
5
Institute of Natural Products Chemistry, Vietnam Academy of Science and Technology, 18 Hoang Quoc Viet St., Cau Giay District, Hanoi 10000, Vietnam
6
Institute of Applied Technology and Sustainable Development, Nguyen Tat Thanh University, Ho Chi Minh City 70000, Vietnam
7
Faculty of Food and Environmental Engineering, Nguyen Tat Thanh University, Ho Chi Minh City 70000, Vietnam
*
Authors to whom correspondence should be addressed.
Processes 2022, 10(3), 442; https://doi.org/10.3390/pr10030442
Submission received: 30 November 2021 / Revised: 25 January 2022 / Accepted: 27 January 2022 / Published: 22 February 2022
(This article belongs to the Section Food Process Engineering)

Abstract

:
Imidacloprid, acephate, and carbaryl are common insecticides that are extensively used in planting mango, a well-known fruit in Vietnam, to ease mango hopper issues. The accurate detection of pesticide residues is critical for mango export to meet quality criteria. This study developed a novel SERS platform by using polydimethylsiloxane (PDMS) to simulate the rose petal structure incorporated with a silver coating layer and silver nanoparticles (AgNPs) to detect imidacloprid, acephate, and carbaryl in mango fruits. In this paper, the rose petal PDMS/Ag-AgNPs replica was considered the most efficient substrate for SERS measurement with an EF of 4.7 × 10⁷. The Raman spectra of the three insecticides obtained from the PDMS/Ag-AgNPs substrate were clearly observed with their characteristic peaks of 1105 cm−1 for imidacloprid, 1083 cm−1, and 1579 cm−1 for acephate, and 727 cm−1 and 1378 cm−1 for carbaryl. The application of PDMS/Ag-AgNPs substrate in quantitative analysis of the three pesticides in mango fruit was evaluated. As a result, the limit of detection was 0.02 mg/kg for imidacloprid, 5 × 10⁻⁵ mg/kg for acephate, and 5 × 10⁻³ mg/kg for carbaryl. The SERS result also revealed that the pesticide residues in the mango sample were within an acceptable limit. This suggested the possibility of the rose petal PDMS/Ag-AgNPs replica for rapid quantification of pesticide residues not only in mango fruit but also in many other agricultural products.

1. Introduction

Mango (Mangifera indica L.) is one of the leading tropical fruit productions around the world due to its attractive taste and nutritional value [1]. To date, Asian countries are the main producer, contributing approximately 74.3% of global mango production [2]. According to the Ministry of Agriculture and Rural Development of Vietnam, the total planted area of mango farms was over 87,000 hectares nationwide, and the production reached 893.2 thousand tons in 2020. However, the most challenging issue that causes yield loss of mango production is due to mango hopper [3]. This requires the extensive use of pesticides to eradicate planthoppers in which imidacloprid, acephate, and carbaryl are typical insecticides used for mango crops to increase the agricultural yield. However, the pesticide residues that remain in fruit products have been reported to cause such adverse effects for human health as mutagenicity, oxidative stress, developmental immunotoxicity, and inflammation in the central nervous system and liver [3,4,5]. Therefore, the monitoring of pesticide residues in mangoes is a particular concern for the safety of consumers.
Traditionally, pesticide residues in fresh agricultural products have been mainly detected by conventional chromatographic methods, such as liquid chromatography-mass spectrometry (LC-MS), high-performance liquid chromatography (HPLC), or gas chromatography-mass spectrometry (GC-MS) [6,7,8]. These methods, which are not suitable for large-scale detection, require complex and time-consuming laboratory procedures despite their high detection accuracy and repeatability. Therefore, it is crucial to develop an easy, fast, and efficient method to quantitatively determine the pesticide residues. Ideally, the sample preparation method should be quick, simple, and ready to isolate a wide range of compounds with different structures and chemical properties [9]. Furthermore, pesticide residues in vegetables and fruits are often at low concentrations that require a very highly sensitive technique for analysis [9]. Among the analyzed techniques, Raman spectroscopy is considered an effective tool in detecting toxic compounds in food, but the most substantial drawback is that the Raman signals are usually weak, reducing its sensitivity. To overcome this issue, surface-enhanced Raman scattering (SERS), a method that combines the Raman spectroscopy technique and nanotechnology, has emerged as a fast and sensitive analytical technique that rapidly detects the presence of target molecules at very low concentrations [10,11,12]. The most important part of SERS is the challenge of the design of substrate to enhance the Raman signals. Usually, the chemical enhancement by the charge transfer and electromagnetic enhancement generated by localized surface plasmon resonances on noble metal nanostructures are generally acknowledged as two essential processes for the signal enhancement of SERS [13]. According to many published studies, silver (Ag)—a noble metal, is the most applied metal for amplifying the Raman signal due to its strong local surface plasmon resonance absorption in the visible near-infrared range [14]. The Ag nanoparticles (AgNPs) were used as an SERS substrate and were observed with enhanced Raman signal for rapid detection of difenoconazole in grapes [15]
Besides, numerous scientific studies have recently shown that some natural materials display unique surface superhydrophobicity owing to their hierarchical micro nanostructures, thus showing potential in low-cost SERS applications [16]. Biomaterials from rose petal [17,18], taro leaf [19], mantis wings [20], or butterfly wings [21] were easily treated with noble metals that exhibited outstanding SERS effects for multiple-molecule simultaneous identification with a very low limit of detection (LOD) (10−8–10−10 mg/mL). However, using natural materials, such as rose petals, has been observed with great difficulties due to its short storage time, leading to a lack of initiative for SERS application. Recently, using poly(dimethylsiloxane) (PDMS) to replicate the natural structure of biomaterials to produce a faithful and stable clone has been considered an effective SERS substrate due to its flexibility, chemical stability, non-toxicity, and cheap material [19,22]. Therefore, PDMS would be a valuable material for stamping and molding. In this study, we aimed to develop a suitable SERS substrate for the signal enhancement in SERS measure to quantitatively determine the pesticide residues (imidacloprid, acephate, and carbaryl) in mango fruits. The SERS substrate was developed by replicating the structure of rose petals using a PDMS elastomer. The effect of fabricating a coating layer of Ag/AgNPs with a rose petal PDMS replica on the signal enhancement via the observation of characteristic peak intensities of analytes was also evaluated.

2. Materials and Methods

2.1. Material

Silver nitrate (AgNO3, 99.8%), methyl alcohol (HPLC reagent), and polyvinyl alcohol (PVA) (87–88% hydrolyzed) were purchased from Sigma-Aldrich (St. Louis, MO, USA). Polydimethylsiloxane (PDMS) (Sylgard® 184, Dow Corning Corporation, Midland, MI, USA), a heat-curable PDMS, comprises a pre-polymer (a base) and cross-linker (a curing agent). Imidacloprid, acephate, and carbaryl (analytical grade) were purchased from Merck KGaA, Darmstadt, Germany. Rose petals were collected from a local market in Hanoi in February 2021. The collected rose petals were washed with deionized water to eliminate any contaminants then allowed to dry at room temperature. The dried rose petals were cut into a square specimen (10 mm × 10 mm) and then prepared for subsequent experiments.

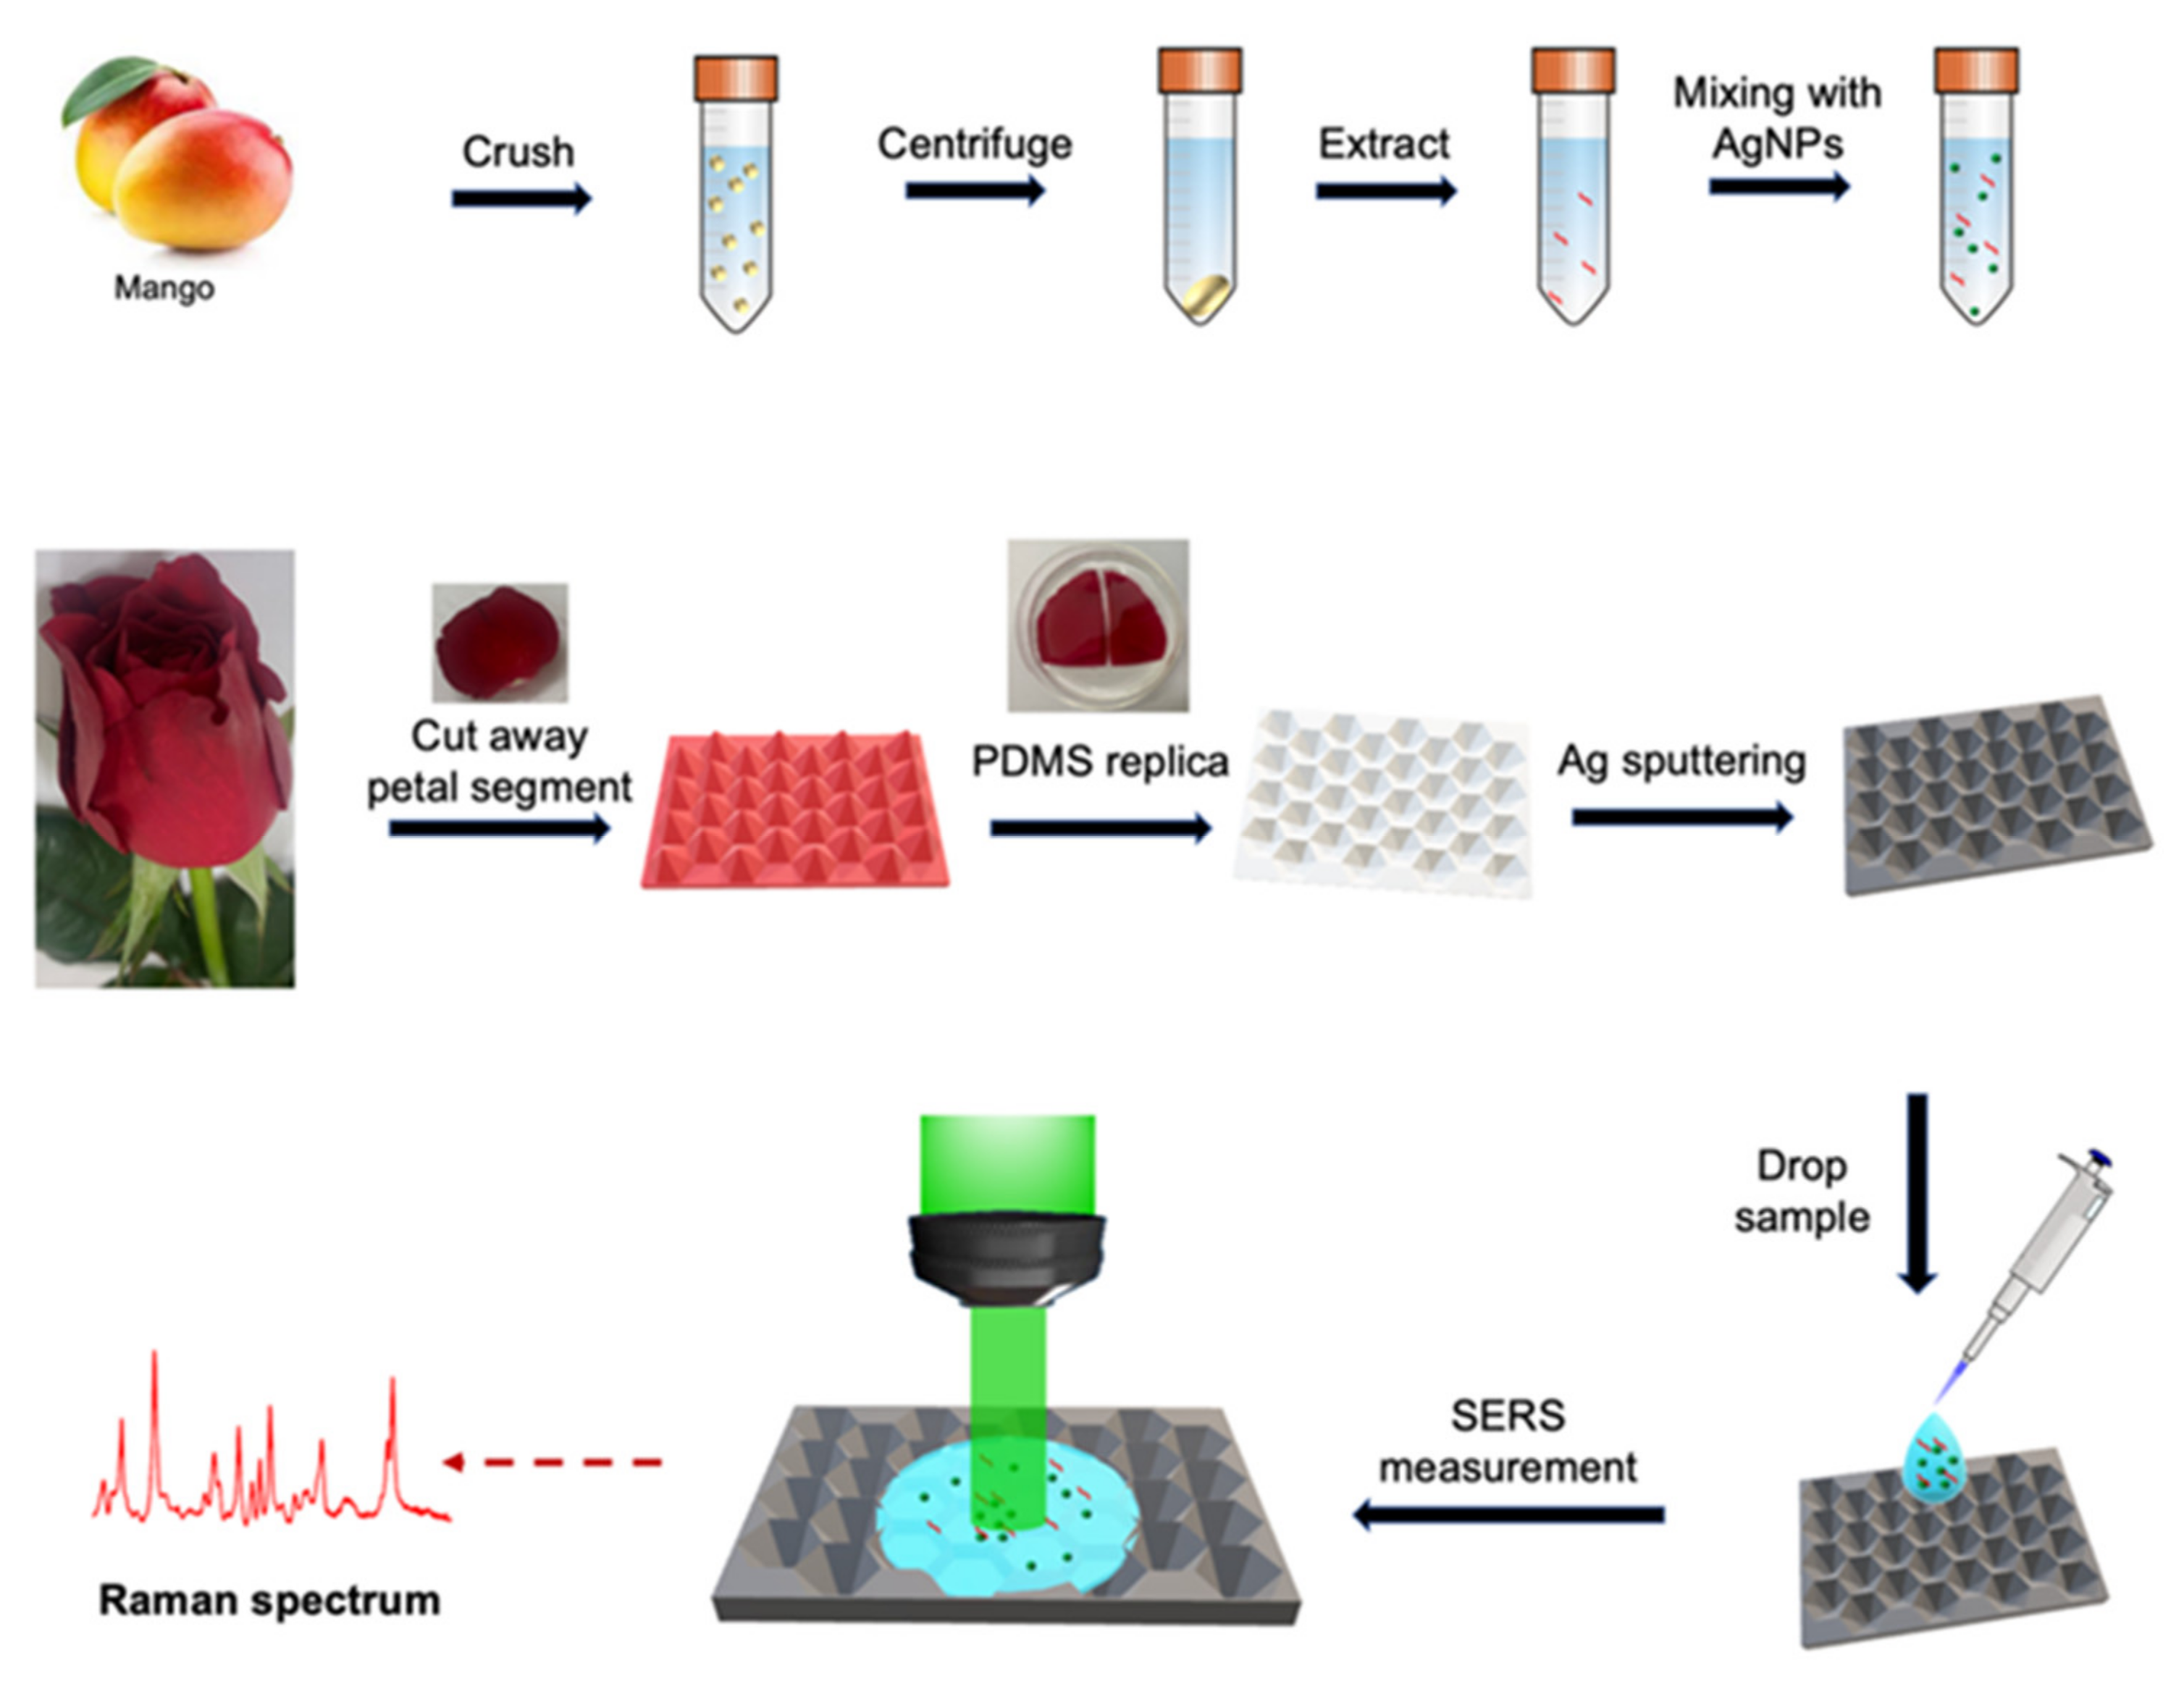
2.2. Synthesis of Silver Nanoparticles

Silver nanoparticles were synthesized in a study by Pencheva et al. [23]. Briefly, five grams of PVA were dissolved in 95 mL of deionized water at 80 °C with the help of a stirrer. AgNO3 solution (6 mg/mL) was added dropwise to the PVA mixture solution under the stirring condition to attain the AgNO3 concentration of 300 mg/L. The obtained solution was heated at 120 °C in the dark for 1 h, resulting in silver nanoparticles (AgNPs) stabilized with PVA. The solution was characterized by brown color, and the presence of AgNPs in the mixture solution was confirmed by using UV-visible spectroscopy (UV-vis) (UV-3600, Shimazu Co. Ltd., Kyoto, Japan).

2.3. Replication of Rose Petals by PDMS Elastomer

Double-sided sticky tape was used to secure the rose petal specimen in a silicon wafer. The PDMS elastomer Sylgard® 184 was prepared according to the manufacturer’s recommendation by mixing the base and curing agent at the weight ratio of 10:1, then was homogenously mixed for 15 min followed by a degassing step in a vacuum oven for 5 min to remove the entrapped air bubbles. The prepared PDMS solution was then cast on the rose petal specimen. The curing temperature was kept at 35 °C to avoid heat damage to the rose petal specimen to ensure PDMS chain cross-linking. Thereafter, the surface of the rose petal PDMS replica was sputtered by a thin layer of Ag by a radio frequency (RF) magnetron sputtering apparatus (DHRM-3). The operation was carried out in Argon gas (99.9% of purity) at the pressure of 2 × 10⁻² mbar in the sputtering chamber and the applied RF power of 50 W [19]. The morphology of PDMS/Ag substrate was examined using a scanning electron microscope (SEM).

2.4. Screening of SERS Substrate by Crystal Violet

Crystal violet (CV) is an organic dye that has been intensively used in biomedical industries. The CV solution was prepared in double-distilled water at the concentration of 1 mM. For the screening test, an aliquot (60 µL) of CV solution was mixed with 2 mL of AgNPs suspension or blank solution and then dropped to different SERS substrates: rose petal PDMS replica—PDMS replica and rose petal PDMS replica coated with Ag film—PDMS/Ag replica. The samples were left for 15 min for chemisorptions, and the apparatus was ready for SERS experiments after molecule adsorption.

2.5. Preparation of Standard Pesticide Samples

Pesticide solutions of various concentrations were generated using serial dilution to obtain a standard curve and evaluate the limit of detection (LOD). In brief, imidacloprid from stock solution (50 mg/L) was diluted in ultrapure water at varying concentrations (0.01, 0.1, 1, and 10 mg/L). Acephate from stock solution (50 mg/L) was dissolved in aqueous ethanol at varying concentrations of 10−8, 10−6, 10−4, 10−3, and 10−2 mg/L. Meanwhile, a stock solution of carbaryl was prepared in methanol at a concentration of 0.01 mg/L. The serial solutions (0.0005, 0.001, 0.002, and 0.005 mg/L) of carbaryl were prepared by diluting the stock solution in 50% methanol.

2.6. Preparation of Mango Samples with Tested Pesticides

The mango variety Yen Chau was purchased from a local supermarket in Hanoi capital city in March–June 2021. The mangoes were selected with uniform size and without mechanical injuries or diseases symptoms. The mangoes were washed with distilled water, and the flesh was collected and subjected to the juice extractor. The juice was ultrasonically oscillated for 10 min before being centrifuged at 9000 rpm for 15 min by using a high-speed centrifuge (Beckman Coulter Inc., Brea, CA, USA). The supernatant was collected and considered as a basis for the mango extract sample. The varying dosages of imidacloprid, acephate, carbaryl, and the mixture of the three pesticides were separately added to the mango extract to evaluate its characteristic Raman peak intensities. The prepared samples were mixed with AgNP suspension, then deposited in the PDMS/Ag substrate and allowed to dry at room temperature. The dried sample on the PDMS/Ag substrate was subjected to SERS measurement using a 632.8 nm laser as an excitation source. All the SERS spectra in this investigation were the average of five data measurements, smoothed and adjusted for baseline correction. The flowchart of rose petal PDMS replica and preparation of mango extract for determination of pesticide residues is depicted in Figure 1.

2.7. Data Analysis

Denoising and baseline correction was applied to all SERS measurements by the Savitzky–Golay (S–G) 5-point smoothing filter and the adaptive iteratively reweighted penalized least squares (airPLS). A straightforward linear calibration curve was used to analyze the linear connections between Raman intensities of distinctive peaks and varying concentrations of pesticides in standard solutions or mango extracts. The coefficient of determination (R2) and standard deviation were used to evaluate the fitting of the linear curve.
Figure 1. The flowcharts of the rose petal PDMS/Ag replica and mango extract.
Processes 10 00442 g001

3. Results

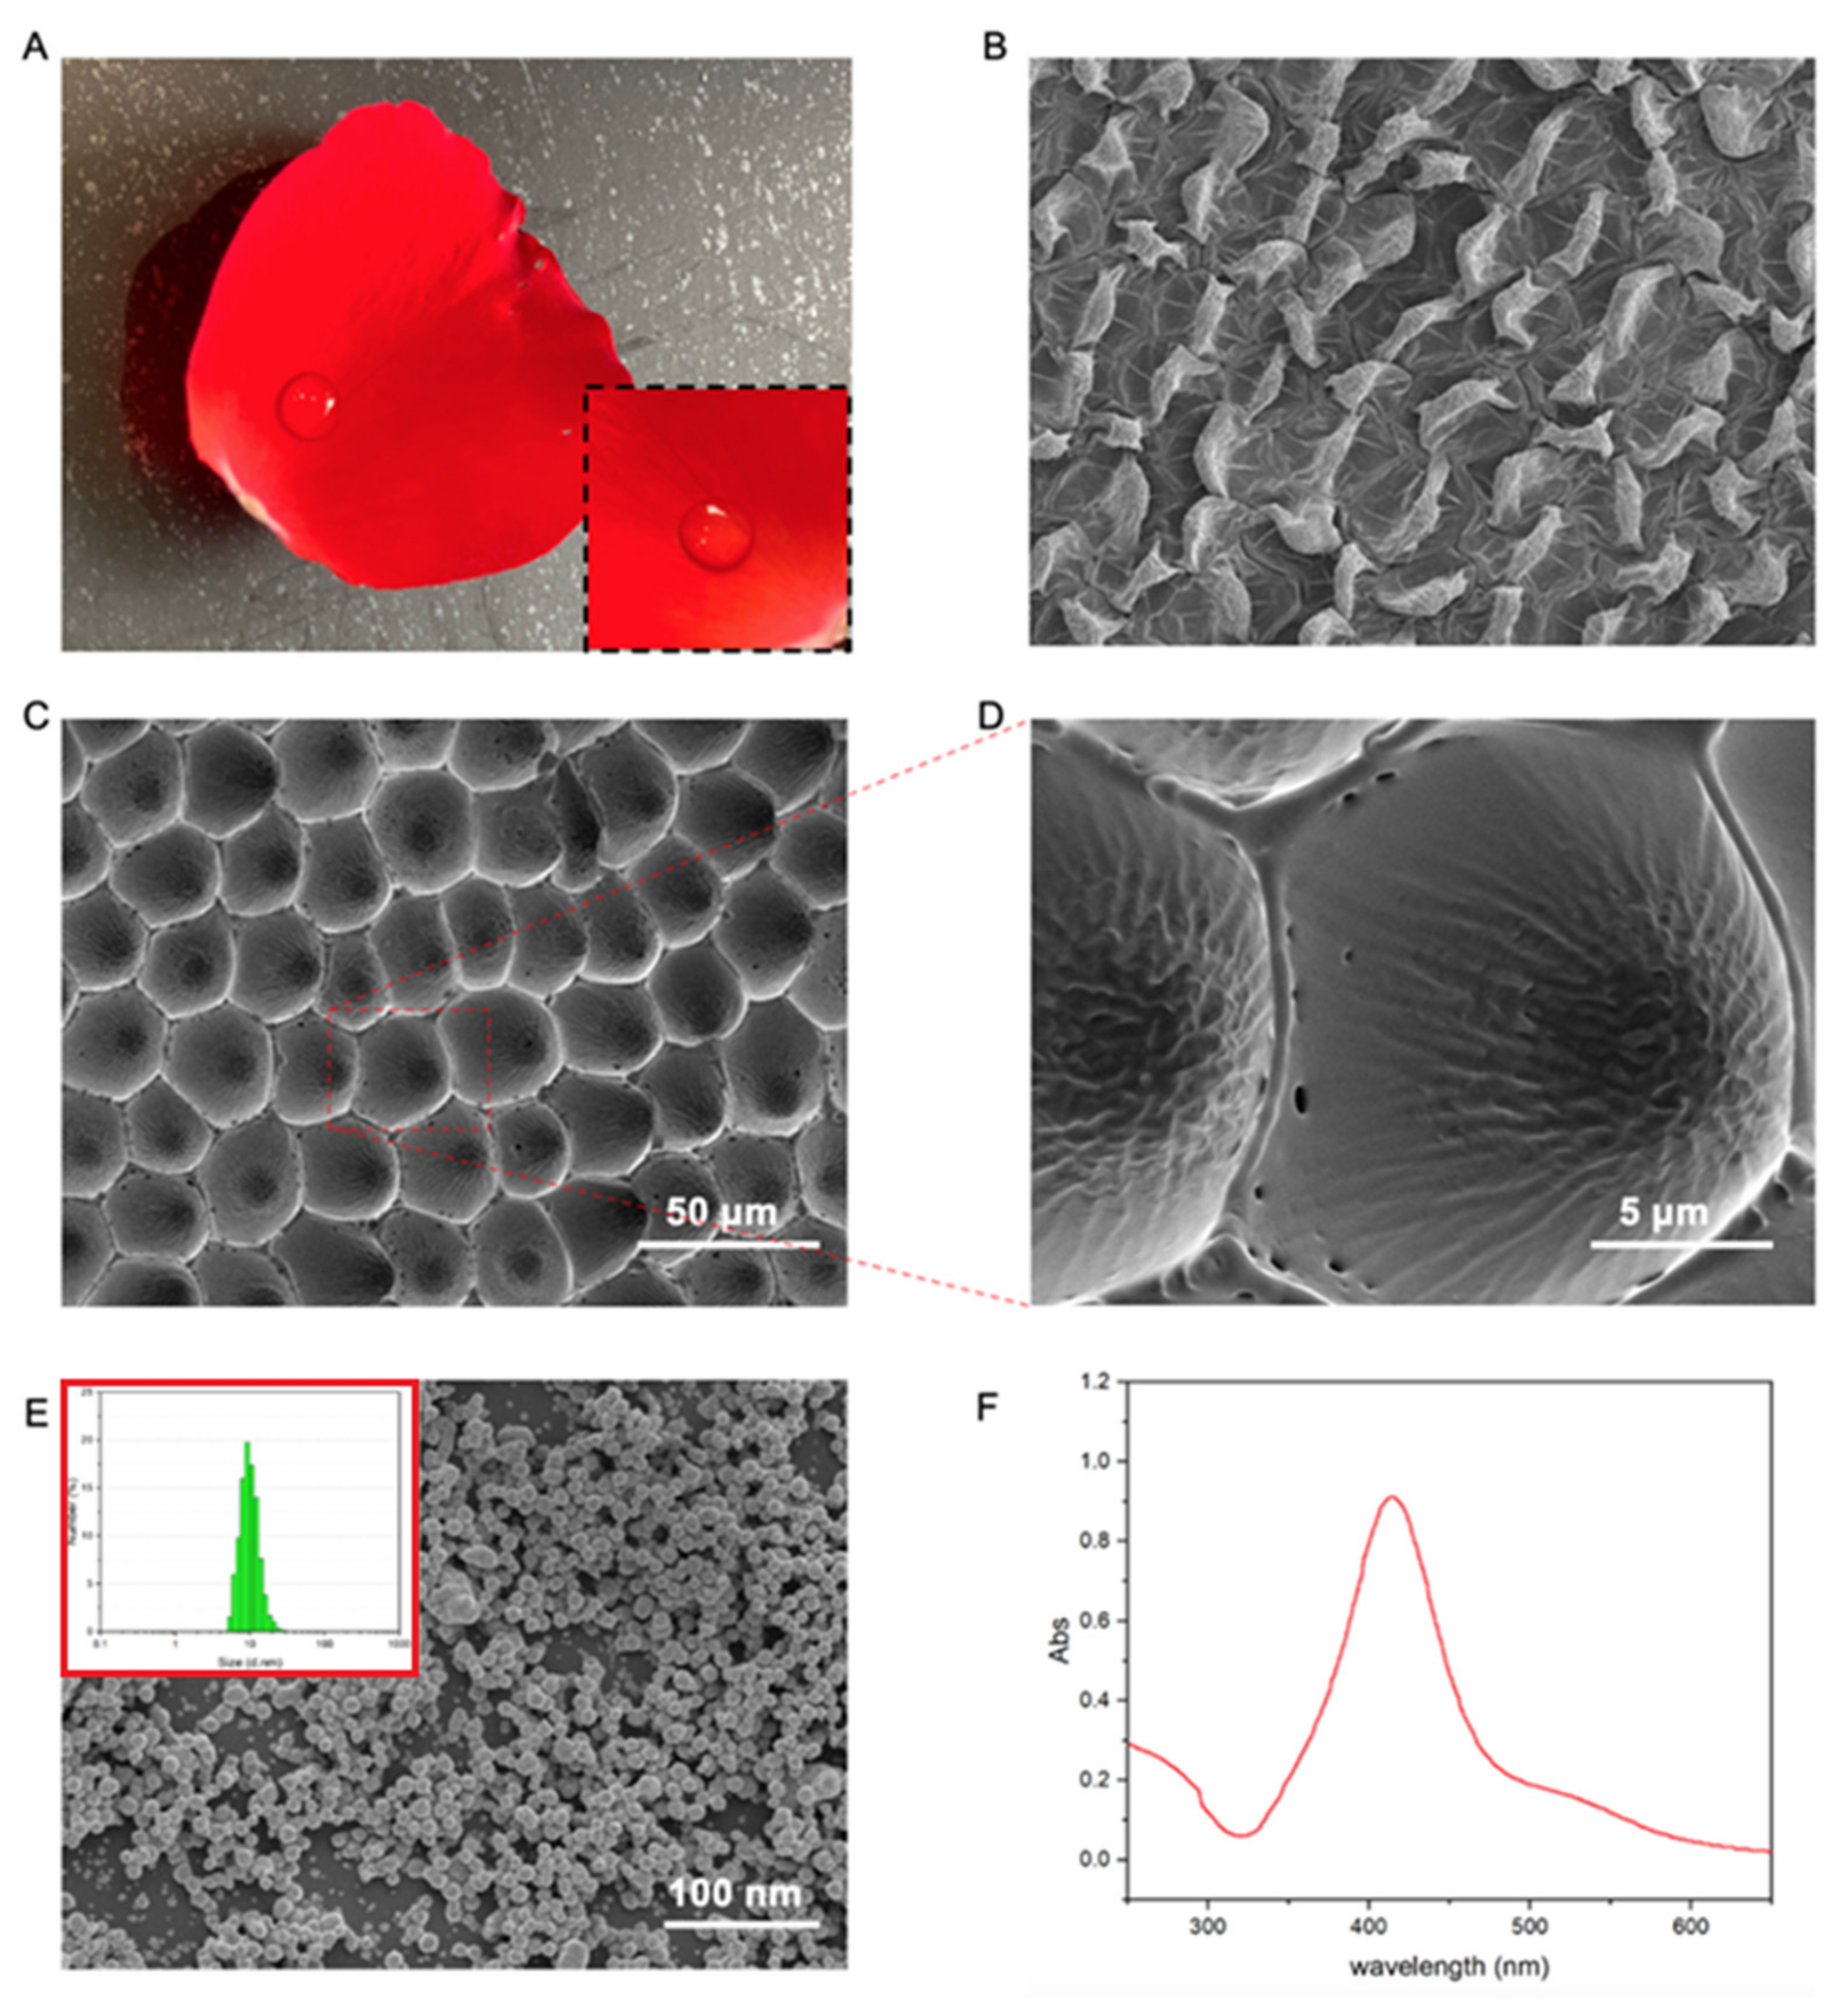
3.1. Rose Petal Simulated PDMS/Ag Microstructure

In earlier work, the rose petals were characterized by the superhydrophobic surface with a very high water-adhesive force, which was well known as a petal effect [24]. Figure 2A is an image of a rose petal with a water drop on the surface, which indicates that its surface was unwetted by water. The droplet was observed with a spherical shape, demonstrating the high hydrophobic characteristic of the rose petal surface [17].
To further understand the superhydrophobic nature of the rose petal and its PDMS replica, SEM was used to observe the distribution of microgravity and nanovoid on the rose petal and the PDMS replica. According to previous reports, the rose petal surface comprises hierarchical micropapillary arrays and nanofolds on the upper epidermis, while only nanofolds exist on the lower epidermis [17,25,26]. Figure 2B shows the SEM micrograph of dried rose petals. Due to the loss of water from cells, the wizened micropapillary on the dried rose petal surface exhibited many wrinkles as flakes. However, it could be observed that the wizened micropapillary on the rose petal PDMS replica were clear with a measured average size of ~30 μm (Figure 2C). This result confirmed that the PDMS replica of the rose petal could improve the lifetime of SERS substrates compared to the direct use of the natural rose petal substrate. In fact, the covering of silver nanolayers on the natural plasmonic structure can enhance surface plasmons at the interface. Nanovoid (3D) structures had the maximum SERS signal at the Ag layer thickness of 20 nm and showed a gradual decline in signal intensity with an increased layer thickness [27]. Therefore, in this study, the Ag film thickness covered on the surface of the PDMS replica substrate, which was roughly 20 nm, was considered a proper thickness to obtain a high signal for SERS. Figure 2C,D illustrates the SEM images of the PDMS replica microstructure of the rose petal with a coated Ag film at the scale of 50 µm and 5 µm. It can be seen that there was a cuticular fold at the top of each micropapillary, which could be applied for SERS measurement. The SEM image, shown in Figure 2E, confirmed the successful synthesis of AgNPs with an average diameter of 10 nm. Besides, the absorption peak of AgNPs, shown in Figure 2F, was centered at the wavelength of 412 nm, which was comparable with a study done by Arifin and Lee [28]. The narrow and strong absorption peak indicated the excellent monodisperse and plasmonic properties of AgNPs.

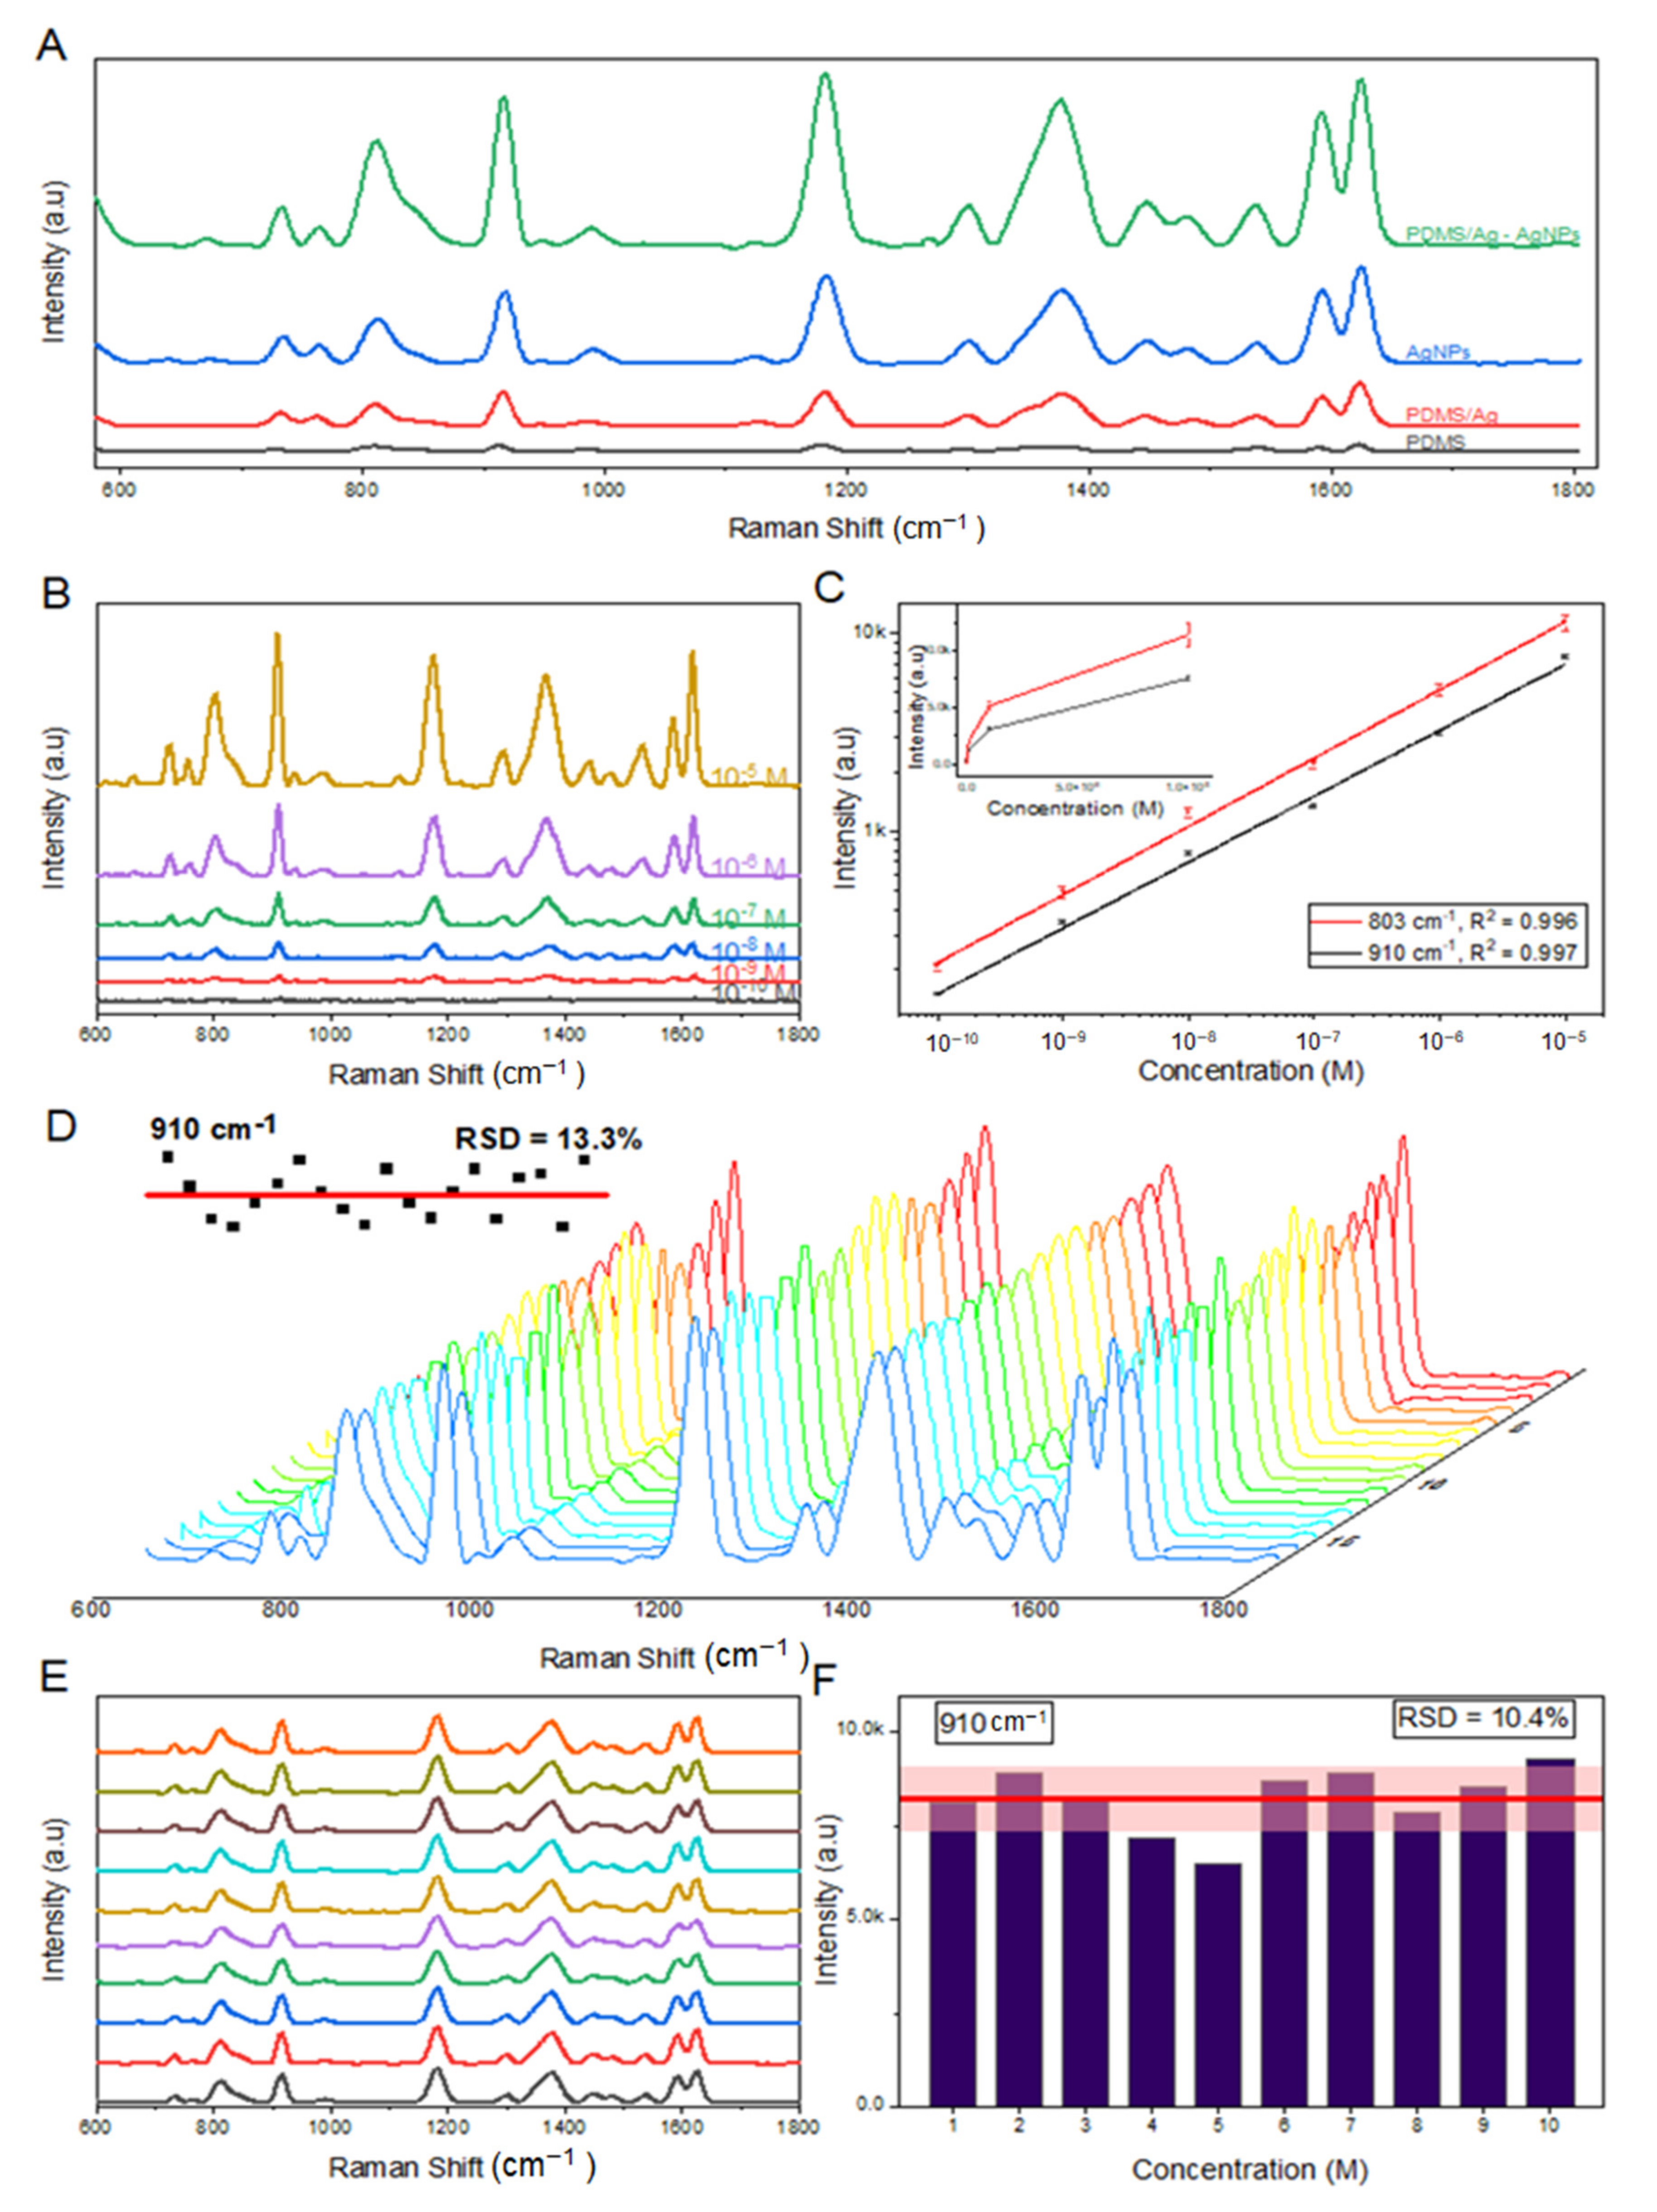
3.2. Efficiency of SERS Substrates on the SERS Measurement of Crystal Violet

As shown in Figure 3A, not surprisingly, the PDMS substrate showed the weakest Raman signal among the analyzed groups, whereas the PDMS/Ag-AgNPs substrate showed the highest degree of Raman signal enhancement. The Raman signal intensity was in the order of PDMS/Ag-AgNPs > AgNPs > PDMS/Ag > PDMS. This considerable enhancement revealed that the hierarchical nanostructures served a key role in creating electromagnetic enhancement, resulting in a significant augmentation of the SERS signals from the adsorbed CV molecules. In all SERS spectra, there were six dominant Raman peaks centered at 803 cm−1, 910 cm−1, 1185 cm−1, 1375 cm−1, 1486 cm−1, and 1533 cm−1, which were compatible with the Raman signals of CV molecules. The Raman bands at 803 cm−1, 910 cm−1, and 1185 cm−1 could be attributed to the C-C-C ring in-plane vibration mode, the C-H out-of-plane bend mode, and the C-H in-plane bending mode of the CV molecule, respectively. The Raman band at 1375 cm−1 corresponded to the N-H in-plane bending mode, while the bands at 1486 cm−1 and 1533 cm−1 were assigned for the in-plane C-C stretching modes of CV [29].
For quantitative analysis of CV on the PDMS/Ag-AgNPs substrate, we conducted SERS spectra of CV concentrations from bottom to top. Variations in the Raman peaks at 803 cm−1 and 910 cm−1 were observed and utilized to quantify the CV concentration. The calibration equation and correlation coefficient were calculated using regression analysis on the peak heights of various CV solution concentrations ranging from 10−10 to 10−5 M, shown in Figure 3B,C. The baseline correction was carried out for each spectrum, and the spectra were ordered in the ascending order of 803 and 910 cm−1 and the concentration of CV. The linear association between the peak height and CV concentration, within the concentration range of 10−10 to 10−5 M, was substantial with the correlation coefficients (R2) of 0.996 and 0.997 for 803 cm−1 and 910 cm−1, respectively. The limit of detection (LOD) was recorded at 3.6 nM (approximately 1.5 μg L−1), defined as the lowest concentration with a signal-to-noise ratio of 3.
The enhancement factor (EF) was calculated to analyze the SERS performances of the PMDS/Ag-AgNPs substrate as follows: [30,31]
EF SERS = I SERS I Raman × N Raman N SERS
where ISERS and IRaman are the intensities of the selected Raman peaks on SERS and the untreated substrate, NSERS and NRaman are the number of CV molecules adsorbed on SERS and the untreated substrate.
The following formula was used to calculate the average number of adsorbed CV molecules (N) in the laser illumination volume of testing regions [32].
N = c.V
where c is the concentration of CV molecules, and V is the laser illumination volume.
Once the CV solution is dumped and dried, it is presumed that the CV molecules are distributed uniformly over different substrates [33,34]. Hence, the EF can be determined using the formula as follows [35]:
EF SERS = I SERS I Raman × C Raman C SERS
where CSERS and CRaman are the concentration of CV solution used for SERS and untreated substrate, respectively. Based on the most substantial peak at 803 cm−1, the EF for CV was calculated as 4.7 × 10⁷. The SERS enhancement behavior of the current PDMS/Ag-AgNPs substrate for the detection of CV was compared with previously reported SER substrates as listed in Table 1.
Aside from sensitivity, the homogeneity and reproducibility of the rose petal replica from PDMS/Ag-AgNPs substrate are critical in practical applications. Figure 3D depicts the Raman spectra of CV at the concentration of 10−5 M from 20 randomly selected positions on the substrate. The relative standard deviation (RSD) value of the prominent peak at 910 cm−1 of CV spectrum from 20 measurements (the inset) was 13.3%, which was significantly lower than that of the scientific requirements (20%) [38]. Figure 3E illustrates the SERS spectra of CV at the concentration of 10−5 M, absorbed on the PDMS/Ag-AgNPs substrate collected from 10 measurements of different substrates. It showed that the RSD of the peak at 910 cm−1 of CV spectrum from 10 measurements of different substrates with an average (red line) was 10.4% (Figure 3F). This result suggested an outstanding reproducibility of PDMS/Ag-AgNPs substrate, exhibiting high applicability in Raman analysis.

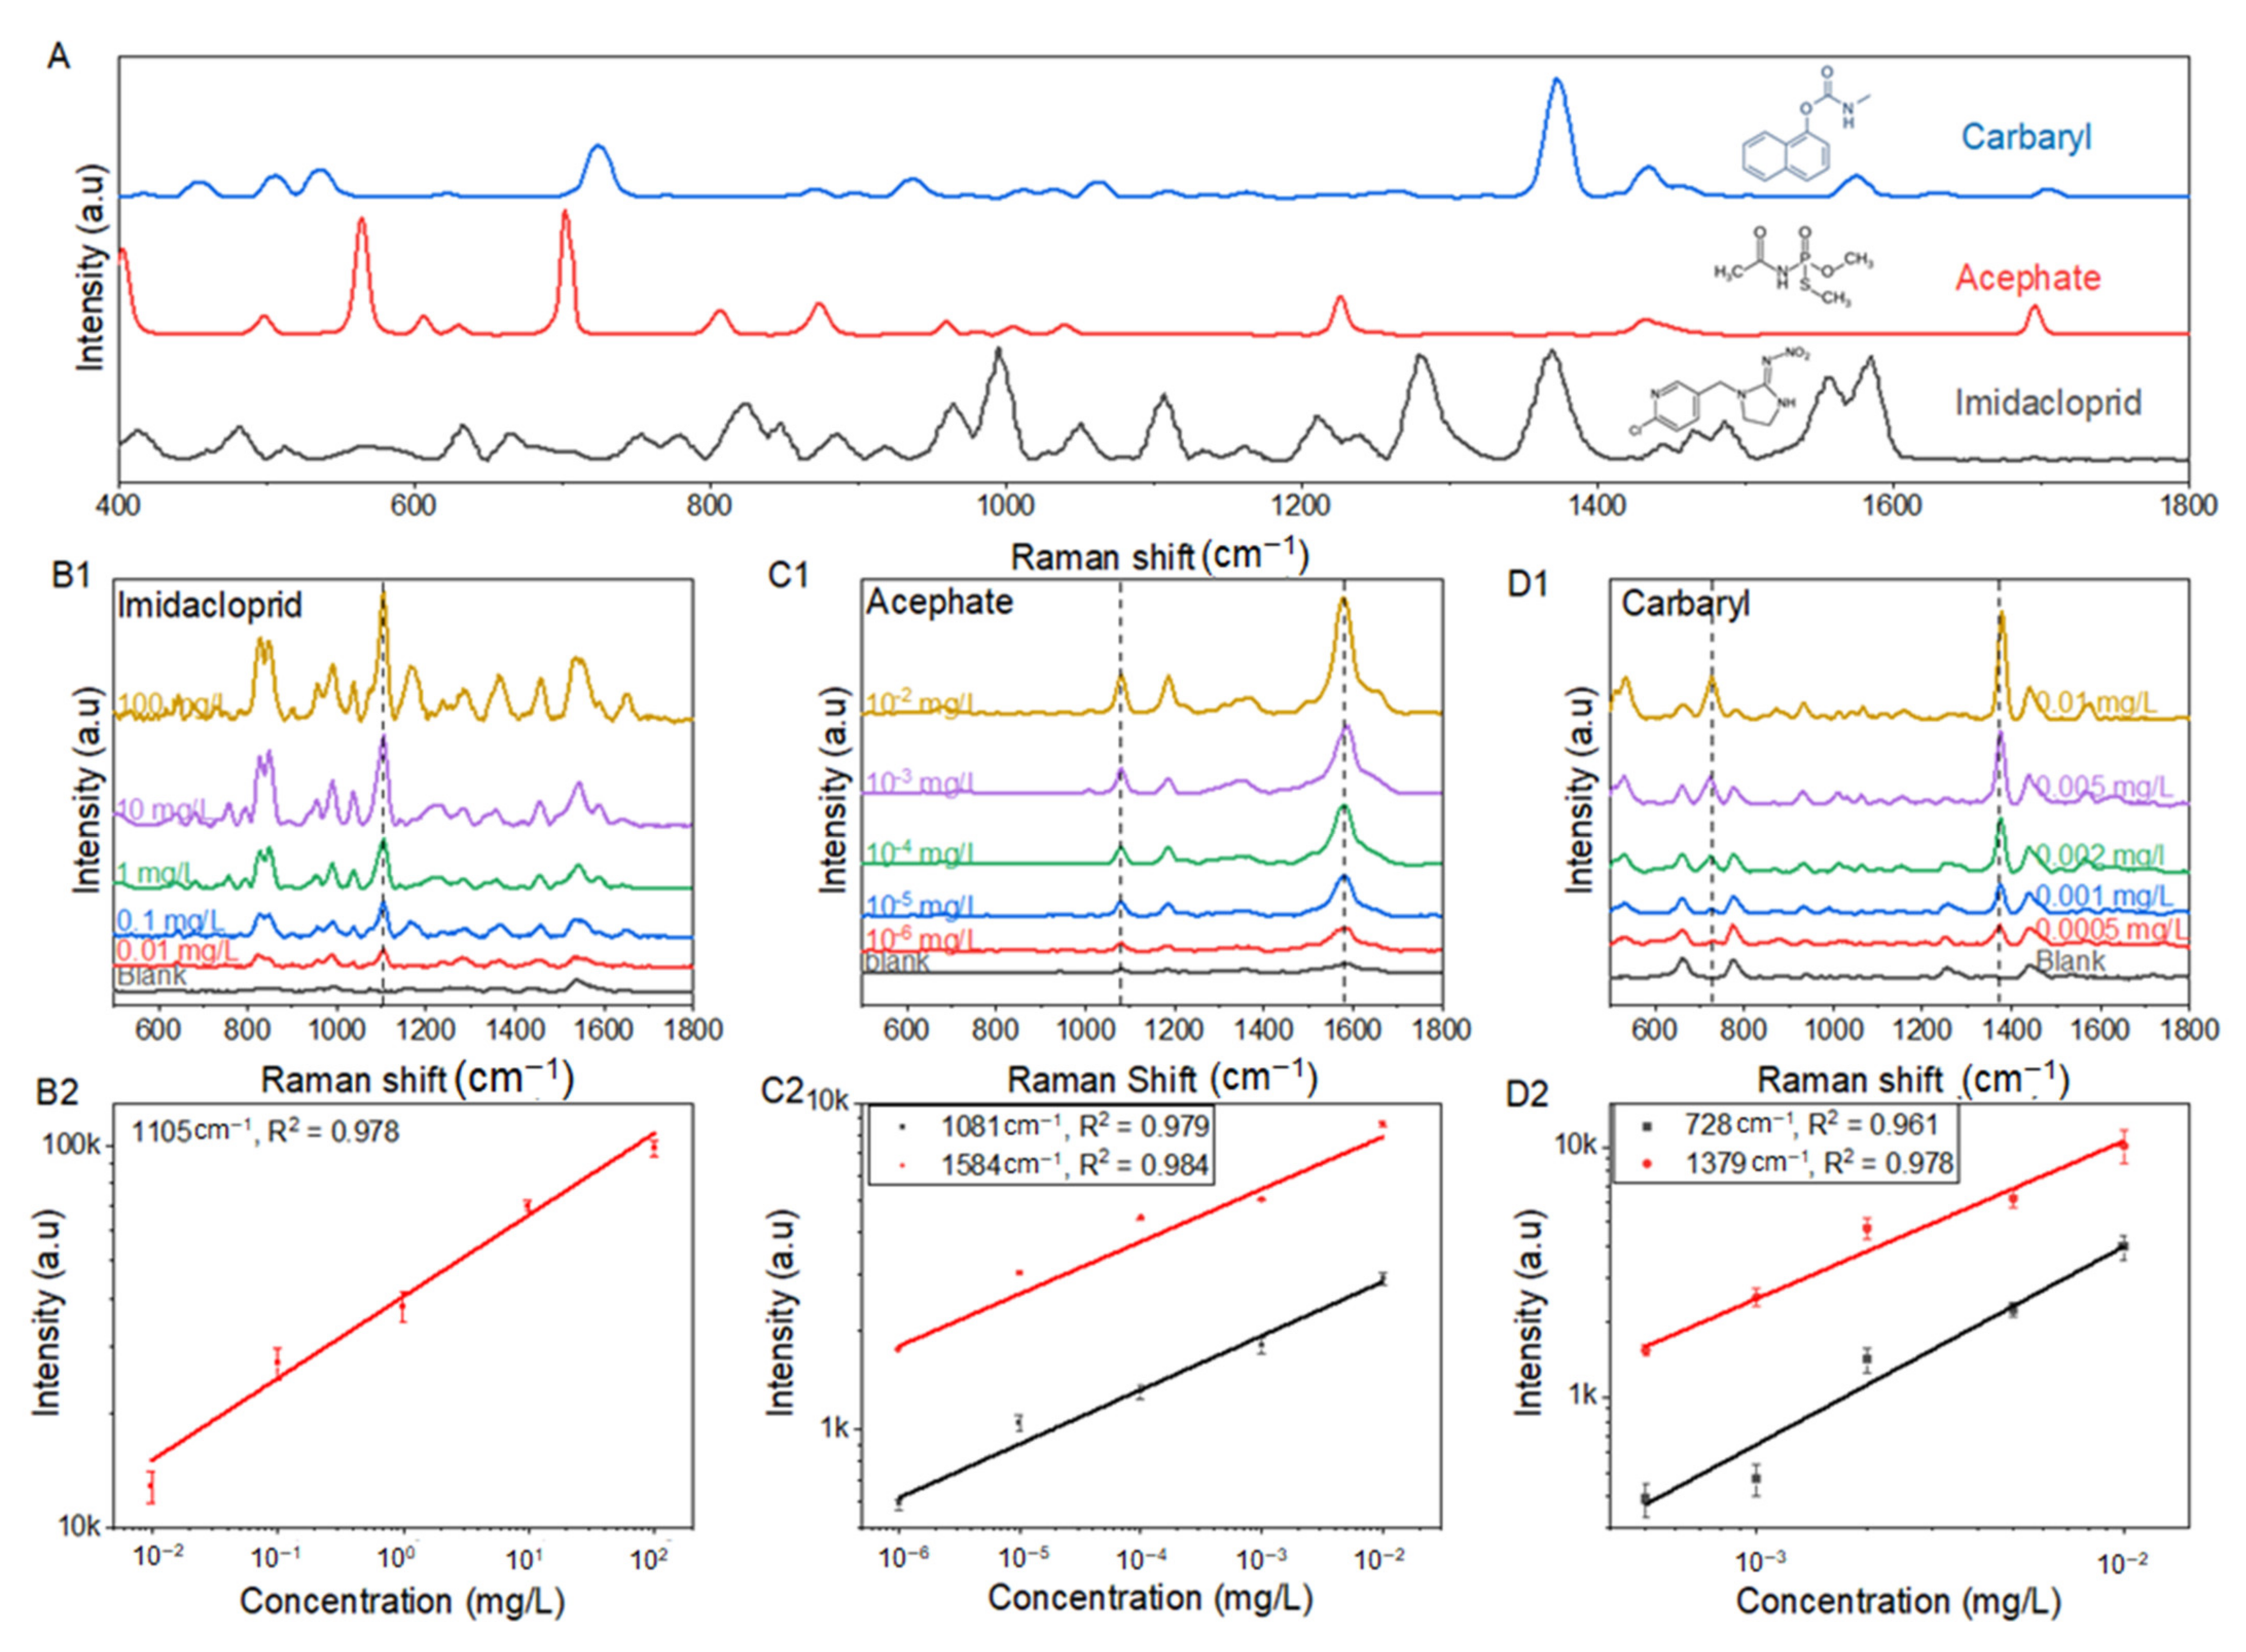
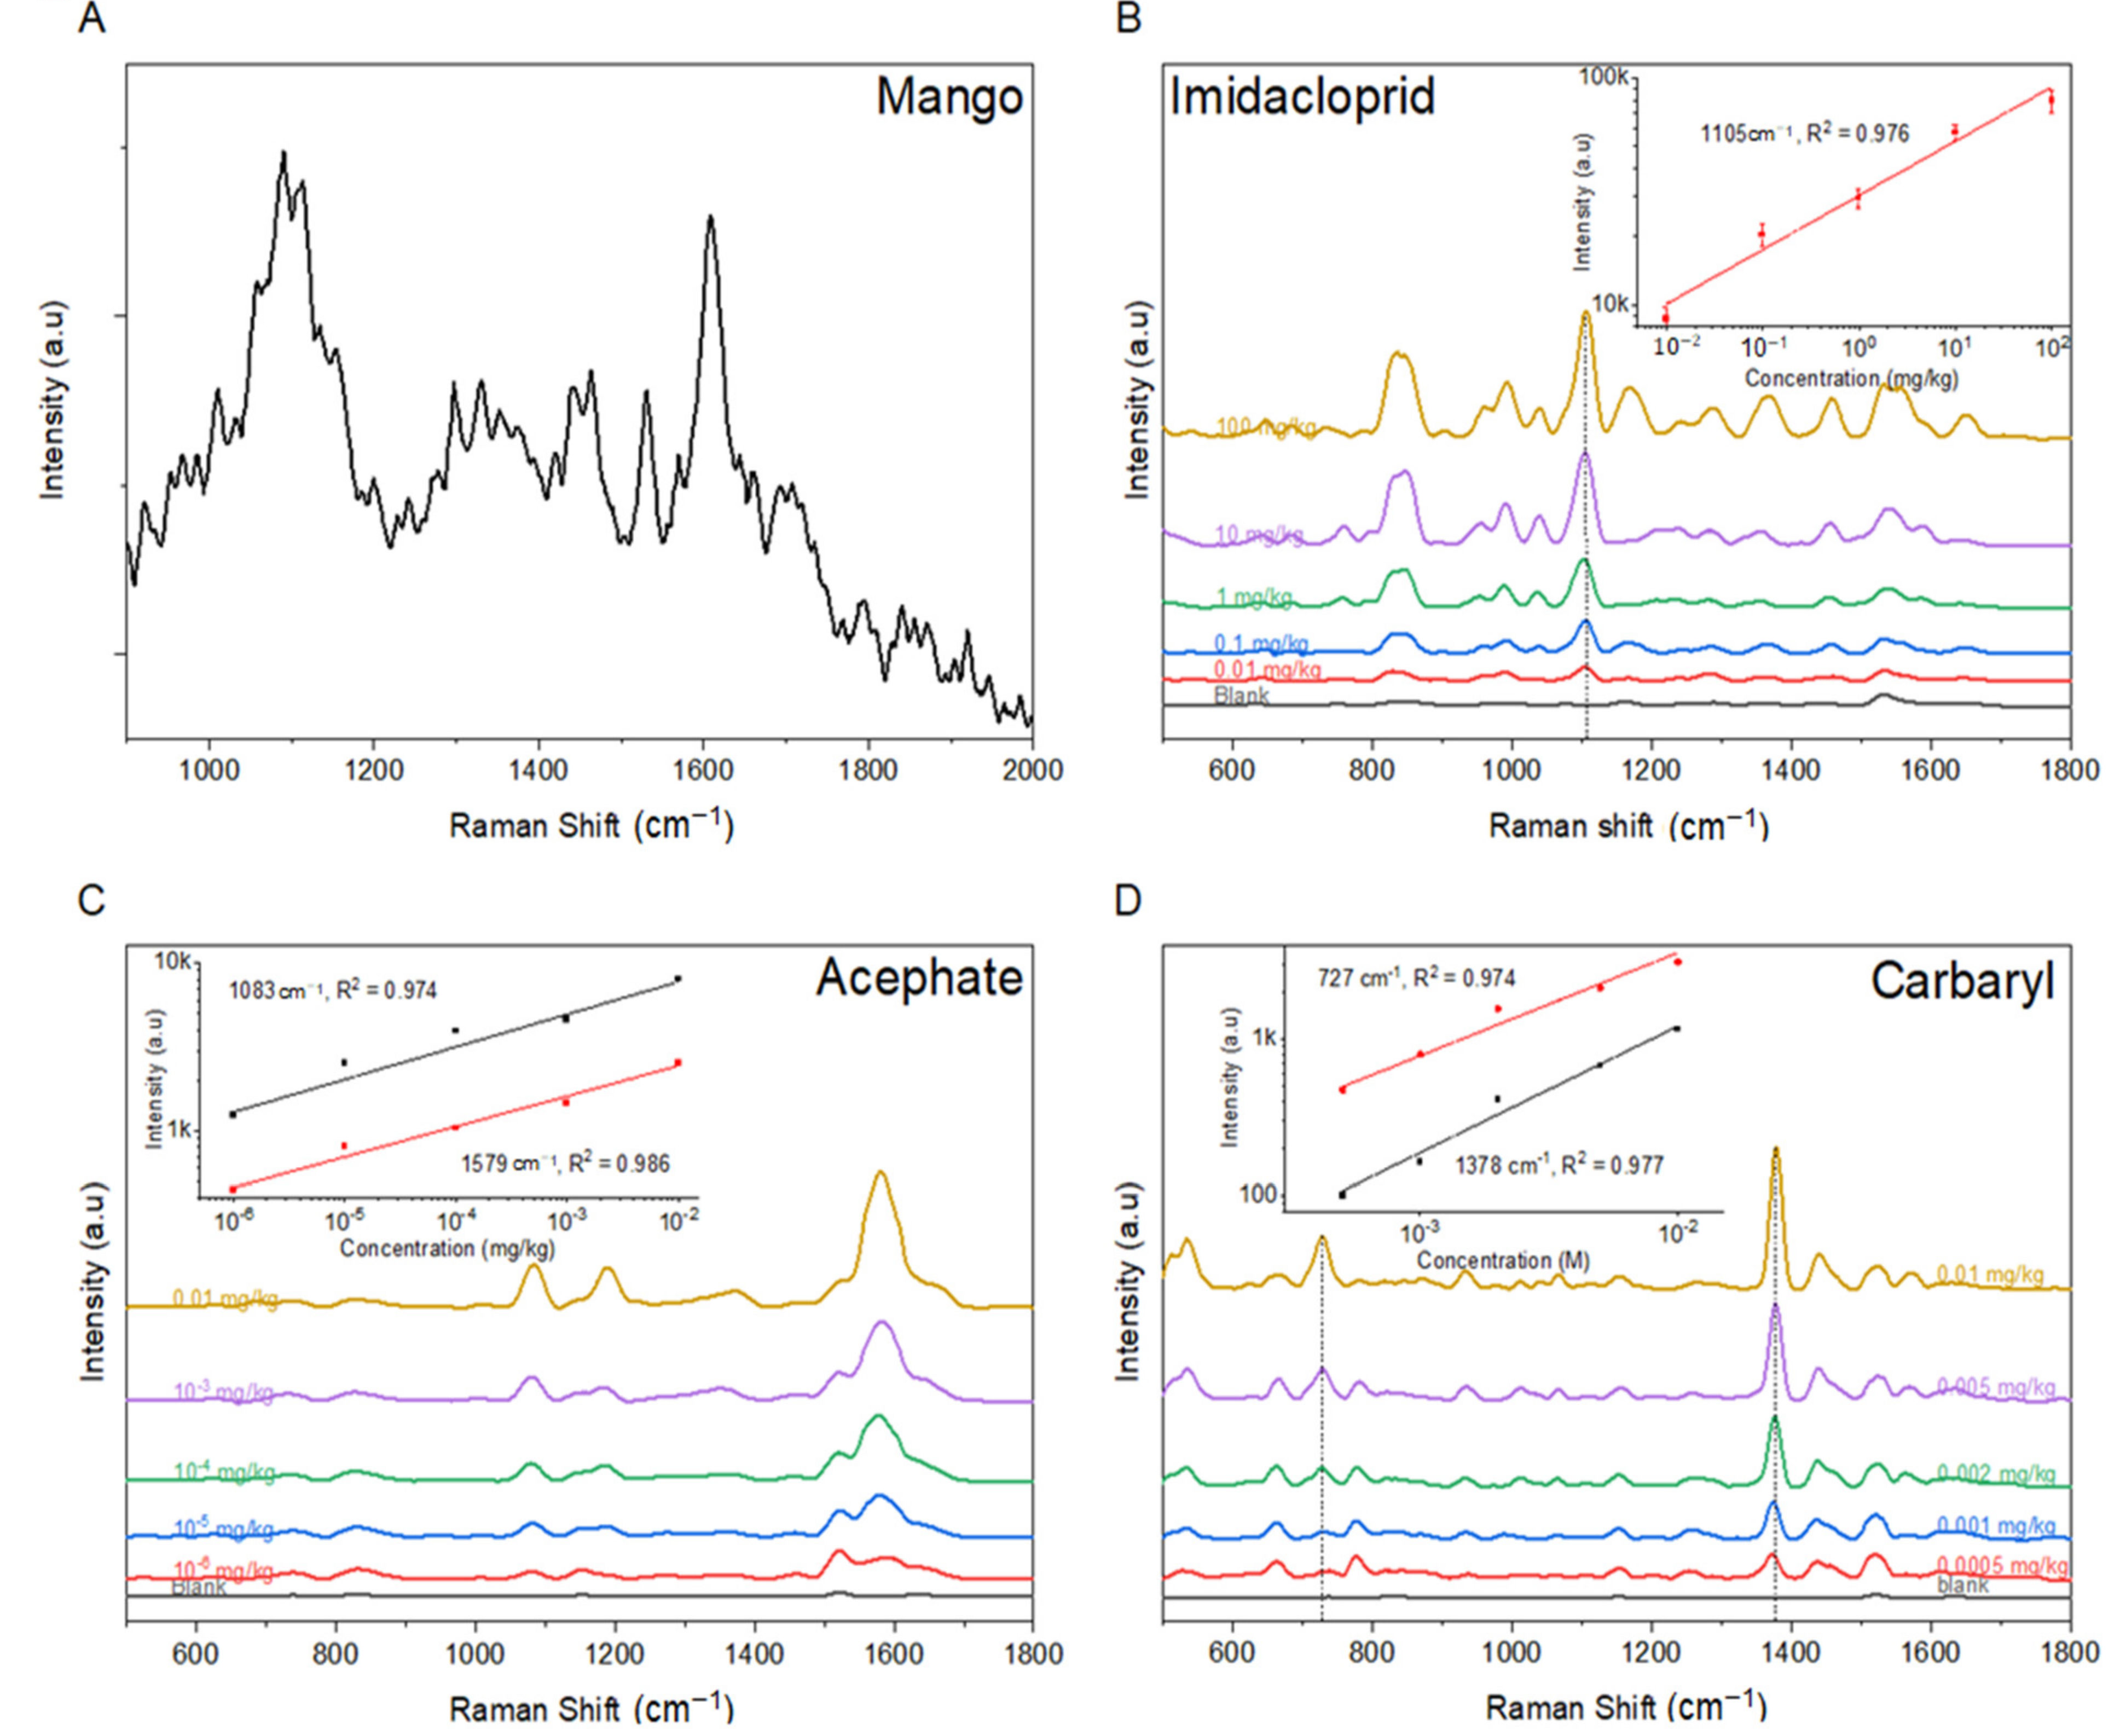
3.3. Raman Spectrum and Quantitative Analysis of Imidacloprid, Acephate, and Carbaryl

The rose petal replica from PDMS/Ag-AgNPs substrate was selected for the detection of imidacloprid, acephate, and carbaryl. Figure 4A shows the Raman peaks of these pesticides in powder form. The characteristic Raman peaks of imidacloprid were at 660 cm−1 (ascribed to C-Cl bonding stretch), 830 cm−1, and 1110 cm−1 (assigned to C-C-C bonds), 989 cm−1, and 1351 cm−1 (corresponding to C-N stretching) (Table 2). Meanwhile, the main vibrational bands of acephate were attributed to the P-O-C, P-S-C, and ketone characteristics. The P-O-C mode was characterized at 710 cm−1, while the P-S-C mode was at 565 cm−1. The ketone characteristic corresponded to the band at 1584 cm−1. Furthermore, the bands at 1110 cm−1 and 1330 cm−1 could be ascribed to the amine group. Besides, carbaryl is a naphthalene-derivatized carbamate; its Raman spectrum was dominated by the peaks associated with naphthalene and carbamate vibrational modes. The low-frequency C-C bending modes at 453 cm−1, 504 cm−1, and 534 cm−1, symmetric ring vibration modes at 1379 cm−1, the C-H wagging mode at 1432 cm−1, and the C=C stretching mode in the naphthalene ring at 1576 cm−1, as well as an N-C-O-C bending with some ring breathing character at 728 cm−1, were the key peaks of carbaryl (Figure 4A).
The SERS spectra of imidacloprid, acephate, and carbaryl solution at different concentrations are exhibited in Figure 4B,C. It can be seen that the intensity of the SERS signal increased with enhanced pesticide concentrations. In the case of imidacloprid, the SERS spectrum of the standard imidacloprid solution was fairly similar to that in the powder form with some shifts. The characteristic SERS peaks of imidacloprid were at 829 cm−1, 959 cm−1, 993 cm−1, and 1105 cm−1 (Table 2). As shown in Figure 4B, the SERS intensities at the peak of 1105 cm−1 showed linear correlations with the imidacloprid concentration ranging from 0.01–100.00 mg/L. The linear equation was obtained (y = 0.214x + 4.606) with a high coefficient of determination (R2) of 0.978.
Similarly, the high-efficiency detection of acephate molecules at ultra-low concentrations demonstrated the potential of PDMS/Ag-AgNPs substrate for quantitative investigation. The linear correlation between peak intensities at 1081 cm−1 and 1584 cm−1 and acephate concentrations, shown in Figure 4C2, were also observed with high coefficient values of 0.979 and 0.984, respectively.
In the case of carbaryl, all characteristic peaks could be recognized at the least concentration of 0.0005 mg/L. The SERS spectral features of carbaryl standard solutions were characterized by the dominant peaks at 453 cm−1, 534 cm−1, 728 cm−1, 1379 cm−1, and 1435 cm−1. The spectra displayed some changes in intensity and peak shifting, which indicated the influence of the chemical adsorption of carbaryl molecules on the PDMS/Ag-AgNPs substrate. Two peaks at 728 cm−1 and 1379 cm−1 were utilized to determine the correlation of intensity—concentration (from 0.0005 to 0.01 mg/L) (Figure 4D2). The linear relationships were expressed by the equations: y = 0.792x + 5.187 at 728 cm−1 and y = 0.631x + 5.287 at 1379 cm−1 with R2 coefficient values of 0.961 and 0.978, respectively.

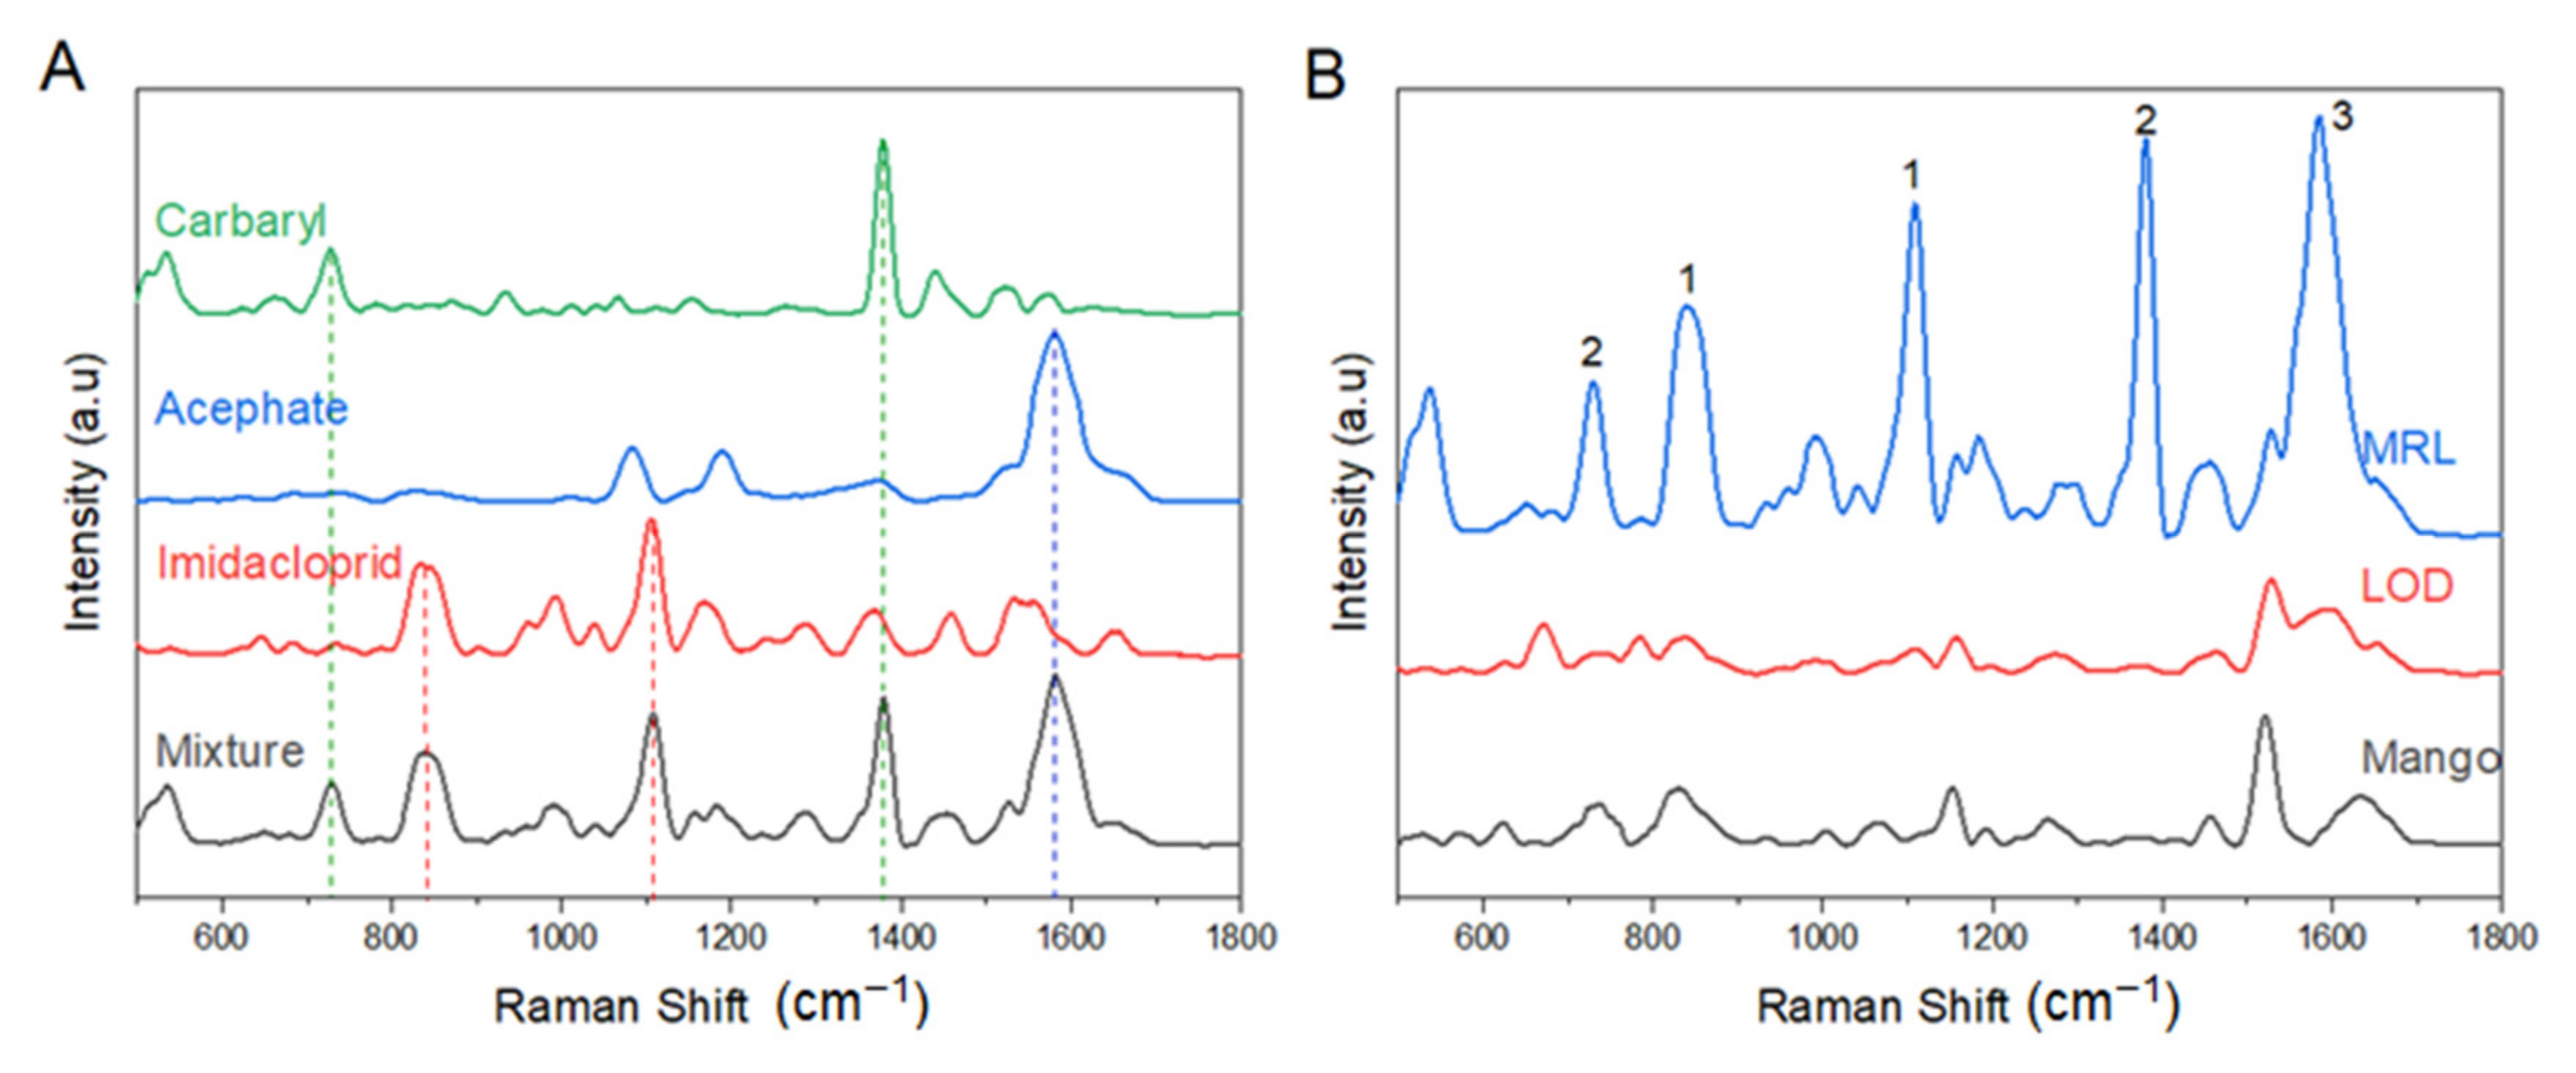
3.4. SERS Analysis of Pesticides in Mango Fruit

To assess the feasibility and practicability of rose petal PDMS/Ag-AgNPs substrate to determine pesticides in mango flesh, SERS measurements of imidacloprid, acephate, and carbaryl in mango samples were performed. In order to reduce the influence of sample matrixes, a modified quick, easy, cheap, effective, rugged, and safe (QuEChERS) sample preparation method was used to extract those pesticides from mango matrixes. The SERS spectra of mango samples and imidacloprid, acephate, and carbaryl in mango flesh extracts are displayed in Figure 5.
As can be seen from Figure 5B, the characteristic peaks of imidacloprid in mango extracts were the same as in standard solutions, and the intensity of imidacloprid was also positively associated with its concentration in the range of 0.01–100.00 mg/kg. The peak value of 1105 cm−1 was clearly visible, whereas the peaks at roughly 800 cm−1, 1365 cm−1, and 1574 cm−1 were displaced, possibly due to the interaction between imidacloprid and the AgNPs. Linear regression at the most substantial SERS peak at 1105 cm−1 was given as y = 0.240x + 4.482 with the R2 coefficient value of 0.976, shown in the inset of Figure 5B. Acephate was observed with two clear peaks, 1083 and 1579 cm−1 (Figure 5C). However, at low pesticide concentrations (10−6, 10−5, and 10−4 mg/kg), the peak at 1083 cm−1 was more difficult to notice than that at 1579 cm−1. As a result, the peak at 1579 cm−1 was chosen to assess the quantitative determination of acephate in the mango fruit. The linear regression at the most significant SERS peak at 1579 cm−1 was also presented as y = 0.196x + 3.906 with the R2 coefficient value of 0.986. The carbaryl characteristic peaks in the mango extract were noticeably comparable to that in the standard solution, and carbaryl intensity was likewise favorably linked to its concentration in the range of 0.0005–0.01 mg/kg. The peak at 1378 cm−1 was apparently observed; however, the peak at 727 cm−1 was not clearly observed at the low concentration of carbaryl solution (0.001 and 0.0005 mg/kg). As illustrated in the inset of Figure 5D, the linear regression at the most significant SERS peak at 1378 cm−1 was provided as y = 0.810x + 4.703 with an R2 coefficient value of 0.977. These results demonstrate the applicability of PDMS/Ag-AgNPs substrate to quantitatively determine the pesticide content of imidacloprid, acephate, and carbaryl in mango fruits.
According to the European Commission, the MRLs of imidacloprid, acephate, and carbaryl in mango are 0.2 mg/kg, 0.01 mg/kg, and 0.01 mg/kg, respectively [39]. Meanwhile, in Vietnam, the MRLs are 0.2 mg/kg for imidacloprid, 0.5 mg/kg for acephate, and 0.3 mg/kg for carbaryl, according to the food hygiene regulation of the Vietnam Ministry of public health (No: 50/2016/TT-BYT) [40]. Hence, the PDMS/Ag-AgNPs substrate could be a promising candidate for the application in imidacloprid, acephate, and carbaryl pesticide detection. The spectra with peaks at 727 cm−1 and 1378 cm−1 clearly belong to carbaryl, whereas the only noticeable peak line at 1579 cm−1 belongs to acephate. The remaining curve, with two distinct peaks at around 823 cm−1 and 1105 cm−1, was assigned for imidacloprid. The SERS spectrum of the mixture of imidacloprid, acephate, and carbaryl at the weight ratio of 20:1:1 in the mango extract was also presented. The unique peaks of each pesticide could be seen on the spectrum, Figure 6A. The peaks were clear and easy to recognize; thereby, it could be concluded that the use of Raman spectroscopy with PDMS/Ag-AgNPs substrate showed very high efficiency for the quantitative analysis of pesticides. Figure 6B shows the simultaneous measurement of three pesticides with limited concentrations in the mixture. Limits of detection were 0.02 mg/kg for imidacloprid, 5 × 10⁻⁵ mg/kg for acephate, and 5 × 10⁻³ mg/kg for carbaryl. The characteristic peak intensities of three pesticides on the mango extract sample were clearly observed. This demonstrated the high efficacy of using PDMS/Ag-AgNPs substrate in SERS measurements, and this method was suitable for determining pesticide residues in mango fruits. Besides, the pesticide residues in the mango fruit were found below the safe threshold.

4. Conclusions

This study successfully formulated a SERS substrate by replicating the rose petal structure combined with the Ag coating layer and AgNPs. The preliminary evaluation of different SERS substrates with the CV reagent showed that PDMS/Ag-AgNPs substrate was the most efficient with an EF of 4.7 × 10⁷. Meanwhile, the limit of detection for imidacloprid, acephate, and carbaryl were measured at their characteristic peaks at 1105 cm−1, 1579 cm−1, and 1378 cm−1, respectively. Furthermore, this method could be used to simultaneously identify three typical insecticides on mango fruits, which were within allowable limits according to the MRLs prescribed in Europe and Vietnam. This study sought to evaluate the adaptability of the new SERS approach for the quantitative analysis of pesticide residues in mango fruits.

Author Contributions

Investigation, U.T.P., Q.H.T.P., L.P.N., P.D.L., T.D.D., H.T.T., C.T.D., T.V.N., D.X.L. and T.N.P.; supervision, T.Q.T. and D.T.N.; writing—original draft, U.T.P. and Q.H.T.P.; writing—review and editing, T.D.L. and D.T.N. All authors have read and agreed to the published version of the manuscript.

Funding

This work was supported financially by the Vietnam Academy of Science and Technology (VAST) under project TĐATTP.04/19-21.

Conflicts of Interest

The authors declare no conflict of interest.

References

  1. Sivakumar, D.; Jiang, Y.; Yahia, E.M. Maintaining mango (Mangifera indica L.) fruit quality during the export chain. Food Res. Int. 2011, 44, 1254–1263. [Google Scholar] [CrossRef]
  2. Ntsoane, M.L.; Zude-Sasse, M.; Mahajan, P.; Sivakumar, D. Quality assesment and postharvest technology of mango: A review of its current status and future perspectives. Sci. Hortic. 2019, 249, 77–85. [Google Scholar] [CrossRef]
  3. Godase, S.K.; Bhole, S.R.; Shivpuje, P.R.; Patil, B.P. Assessment of yield loss in mango (Mangifera indica) due to mango hopper (Idioscopus niveosparsus) (Homoptera: Cicadelidae). Indian J. Agric. Sci. 2004, 74, 370–372. [Google Scholar]
  4. Kapoor, U.; Srivastava, M.; Srivastava, L. Toxicological impact of technical imidacloprid on ovarian morphology, hormones and antioxidant enzymes in female rats. Food Chem. Toxicol. 2011, 49, 3086–3089. [Google Scholar] [CrossRef]
  5. Feng, S.; Kong, Z.; Wang, X.; Peng, P.; Zeng, E.Y. Assessing the genotoxicity of imidacloprid and RH-5849 in human peripheral blood lymphocytes in vitro with comet assay and cytogenetic tests. Ecotoxicol. Environ. Saf. 2005, 61, 239–246. [Google Scholar] [CrossRef]
  6. Brutti, M.; Blasco, C.; Picó, Y. Determination of benzoylurea insecticides in food by pressurized liquid extraction and LC-MS. J. Sep. Sci. 2010, 33, 1–10. [Google Scholar] [CrossRef]
  7. Banerjee, K.; Oulkar, D.P.; Dasgupta, S.; Patil, S.B.; Patil, S.H.; Savant, R.; Adsule, P.G. Validation and uncertainty analysis of a multi-residue method for pesticides in grapes using ethyl acetate extraction and liquid chromatography–tandem mass spectrometry. J. Chromatogr. A 2007, 1173, 98–109. [Google Scholar] [CrossRef]
  8. Stachniuk, A.; Fornal, E. Liquid Chromatography-Mass Spectrometry in the Analysis of Pesticide Residues in Food. Food Anal. Methods 2016, 9, 1654–1665. [Google Scholar] [CrossRef] [Green Version]
  9. Filho, A.M.; dos Santos, F.N.; de Paula Pereira, P.A. Multi-residue analysis of pesticide residues in mangoes using solid-phase microextraction coupled to liquid chromatography and UV–Vis detection. J. Sep. Sci. 2011, 34, 2960–2966. [Google Scholar] [CrossRef] [PubMed]
  10. Kim, K.H.; Chae, S.S.; Jang, S.; Choi, W.J.; Chang, H.; Lee, J.-O.; Lee, T.I. “Atomic Force Masking” Induced Formation of Effective Hot Spots along Grain Boundaries of Metal Thin Films. ACS Appl. Mater. Interfaces 2016, 8, 32094–32101. [Google Scholar] [CrossRef] [PubMed]
  11. Yaseen, T.; Sun, D.-W.; Cheng, J.-H. Raman imaging for food quality and safety evaluation: Fundamentals and applications. Trends Food Sci. Technol. 2017, 62, 177–189. [Google Scholar] [CrossRef]
  12. Morey, R.; Ermolenkov, A.; Payne, W.Z.; Scheuring, D.C.; Koym, J.W.; Vales, M.I.; Kurouski, D. Non-invasive identification of potato varieties and prediction of the origin of tuber cultivation using spatially offset Raman spectroscopy. Anal. Bioanal. Chem. 2020, 412, 4585–4594. [Google Scholar] [CrossRef]
  13. Zhang, D.; Pu, H.; Huang, L.; Sun, D.-W. Advances in flexible surface-enhanced Raman scattering (SERS) substrates for nondestructive food detection: Fundamentals and recent applications. Trends Food Sci. Technol. 2021, 109, 690–701. [Google Scholar] [CrossRef]
  14. Zhai, C.; Peng, Y.; Li, Y.; Chao, K. Extraction and identification of mixed pesticides’ Raman signal and establishment of their prediction models. J. Raman Spectrosc. 2017, 48, 494–500. [Google Scholar] [CrossRef]
  15. Wang, K.; Sun, D.-W.; Pu, H.; Wei, Q. Surface-enhanced Raman scattering of core-shell Au@Ag nanoparticles aggregates for rapid detection of difenoconazole in grapes. Talanta 2019, 191, 449–456. [Google Scholar] [CrossRef]
  16. Shi, G.; Wang, M.; Zhu, Y.; Wang, Y.; Xu, H. A novel natural SERS system for crystal violet detection based on graphene oxide wrapped Ag micro-islands substrate fabricated from Lotus leaf as a template. Appl. Surf. Sci. 2018, 459, 802–811. [Google Scholar] [CrossRef]
  17. Xi, J.; Jiang, L. Biomimic Superhydrophobic Surface with High Adhesive Forces. Ind. Eng. Chem. Res. 2008, 47, 6354–6357. [Google Scholar] [CrossRef]
  18. Wang, H.; Liang, Y.; Cheng, S.; Li, B.; Li, A.; Du, G.; Hu, W. Bio-inspired nanostructures for enhanced light management. J. Vac. Sci. Technol. B Nanotechnol. Microelectron. Mater. Process. Meas. Phenom. 2017, 35, 06GJ02. [Google Scholar] [CrossRef]
  19. Kumar, P.; Khosla, R.; Soni, M.; Deva, D.; Sharma, S.K. A highly sensitive, flexible SERS sensor for malachite green detection based on Ag decorated microstructured PDMS substrate fabricated from Taro leaf as template. Sens. Actuators B Chem. 2017, 246, 477–486. [Google Scholar] [CrossRef]
  20. Wang, M.; Shi, G.; Zhu, J.; Zhu, Y.; Sun, X.; Wang, P.; Jiao, T.; Li, R. Preparation of a Novel SERS Platform Based on Mantis Wing with High-Density and Multi-Level “Hot Spots”. Nanomaterials 2019, 9, 672. [Google Scholar] [CrossRef] [Green Version]
  21. Mu, Z.; Zhao, X.; Xie, Z.; Zhao, Y.; Zhong, Q.; Bo, L.; Gu, Z. In situ synthesis of gold nanoparticles (AuNPs) in butterfly wings for surface enhanced Raman spectroscopy (SERS). J. Mater. Chem. B 2013, 1, 1607–1613. [Google Scholar] [CrossRef] [PubMed]
  22. Lin, Y.-T.; Ting, Y.-S.; Chen, B.-Y.; Cheng, Y.-W.; Liu, T.-Y. Bionic shark skin replica and zwitterionic polymer brushes functionalized PDMS membrane for anti-fouling and wound dressing applications. Surf. Coat. Technol. 2020, 391, 125663. [Google Scholar] [CrossRef]
  23. Pencheva, D.; Bryaskova, R.; Kantardjiev, T. Polyvinyl alcohol/silver nanoparticles (PVA/AgNps) as a model for testing the biological activity of hybrid materials with included silver nanoparticles. Mater. Sci. Eng. C 2012, 32, 2048–2051. [Google Scholar] [CrossRef] [PubMed]
  24. Feng, L.; Zhang, Y.; Xi, J.; Zhu, Y.; Wang, N.; Xia, A.F.; Jiang, L. Petal Effect: A Superhydrophobic State with High Adhesive Force. Langmuir 2008, 24, 4114–4119. [Google Scholar] [CrossRef]
  25. Wang, Y.; Guo, Z.; Liu, W. Adhesion behaviors on four special wettable surfaces: Natural sources, mechanisms, fabrications and applications. Soft Matter 2021, 17, 4895–4928. [Google Scholar] [CrossRef]
  26. Xiao, G.; He, Y.; Liu, S.; Yi, H.; Du, L. Laser processing of micro/nano biomimetic structures. Micro Nano Lett. 2021, 16, 327–335. [Google Scholar] [CrossRef]
  27. Lee, C.; Robertson, C.S.; Nguyen, A.H.; Kahraman, M.; Wachsmann-Hogiu, S. Thickness of a metallic film, in addition to its roughness, plays a significant role in SERS activity. Sci. Rep. 2015, 5, 11644. [Google Scholar] [CrossRef] [Green Version]
  28. Arifin, E.; Lee, J.-K. The Distance-Dependent Fluorescence Enhancement Phenomena in Uniform Size Ag@SiO2@SiO2(dye) Nanocomposites. Bull. Korean Chem. Soc. 2013, 34, 539–544. [Google Scholar] [CrossRef] [Green Version]
  29. Mao, A.; Jin, X.; Gu, X.; Wei, X.; Yang, G. Rapid, green synthesis and surface-enhanced Raman scattering effect of single-crystal silver nanocubes. J. Mol. Struct. 2012, 1021, 158–161. [Google Scholar] [CrossRef]
  30. Stiles, P.L.; Dieringer, J.A.; Shah, N.C.; Van Duyne, R.P. Surface-enhanced Raman spectroscopy. Annu. Rev. Anal. Chem. 2008, 1, 601–626. [Google Scholar] [CrossRef] [Green Version]
  31. Herrera, G.M.; Padilla, A.C.; Hernandez-Rivera, S.P. Surface enhanced Raman scattering (SERS) studies of gold and silver nanoparticles prepared by laser ablation. Nanomaterials 2013, 3, 158–172. [Google Scholar] [CrossRef]
  32. Wei, W.; Huang, Q. Rapid fabrication of silver nanoparticle-coated filter paper as SERS substrate for low-abundance molecules detection. Spectrochim. Acta Part A Mol. Biomol. Spectrosc. 2017, 179, 211–215. [Google Scholar] [CrossRef]
  33. Cao, Q.; Wang, X.; Cui, Q.; Yang, Y.; Li, L. Synthesis and application of bifunctional gold/gelatin nanocomposites with enhanced fluorescence and Raman scattering. Colloids Surf. A Physicochem. Eng. Asp. 2017, 514, 117–125. [Google Scholar] [CrossRef]
  34. Cyrankiewicz, M.; Wybranowski, T.; Kruszewski, S. Silver Nanoparticles as Enhancing Substrates for Raman and Fluorescence Spectroscopy. Acta Phys. Pol. A 2014, 125, A-11–A-15. [Google Scholar] [CrossRef]
  35. Le Ru, E.C.; Blackie, E.; Meyer, M.; Etchegoin, P.G. Surface enhanced Raman scattering enhancement factors: A comprehensive study. J. Phys. Chem. C 2007, 111, 13794–13803. [Google Scholar] [CrossRef]
  36. Meng, W.; Hu, F.; Jiang, X.; Lu, L. Preparation of silver colloids with improveduniformity and stable surface-enhanced Ramanscattering. Nanoscale Res. Lett. 2015, 10, 34. [Google Scholar]
  37. Harraz, F.A.; Ismail, A.A.; Bouzid, H.; Al-Sayari, S.A.; Al-Hajry, A.; Al-Assiri, M.S. Surface-enhanced Raman scattering (SERS)-active substrates from silver plated-porous silicon for detection of crystal violet. Appl. Surf. Sci. 2015, 331, 241–247. [Google Scholar] [CrossRef]
  38. Zhao, X.; Li, C.; Li, Z.; Yu, J.; Pan, J.; Si, H.; Yang, C.; Jiang, S.; Zhang, C.; Man, B. In-situ electrospun aligned and maize-like AgNPs/PVA@ Ag nanofibers for surface-enhanced Raman scattering on arbitrary surface. Nanophotonics 2019, 8, 1719–1729. [Google Scholar] [CrossRef]
  39. European Food Safety Authority. The 2014 European Union report on pesticide residues in food. EFSA J. 2016, 14, e04611. [Google Scholar] [CrossRef]
  40. Dries, M.A. Vietnam MOH Revises MRLs for Pesticides in Foods; USDA Foreign Agricultural Service: Washington, DC, USA, 2017; pp. 1–4.
Figure 2. Characterization of PDMS/Ag substrate. (A) Image of water droplet on a rose petal, (B) SEM image of the rose petal surface, (C) SEM image of the rose petal PDMS replica microstructure covered with the Ag layer at the 50 µm scale, (D) SEM image of the rose petal PDMS replica microstructure covered with the Ag layer at the 5 µm scale, (E) SEM image of AgNPs with the inset of size distribution, (F) absorption spectrum of AgNPs.
Processes 10 00442 g002
Figure 3. SERS spectra of crystal violet. (A) SERS spectra of CV on the rose petal PDMS replica (PDMS), CV on the rose petal PDMS replica covered with a silver thin film (PDMS/Ag), CV mixed with AgNPs only (AgNPs), and CV mixed with AgNPs on the PDMS/Ag (PDMS/Ag-AgNPs); (B) SERS spectra of CV at different diluted concentrations from 10−5 to 10−10 M; (C) plots of Raman intensities of CV at 803 cm−1 and 910 cm−1 versus different concentrations; (D) SERS spectra of CV at the concentration of 10−5 mol/L absorbed on the rose petal PDMS/Ag-AgNPs collected from 20 positions from the substrate and the relative standard deviation (RSD) value of the major peak at 910 cm−1 of CV spectrum from 20 measurements (inset); (E) SERS spectra of CV at the concentration of 10−5 mol/L absorbed on the rose petal PDMS/Ag-AgNPs collected from 10 measurements of different substrates; (F) RSD value of the peak at 910 cm−1 of CV spectrum from 10 measurements of different substrates with average (red line).
Processes 10 00442 g003
Figure 4. SERS spectra of three pesticides. (A) Raman spectra of imidacloprid, acephate, and carbaryl in the powder form; (B1) SERS spectra of imidacloprid solution at different concentrations; and (B2) corresponding SERS intensity of imidacloprid solution at 1105 cm−1. (C1) SERS spectra of acephate solution at different concentrations and (C2) corresponding SERS intensity of acephate solution at 1081 cm−1 and 1584 cm−1. (D1) SERS spectra of carbaryl solution at different concentrations and (D2) corresponding SERS intensity of carbaryl solution at 728 cm−1 and 1379 cm−1.
Processes 10 00442 g004
Figure 5. SERS spectra of three pesticides in mango. (A) Raman spectrum of mango; (B) SERS spectra of imidacloprid at different concentrations in mango samples; and (inset) corresponding SERS intensity of imidacloprid solution at 1105 cm−1. (C) SERS spectra of acephate at different concentrations in mango samples and (inset) corresponding SERS intensity of acephate solution at 1081 cm−1 and 1584 cm−1; (D) SERS spectra of carbaryl at different concentrations in mango samples and (inset) corresponding SERS intensity of carbaryl solution at 728 cm−1 and 1379 cm−1.
Processes 10 00442 g005
Figure 6. The mixture of three pesticides in mango. (A) SERS spectra of each pesticide and the mixture of three pesticides in the mango extract. (B) SERS spectrum of 3 pesticides on the mango extract and SERS spectra of three pesticides at the limited concentration according to the maximum residue level (MRL) and the limit of detection (LOD).
Processes 10 00442 g006
Table 1. Comparison of SERS performance for various substrates toward the detection of CV.
SERS SubstrateEnhancement Factor (EF)References
Rose petal replica from PDMS/Ag-AgNPs substrate4.7 × 107This work
Mixing with silver colloid9.5 × 103[36]
AgNPs-meso-PSi hybrid structures1.3 × 106[37]
Graphene oxide (GO) on the Ag micro-islands substrate using micro/nanostructured Lotus leaf (L.l.) as a template1.52 × 106[16]
Table 2. Assignments of vibrational bands of three pesticides: imidacloprid, acephate, and carbaryl.
Chemical CompoundsNR Raman Bands (cm−1)SERS Bands (cm−1)Band Assignment
Imidacloprid660661C-Cl stretching
830829C-C-C symmetric stretching
989993C-N stretching
11101105C-C-C bending
13511374C-N stretching
15801564C-N asym
Acephate400404P pyramidalization mode
565544P-S-C stretching
710678P-O-C stretching
871883P-O-C stretching
1081
12231227P=O stretching
16921584ketone
Carbaryl453453C-C bending
534-C-C bending
723728N-C-O-C bending
13741379symmetric ring vibration
14321435C-H wagging
15761575(C=C) phenyl stretch
Publisher’s Note: MDPI stays neutral with regard to jurisdictional claims in published maps and institutional affiliations.

