Abstract
In this work, the emulsification of oil-in-water two-phase systems with three emulsifiers (PEG1500, 6000 and 20000) was studied in a batch macro system and in a continuously operated microfluidic system. The effect of emulsifier concentration, oil concentration and mixing rate on zeta potential and average Feret diameter was analyzed for the macro-batch system, while the effect of emulsifier concentration, oil concentration and total flow rate on zeta potential and average Feret diameter was analyzed for the microfluidic system. The emulsions prepared in batch system were more stable, had smaller droplet diameter but higher values of polydispersity index (PDI) compared to those prepared by continuous method. In both cases, batch and continuous, the use of PEG with higher molecular weight resulted in emulsions with lower zeta potential values. In batch emulsification, all three optimization parameters (emulsifier concentration, oil concentration and mixing rate) had a significant influence on the average Feret diameter and zeta potential (depending on the PEG, used for emulsification), while the emulsifier concentration had the most significant influence on the zeta potential and average Feret diameter of emulsions prepared in the continuous microsystem process.
1. Introduction
Emulsions are considered as one of the most popular encapsulation and delivery systems for a variety of lipophilic, hydrophilic, and amphiphilic bioactive molecules due to their high encapsulation efficiency, preservation of chemical stability of the encapsulated molecules, and controlled release [1]. Emulsion technology has found its application in various types of industries ranging from textile, cosmetics, chemical, food and many more. It is also widely used for the encapsulation of bioactives in aqueous solutions, which can either be used directly in the liquid state or dried into powders [2]. The emulsification process must ensure the formation of stable emulsions with controllable microscale particle size, morphology and composition [3,4]. During the emulsification process, formation and dispersion of droplets is achieved by intensive mixing or mechanical disintegration, usually using high shear mixers or homogenizers. Batch emulsification processes are highly dependent on batch volume and processing time, with lower batch volume and longer processing times resulting in smaller droplets [5]. Due to non-uniformed stresses across the batch system, emulsions formed in this way usually consist of droplets that are highly polydispersed in size [6]. To reduce or eliminate the aforementioned drawbacks of the conventional emulsification process, microfluidic technology can be used. By reducing the size of the apparatus by several orders of magnitude (to dimensions in the micrometer range), significant economic advantages and a reduction in environmental impact can be achieved [7,8]. According to Dobhal, Kulkarni & Dandekar [9], microreactors have the ability to mix reagents rapidly (high continuous variations in reaction conditions and support addition of reagents at precise time intervals during the course of the reaction), which makes them an attractive technology for various applications. Also, the small size of microreactors reduces transport limitations (short diffusion paths, as there is a quadratic decrease in diffusion time with the decrease in linear system dimension), which leads to an opportunity to improve selectivity and yields of the desired product [10,11,12]. The production of microdroplets using microfluidics is based on a spontaneous process in which viscous stresses occur as a result of interfacial flow at the boundary of two liquid phases [13,14]. Microfluidic technology offers the possibility to control shear stress compared to batch emulsification where shear stress cannot be controlled. The flow characteristics in microchannels allow the applicability of high shear forces to the moving fluid. The shear forces act on a small volume of liquid (volume of a few nanoliters), which allows the size of the droplets to be precisely controlled. Moreover, the surface tension is dominant in the microchannels, which allows the continuous generation of numerous droplets with identical diameter [15].
There is literature data which describes microfluidic emulsification processes [16] and compares batch and continuous emulsification using ultrasound [5]. To the best of our knowledge, there is no work that directly compares oil-in-water emulsion formation in high shear batch and continuous microfluidic processes. Therefore, this work is focused on the optimization and comparison of the two processes. Two types of systems were used: (i) mixing under high shear as a representative of macro-batch process and (ii) the microfluidic system as a representative of micro-scale continuous system. Optimization in both types of systems was performed using edible oil and water and three types of polyethylene glycol as emulsifiers (PEG1500, 6000 and 20000). The effect of emulsifier concentration, oil concentration and mixing rate on zeta potential and average Feret diameter was analyzed for the macro-batch system while the effect of emulsifier concentration, oil concentration and total flow rate on zeta potential and average Feret diameter was analyzed for the microfluidic system. Effect estimates and desirability profiles were obtained by Response Surface Methodology.
2. Materials and Methods
2.1. Materials
Edible sunflower oil (Zvijezda plus d.o.o., Croatia) was purchased from a local supermarket. Polyethylene glycol with an average molecular weight of 1500 g/mol (PEG1500) and 6000 g/mol (PEG6000) used in the experiments were produced by Acros Organics (Geel, Belgium), while the 20,000 g/mol polyethylene glycol (PEG20000) was supplied by Sigma-Aldrich (Darmstadt, Germany).
2.2. Methods
2.2.1. High Shear Batch Emulsification in a Macro-System
Optimization of oil-in-water emulsion production was carried out using a batch system. The influence of emulsifier concentration (X1), oil concentration (X2) and different mixing rates (X3) on emulsion stability, expressed as zeta potential (Y1), and on average Feret droplet diameter (Y2) was analyzed, according to the Box-Behnken experiment design shown in Table 1.

Table 1.
Experimental plan for emulsion production in a batch system.
The required amount of oil, water and emulsifier was placed in a Falcon tube and the total volume of water and oil in the tube was 10 mL. The oil/water mixture was then mixed using a TH220-PCRH rotor/stator homogenizer (Omni International, Kennesaw, GA, USA) for 4 min at a rate specified in the experimental design (Table 1). After homogenization, the samples were further analyzed microscopically for the average Feret diameter and zeta potential, and their NIR spectra were recorded.
2.2.2. Continuously Operated Emulsification in a Microfluidic System
Optimization of oil-in-water emulsion production was carried out using a microfluidic system. The influence of emulsifier concentration (W1), oil concentration (W2) and total flow rate (W3) on emulsion stability, expressed as zeta potential (Z1), and on average Feret droplet diameter (Z2) was analyzed, according to the Box-Behnken experiment design shown in Table 2.
Table 2.
Experimental plan for the preparation of emulsions in the microfluidic system.
Glass microchips with laser-engraved microchannels were placed in stainless steel holders, which provided a leak-free connection (Micronit Microfluidics B.V., Enschede, The Netherlands). Experiments were performed in microchannels with the following dimensions: width: height: length = 250 μm:150 μm:55.3 mm, which were equipped with static teardrop micromixers. Two syringe pumps (both NE −1000 Syringe Pump types, New Era Pump Systems, Farmingdale, NY, USA) with high-pressure stainless-steel syringes (8 mL, Harvard Apparatus, Holliston, MA, USA) were used for solution delivery. Two phases, oil and water, were introduced separately into microchannels through a fused silica connection (375 μm o.d., 150 μm i.d., Micronit Microfluidics B.V., Enschede, The Netherlands).
2.2.3. Microscopy, Average Feret Diameter and Polydispersity Index (PDI)
Samples of oil-in-water emulsions prepared in batch and continuously operated microfluidic system were photographed under the microscope equipped with a camera (BTC type LCD-35, Bresser, Rhede, Germany) at 4× magnification. The average Feret diameter of the droplets was measured using the software tool ImageJ (v.1.8.0. NIH, Bethesda, MD, USA). The Feret diameter was defined as the perpendicular distance between two tangents located on opposite sides of a particle. Based on the image analysis data, the polydispersity index (PDI) was calculated for all the obtained emulsions [17]:
where σ (μm) represents the standard deviation of the average Feret diameter and d (μm) represents the mean value of the Feret diameter.
2.2.4. Zeta Potential of Oil-in-Water Emulsions
Zeta potential of all oil-in-water emulsions were measured using a dynamic light scattering instrument (Litesizer 500, Anton Paar, Graz, Austria). Dynamic light scattering is based on laser light passing through the sample and detection of scattered light intensity at different angles (15, 90 and 175°). The zeta potential of all the obtained emulsions was analyzed as a measure of the stability of the emulsion. High values of zeta potential (more than 30 mV or less than −30 mV) correlate with higher emulsion stability [18]. Approximately 300 μL of sample was placed in a quartz cuvette and zeta potential measurements were made in triplicate.
2.2.5. Statistical Analysis and Optimization of the Emulsification Process
Descriptive Statistical Analysis
All measurements in this work were performed in triplicates and descriptive statistical analysis (mean values, standard deviations and data distribution normality test) was performed in Statistica v.13.0 software (Tibco Software, Palo Alto, CA, USA).
Optimization of Emulsification by Response Surface Methodology (RSM)
For batch emulsification, the influence of the independent variables (emulsifier concentration (X1), emulsification time (X2) and stirring rate (X3)) on the stability of the emulsion, expressed as zeta potential (Y1) and average Feret droplet diameter (Y2), was analyzed. In addition, the effect of three independent variables (emulsifier concentration (W1), oil concentration (W2) and total flow rate (W3)) on emulsion stability expressed as zeta potential (Z1) and average Feret droplet diameter (Z2) was analyzed for continuously operated microfluidic emulsification. The effect of all parameters was analyzed in three levels (−1, 0, 1), and, according to the Box-Behnken design, 17 experiments were performed randomly (Table 1 and Table 2). Second order polynomial equations were used to fit the experimental data (Equation (2)):
where Y(Z) is the predicted response, β0, βi, and βii are regression coefficients for intercept, linear and quadratic terms and Xi are the independent variables. Response surface modelling was performed using Statistica v.13.0 software (Tibco Software, Palo Alto, CA, USA).
Moreover, optimization was performed for stability of emulsion expressed as zeta potential and for the average Feret droplet diameter based on the desirability profiles obtained from the RSM predicted values. The desirability scale in the range from 0 (undesirable) to 1 (very desirable) was used.
3. Results and Discussion
3.1. Zeta Potential, Average Feret Diameter, Micrographs and the PDI Index
In this work, the batch and continuous emulsification processes were optimized and compared. The experiments were conducted based on the Box-Behnken experimental design and the results for the high shear batch experiment are shown in Table 3.
Table 3.
Mean values of zeta potential and the average Feret diameter (n = 3) of the oil-in-water emulsion droplets prepared in a high shear batch system using three different emulsifiers (PEG1500, PEG6000 and PEG20000). Polydispersity index (PDI) for the given droplet diameter is listed in the brackets.
The zeta potential is defined as the potential difference between the charged surface of the droplets of the dispersed phase and the positively charged ions in the aqueous solution of the emulsifier forming the continuous phase. In batch experiments using PEG1500 as emulsifier, the values of zeta potential ranged from ζ = −49.97 ± 0.50 mV (sample B4) to ζ = −58.97 ± 1.08 mV (samples B1 and B13) and the values of Feret diameter ranged from d = 7.38 ± 0.32 μm (B6) to d = 30.38 ± 11.00 μm (B15) (Table 1). The values of zeta potential indicate that all the emulsions prepared in batch experiments using high shear homogenizer and PEG1500 as emulsifier were stable at given conditions (room temperature). According to Sharma et al. [19], high values of zeta potential (positive or negative) are indicative of higher emulsion stability and the use of zeta potential proved to be a successful method of detecting emulsion stability under conditions of known ionic strength and pH values at which it was determined. Considering the zeta potential values as a function of mixing rate, it can be seen that higher emulsion stability was obtained in the experiments where the maximum mixing rate was not used (e.g., 1, 7, 12–17). Similar results were obtained by Kim, Oh, & Lee [20], who concluded that higher shear rates produce emulsions with smaller droplet size, but droplet coalescence and flocculation occur, which destabilizes the emulsion. Also, according to Kim et al. [20], Toro-Mendoza & Petsev [21] and Urbina-Villalba [22], since the dynamics of small droplets at high shear rate is dominated by Brownian motion, the active Brownian motion of very small emulsion droplets leads to droplet coalescence due to flocculation, which leads to the long-term instability of emulsions produced for the cosmetic industry. It can also be seen that the highest emulsifier concentration does not necessarily lead to the most stable emulsions. Moreover, it is important to emphasize that the effect of a single variable in this experimental design cannot be monitored without taking into account other variables that may affect the process.
The values obtained for PEG6000 ranged from ζ = −39.57 ± 0.60 mV (B7) to ζ = −51.23 ± 1.46 mV (B3) for zeta potential and the values of Feret diameter ranged from d = 13.57 ± 7.59 μm (B5) to d = 27.69 ± 13.33 μm (B12) (Table 1). The values of zeta potential were lower compared to those obtained for emulsions containing PEG1500, while the values of average Feret diameter were in the range of those obtained for PEG1500 emulsions. It can also be seen that the maximum mixing rate used does not necessarily mean the most stable emulsion and that the interactions between the three parameters tested are complex and interdependent and cannot be considered individually. A similar conclusion was also drawn in a study by Wang et al. [23], in which the emulsion stability with PEG as emulsifier is strongly dependent on the oil-water ratio.
For emulsions containing PEG20000, the values of zeta potential ranged from ζ = −23.20 ± 0.36 mV (B5) to ζ = −47.37 ± 0.64 mV (B16), while the Feret diameter ranged from ζ = 10.08 ± 5.79 (B13) to ζ = 25.87 ± 12.45 μm (B1). It can be seen that the differences between experiments are more pronounced: e.g., for experiment B5, the prepared emulsion cannot be considered stable based on its zeta potential value (ζ = −23.20 ± 0.36 mV), which falls out of the range considered stable for the DLS measurement method used (lower than −30 mV and higher than 30 mV). On the other hand, the most stable emulsion produced had a zeta potential value of ζ = −47.37 ± 0.64 mV (B16), which is considered stable and falls within the range of stability values obtained for PEG6000. In the case of PEG20000, the low mixing rate (15,000/min) combined with 4% emulsifier and 25% oil phase proved to be unfavorable for emulsion production.
When comparing all three emulsifiers, it can be seen that the zeta potential values for emulsions containing higher molecular weight PEGs were significantly lower than the values obtained for emulsions containing lower molecular weight PEGs. As previously described, zeta potential provides crucial information about the conditions on the emulsion interface. The negative charge of the prepared emulsion can be explained by adsorption of the HO- ions in water and also by charge form fatty acids and phospholipids form oil used for emulsification. Therefore, the decrease in zeta potential with PEG molecular weight can be explained by masking the particle charge by large PEG molecules. A study by Cheng et al. [24] showed similar results; the zeta potential of PGE1 (prostaglandin E1) nanoemulsion decreased significantly with the increase of molecular weight of PEG in DSPE-PEG (1,2-distearoyl-sn-glycero-3-phosphoethanolamine-N-[methoxy(polyethylene glycol)-2000]), which was explained by the changes of net charge on the surface of droplets. Another study explained the differences in zeta potential by the charge masking effect of PEG, where a higher molecular weight PEG has more functional groups that can mask the charge [25].
The results for the zeta potential and average Feret diameter of the emulsions prepared in the continuously operated microfluidic system are shown in Table 4.
Table 4.
Mean values of zeta potential and the average Feret diameter (n = 3) of the oil-in-water emulsion droplets prepared in continually operated microfluidic system using three different emulsifiers (PEG1500, PEG6000 and PEG20000). Polydispersity index (PDI) for the given droplet diameter is listed in the brackets.
For PEG1500 emulsions prepared in a continuous experiment, zeta potential values ranged from ζ = −17.94 ± 1.39 mV (M13) to ζ = −55.60 ± 2.47 mV (M1) while the Feret diameter ranged from d = 85.40 ± 20.55 μm (M8) to d = 152.08 ± 12.46 μm (M11). From Table 4, it can be concluded that the most stable PEG1500 emulsions were obtained in experiments 1 and 7. The process conditions for experiment 1 were: emulsifier concentration of 2%, oil phase fraction of 30% and total flow rate of 200 μL/min. The zeta potential determined for sample M1 was ζ = −55.60 ± 2.48 mV. Furthermore, experiment 7 was performed with an emulsifier concentration of 2%, an oil phase fraction of 35%, and a total flow rate of 300 μL/min, and the resulting zeta potential for the preparation was ζ = −55.79 ± 3.04 mV. The most stable PEG6000 emulsion was also prepared at the experimental conditions no. 7 (ζ = −35.73 ±1.85 mV). For the PEG6000 emulsions, the zeta potential values ranged from ζ = −15.84 ± 1.42 mV (M4) to ζ = −35.73 ± 1.85 mV (M7), while the average Feret diameter values ranged from d = 82.57 ± 16.49 μm (M15) to d = 158.13 ± 4.58 μm (M6). When PEG20000 was used as emulsifier, the most stable emulsion was obtained in experiment 3 (emulsifier concentration of 2%, oil phase fraction 30% and total flow rate of 400 μL/min). For the PEG20000 emulsions, the zeta potential values ranged from ζ = −8.42 ± 0.54 mV (M8) to ζ = −27.74 ± 1.90 mV (M3), while the average Feret diameter ranged from d = 108.53 ± 8.53 μm (M17) to d = 144.40 ± 5.58 μm (M8). From the results in Table 4, it can be concluded that the use of higher molecular weight emulsifiers leads to lower values of zeta potential, which is the same effect found in the batch experiments. In direct comparison of batch and continuous experiments, it can be seen that the batch experiments resulted in emulsions with better stability and with droplets with smaller average Feret diameter. As mentioned earlier, smaller droplet diameters can be obtained in batch processes, but the resulting emulsions are often polydisperse [6]. In the case of the microfluidic process, droplet size and shape can be controlled with greater accuracy because the shear forces act on a small volume of fluid [15]. In this study, the PDI of the emulsions prepared in a high shear batch system ranged from a minimum of 0.049 (sample B7, PEG20000) to a maximum of 0.970 (sample B1, PEG1500) (Table 3), while the PDI values for the continuous system ranged from a minimum of 0.0004 (sample M8, PEG6000) to a maximum of 0.1047 (sample M9, PEG1500) (Table 4), which is consistent with the literature data. This was also confirmed by the microscope images of the emulsions shown in Figure 1.
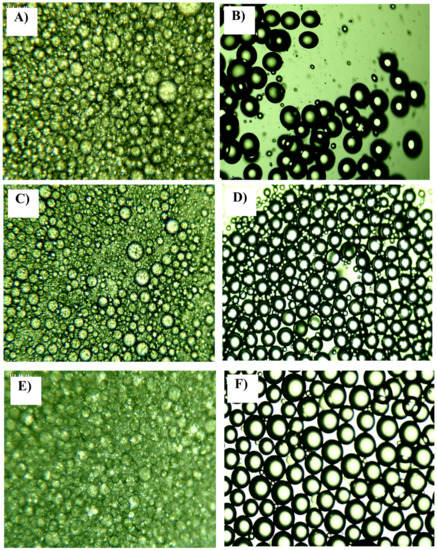
Figure 1.
Example of the microscopic images of emulsions: (A) batch PEG1500; (B) continuous microfluidic PEG1500; (C) batch PEG6000; (D) continuous microfluidic PEG6000; (E) batch PEG20000; (F) continuous microfluidic PEG20000. Al microscope images shown are from experiments which represent central points in experimental design: 4% emulsifier, 30% oil phase and mixing rate of 25,000 min−1 for batch experiments; and 4% emulsifier, 30% oil phase and a total flow rate of 200 μL/min for the continuous experiments.
In Figure 1, it can be seen that the batch experiments for all the PEGs used (Figure 1A,C,E) resulted in emulsions in which the presence of very small and large droplets is visible and droplets that do not have a regular circular shape are present. In the case of the continuous experiment, the resulting emulsions contained larger spherical particles with similar diameters, with very few small droplets (Figure 1B,D,F).
3.2. RSM Models
To identify variables with a significant effect on the response variables (zeta potential and average Feret diameter), a second-order polynomial model was used to describe the experimental data. The regression coefficients of the developed models for each response analyzed (zeta potential and average Feret diameter) and for each analyzed PEG in both emulsification systems (macro-batch and micro-continuum) are presented in Table 5.
Table 5.
RSM models for description of zeta potential (1st row of a given emulsifier) and average Feret diameter of droplets (2nd row of a given emulsifier). For batch experiments X1 stands with emulsifier concentration, X2 for oil concentration and X3 for mixing rate. In microfluidic experiments W1 stands with emulsifier concentration, W2 with oil concentration and W3 with total flow rate. Significant coefficients of the RSM model are shown in bold.
In the batch experiments (Table 5) with PEG1500 as emulsifier, a significant influence of oil concentration on both zeta potential and average Feret droplet diameter was found in the linear and quadratic coefficients of the RSM model. A significant influence of mixing rate on average Feret diameter can also be seen from the quadratic regression coefficient of the RSM model. However, it must be emphasized that the R2 values for the PEG1500 RSM models were rather low (R2 for zeta = 0.5557 and R2 for Feret = 0.4817), indicating that these models can only be used for qualitative prediction of the influence of the input variables on the responses. For PEG6000, emulsifier and oil concentration had a significant effect on zeta potential in both linear and quadratic forms, while the average Feret diameter was dependent on oil content and mixing rate for both linear and quadratic terms. For PEG6000, R2 values were higher compared to PEG1500 (R2 for zeta = 0.6110 and R2 for Feret = 0.6220). For PEG20000, all tested inputs had a significant effect on zeta potential, while mixing rate and emulsifier concentration had a significant effect on average Feret diameter values. According to previously published data for batch emulsification, emulsion stability is strongly dependent on oil concentration [23], shear rate, mixing rate, and duration of mixing [20].
In continuous experiments (Table 5), emulsifier concentration had a positive significant influence on zeta potential for emulsions with PEG1500 and PEG20000. A significant positive influence of emulsifier concentration in a quadratic member on zeta potential for PEG1500 and PEG6000 emulsions is also seen in the RSM model. A significant positive influence of emulsifier concentration on zeta potential and average Feret diameter for PEG1500; as well as on the zeta potential of PEG6000 emulsions was also evident. The best agreement between the model predicted and experimental values was detected for the zeta potential for the emulsion containing PEG1500 (R2 = 0.9846) and the lowest for the average Feret diameter of the PEG20000 emulsion (R2 = 0.4461). The developed RSM models for the continuous experiments can be considered acceptable for describing the influence of emulsifier concentration, oil concentration and total flow rate on the zeta potential, while their applicability for the prediction of average Feret diameter is not recommended. Importance of analyzed process variables was also previously reported by Khalid et al. [26] for microchannel emulsification encapsulating quercetin, by Manickam, Sivakumar, & Pang [27] for generation of oil-in-water emulsions by coupling ultrasound and microchannel technology and by Nehme et al. [28] in microchannels high throughput production of emulsions that would be used in cosmetics, nutraceutics and pharmaceutics.
3.3. Process Optimization
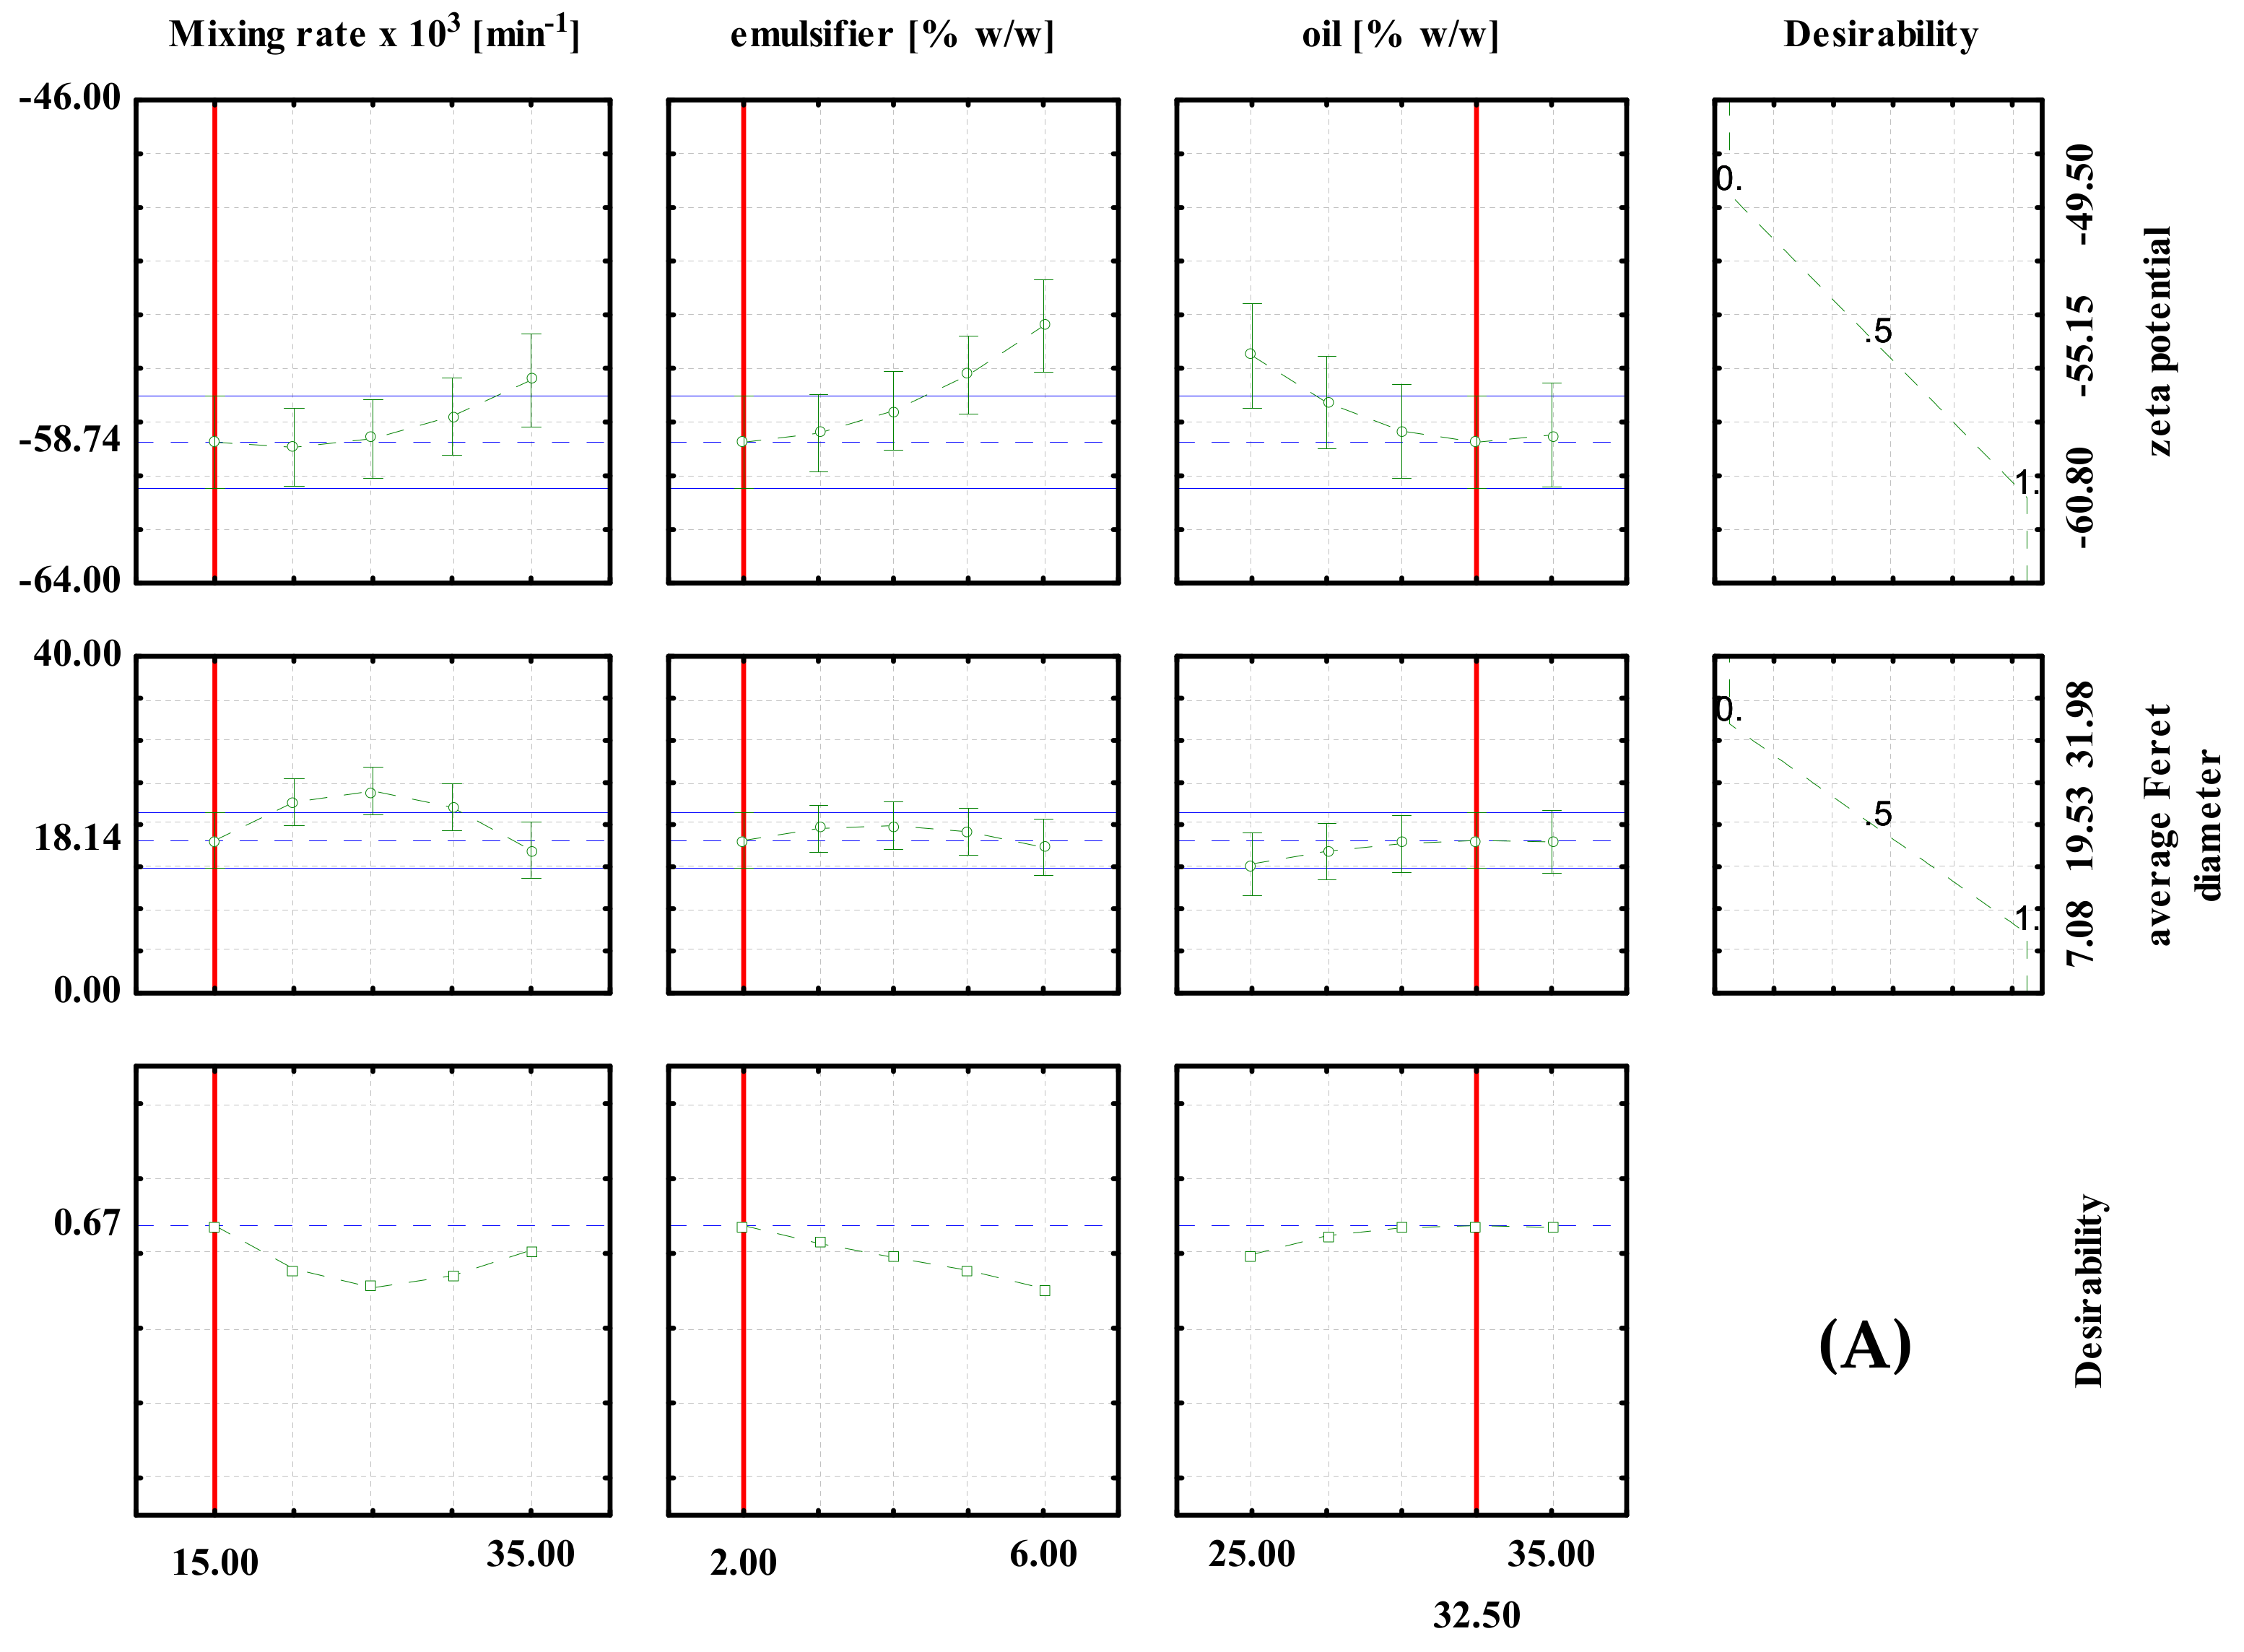
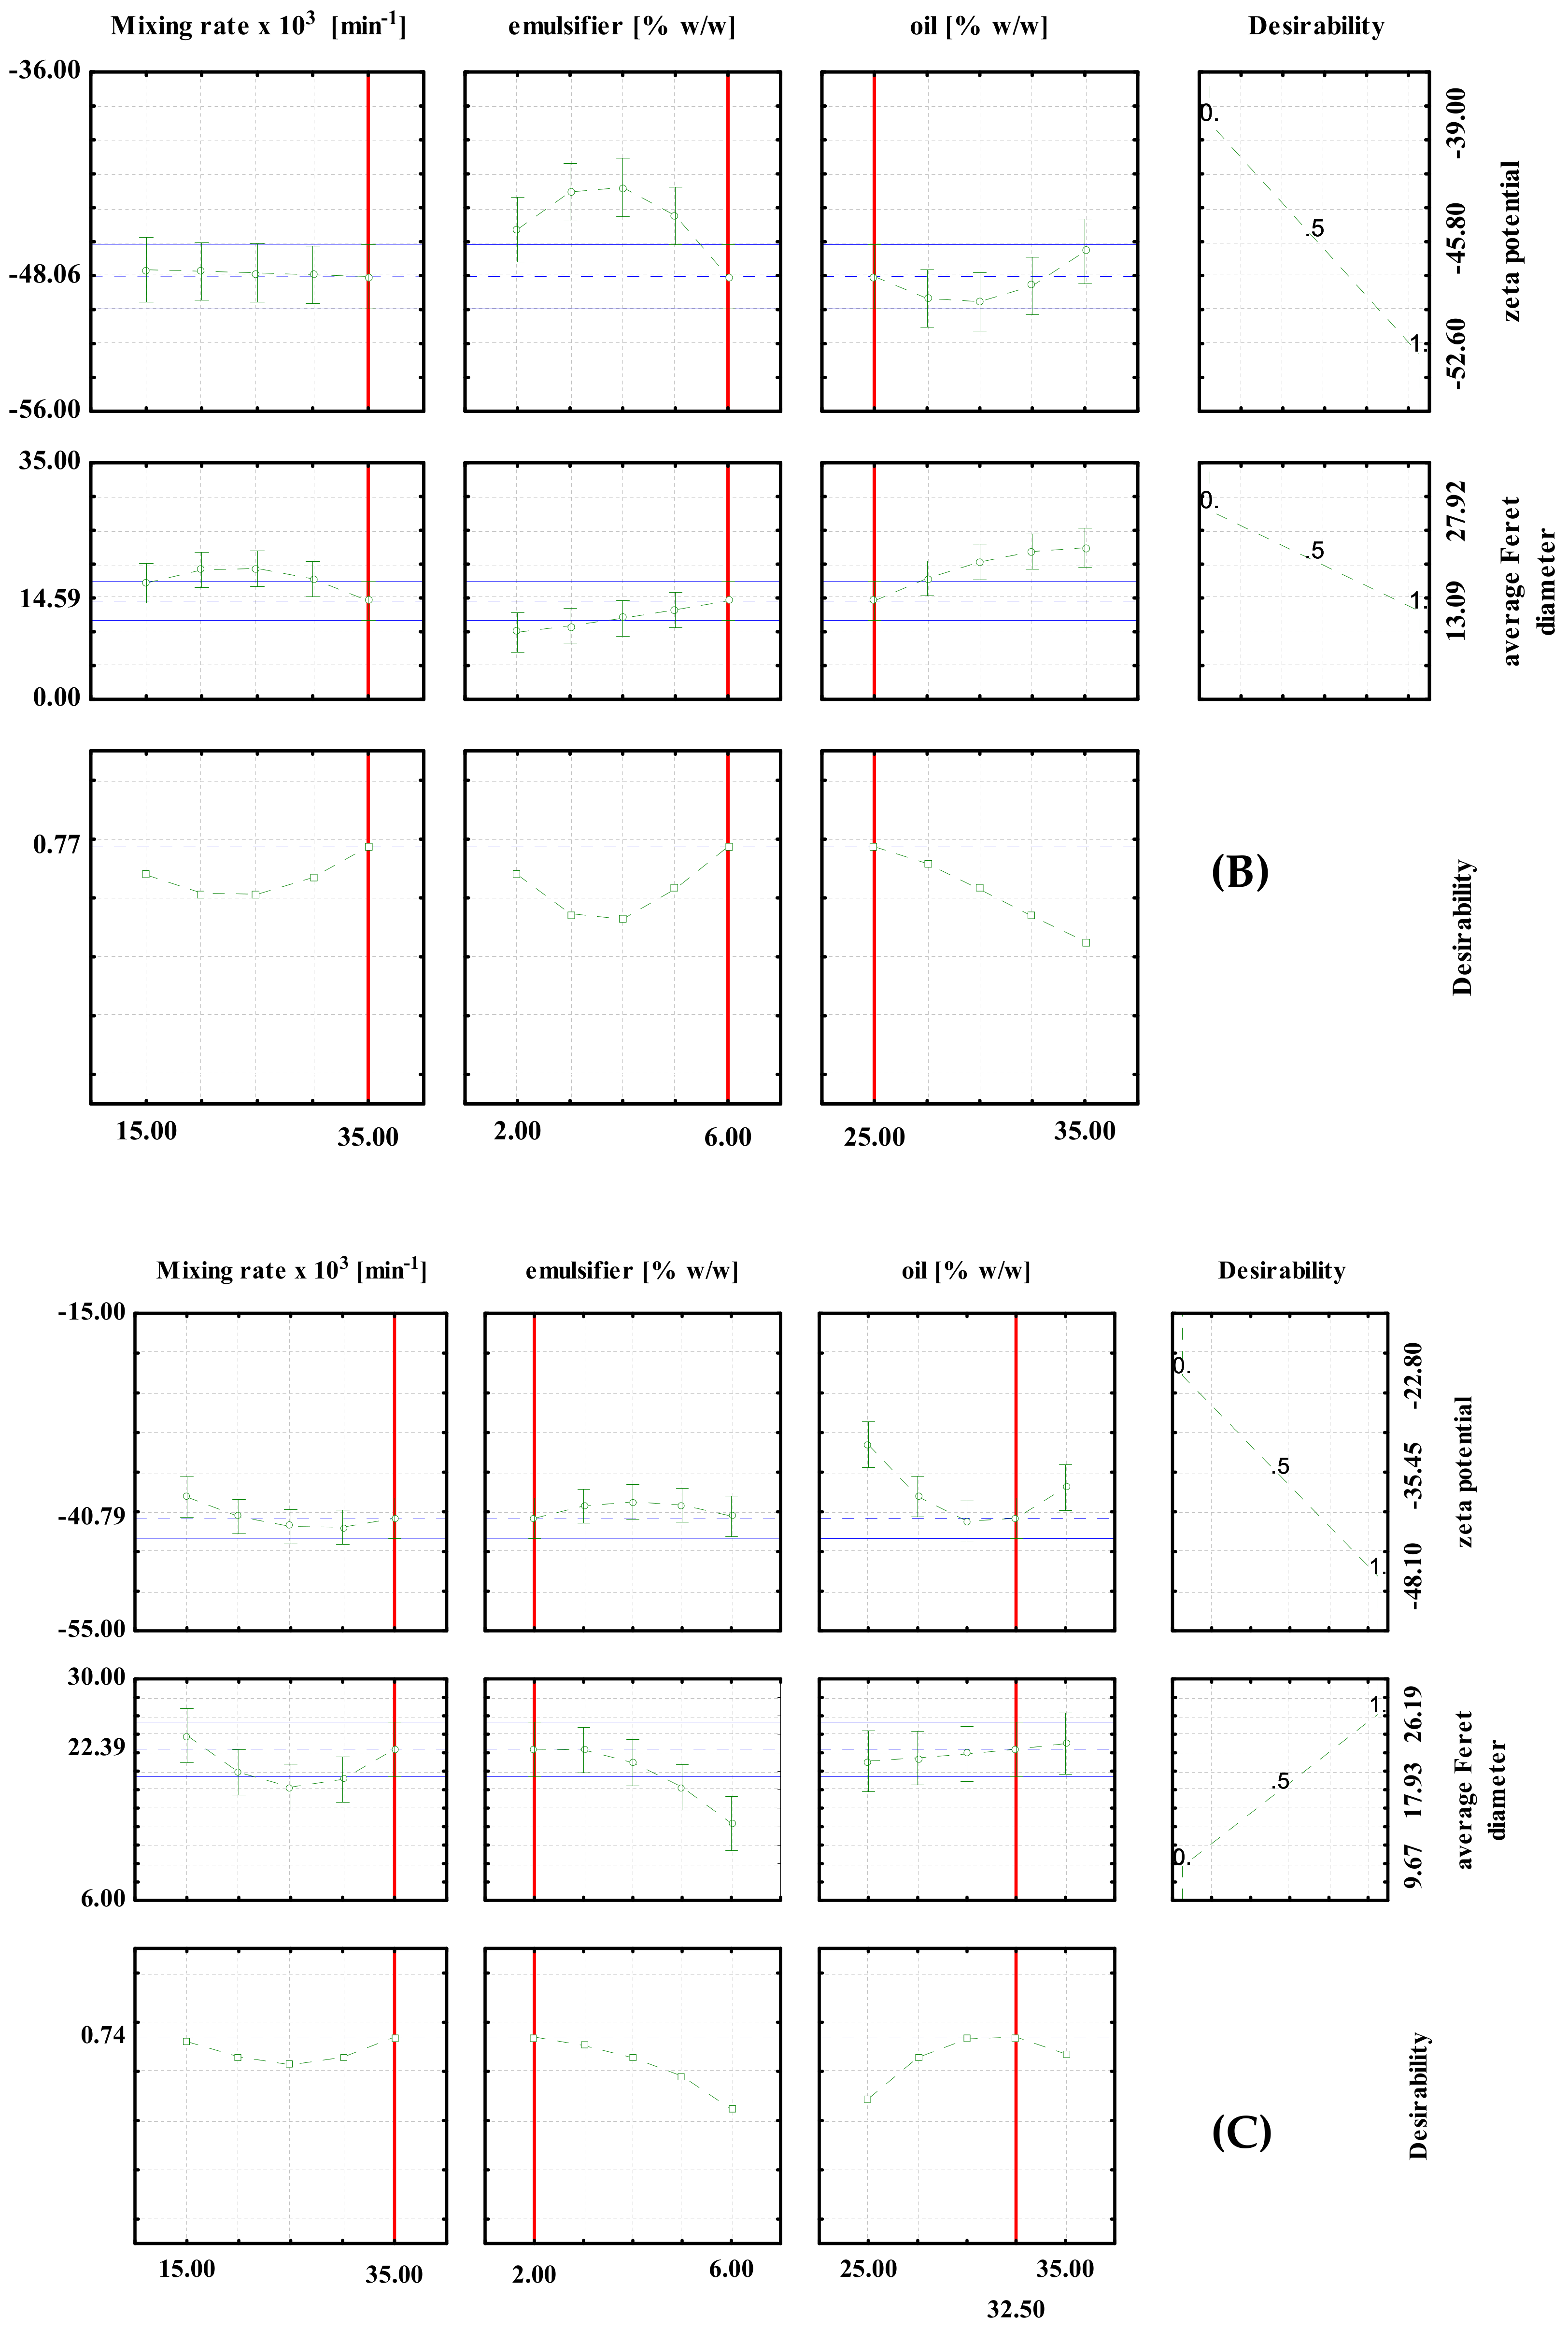
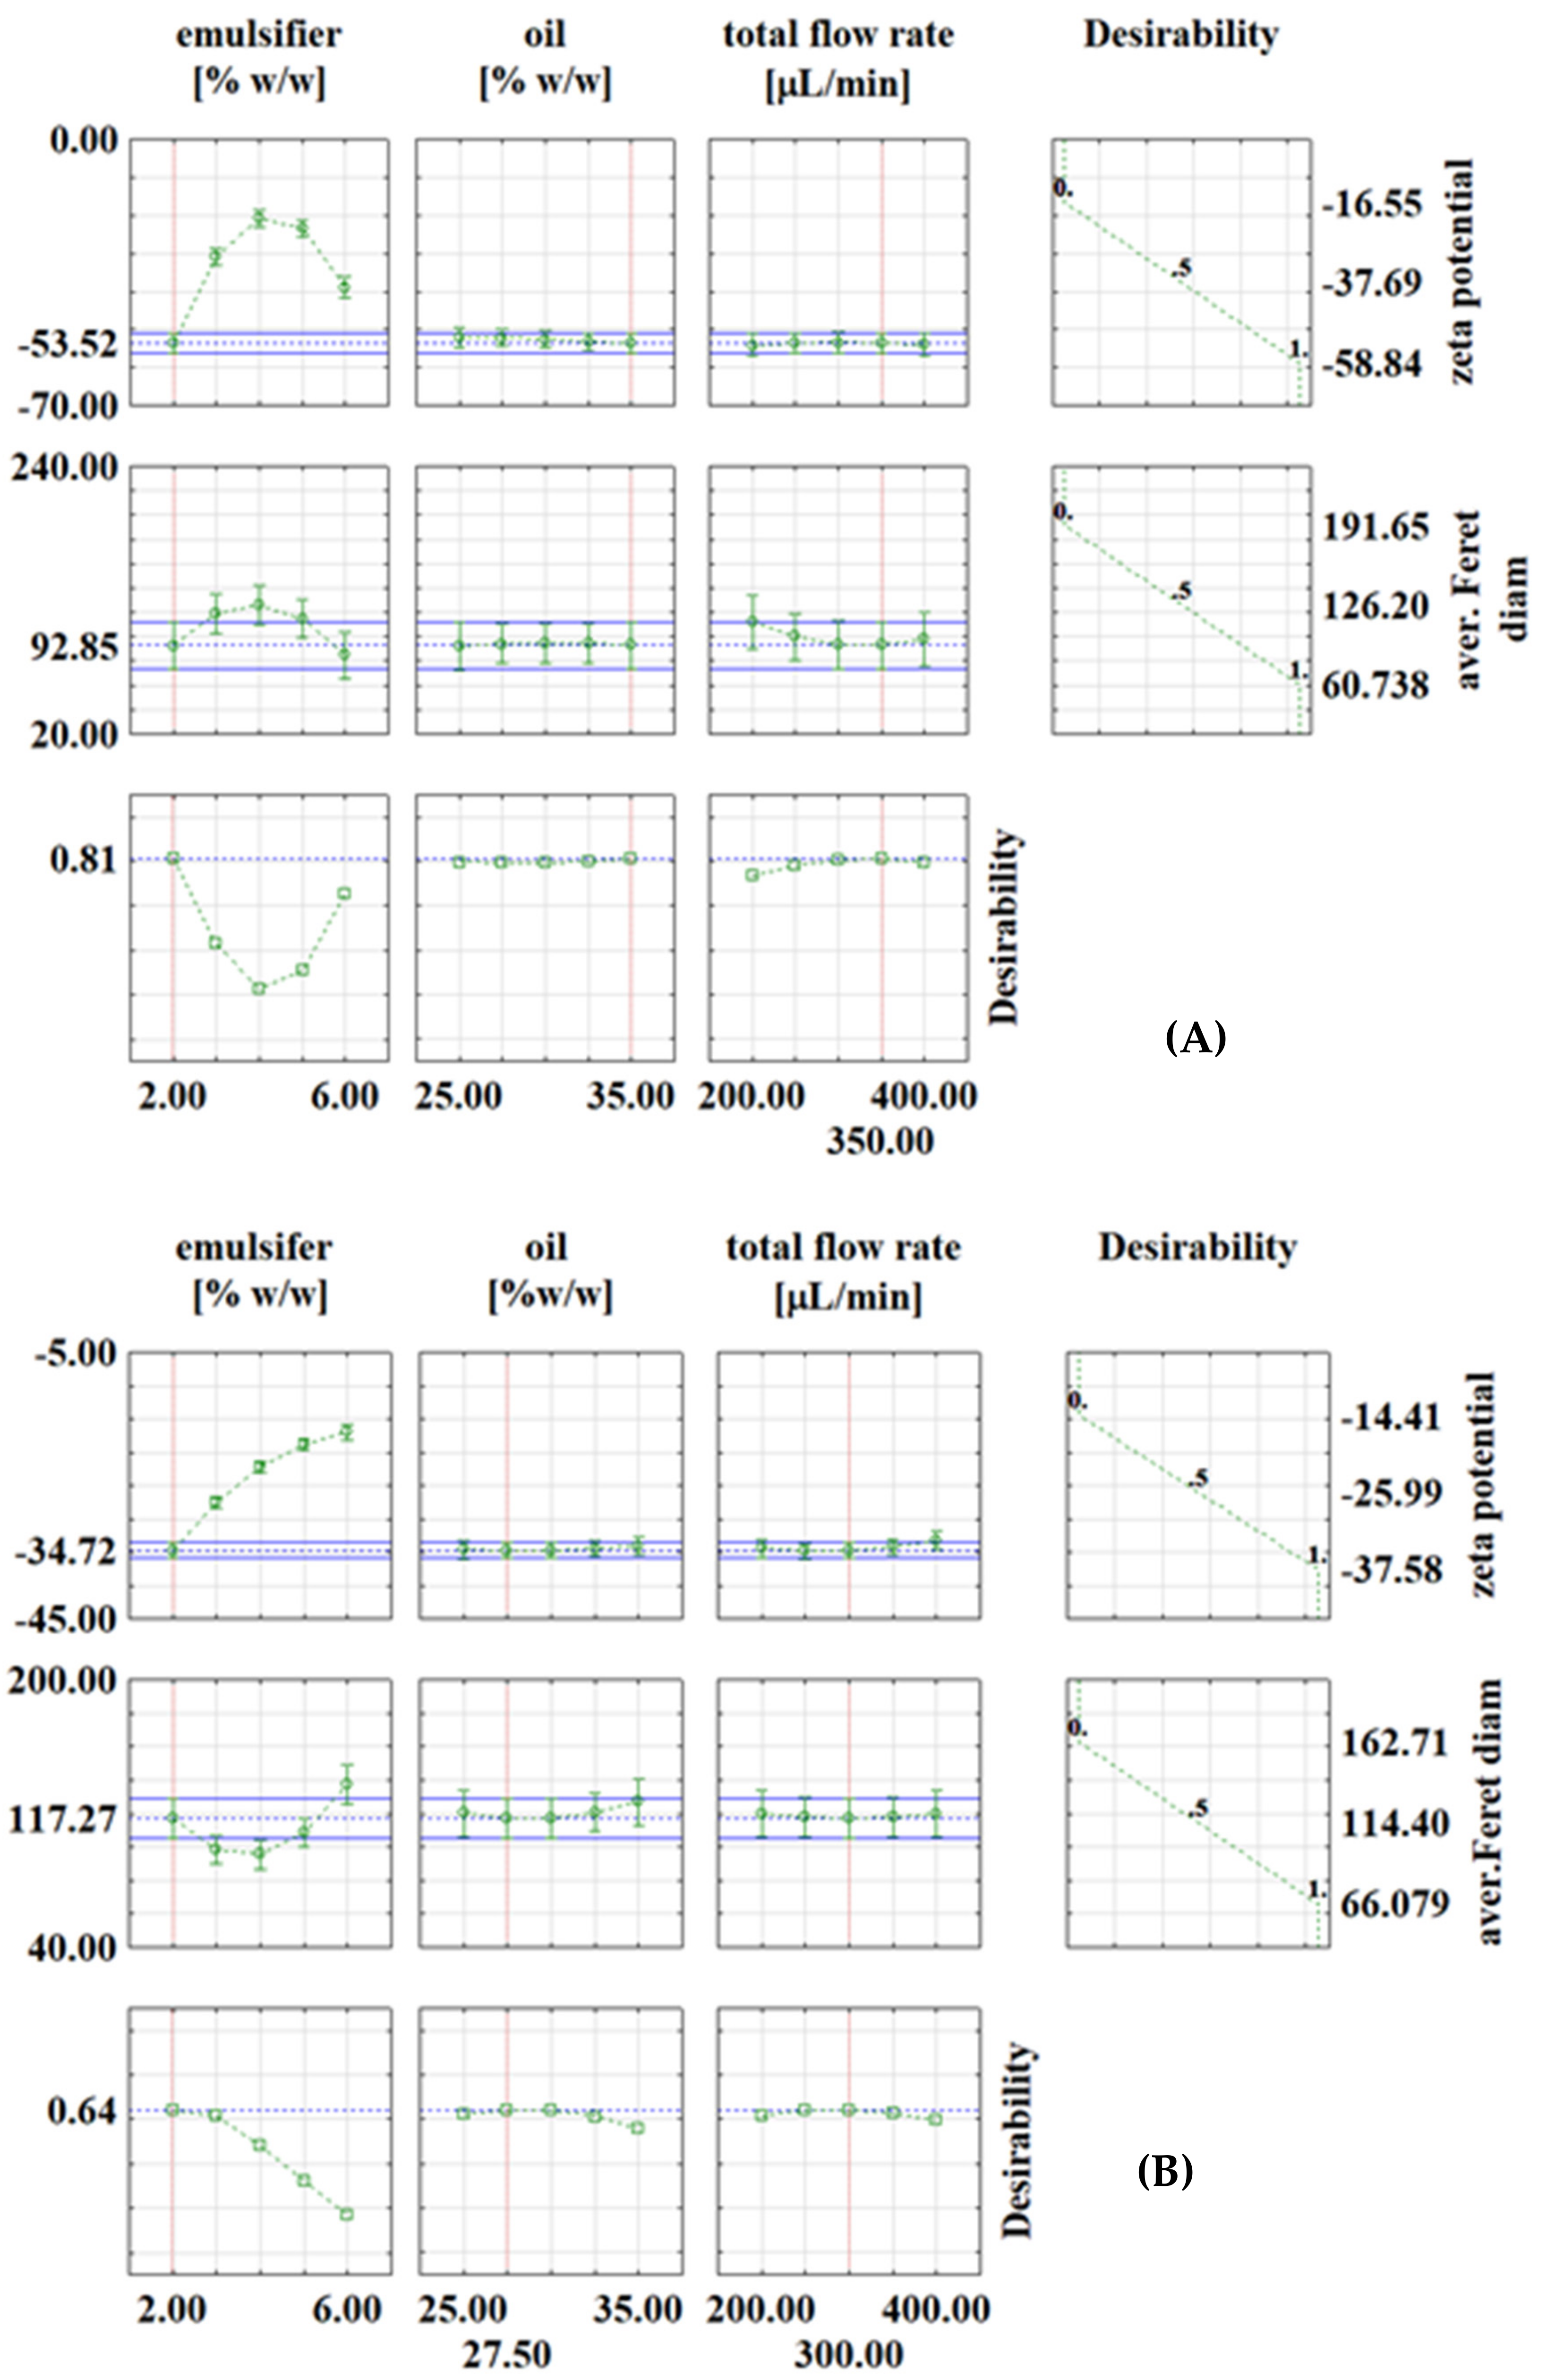
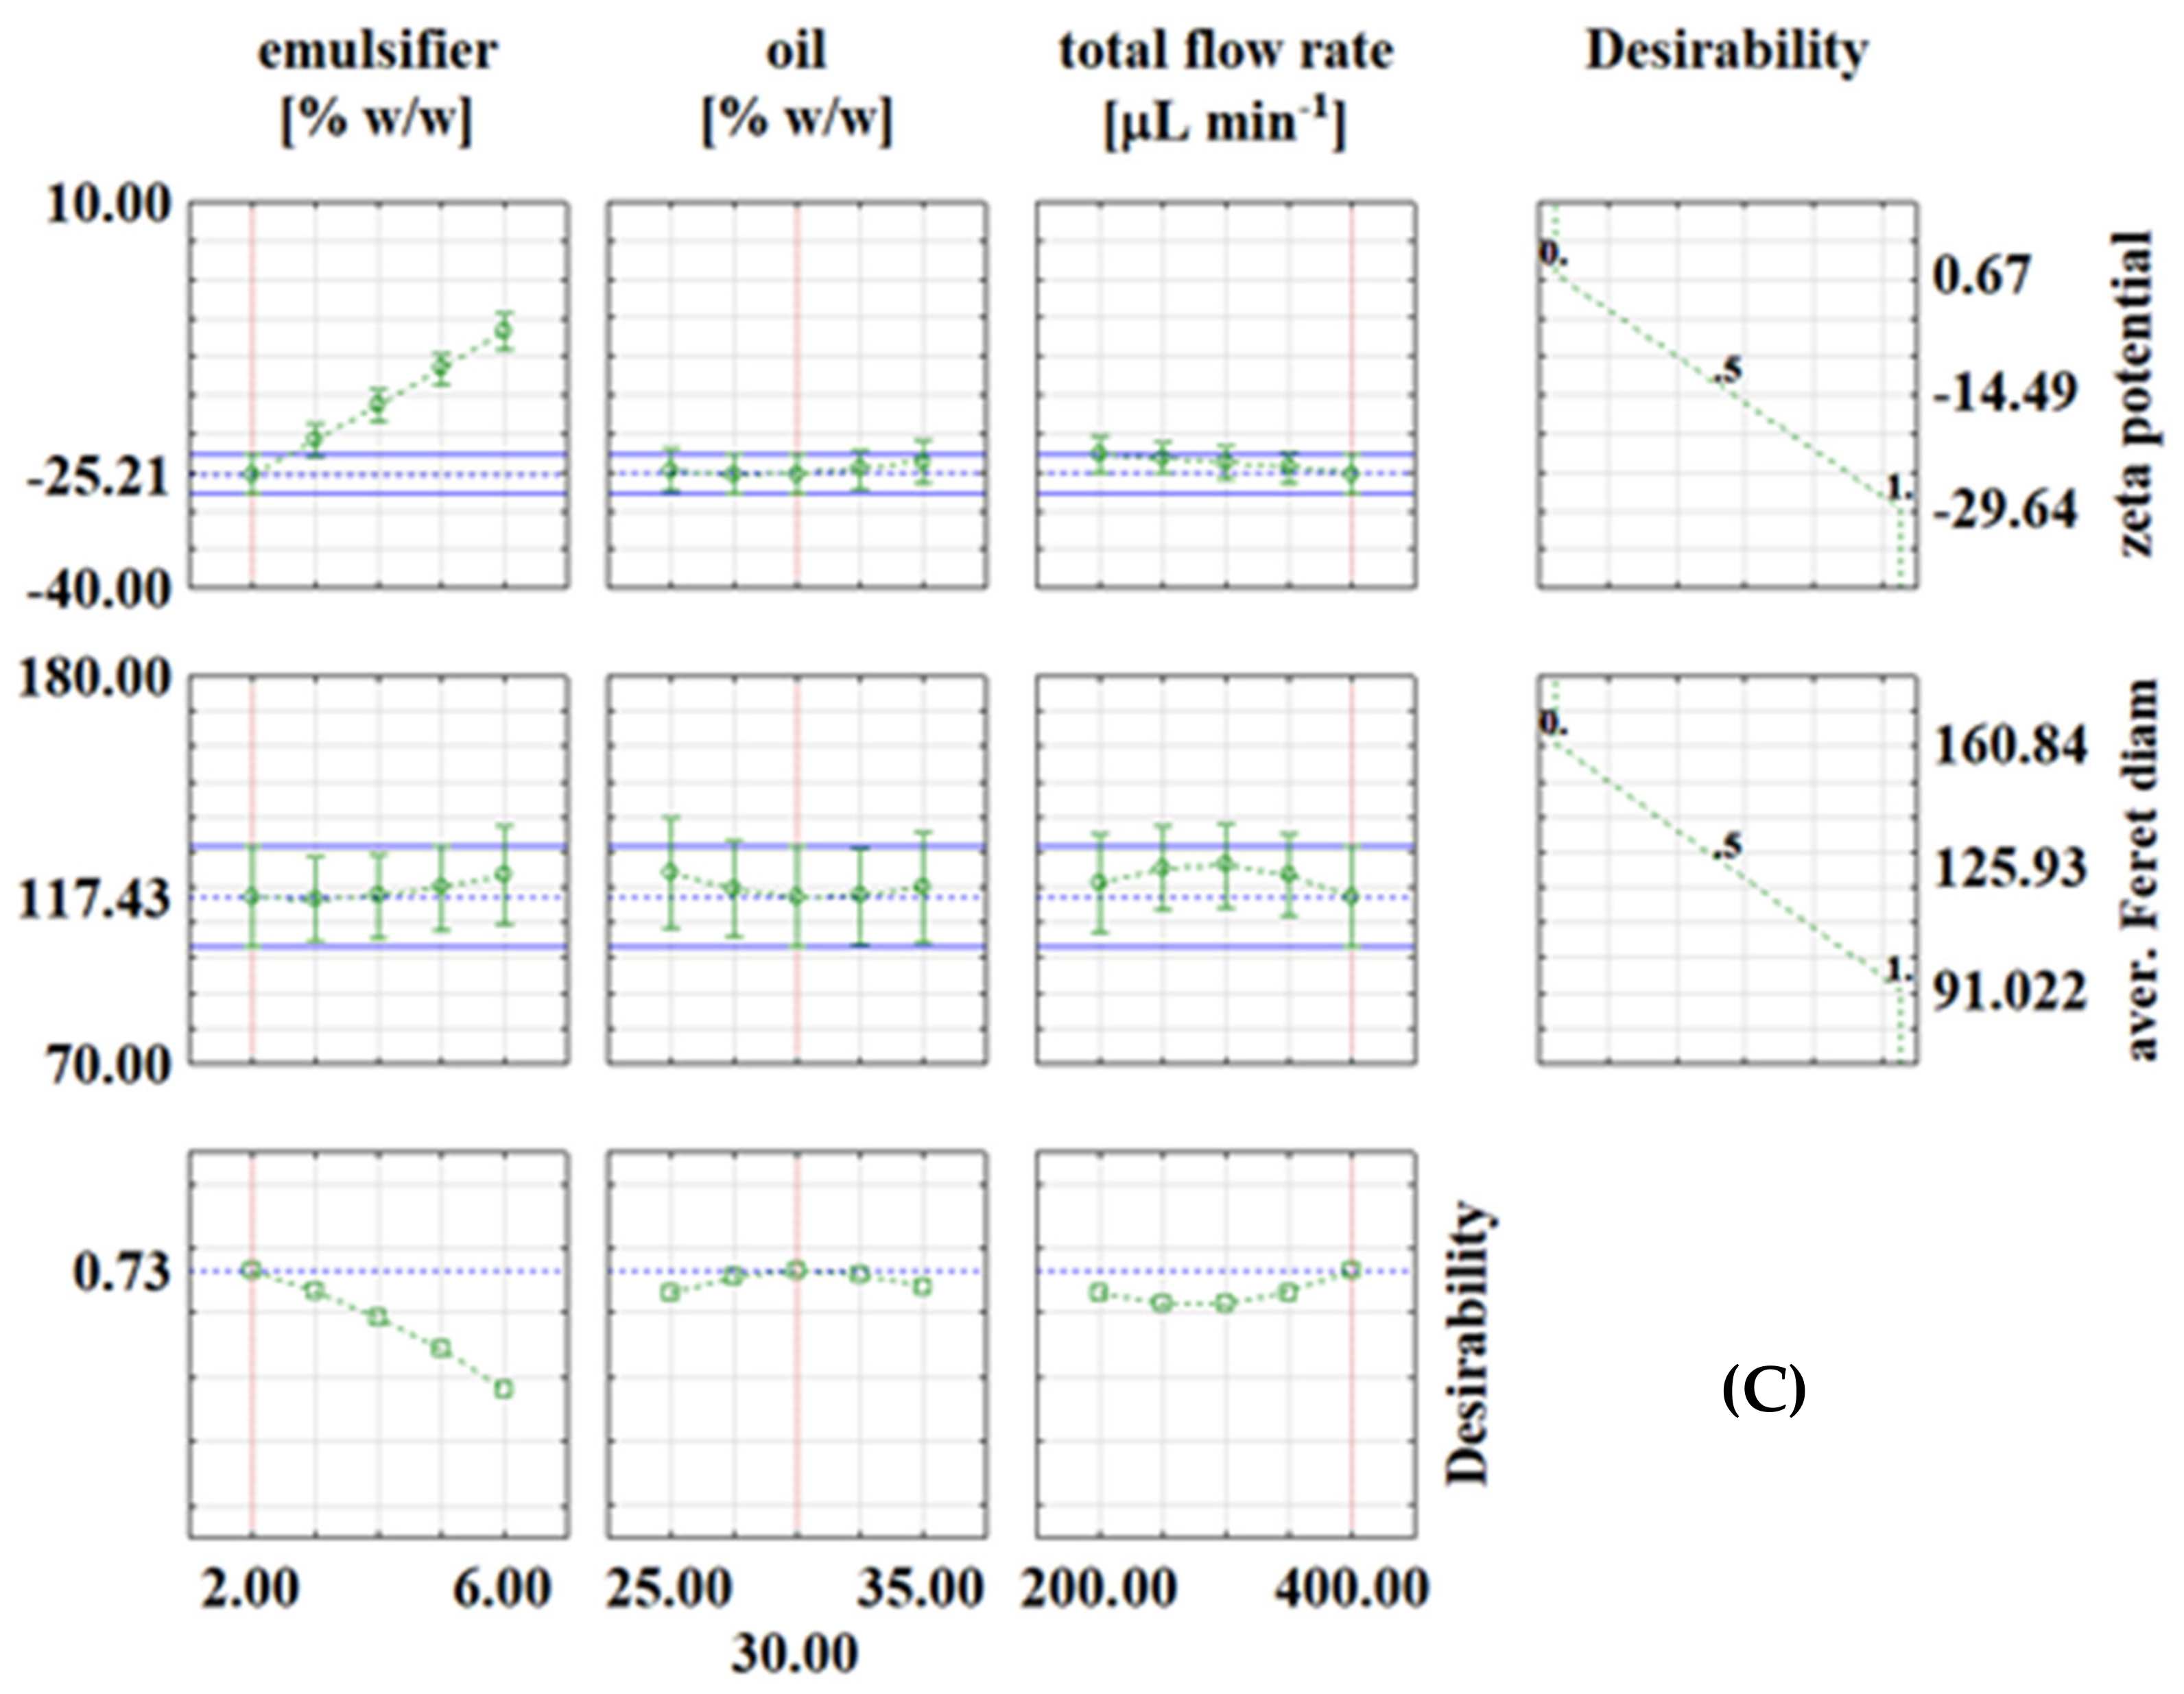
Optimization was performed for the zeta potential and for the average Feret diameter based on the desirability profiles obtained from the RSM predictions. The desirability scale ranging from 0 (undesirable) to 1 (very desirable) was used. The results are shown in Figure 2 and Figure 3.
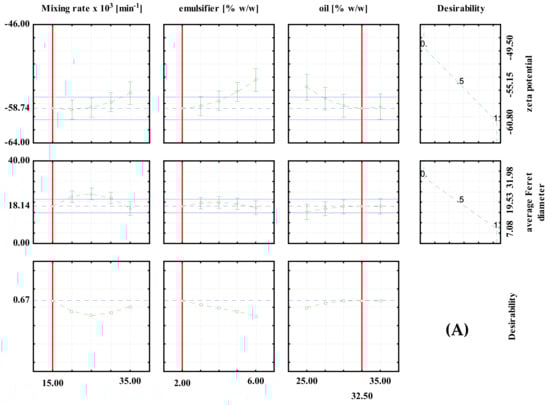
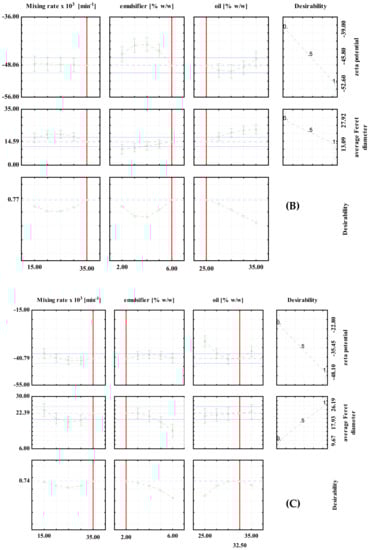
Figure 2.
Desirability profiles for batch experiments with: (A) PEG1500; (B) PEG6000; (C) PEG20000.
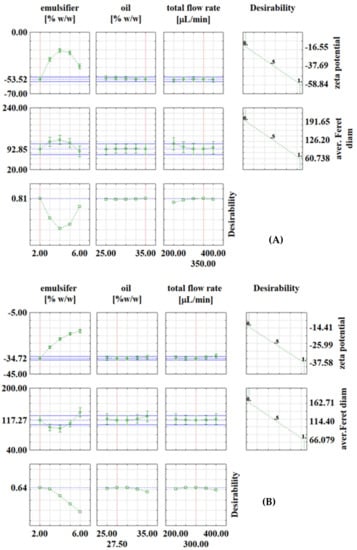
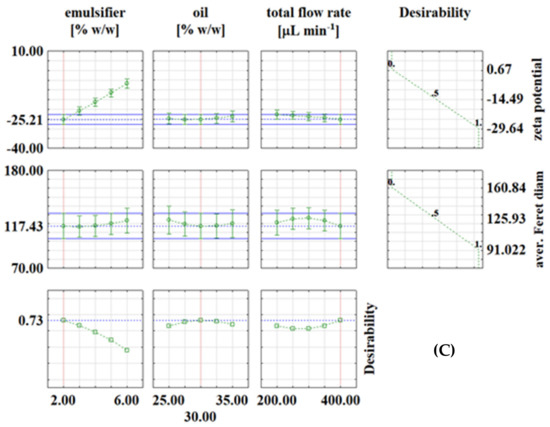
Figure 3.
Desirability profiles for continuous experiments with: (A) PEG1500; (B) PEG6000; (C) PEG20000.
For the high shear batch emulsification experiments, the optimal conditions for the preparation of PEG1500 emulsions were: 2% emulsifier, 32.5% oil and a mixing rate of 15,000 min−1. The predicted values at optimal conditions were ζ = −58.74 mV and d = 18.14 μm (Figure 2A). For the PEG6000 emulsions, the optimal conditions were: 6% emulsifier, 25% oil and a mixing rate of 35,000/min. The predicted values at optimal conditions were ζ = 48.06 mV and d = 14.59 μm, respectively (Figure 2B). For PEG20000 emulsions, the optimal conditions were: 2% emulsifier, 32.5% oil, and a mixing rate of 35,000/min. The predicted values at optimal conditions were ζ = −40.79 mV and d = 22.39 μm, respectively (Figure 2C). It can be seen that the optimal conditions are different for each type of emulsifier used, which emphasizes the importance of proper optimization of the process prior to the production of emulsions on a larger scale.
In continuous experiments, for PEG1500 emulsions, the optimal conditions were: emulsifier concentration of 2%, oil phase fraction of 35% and total flow rate of 350 μL/min, with the corresponding values at optimal conditions of ζ = −53.52 mV and d = 92.85 μm (Figure 3A). For PEG6000 emulsions, the optimal conditions for zeta potential were: emulsifier concentration of 2%, oil phase fraction of 27.5% and total flow rate of 300 μL min−1, with the corresponding values at optimal conditions of ζ = −34.72 mV and d = 117.27 μm (Figure 3B). For PEG20000 emulsions, the optimal conditions were: emulsifier concentration of 2%, oil phase fraction of 30% and total flow rate of 400 μL/min, with the corresponding values at optimal conditions of ζ = −25.21 mV and d = 117.43 μm (Figure 3C). It is interesting to note that in continuous experiments, the lowest emulsifier concentration is the one that gives the best results in all three cases, which is feasible because it allows the use of fewer chemicals (emulsifier in this case). As already described in the literature [29,30,31], many variables need to be investigated to obtain emulsions with desired properties, which is costly and time-consuming, so it is recommended to use numerical methods such as RSM for process optimization. For example, Caporaso et al. [32] applied RSM to optimize olive oil-in-water emulsification, Ahn et al. [33] used RSM to optimize microencapsulation of tomato extract by water-in-oil-in-water emulsification, Fathordoobady et al. [34] optimized microfluidic emulsification of hemp seed oil for oral delivery applications, and Nieves et al. [35] optimized ultrasound-assisted emulsion preparation in a microfluidic chip.
4. Conclusions
This study focused on the comparison and optimization of two types of emulsification processes: a macro-batch process using a high shear homogenizer and a continuous micro-process using a microfluidic system. Three emulsifiers were used for both processes: PEG1500, PEG6000 and PEG20000. The emulsions prepared in the batch process were more stable, had smaller droplet diameter but higher PDI values compared to those prepared in the continuous process. Moreover, different PEGs were found to have different influences on the zeta potential of the emulsions: in both cases, the use of PEG with higher molecular weight resulted in emulsions with lower zeta potential values. Optimization of both processes revealed that the optimal processing conditions depend on the type of PEG used. Batch emulsification was found to have a significant effect of all three optimization parameters (emulsifier concentration, oil concentration and mixing rate) on average Feret diameter and zeta potential (depending on the PEG used for emulsification), while the emulsifier concentration had the most significant effect on zeta potential and average Feret diameter of emulsions prepared via the continuous microsystem process.
Author Contributions
F.G.—collected the data; M.B.—collected the data, wrote and revised the manuscript; D.V.—collected the data and revised the manuscript; T.J.—revised the manuscript; J.G.K.—revised the manuscript; A.J.T.—performed the mathematical modeling, wrote and revised the manuscript. All authors have read and agreed to the published version of the manuscript.
Funding
This research received no external funding.
Institutional Review Board Statement
Not applicable.
Informed Consent Statement
Not applicable.
Data Availability Statement
Not applicable.
Acknowledgments
The authors would like to express their gratitude to Anton Paar Croatia d.o.o. for lending us the Litesizer instrument for the needs of this research.
Conflicts of Interest
The authors declare no conflict of interest.
References
- Lu, W.; Kelly, A.L.; Miao, S. Emulsion-based encapsulation and delivery systems for polyphenols. Trends Food Sci. Technol. 2016, 47, 1–9. [Google Scholar] [CrossRef]
- Fang, Z.; Bhandari, B. Encapsulation of polyphenols—A review. Trends Food Sci. Technol. 2010, 21, 510–523. [Google Scholar] [CrossRef]
- Seiffert, S.; Thiele, J.; Abate, A.R.; Weitz, D.A. Smart microgel capsules from macromolecular precursors. J. Am. Chem. Soc. 2010, 132, 6606–6609. [Google Scholar] [CrossRef]
- Huang, H.; Hao, S.; Li, L.; Yang, X.; Cen, J.; Lin, W.; Wei, Y. Influence of emulsion composition and spray-drying conditions on microencapsulation of tilapia oil. J. Food Sci. Technol. 2014, 51, 2148–2154. [Google Scholar] [CrossRef] [PubMed] [Green Version]
- O’Sullivan, J.; Murray, B.; Flynn, C.; Norton, I. Comparison of batch and continuous ultrasonic emulsification processes. J. Food Eng. 2015, 167, 114–121. [Google Scholar] [CrossRef] [Green Version]
- Shah, R.K.; Shum, H.C.; Rowat, A.C.; Lee, D.; Agresti, J.J.; Utada, A.S.; Chu, L.-Y.; Kim, J.-W.; Fernandez-Nieves, A.; Martinez, C.J.; et al. Designer emulsions using microfluidics. Mater. Today 2008, 11, 18–27. [Google Scholar] [CrossRef]
- Pohar, A.; Plazl, I. Process intensification through microreactor application. Chem. Biochem. Eng. Quart. 2009, 23, 537–544. [Google Scholar]
- Löb, P.; Hessel, V.; Simoncelli, A. Microreactor applications in the consumer goods industry. In Micro Process Engineering; Hessel, V., Renken, A., Schouten, J.C., Yoshida, J., Eds.; Wiley-VCH Verlag GmbH & Co. KGaA: Weinheim, Germany, 2009; pp. 363–401. [Google Scholar]
- Dobhal, A.; Kulkarni, A.; Dandekar, P.R.; Jain, R. A microreactor-based continuous process for controlled synthesis of poly-methyl-methacrylate-methacrylic acid (PMMA) nanoparticles. J. Mater. Chem. B 2017, 2017, 3404–3417. [Google Scholar] [CrossRef]
- Plazl, I.; Lakner, M. Modelling and finite differences numerical analysis of reaction diffusion dynamics in a microreactor. Acta Chim. Slov. 2010, 57, 100–109. [Google Scholar]
- Monreau, M.; Di Miceli Raimondi, N.; Le Sauze, N.; Gourdon, C.; Cabassud, M. A new numerical method for axial dispersion characterisation in a microreactor. Chem. Eng. Sci. 2017, 168, 178–188. [Google Scholar] [CrossRef] [Green Version]
- Šalić, A.; Zelić, B. Synergy of microtechnology and biotechnology: Microreactors as an effective tool for biotransformation processes. Food Technol. Biotechnol. 2018, 56, 464–479. [Google Scholar] [CrossRef] [PubMed]
- Land, K.J.; Mbanjwa, M.; Korvink, J.G. Microfluidic channel structures rate up mixing of multiple emulsions by a factor of ten. Biomicrofluidics 2014, 8, 054101. [Google Scholar] [CrossRef] [PubMed] [Green Version]
- Bolognesi, G.; Hargreaves, A.; Ward, A.D.; Kirby, A.K.; Bain, C.D.; Ces, O. Microfluidic generation of monodisperse ultra-low interfacial tension oil droplets in water. RSC Adv. 2015, 5, 8114–8121. [Google Scholar] [CrossRef] [Green Version]
- Azarmanesh, M.; Bawazeer, S.; Mohamad, A.A.; Sanati-Nezhad, A. Rapid and highly controlled generation of monodisperse multiple emulsions via a one-step hybrid microfluidic device. Sci. Rep. 2019, 9, 12694. [Google Scholar] [CrossRef] [PubMed] [Green Version]
- Wang, J.; Li, Y.; Wang, X.; Wang, J.; Tian, H.; Zhao, P.; Tian, Y.; Gu, Y.; Wang, L.; Wang, C. Droplet microfluidics for the production of microparticles and nanoparticles. Micromachines 2017, 2017, 22. [Google Scholar] [CrossRef]
- Raval, N.; Maheshwari, R.; Kalyane, D.; Youngren-Ortiz, S.; Chougule, M.B.; Tekade, R.K. Importance of physicochemical characterization of nanoparticles in pharmaceutical product development. In Advances in Pharmaceutical Product Development and Research, Basic Fundamentals of Drug Delivery; Tekade, R.K., Ed.; Academic Press: Cambridge, MA, USA, 2019; pp. 369–400. [Google Scholar]
- Pinto, I.; Buss, A. Zeta potential as a measure of asphalt emulsion stability. Energ. Fuels 2020, 34, 2143–2151. [Google Scholar] [CrossRef]
- Sharma, D.; Maheshwari, D.; Philip, G.; Rana, R.; Bhatia, S.; Singh, M.; Gabrani, R.; Sharma, S.K.; Ali, J.; Sharma, R.K.; et al. Formulation and optimization of polymeric nanoparticles for intranasal delivery of lorazepam using Box-Behnken design: In vitro and in vivo evaluation. BioMed Res. Int. 2014, 2014, 156010. [Google Scholar] [CrossRef] [Green Version]
- Kim, K.M.; Oh, H.M.; Lee, J.H. Controlling the emulsion stability of cosmetics through shear mixing process. Korea-Aust. Rheol. J. 2020, 32, 243–249. [Google Scholar] [CrossRef]
- Toro-Mendoza, J.; Petsev, D.N. Brownian dynamics of emulsion film formation and droplet coalescence. Phys. Rev. E 2010, 81, 051404. [Google Scholar] [CrossRef]
- Urbina-Villalba, G. An algorithm for emulsion stability simulations: Account of flocculation, coalescence, surfactant adsorption and the process of Ostwald ripening. Int. J. Mol. Sci. 2009, 10, 761–804. [Google Scholar] [CrossRef] [Green Version]
- Wang, Z.; Song, J.; Zhang, S.; Xu, X.; Wang, Y. Formulating polyethylene glycol as supramolecular emulsifiers for one-step double emulsions. Langmuir 2017, 33, 9160–9169. [Google Scholar] [CrossRef] [PubMed]
- Cheng, Y.; Liu, M.; Hu, H.; Liu, D.; Zhou, S. Development, optimization, and characterization of PEGylated nanoemulsion of prostaglandin E1 for long circulation. AAPS PharmSciTech 2016, 17, 409–417. [Google Scholar] [CrossRef] [PubMed] [Green Version]
- Khopade, A.J.; Jain, N.K. Long-circulating multiple-emulsion system for improved delivery of an anticancer agent. Drug Deliv. 1997, 6, 107–110. [Google Scholar] [CrossRef]
- Khalid, N.; Kobayashi, I.; Neves, M.A.; Uemura, K.; Nakajima, M.; Nabetani, H. Microchannel emulsification study on formulation and stability characterization of monodisperse oil-in-water emulsions encapsulating quercetin. Food Chem. 2016, 212, 27–34. [Google Scholar] [CrossRef] [PubMed]
- Manickam, S.; Sivakumar, K.; Pang, C.H. Investigations on the generation of oil-in-water (O/W) nanoemulsions through the combination of ultrasound and microchannel. Ultrason. Sonochem. 2020, 69, 105258. [Google Scholar] [CrossRef]
- Nehme, R.; Blel, W.; Montillet, A.; Bellettre, J.; Marchal, L. Production of oil in water emulsions in microchannels at high throughput: Evaluation of emulsions in view of cosmetic, nutraceutical or pharmaceutical applications. Chem. Eng. Process. 2021, 161, 108301. [Google Scholar] [CrossRef]
- Gharidzahedi, S.M.T.; Mousavi, S.M.; Hamedi, M.; Ghasemlou, M. Response surface modeling for optimization of formulation variables and physical stability assessment of walnut oil-in-water beverage emulsions. Food Hydrocol. 2012, 26, 293–301. [Google Scholar] [CrossRef]
- Pongsumpun, P.; Iwamoto, S.; Siripatrawan, U. Response surface methodology for optimization of cinnamon essential oil nanoemulsion with improved stability and antifungal activity. Ultrason. Sonochem. 2020, 60, 104604. [Google Scholar] [CrossRef]
- Feng, J.; Schroën, K.; Fogliano, V.; Berton-Carabin, C. Antioxidant potential of non-modified and glycated soy proteins in the continuous phase of oil-in-water emulsions. Food Hydrocol. 2021, 114, 106564. [Google Scholar] [CrossRef]
- Caporaso, N.; Genovese, A.; Burke, R.; Barry-Ryan, C.; Sacchi, R. Effect of olive mill wastewater phenolic extract, whey protein isolate and xanthan gum on the behaviour of olive O/W emulsions using response surface methodology. Food Hydrocol. 2016, 61, 66–76. [Google Scholar] [CrossRef] [Green Version]
- Ahn, S.; Chogsom Lee, Y.-K.; Kwak, H.-S.; Chang, Y.H. Optimization of the conditions for producing water-in-oil-in-water microemulsions and spray-dried microcapsule of tomato extract powder. Food Sci. Technol. 2019, 39, 202–210. [Google Scholar] [CrossRef] [Green Version]
- Fathordoobady, F.; Sannikova, N.; Guo, Y.; Singh, A.; Kitts, D.D.; Pratap-Singh, A. Comparing microfluidics and ultrasonication as formulation methods for developing hempseed oil nanoemulsions for oral delivery applications. Sci. Rep. 2021, 11, 72. [Google Scholar] [CrossRef] [PubMed]
- Nieves, E.; Vite, G.; Kozina, A.; Olguin, L.F. Ultrasound-assisted production and optimization of mini-emulsions in a microfluidic chip in continuous-flow. Ultrason. Sonochem. 2021, 74, 105556. [Google Scholar] [CrossRef] [PubMed]

Publisher’s Note: MDPI stays neutral with regard to jurisdictional claims in published maps and institutional affiliations. |
© 2022 by the authors. Licensee MDPI, Basel, Switzerland. This article is an open access article distributed under the terms and conditions of the Creative Commons Attribution (CC BY) license (https://creativecommons.org/licenses/by/4.0/).