Article

Faba Bean Fractions for 3D Printing of Protein-, Starch- and Fibre-Rich Foods

Department of Molecular Sciences, Swedish University of Agricultural Sciences, SE-750 07 Uppsala, Sweden
*
Authors to whom correspondence should be addressed.
These authors contributed equally to this work.
Processes 2022, 10(3), 466; https://doi.org/10.3390/pr10030466
Submission received: 19 January 2022 / Revised: 18 February 2022 / Accepted: 21 February 2022 / Published: 25 February 2022

Abstract

:
Food 3D printing allows for the production of personalised foods in terms of shape and nutrition. In this study, we examined whether protein-, starch- and fibre-rich fractions extracted from faba beans can be combined to produce fibre- and protein-rich printable food inks for extrusion-based 3D printing. Small amplitude oscillatory shear measurements were used to characterise the inks while compression tests and scanning electron microscopy were used to characterise the freeze-dried samples. We found that rheological parameters such as storage modulus, loss tangent and yield stress were related to ink printability and shape stability. Investigations on the effect of ink composition, infill pattern (honeycomb/grid) and direction of compression on textural and microstructural properties of freeze-dried 3D-printed objects revealed no clear effect of infill pattern, but a strong effect of direction of compression. Microstructure heterogeneity seemed to be correlated with the textural properties of the printed objects.

1. Introduction

There are multiple advantages and possible applications of food 3D printing. Beyond the possibility of creating complex structures, the technique can also be used to supply personalised nutrition and food formulations for consumers with different preferences and needs [1]. It can be used to enhance children’s curiosity towards vegetable-based foods, supply more appealing foods for the elderly and people with swallowing difficulties and produce delivery systems for the controllable release of nutrients and medication [2]. One example of a nutritious and healthy 3D-printed food that has been studied is fibre- and/or protein-rich snacks [3]. The 3D printing technique could also be used to create novel textures, such as plant-based steaks with textural properties resembling those of meat [4].
One of the greatest challenges in food 3D printing is finding inks that have good printing precision and shape stability [5,6]. Inks used for extrusion-based 3D printing must be able to flow through a nozzle and retain their shape after printing. Rheological characterisation of inks for 3D printing has been used in efforts to predict the printability of a material and its dimensional stability after printing [3,7,8]. Examples of parameters investigated include storage modulus (G′), loss modulus (G″), tan (δ) and yield stress. Storage modulus is a measure of the elasticity of a material and its ability to store deformational energy and can be seen as a measure of the structural strength and mechanical rigidity of a material at rest [9]. Loss modulus represents the viscous response of the material and is a measure of the energy dissipated as heat during deformation [9]. Tan(δ), or loss tangent, is the ratio between G″ and G′, i.e., the ratio of energy lost to energy stored during cyclic deformation. Yield stress relates to the force that can be applied before the structure of the material starts to break and flow is initiated [3].
A correlation between shear modulus and the deformation behaviour of methylcellulose gels has been reported [10], indicating that this parameter can be used to predict printability. Multiple studies have observed a correlation between storage modulus and/or yield stress of the ink with the degree of deformation after printing [5,11,12]. Furthermore, it has been shown that the loss modulus value can supply additional information important for predicting the dimensional stability of 3D-printed food structures [8].
One advantage of 3D food printing compared with the use of moulds or forms is the possibility of using different infill patterns for the interior of the printed object in order to alter its textural properties. The effect of the infill pattern of 3D-printed foods such as air-fried potato snacks and chocolate has been investigated in two previous studies, both of which showed that the infill pattern can influence the texture of printed foods [13,14].
Few studies have so far investigated the possibility of using plant-based materials for food printing without the inclusion of thickeners such as sodium alginate, xanthan gum or methylcellulose. Chen et al. [15] found that not including thickeners for samples 3D-printed using soy protein isolates reduced the objects’ shape stability and hardness. Another study showed that 3D printing quality was satisfactory, although the samples tended to swell, when using either oat or faba bean protein concentrates without additional thickeners at solid contents of 45% and 35%, respectively [5]. In the same study, 3D objects were produced from rye bran inks with a solid content of 30%. The starch present in the plant materials was assumed to act as a natural thickening agent through gelatinisation. Other factors affecting the viscosity and printability of the inks include composition, size and shape of insoluble particles and response to heating and shear between the materials [5].
In this study, the following two current trends—3D printing and plant-based foods—are combined. The objective was to produce 100% faba bean-based 3D-printed food prototypes. Edible inks composed of different fractions (faba bean fractions rich in protein, starch or fibre) will be compared on rheological properties and printability. The influence of the composition and infill pattern on the texture and microstructure of the 3D-printed samples will also be investigated. This study provides new insight into how the proportion of faba bean fractions influences the properties of 3D-printed foods.

2. Materials and Methods

The protein-, starch- and fibre-rich fractions used in this study were extracted from dehulled and milled faba beans (Vicia faba var. Gloria) kindly provided by RISE (Research Institutes of Sweden). A complete characterisation of the fractions can be found in [16]. A brief summary of the composition of the fractions are the following protein-(protein 77.3%; starch 0.3%; fibre 2.3%; fat 3.4%; ash 8%), starch-(protein 0.5%; starch 94.5%; fibre 3.6%; fat 0.3%; ash 0.2%), and fibre-rich (protein 5.3%; starch 22.5%; fibre 73.1%; fat 0.4%; ash 3.5%). The beans were grown in central Sweden, harvested and dried in 2016. Sodium hydroxide (NaOH) and hydrochloric acid (HCl), purchased from Merck KGaA (Darmstadt, Germany), were used for extraction.

2.1. Extraction

To separate the cotyledon and hull, the faba beans were dehulled (Hi-Tech Machinery Manufacturing Co. Ltd., Heze, Shandong, China) and then milled (Ultra-Centrifugal Mill ZM-1, Retsch, Haan, Germany) into flours with a mesh size of 0.5 mm. Only the cotyledon flour was used for further extraction. The extraction was performed as described previously, with some slight modifications [16]. In brief, faba bean flour was dispersed at a distilled water:flour ratio of 10:1 (v/w) and the pH was adjusted to 9.0 using 2 M NaOH. The protein was separated by centrifugation (Thermo Scientific, Sorvall Lynx 4000, Waltham, MA, USA) at 3700× g (20 °C, 30 min) and precipitated at pH 4 using 1 M HCl. The protein was then washed once, the pH adjusted to 7 and the protein freeze-dried (Martin Christ, Epsilon 2-6D LSC Plus, Osterode am Harz, Germany). For starch and fibre extraction, the pellet from the first centrifugation step was re-dispersed in distilled water, the pH adjusted to 9.5 and the mixture stirred at room temperature for 24 h. Thereafter, the mixture was left to stand without stirring at 4 °C for 24 h before being centrifuged (3700× g, 20 °C, 5 min). The supernatant was discarded and the pellet re-dispersed in distilled water. This centrifugation step was repeated until pH 7 was reached. To separate the starch from the fibre, the final pellet was dispersed in distilled water and filtered through a 70 μm nylon filter. This filtration step was repeated 12 times, followed by drying of the starch-rich filtrate at 40 °C for 48 h and freeze-drying of the fibre-rich filter cake. After drying, all fractions were sieved (Retsch, AS200 basic, Haan, Germany) through a 150 μm (protein and starch) or 250 μm (fibre) mesh (Retsch, Testsieve, Haan, Germany).

2.2. Swelling Power and Water Soluble Index

The swelling power (SP) of the samples was determined in triplicate following a modified version of existing methods by Muñoz et al. and Schoch [17,18]. In brief, 0.5 g of sample was weighed into a 15 mL centrifuge tube with a screw cap and 10 mL of distilled water was added. The tubes were placed in a shaking water bath at 60 °C for 10 min. The tubes were removed and left to cool to room temperature in an ice water bath before centrifugation at 7000 g for 20 min. The supernatant was decanted and left to dry at 105 °C overnight. The dried sample was used to calculate the water soluble index (WSI) and the mass of the sediment was used to determine the swelling power. These were calculated using the following equations:
WSI ( % ) = Mass   dried   supernatant Mass   of   dry   fraction × 100
SP ( g g ) = Mass   sediment Mass   of   dry   fraction

2.3. Preparation of Inks

The composition of the different inks (fibre-rich, protein-rich, starch-rich, protein- and starch-rich; see Table 1) were chosen based on a pre-study, providing printable inks covering a relatively wide range of composition. The mixture of flours to water ratio was adjusted for each ink. The criteria for the inks were that they should be printable and produce a standing object. The pastes used for 3D printing and stress sweep measurements were prepared by first mixing the starch with 70% of the total amount of diH2O used. The starch dispersion was then heated in a water bath at 60 °C for 10 min. Thereafter, the mixture was removed from the water bath, the fibre and protein added and the mixture mixed thoroughly by hand using a spatula. For rheological characterisation, the fibre was added and the sample mixed before addition of the protein and additional mixing. After the addition of fibre and protein, the final 30% of diH2O was added before mixing to a homogenous paste. To further homogenise the sample and eliminate larger air bubbles, the paste was extruded three times through a 5-mL Luer syringe without a needle before being added to the 3-mL cartridges used for printing. The cartridges were sealed and left at room temperature for 1 h before printing and rheological measurements.

2.4. Rheological Characterisation of Inks

The viscoelastic properties of the inks were analysed by stress sweep measurements using a Discovery HR-3 rheometer (TA Instruments, New Castle, DE, USA) equipped with a 40 mm aluminium plate. The stress was increased logarithmically from 0.001 to 10,000 Pa at a frequency of 0.1 Hz and a temperature of 22 °C. The edges of the sample were covered with paraffin oil to limit evaporation and a 300 s resting time was applied before starting the measurements. The yield stress was defined as the stress at which 5% loss of the original storage modulus was observed. The analysis was performed in duplicate.

2.5. 3-D Printing

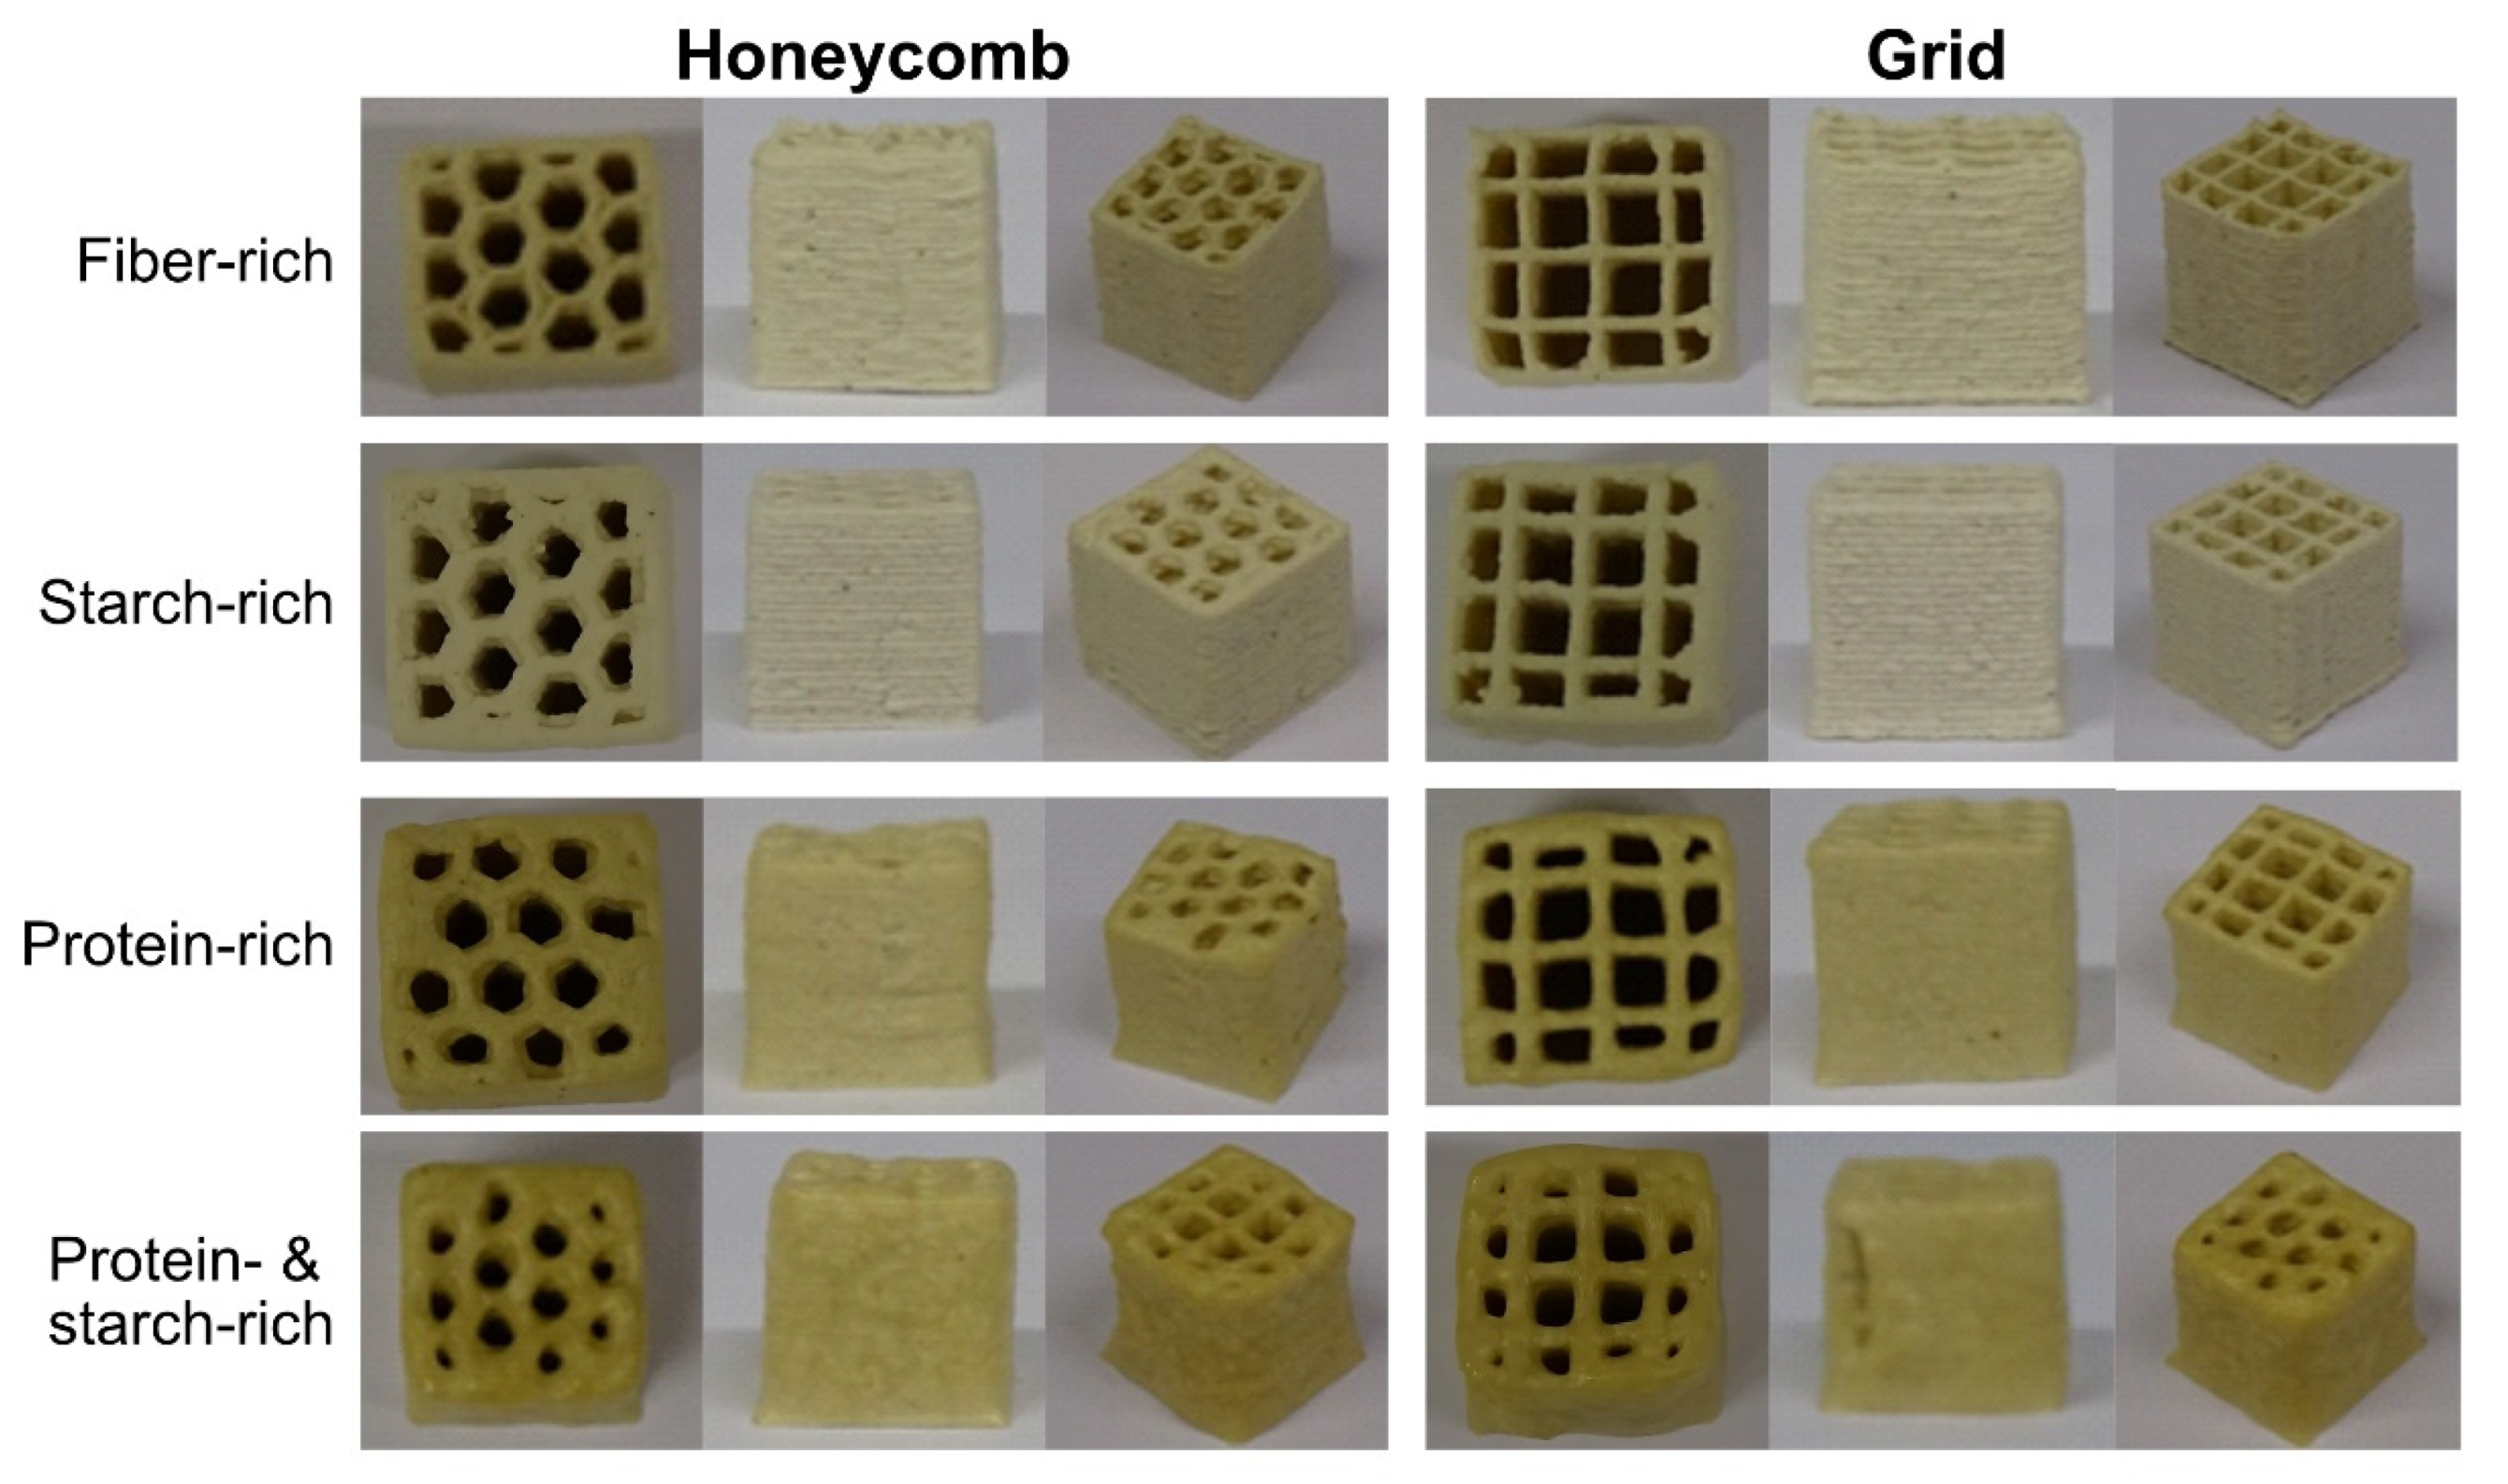
The model of the cube (14 × 14 × 14 mm) used for printing was created using the digital design tool Tinkercad (Autodesk Inc., San Rafael, CA, USA) and exported as an STL file to the bioprinter. The cubes were printed at room temperature using two different infill patterns (honeycomb, grid). For the cubes with a honeycomb pattern, the pattern available in the bioprinter software was used. The grid pattern was created using Cellink Heartware (Version 2.1.6, Cellink, Gothenburg, Sweden, 2021) combined with the open source slicing software Slic3r (Version 1.3.0, 2021).
Samples were printed on petri dishes using a BIO X bioprinter (Cellink, Gothenburg, Sweden). Pressure and pre-flow were adjusted for each ink individually. The number of layers was 24, the infill density was 25% and the tip diameter of the nozzle was 580 μm. After printing, the samples were left for 5 min at room temperature and then stored at −18 °C until freeze-drying.

2.6. Freeze Drying

Frozen 3D-printed objects were further frozen at −50 °C for 48 h, followed by freeze-drying (Martin Christ, Epsilon 2-6D LSC Plus, Osterode am Harz, Germany).

2.7. Visual Inspection

The freeze-dried cubes were evaluated and compared using six criteria; colour, infill pattern, wall straightness, wall texture, layer distinction and uniformity.

2.8. Colour Measurements

Cube colour was measured with L*a*b colour space using a colorimeter (CR-300, Minolta, Japan). The built-in light source was carefully placed on the wall of the cube, on the side without the infill pattern, until the end of measurements.

2.9. Texture Analysis

Compression tests were performed on the freeze-dried samples using a texture analyser (Stable Micro Systems, TA-HDi, Surrey, UK) equipped with a 500 N load cell and a 36 mm cylindrical aluminium probe. The samples were compressed to 60% at a rate of 1 mm/s. The compression tests were performed in two directions, from the top (infill pattern facing the direction of compression) and from the side (infill pattern facing 90° from the direction of compression). The compression tests were performed in triplicate.

2.10. Image Analysis for Particle Size after Compression

Compressed matter collected from the texture analysis was spread out on a black background to emphasise contrast and images (1800 × 4000 pixels) of the compressed cube particles were taken at a height of 30 cm. Fiji-Image J was used for image analysis. Using the software, the individual crushed pieces were counted and measured in terms of length, width and area. A ruler was used to standardise the scale bar (0.095 mm per pixel).

2.11. Scanning Electron Microscopy

Freeze-dried samples were fractured, sputter-coated with gold (Au) (Cressington Scientific Instruments, Sputter coater-108 auto, Watford, UK) and examined using a scanning electron microscope (Hitachi, FlexSEM 1000II, Tokyo, Japan) at 5 kV. Images (1280 × 960 pixels) were recorded digitally at two different magnifications, giving a pixel size of 0.992 μm/pixel and 0.198 μm/pixel.

2.12. Statistical Analysis

Results from the rheology and texture analysis were analysed by analysis of variance (ANOVA) and pairwise comparison (Tukey) using R studio (Version 1.2.5033, RStudio Inc., MA, USA). The size distribution of the fragments after compression in the texture analysis was visualised with ggplot2, with geometry density and log scale, using R studio (Version 1.2.5033, RStudio Inc., Boston, MA, USA). Principal component analysis (PCA), loading and score plot, were created using Simca17, Satorious Stedim Data Analytics AB.

3. Results

3.1. Characterisation of Isolated Fractions

The extraction method and raw material have been used in a previous study. Hence, the composition of the extracted fractions (starch, protein and fibre) and original flour was assumed to be similar to that reported in that study [16]. Starch displayed the highest yield in terms of both quantity and proportion obtained, meaning that starch was the fraction with the smallest losses during extraction (Table 2). The swelling power was negatively correlated with WSI. Under heating, fibre swelled the most, followed by starch, original flour and protein (Table 2).

3.2. Rheological Characterisation of Inks

The inks used for 3D printing were characterised by stress sweeps (Table 3). The G′ value in the linear viscoelastic region ranged between 2 and 30 kPa. It was highest for the starch-rich sample and lowest for the protein- and starch-rich sample containing no fibre. The G″ value was lowest for the protein- and starch-rich sample, whereas no significant difference was observed between the other samples. All samples showed tan (δ) << 1, indicating elasticity-dominating behaviour. The lowest loss tangent value was observed for the starch-rich sample and the highest for the protein- and starch-rich sample. Yield stress was highest for the starch-rich sample while all the other samples showed significantly lower values. The air pressure used for printing the different inks was highest for the starch-rich sample.

3.3. Printability

Twenty-five percent of the cubes printed using the protein and starch rich inks had to be discarded because of ‘ink-fail’, i.e., unstable flow resulting in poor infill pattern or low shape stability. The other inks produced more stable and uniform cubes, and ink-fails occurred at similar frequency (fibre-rich 0%, starch-rich 5.9%, protein-rich 5.3%). Around 80% of the printer fails caused by the ink were with the honeycomb infill pattern. The protein- and starch-rich cubes were the most troublesome to print and only produced “satisfactory” cubes.

3.4. Visual Inspection of 3D-Printed Samples

The 3D-printed samples were examined visually after freeze-drying (Figure 1). For texture analysis, a requirement was that all samples retained their shape and infill pattern after printing and drying. The different recipes produced different looking cubes that could be distinguished from each other. The cubes produced with the fibre-rich and starch-rich inks were light in colour, with very straight cube walls, distinct layers and a very sharp and defined infill pattern. The cubes from the protein-rich and protein- & starch-rich inks were darker in colour, with wall surfaces that were smooth and glossy. The printed layers were more distinct for the cubes with lower protein content and higher starch and/or fibre, indicating the structural role of fibre and starch. The protein- and starch-rich cubes (no fibre) showed a slight tendency to collapse due to gravitational forces and the stress build-up from deposition of additional layers on top of the lower ink filaments. This resulted in slightly curved walls of the cube. Samples containing fibre showed better shape stability, which was reflected in the sharpness of the infill pattern. The infill pattern was least sharp for the protein- & starch-rich cubes, followed by the protein-rich cubes, where swelling of the filaments was evident. The holes in the infill pattern, particularly at the corners and along the edges, were much smaller in the protein- & starch-rich and protein-rich prototypes than in the fibre-rich and starch-rich prototypes.

3.5. Colour Measurements

The colorimeter measurements confirmed the findings of the visual inspections that increased proportion of starch and decreased protein content caused a lighter cube (higher L), whereas higher protein content caused the cubes to be more yellow (higher b value) (Table 4).

3.6. Texture Analysis

Differences in peak force and peak strain based on recipe, infill pattern and direction of compression were analysed (Figure 2). The freeze-dried cubes were compressed from above, either with the infill pattern facing upwards towards the probe (from the top) or with the infill pattern facing towards the side (from the side). The peak force was significantly larger (3–5 times larger) when compressing from the top compared with from the side.
The general shape of the force vs. strain curve for most samples was similar to that of crispy foods (See Supplementary Materials, Figures S1 and S2) [19]. A clear peak with an abrupt drop in force was observed for all recipes of cubes compressed from the side. When compressed from the top, the starch-rich and fibre-rich cubes had a broader peak, with a less abrupt decrease in force during fracture. Because of the infill pattern and the resulting porous cell structure, most samples compressed from the side showed multiple peaks, with the first peak being the largest. These multiple peaks were a result of the cube breaking layer by layer, rather than in one large fracture as when compressed from the top. When compressed from the top, the peak force was highest for the protein-rich sample, followed by the protein- and starch-rich, fibre-rich and starch-rich samples, respectively. A similar trend was observed for cubes compressed from the side. Due to the curvature of the side of the cubes, the protein- and starch-rich samples were compressed only from the top. No clear differences in peak force were observed between infill patterns (honeycomb/grid).
When compressed from the top, the highest peak strain was observed for the starch-rich samples. No significant differences in peak strain were observed for cubes compressed from the side.
From ANOVA analysis of the compression test data, it was found that the infill pattern did not have a significant effect (p > 0.05) on peak force or peak strain, regardless of the direction of compression (Table 5). Recipe was significant for all variables except for the strain of samples compressed from the side. A significant interaction effect (infill × recipe) for peak force and peak strain was found for samples compressed from the top.

3.7. Analysis of Fragments after Compression

Compressing the cubes from the side produced noticeably fewer and larger fragments than compressing the cubes from the top. When compression was from the side, there were gaps between the layers because of the infill pattern, which caused fragments to break off into larger pieces. Figure 3 shows the size distribution of the fragments after compressing the cube from either the top or the side, which confirmed the observation that top compression produced smaller fragments than side compression. The size of the fragments compressed from the top followed a general trend with three peaks. At fragment size >0.1 mm2, a general decrease in the proportion of fragments was seen as the curve approached zero at particle size >10 mm2. For top compression, the distibution of fragments with area >100 mm2 was close to zero, while for side compression the geometry density for fragments >100 mm2 was between 0.03–0.08. Compression from the side produced larger variation in the size of the particles between the different recipes (see Figure 3b), where it appears that the average fragment size was the largest for the starch rich samples. For fibre-rich samples there were two peaks in the size distribution, a stronger peak at 0.05 mm2 and a second weaker peak at 30 mm2, showing a tendency for the absolute largest fragments. The higher force required for compression was negatively correlated with particle size (r = −0.623; p = 0.002) and positively correlated with the number of particles (r = 0.716; p < 0.001).
Figure 4 shows the platform of the Textural analyser (TA) with the cubes requiring the highest and the lowest force for compression, i.e., protein-rich samples with top compression and starch-rich samples with side compression, respectively. Compression from the top resulted in finer and more numerous particles that were evenly spread out on the platform, whereas compression from the side produced fewer and larger particles that were spread out in a linear fashion on the platform (Figure 4).

3.8. Scanning Electron Microscopy

The scanning electron microscopy (SEM) micrographs revealed that for all samples, the microstructure was strongly affected by freezing and freeze-drying. This could be seen from the porous structure created by ice crystals formed during freezing. At low magnification (Figure 5a), the microstructure was relatively similar between recipes. At higher magnification (Figure 5b), the protein-rich samples showed smoother surfaces and rounded shapes/edges of the pores and cavities in the microstructure. In samples with more carbohydrates (fibre-rich, starch-rich), the structure became more irregular and the almost perforated-like structure observed for the protein-rich samples was less distinct. Starch granules were visible on and inside the surfaces of the samples containing starch. The walls around the air bubbles seemed potentially thicker for the protein- and starch-rich and protein-rich recipes than for the fibre-rich and starch-rich recipes.

3.9. Principal Component Analysis (PCA)

Figure 6 shows the first two principal components (PC), which together explained 74.5% of the total variance (PC1 53%, PC2 21.5%). Protein content and variables directly associated with protein content were correlated with PC1, while variables associated with fibre and starch content were correlated with PC2. The PCA results confirmed some of the observations and correlations seen in the empirical results. In Figure 6b, the samples are grouped by their recipe and divided further within the groupings by compression direction (side or top). Higher protein content was correlated with increased compression force and loss factor (tan d). The protein-rich and protein- and starch-rich samples represented one side of the PC1, and the fibre-rich and starch-rich samples represented the other side. The fibre-rich and starch-rich samples were associated with higher water content in ink, lighter colour, more distinct layers, straight walls and higher G′. At higher force, a greater number of fragments was observed, which was inversely correlated to the area of particles. Fibre content was correlated with larger fragments, very well-defined and uniform cubes and increased G″. Thus, higher elastic modulus may be a determining factor for wall straightness and 3D printed cube stability.
Higher strain and higher yield stress were both associated with higher starch content. As already mentioned, the starch-rich inks required the highest pressure to flow during printing.

4. Discussion

The different compositions of inks were adjusted to create printable inks with good flow and shape stability properties. The water content of the inks was increased with fibre and starch content, which correlated well with the swelling power of the fractions. Based on visual inspection, the infill pattern was least distinct for the protein- and starch-rich samples, with irregular size and shape of the holes within the pattern. The protein- and starch-rich sample also had the highest percentage of ink-failure due to unstable flow and low shape stability. This suggests that the fibre might have a stabilising effect, contributing to the shape stability of the cubes. During ink production, the starch is heated to 60 °C, which is below the gelatinisation temperature of faba bean starch (67–72 °C [20]). Heating the starch to gelatinisation has been found to enhance the structural function of starch in cookie systems [21]. Structure and shape instability, particularly for the protein- and starch-rich cubes (with no fibre), may have been caused by the starch not fully gelatinising because of insufficient heating temperature during the production of the bio-inks.
Due to difficulties such as wall slip and material escaping the gap during viscosity measurements of highly viscous or semi-solid materials, oscillatory tests at small deformations were used rather than a rotational rheometer [22]. All inks showed predominantly solid-like behaviour (G′ > G″), with G′ values in the approximate range 2–30 kPa. A similar range of G′ values has previously been reported for printable pastes, and significantly lower G′ values (down to 10 Pa) for pastes forming self-standing cylinders [5,8]. The filaments of the samples with the lowest G′ (protein- and starch-rich, protein-rich) seemed to swell more and showed a slight tendency to collapse. These two samples also had the highest loss tangent values, which could potentially explain their lower dimensional stability. The starch-rich samples showed higher yield stress than the other inks. Similarly, the pressure needed to print the starch-rich cubes was significantly higher than for the other inks. A correlation between high yield stress and high printing pressure has been observed by others [5].
High yield stress or high storage modulus alone is not always sufficient to create a good ink, e.g., a previous study found that two inks with similar G′ and phase angles showed different shape stability after printing [5]. Hence, G′ and phase angle alone are not always sufficient to determine the suitability of a material for 3D printing. Combining these results with the rheological characterisation of our inks, it appears that a combination of high G′, high yield stress and low phase angle is required to provide an ink with good shape stability after printing.
After printing and freeze-drying, the texture of the cubes was analysed by compression tests performed along two different axes of the cubes. The effect of orientation was investigated on the cubes standing, with the infill pattern facing upwards (compressed from the top), and lying on their side, with the infill pattern facing 90° from the axis of compression (compressed from the side). A significantly higher peak force (3- to 7-fold higher) was recorded as the cubes were compressed from the top compared with from the side. The higher force required for top compression is likely due to the wall layers being stacked directly on top of each other, creating a denser wall structure that requires more force to compress. For compression from the side, there are gaps between the layers because of the infill pattern, which will reduce the force required for compression until fracture. The multiple peaks observed from the force vs. strain graphs for samples compressed from the side, but not the top, was a result of the infill pattern. The multiple peaks also related to the size and spreading of pieces after compression, as seen in Figure 3. The samples compressed from the side spread out in a linear fashion as multiple larger pieces that likely relate to the multiple peaks observed in the force vs. strain graphs (Figures S1 and S2).
Scanning electron microscopy of the freeze-dried samples revealed that microstructure was strongly affected by the freezing and freeze-drying. The microstructure consisted of cavities with an approximate diameter of 30–70 μm. A similar microstructure in freeze-dried gelatin products has been observed by others [23]. The porous structure was more irregular for the samples with more fibre and less protein and these samples also had less smooth surfaces. The more irregular structure could potentially explain the lower peak force seen for the starch-rich and fibre-rich samples. Fracture is generally believed to occur by the propagation of cracks, which form at or close to defects and weak spots acting as stress concentrators during deformation [19,24]. Hence, it could be hypothesised that the increased heterogeneity of the starch-rich and fibre-rich samples contributed to their lower peak force.
The SEM micrographs also indicated that pore walls were thicker for the protein-rich and protein- and starch-rich samples than for the starch-rich and fibre-rich samples. Further studies, e.g., by X-ray tomography, would have been needed to confirm this. Nonetheless, increased cell diameter and cell wall thickness have previously been correlated to reduced crushing/breaking stress and compression modulus of cellular corn starch and corn-based extrudates [25,26,27].
Crispiness and crunchiness are textural properties directly related to microstructure and macrostructure that influence the mechanical and fracture properties of solid food [19]. A higher force was required for compression from the top in this study, indicating that the cubes would be perceived as harder. A previous combination of sensory evaluation and texture analysis of almonds showed that almonds perceived as more brittle and less hard by sensory evaluation required less force for compression and displayed more deformation peaks in the textural analysis [28]. In this study, the cubes compressed from the side required less force, with more deformation peaks present, indicating that side compression of the cube may enhance the perceived crispness and brittleness of the products and perhaps be a preferred characteristic in a future food product.
In a laboratory taste test on the cubes of the four different recipes, the fibre-rich and starch-rich samples were perceived as more neutral in flavour and with a crispier texture. The protein-rich and protein- and starch-rich samples were rated similar to each other and were less preferred than the other samples, both in terms of flavour and texture. The protein-rich cubes were perceived by the tasters to have a hard texture that became clayey after chewing. None of the different recipes produced cubes that were perceived as beany in flavour.

5. Conclusions

This study showed that protein-, starch- and fibre-rich fractions extracted from faba beans can be successfully combined to create nutritious printable inks for extrusion-based 3D printing. Inks with lower loss tangent values showed higher shape stability. Ink composition had a clear effect on textural properties of the freeze-dried 3D-printed objects, while infill pattern (honeycomb/grid) had no effect. Increased heterogeneity of microstructure seemed to be associated with decreased peak force during compression. Further research is needed to evaluate the shape stability during other post-treatment steps, such as oven baking or frying. Sensory and consumer testing will also be necessary to optimise the product.

Supplementary Materials

The following are available online at https://www.mdpi.com/article/10.3390/pr10030466/s1, Figure S1: Force vs. Strain graphs from compression tests on freeze-dried samples compressed from the top, Figure S2: Force vs. Strain graphs from compression tests on freeze-dried samples compressed from the side.

Author Contributions

Conceptualization, K.N., M.J. and M.L.; validation, K.N. and M.J.; formal analysis, K.N. and M.J.; investigation, K.N., M.J. and F.K.; resources, M.L.; writing—original draft preparation, K.N. and M.J.; writing—review and editing, K.N., M.J. and M.L.; visualization, K.N. and M.J.; supervision, M.L.; funding acquisition, M.L. All authors have read and agreed to the published version of the manuscript.

Funding

This research was funded by FORMAS Texturized legume-based food product by recombining fractions (2018-01869) and FORMAS Gelation properties of protein from Swedish legumes (2017-00426); and Trees and Crops for the Future (TC4F).

Data Availability Statement

Data is contained within the article.

Conflicts of Interest

The authors declare no conflict of interest. The funders had no role in the design of the study; in the collection, analyses or interpretation of data; in the writing of the manuscript or in the decision to publish the results.

References

  1. Zhao, L.; Zhang, M.; Chitrakar, B.; Adhikari, B. Recent advances in functional 3D printing of foods: A review of functions of ingredients and internal structures. Crit. Rev. Food Sci. Nutr. 2020, 61, 3489–3503. [Google Scholar] [CrossRef]
  2. Godoi, F.C.; Bhandari, B.; Prakash, S.; Zhang, M. Fundamentals of 3D Food Printing and Applications; Academic Press: Cambridge, MA, USA, 2018; ISBN 012814565X. [Google Scholar]
  3. Lille, M.; Kortekangas, A.; Heiniö, R.-L.; Sozer, N. Structural and Textural Characteristics of 3D-Printed Protein- and Dietary Fibre-Rich Snacks Made of Milk Powder and Wholegrain Rye Flour. Foods 2020, 9, 1527. [Google Scholar] [CrossRef] [PubMed]
  4. Meisenzahl, M. A Startup is 3D Printing Plant-Based Steaks to Recreate the Taste and Texture of the Real Thing—See How They Do It. Available online: https://www.businessinsider.com/redefine-meat-3d-printed-plant-based-faux-steaks-in-photos-2020-9?r=US&IR=T (accessed on 20 September 2021).
  5. Lille, M.; Nurmela, A.; Nordlund, E.; Metsä-Kortelainen, S.; Sozer, N. Applicability of protein and fiber-rich food materials in extrusion-based 3D printing. J. Food Eng. 2018, 220, 20–27. [Google Scholar] [CrossRef]
  6. Guo, C.; Zhang, M.; Bhandari, B. Model Building and Slicing in Food 3D Printing Processes: A Review. Compr. Rev. Food Sci. Food Saf. 2019, 18, 1052–1069. [Google Scholar] [CrossRef] [PubMed]
  7. Zhu, S.; Stieger, M.A.; van der Goot, A.J.; Schutyser, M.A.I. Extrusion-based 3D printing of food pastes: Correlating rheological properties with printing behaviour. Innov. Food Sci. Emerg. Technol. 2019, 58, 102214. [Google Scholar] [CrossRef]
  8. Nijdam, J.J.; LeCorre-Bordes, D.; Delvart, A.; Schon, B.S. A rheological test to assess the ability of food inks to form dimensionally stable 3D food structures. J. Food Eng. 2021, 291, 110235. [Google Scholar] [CrossRef]
  9. Mezger, T. The Rheology Handbook, 4th ed.; Vincentz Network: Hanover, Germany, 2014; ISBN 3748603703. [Google Scholar]
  10. Kim, H.W.; Bae, H.; Park, H.J. Classification of the printability of selected food for 3D printing: Development of an assessment method using hydrocolloids as reference material. J. Food Eng. 2017, 215, 23–32. [Google Scholar] [CrossRef]
  11. Liu, Z.; Bhandari, B.; Prakash, S.; Mantihal, S.; Zhang, M. Linking rheology and printability of a multicomponent gel system of carrageenan-xanthan-starch in extrusion based additive manufacturing. Food Hydrocoll. 2019, 87, 413–424. [Google Scholar] [CrossRef]
  12. Liu, Z.; Zhang, M.; Bhandari, B.; Yang, C. Impact of rheological properties of mashed potatoes on 3D printing. J. Food Eng. 2018, 220, 76–82. [Google Scholar] [CrossRef] [Green Version]
  13. Mantihal, S.; Prakash, S.; Bhandari, B. Textural modification of 3D printed dark chocolate by varying internal infill structure. Food Res. Int. 2019, 121, 648–657. [Google Scholar] [CrossRef]
  14. Liu, Z.; Dick, A.; Prakash, S.; Bhandari, B.; Zhang, M. Texture Modification of 3D Printed Air-Fried Potato Snack by Varying Its Internal Structure with the Potential to Reduce Oil Content. Food Bioprocess Technol. 2020, 13, 564–576. [Google Scholar] [CrossRef]
  15. Chen, J.; Mu, T.; Goffin, D.; Blecker, C.; Richard, G.; Richel, A.; Haubruge, E. Application of soy protein isolate and hydrocolloids based mixtures as promising food material in 3D food printing. J. Food Eng. 2019, 261, 76–86. [Google Scholar] [CrossRef]
  16. Johansson, M.; Johansson, D.; Ström, A.; Ryden, J.; Nilsson, K.; Karlsson, J.; Moriana, R.; Langton, M. Effect of Starch and Fibre on Faba Bean Protein Gel Characteristics; Swedish University of Agricultural Sciences: Uppsala, Sweden, 2022; status (manuscript submitted). [Google Scholar]
  17. Schoch, T.J. Measuring the useful properties of starch. Starch-Stärke 1959, 11, 156–162. [Google Scholar] [CrossRef]
  18. Muñoz, L.A.; Pedreschi, F.; Leiva, A.; Aguilera, J.M. Loss of birefringence and swelling behavior in native starch granules: Microstructural and thermal properties. J. Food Eng. 2015, 152, 65–71. [Google Scholar] [CrossRef]
  19. Luyten, H.; Plijter, J.J.; Van Vliet, T.O.N. Crispy/crunch crust of cellular solid foods: A literature review with discussion. J. Texture Stud. 2004, 35, 445–492. [Google Scholar] [CrossRef]
  20. Nilsson, K.; Sandström, C.; Özeren, H.; Vilaplana, F.; Hedenqvist, M.; Langton, M. Physiochemical and Thermal Characterisation of Faba Bean Starch; Swedish University of Agricultural Sciences: Uppsala, Sweden, 2022; status (manuscript submitted). [Google Scholar]
  21. Kulp, K.; Olewnik, M.; Lorenz, K.; Collins, F. Starch Functionality in Cookie Systems. Starch-Stärke 1991, 43, 53–57. [Google Scholar] [CrossRef]
  22. Rheological Techniques for Yield Stress Analysis. Available online: http://www.tainstruments.com/pdf/literature/RH025.pdf (accessed on 19 February 2022).
  23. Stevenson, M.; Long, J.; Guerrero, P.; de la Caba, K.; Seyfoddin, A.; Etxabide, A. Development and characterization of ribose-crosslinked gelatin products prepared by indirect 3D printing. Food Hydrocoll. 2019, 96, 65–71. [Google Scholar] [CrossRef]
  24. Dille, M.J.; Draget, K.I.; Hattrem, M.N. 9—The effect of filler particles on the texture of food gels. In Modifying Food Texture; Chen, J., Rosenthal, A., Eds.; Woodhead Publishing Series in Food Science, Technology and Nutrition; Woodhead Publishing: Sawston, UK, 2015; pp. 183–200. ISBN 978-1-78242-333-1. [Google Scholar]
  25. Agbisit, R.; Alavi, S.; Cheng, E.; Herald, T.; Trater, A. Relationships between microstructure and mechanical properties of cellular cornstarch extrudates. J. Texture Stud. 2007, 38, 199–219. [Google Scholar] [CrossRef]
  26. Barrett, A.H.; Peleg, M. Extrudate Cell Structure-Texture Relationships. J. Food Sci. 1992, 57, 1253–1257. [Google Scholar] [CrossRef]
  27. Chanvrier, H.; Jakubczyk, E.; Gondek, E.; Gumy, J.-C. Insights into the texture of extruded cereals: Structure and acoustic properties. Innov. Food Sci. Emerg. Technol. 2014, 24, 61–68. [Google Scholar] [CrossRef]
  28. Varela, P.; Salvador, A.; Fiszman, S. On the assessment of fracture in brittle foods: The case of roasted almonds. Food Res. Int. 2008, 41, 544–555. [Google Scholar] [CrossRef]
Figure 1. 3D printed cubes (14 × 14 × 14 mm) after freeze-drying.
Processes 10 00466 g001
Figure 2. Peak force and corresponding strain (peak strain) from compression tests on 3D-printed samples (a) compressed from above with the infill pattern facing upwards and (b) compressed from above with the infill pattern facing sideways. Different letters (a, b, c) within panels indicate significant differences (p < 0.05). N.A.—not applicable.
Processes 10 00466 g002
Figure 3. Density diagrams showing size distribution of areal size of fragments after Textural analyser (TA) (a) from the top and (b) from the side. F Fibre-rich, P Protein-rich, S Starch-rich, PS protein- and starch-rich, G Grid, H honeycomb, T Top, S side.
Processes 10 00466 g003
Figure 4. Images of the two samples that differed most after compression: (a) protein-rich recipe with grid infill pattern compressed from the top (PGT) and (b) starch-rich recipe with honeycomb infill pattern compressed from the side (SHS).
Processes 10 00466 g004
Figure 5. SEM micrographs of the fracture surface of freeze-dried printed samples at different magnification (a,b). Scale bar (a): 500 μm (0.992 μm/pixel), (b): 100 μm (0.198 μm/pixel).
Processes 10 00466 g005
Figure 6. Principal component (PC) analysis (a) component plot and (b) samples in PC plot. F Fibre-rich, P Protein-rich, S Starch-rich, PS protein- and starch-rich, G Grid, H honeycomb, T Top, S side.
Processes 10 00466 g006
Table 1. Composition of the different inks used for 3D printing.
Ink Protein Fraction (%)Starch Fraction (%)Fibre Fraction (%)Water (%)
Fibre-rich7.87.87.876.7
Starch-rich4.518.24.572.8
Protein-rich21.75.45.467.5
Protein- & starch-rich25.012.5062.5
Table 2. Properties of faba bean cotyledon flour and isolated fractions; starch, protein and fibre.
Extracted Yield (%) *Moisture Content (%)Water Soluble Index (%)Swelling Power (g/g)
Original flourNA10.9 ± 0.2 d31.6 ± 0.1 c2.4 ± 0.0 a,b
Protein55.5 ± 3.7 b6.4 ± 0.1 b84.1 ± 0.4 d1.1 ± 0.1 a
Starch82.6 ± 0.1 c4.0 ± 0.3 a2.0 ± 0.1 b3.7 ± 0.0 b
Fibre30.1 ± 1.3 a7.4 ± 0.1 c0.5 ± 0.1 a12.1 ± 0.8 c
* Proportion of fraction isolated from the original flour. NA—not applicable. Different letters (a, b, c, d) within columns indicate significant differences (p < 0.05).
Table 3. Results of stress sweep measurements and printing pressure for each ink. The storage modulus (G′), loss modulus (G″) and tan(δ) values were calculated as averages over the linear viscoelastic region. The apparent yield stress was defined as the stress at 5% loss in G′.
SampleG′ (kPa)G″ (kPa)Tan (δ)Apparent Yield Stress (Pa)Printing Pressure (kPa)
Fibre-rich17.37 ± 0.81 b1.48 ± 0.06 a0.085 ± 0.000 c27.6 ± 2.9 b69 ± 2 c
Starch-rich29.48 ± 1.03 a1.68 ± 0.08 a0.057 ± 0.001 d130.2 ± 5.2 a183 ± 9 a
Protein-rich7.51 ± 0.47 c1.63 ± 0.08 a0.218 ± 0.001 b17.9 ± 2.4 b85 ± 7 b
Protein- & starch-rich2.12 ± 0.21 d0.61 ± 0.04 b0.284 ± 0.008 a18.6 ± 3.2 b86 ± 11 b
Different letters (a, b, c, d) within columns indicate significant differences (p < 0.05).
Table 4. L*a*b* colour values of cubes made from the different inks (L: lightness; a: red/green value; b: blue/yellow value).
SampleLaB
Fibre-rich83.9 ± 0.5 c−9.4 ± 0.1 b42.2 ± 0.3 b
Starch-rich85.1 ± 0.5 c−10.5 ± 0.2 a40.0 ± 0.2 a
Protein-rich79.1 ± 0.6 b−7.2 ± 0.3 c46.1 ± 0.3 c
Protein- & starch-rich75.4 ± 1.1 a−6.1 ± 0.4 d47.9 ± 0.3 d
Different letters (a, b, c, d) within columns indicate significant differences (p < 0.05).
Table 5. p-values from ANOVA analysis of compression tests investigating the effect of recipe, infill pattern and their interaction. Significant values (p < 0.05) are highlighted in bold.
Peak ForcePeak Strain
TopSideTopSide
Infill0.960.410.0800.18
Recipe<0.00010.0019<0.00010.57
Infill × Recipe0.0320.140.0210.48
Publisher’s Note: MDPI stays neutral with regard to jurisdictional claims in published maps and institutional affiliations.

