
Design and System Evaluation of Mixed Waste Plastic Gasification Process Based on Integrated Gasification Combined Cycle System


Abstract
:1. Introduction
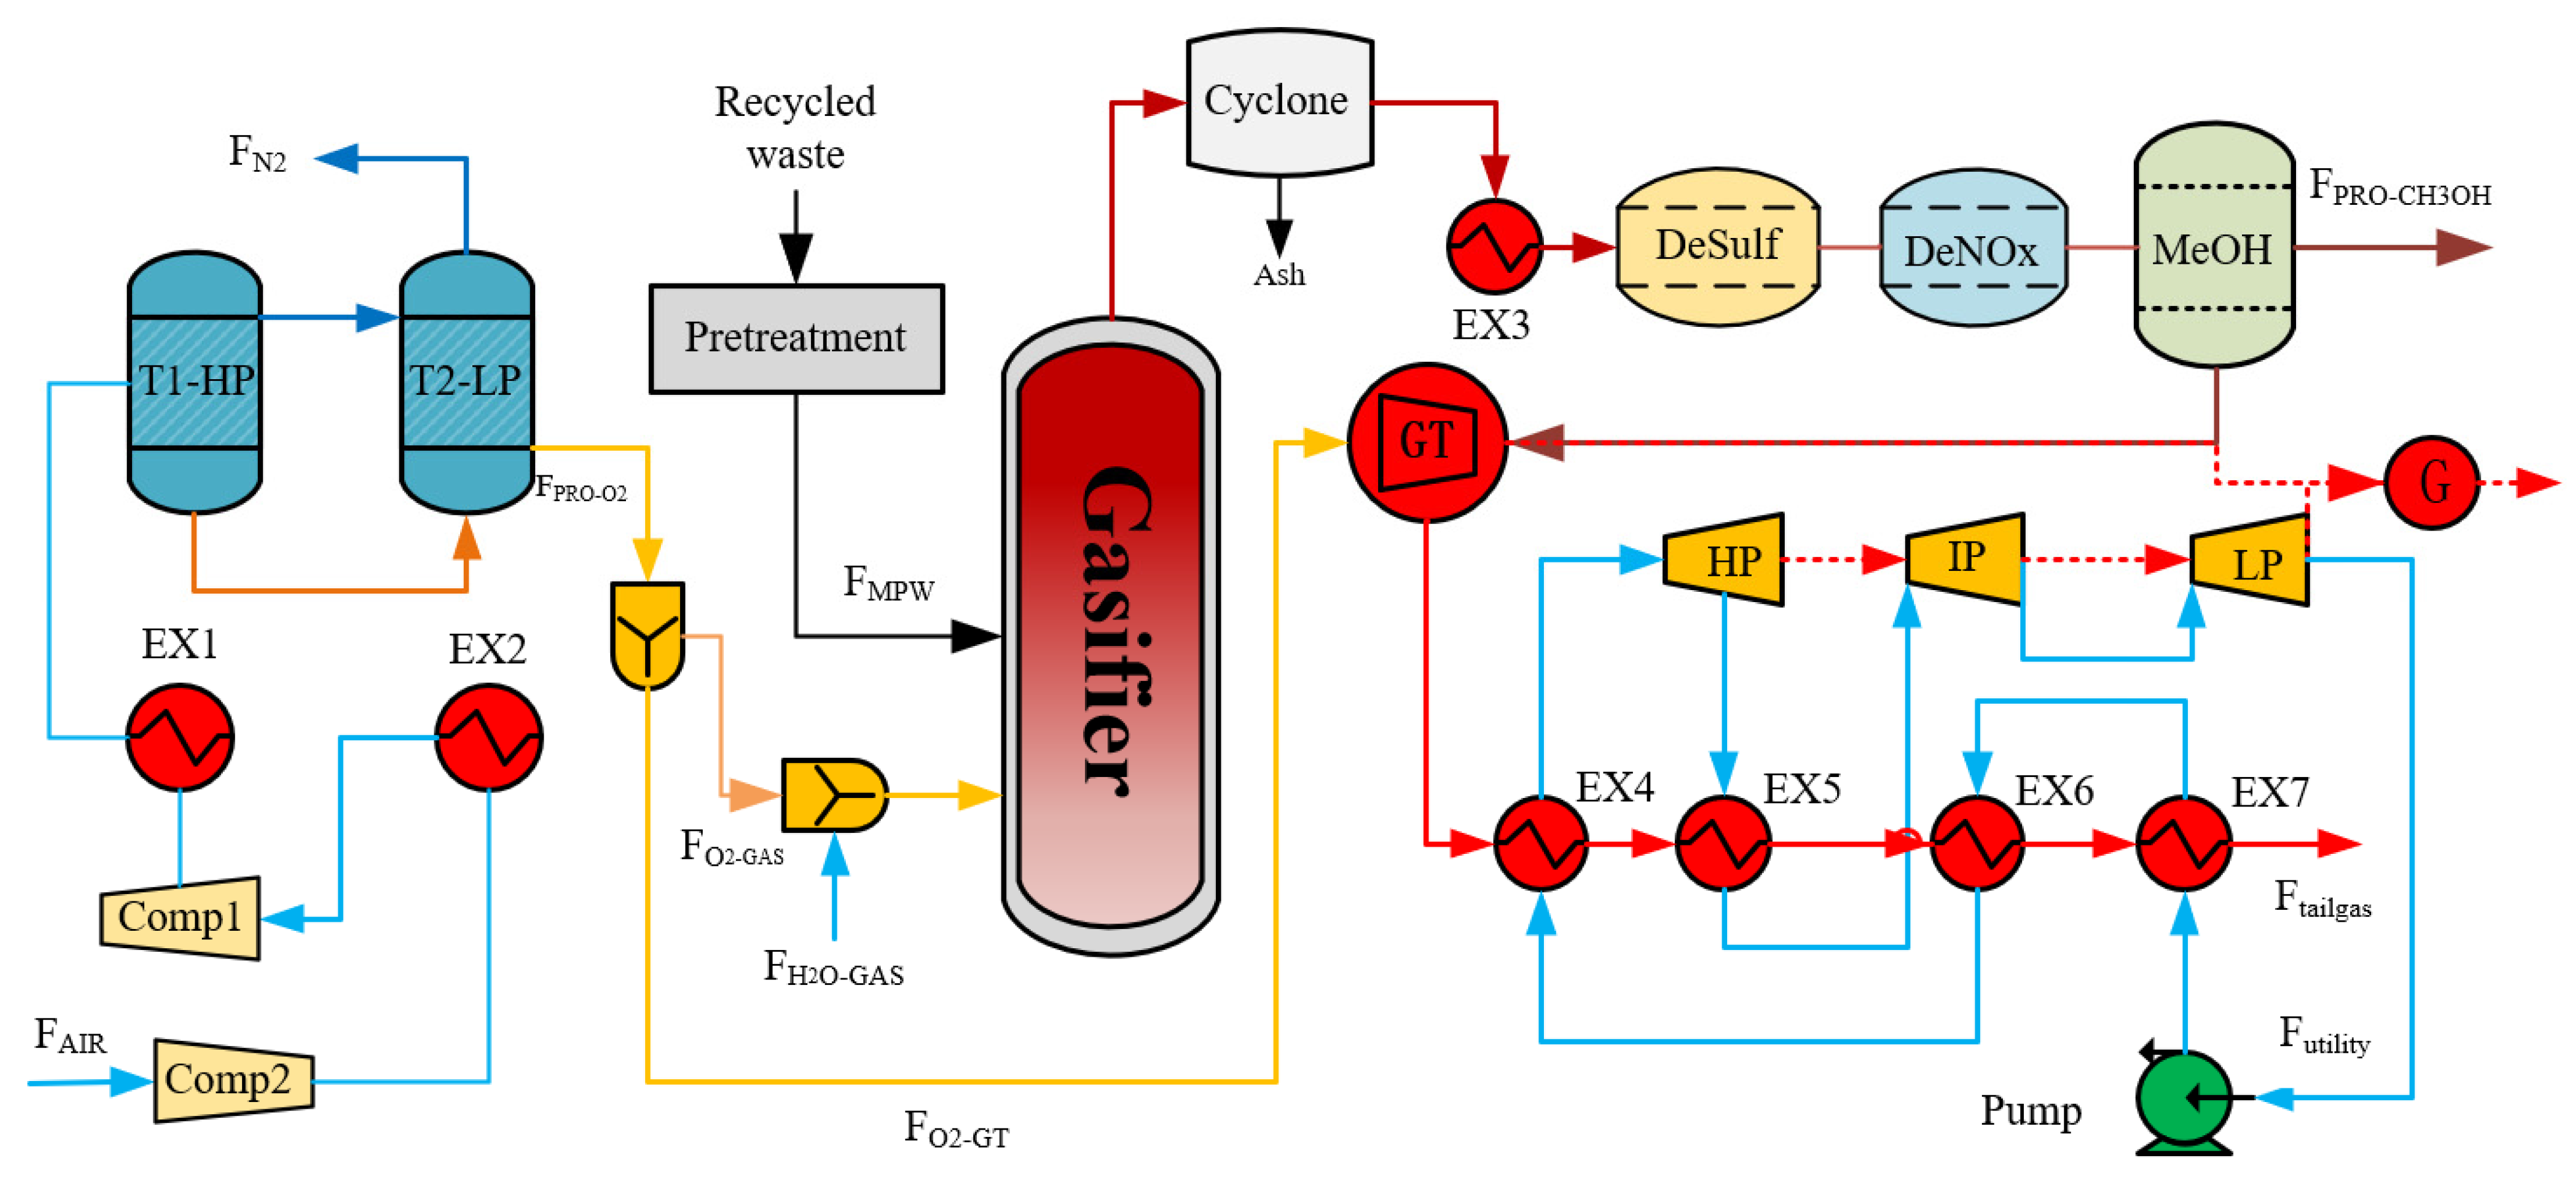
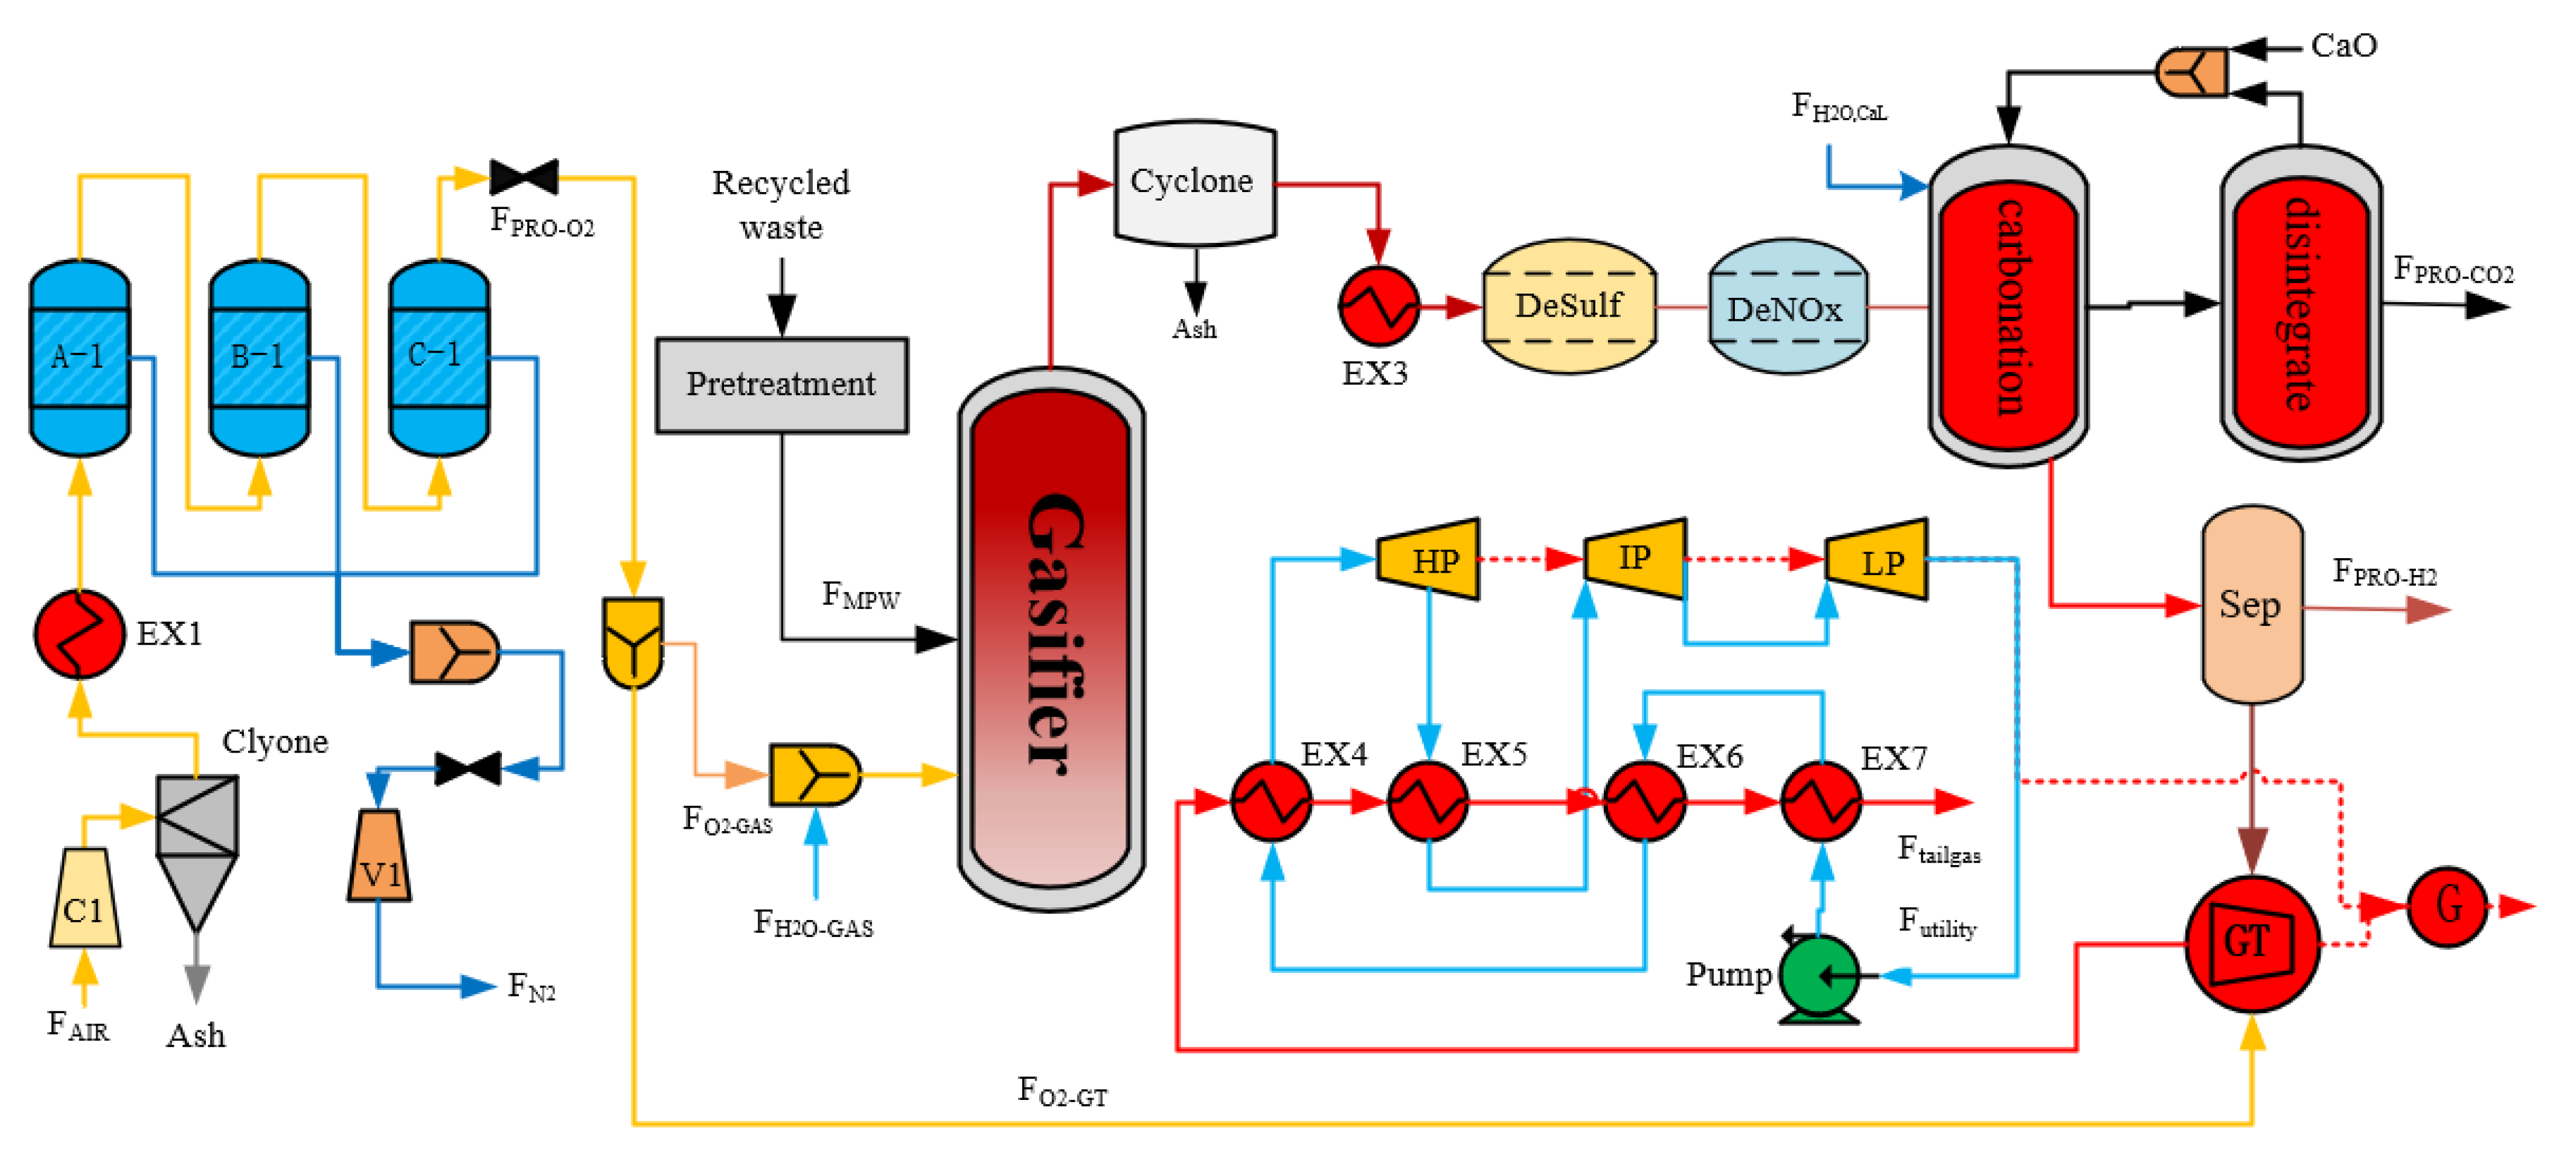
2. Process Design
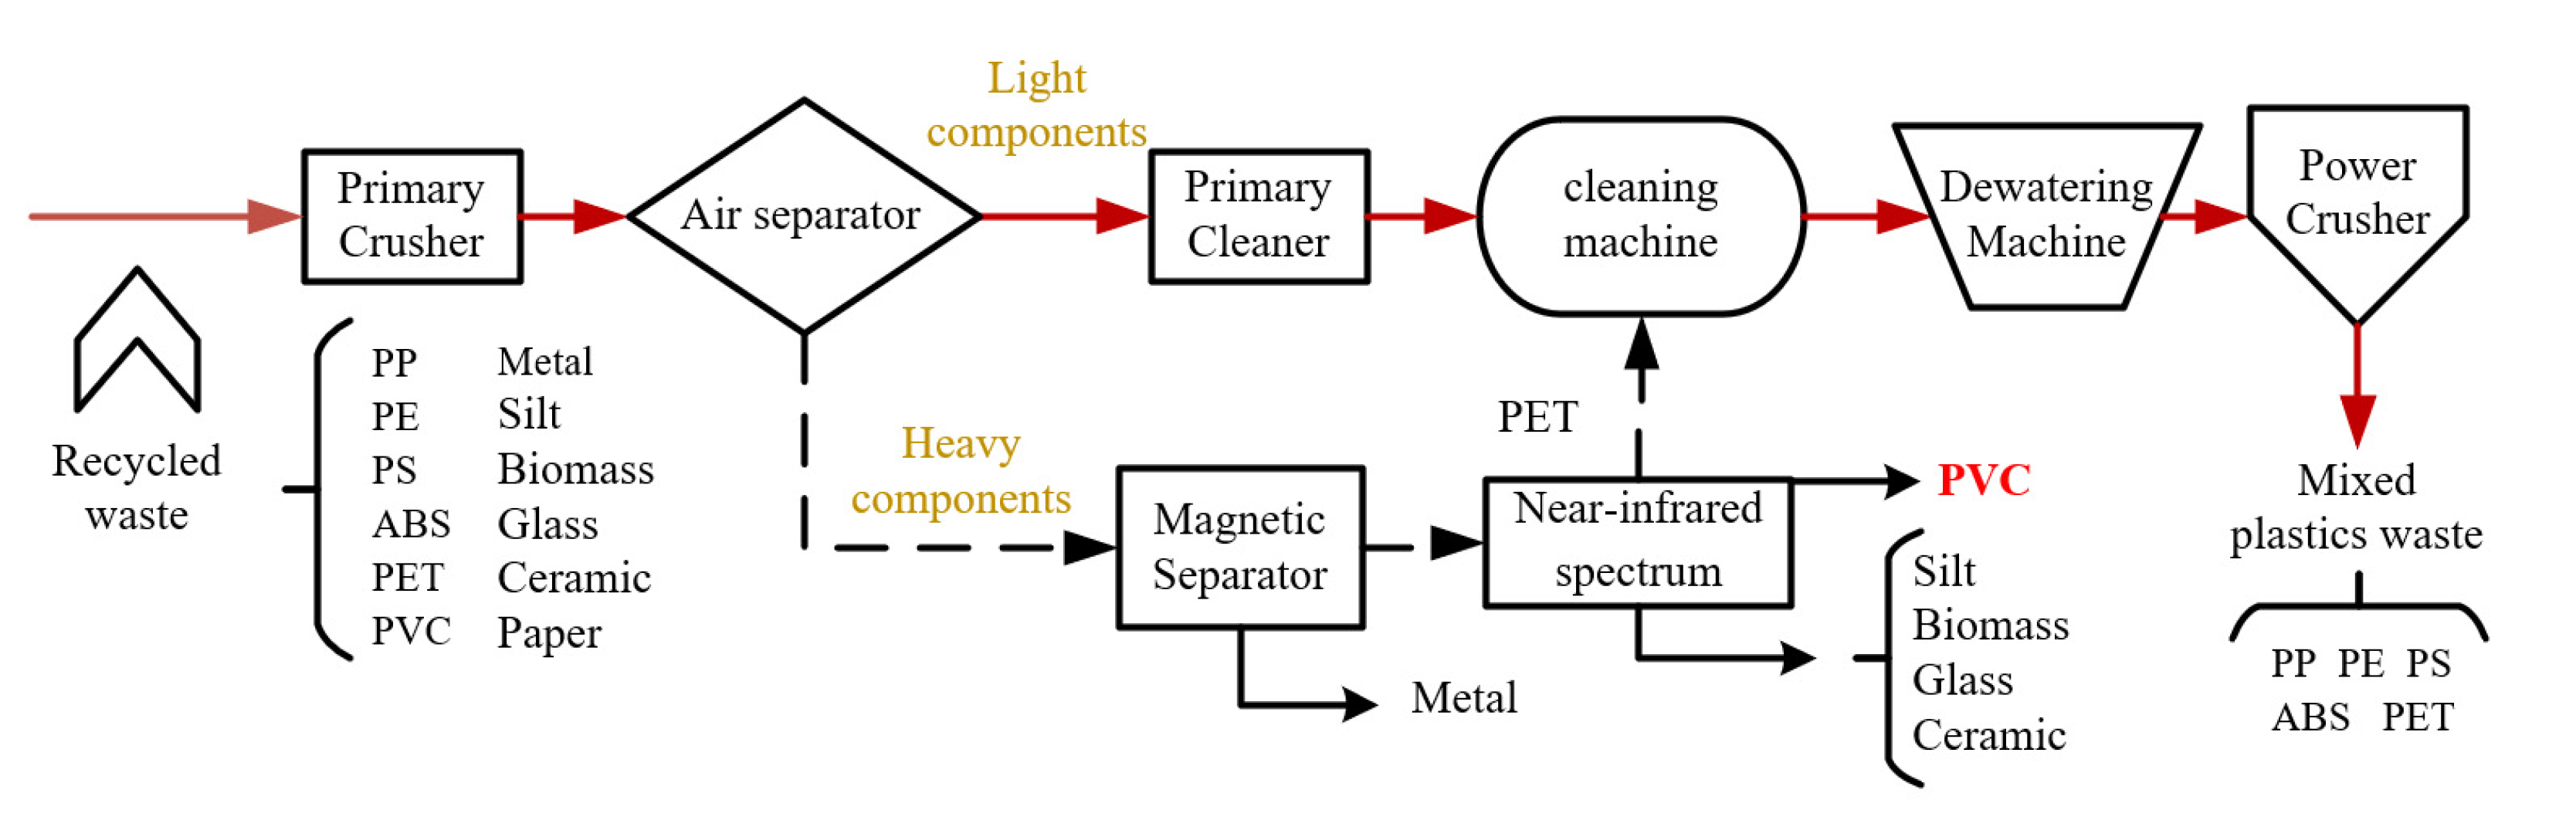
2.1. Pretreatment Process
2.2. Mixed Plastic Waste Gasification Process
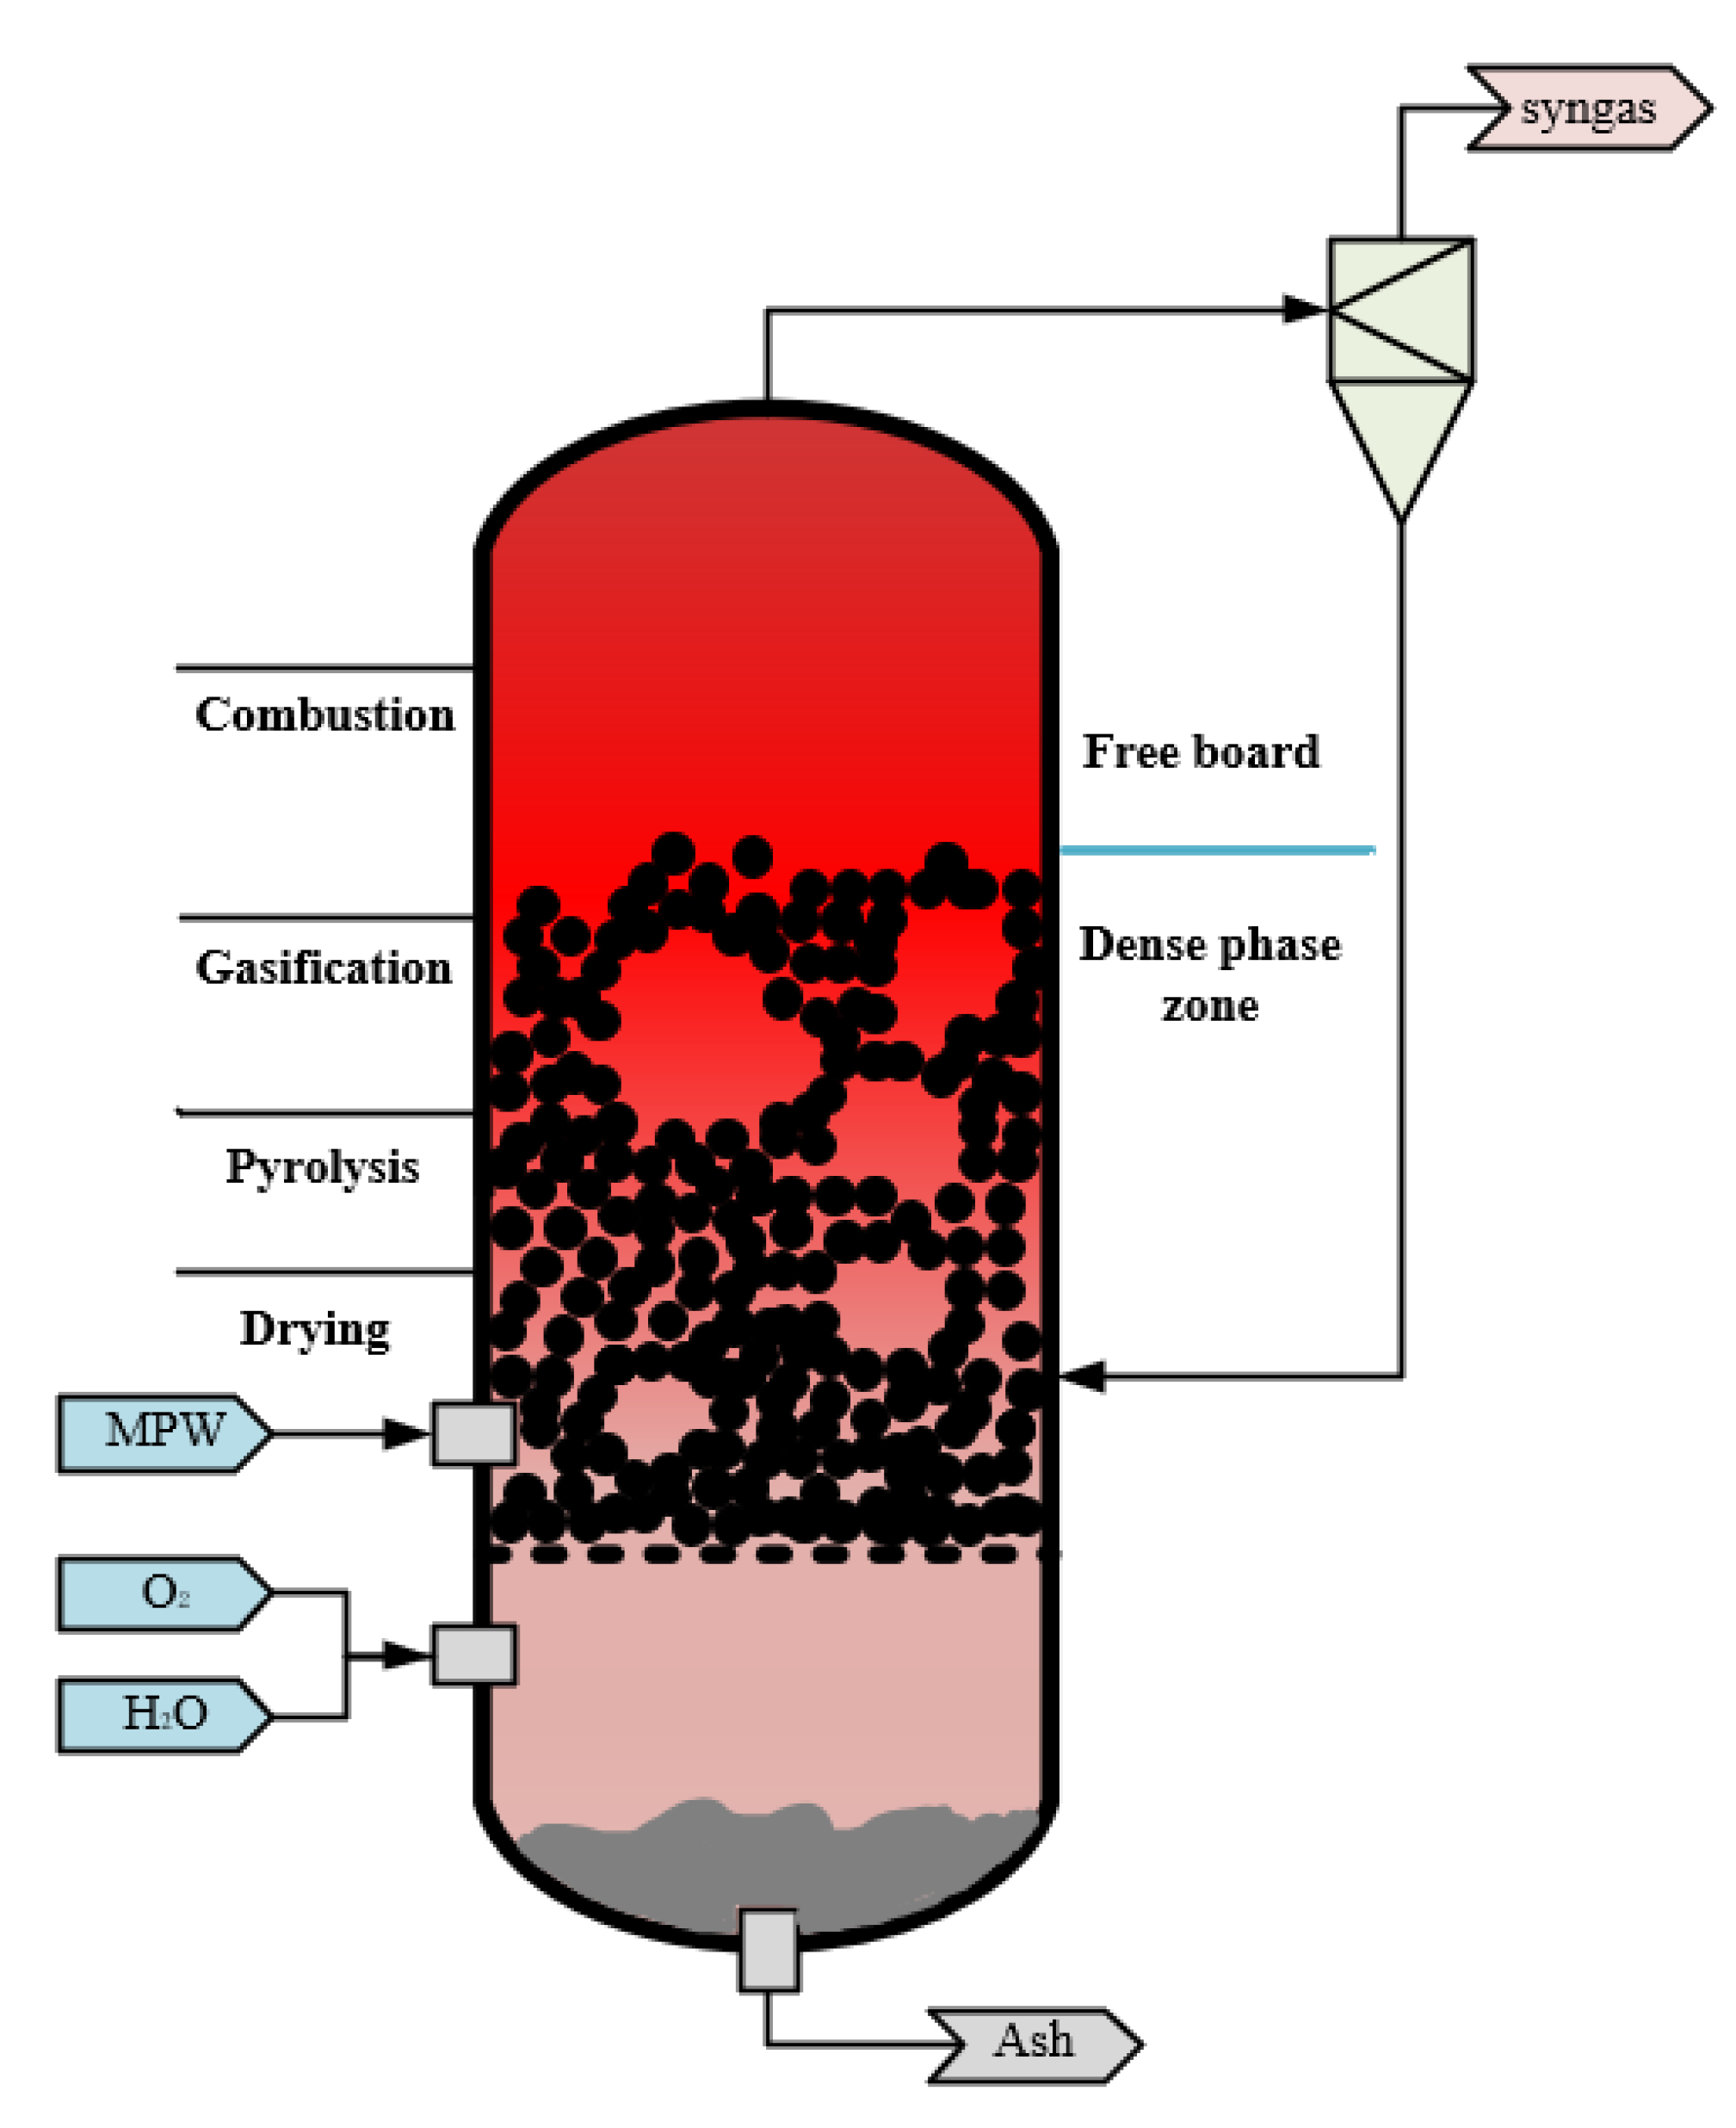
- Drying: The moisture content of the waste plastic is kept below 10% by a pretreatment process. The plastic is fed into the dense phase zone instantly, where no chemical reaction takes place, and the absorbed heat is used for the phase change process of the water. This is a very fast process due to the low moisture content of the plastic.
- Pyrolysis: A complex heat-absorbing chemical reaction occurs in this process. Volatiles and solid or carbonized residues are formed, which are influenced by process conditions such as heating rate and temperature. The raw material composition and particle size determine the distribution of the product.
- 3.
- Combustion: At elevated temperatures and in the presence of oxygen, the oxidizer reacts with the raw material in a non-homogeneous manner, producing carbon monoxide and steam. The oxidation depends on the chemical composition of the feedstock, the nature of the oxidant used and the operating conditions. This step is mainly heat release, and the energy released provides the heat required for the process.
- 4.
- Gasification: The steam promotes two reactions at high oxygen-free temperatures: semi-coke and tar gasification, which produces large amounts of H2.
- The gasification process is in steady state. The temperature, pressure, import and export stream of the fluidized bed reactor are kept constant.
- The ash in the feedstock is divided into inert components, which do not participate in the reaction of the gasification process.
- The MPW are instantaneously and completely mixed in the gasifier, and the products’ gas composition are considered as H2, CO, CO2, NO, NO2, H2S, H2O, CH4, N2, NH3, SO2, COS. Solids are considered as ash and a small amount of unburned carbon.
2.3. Syngas Purification
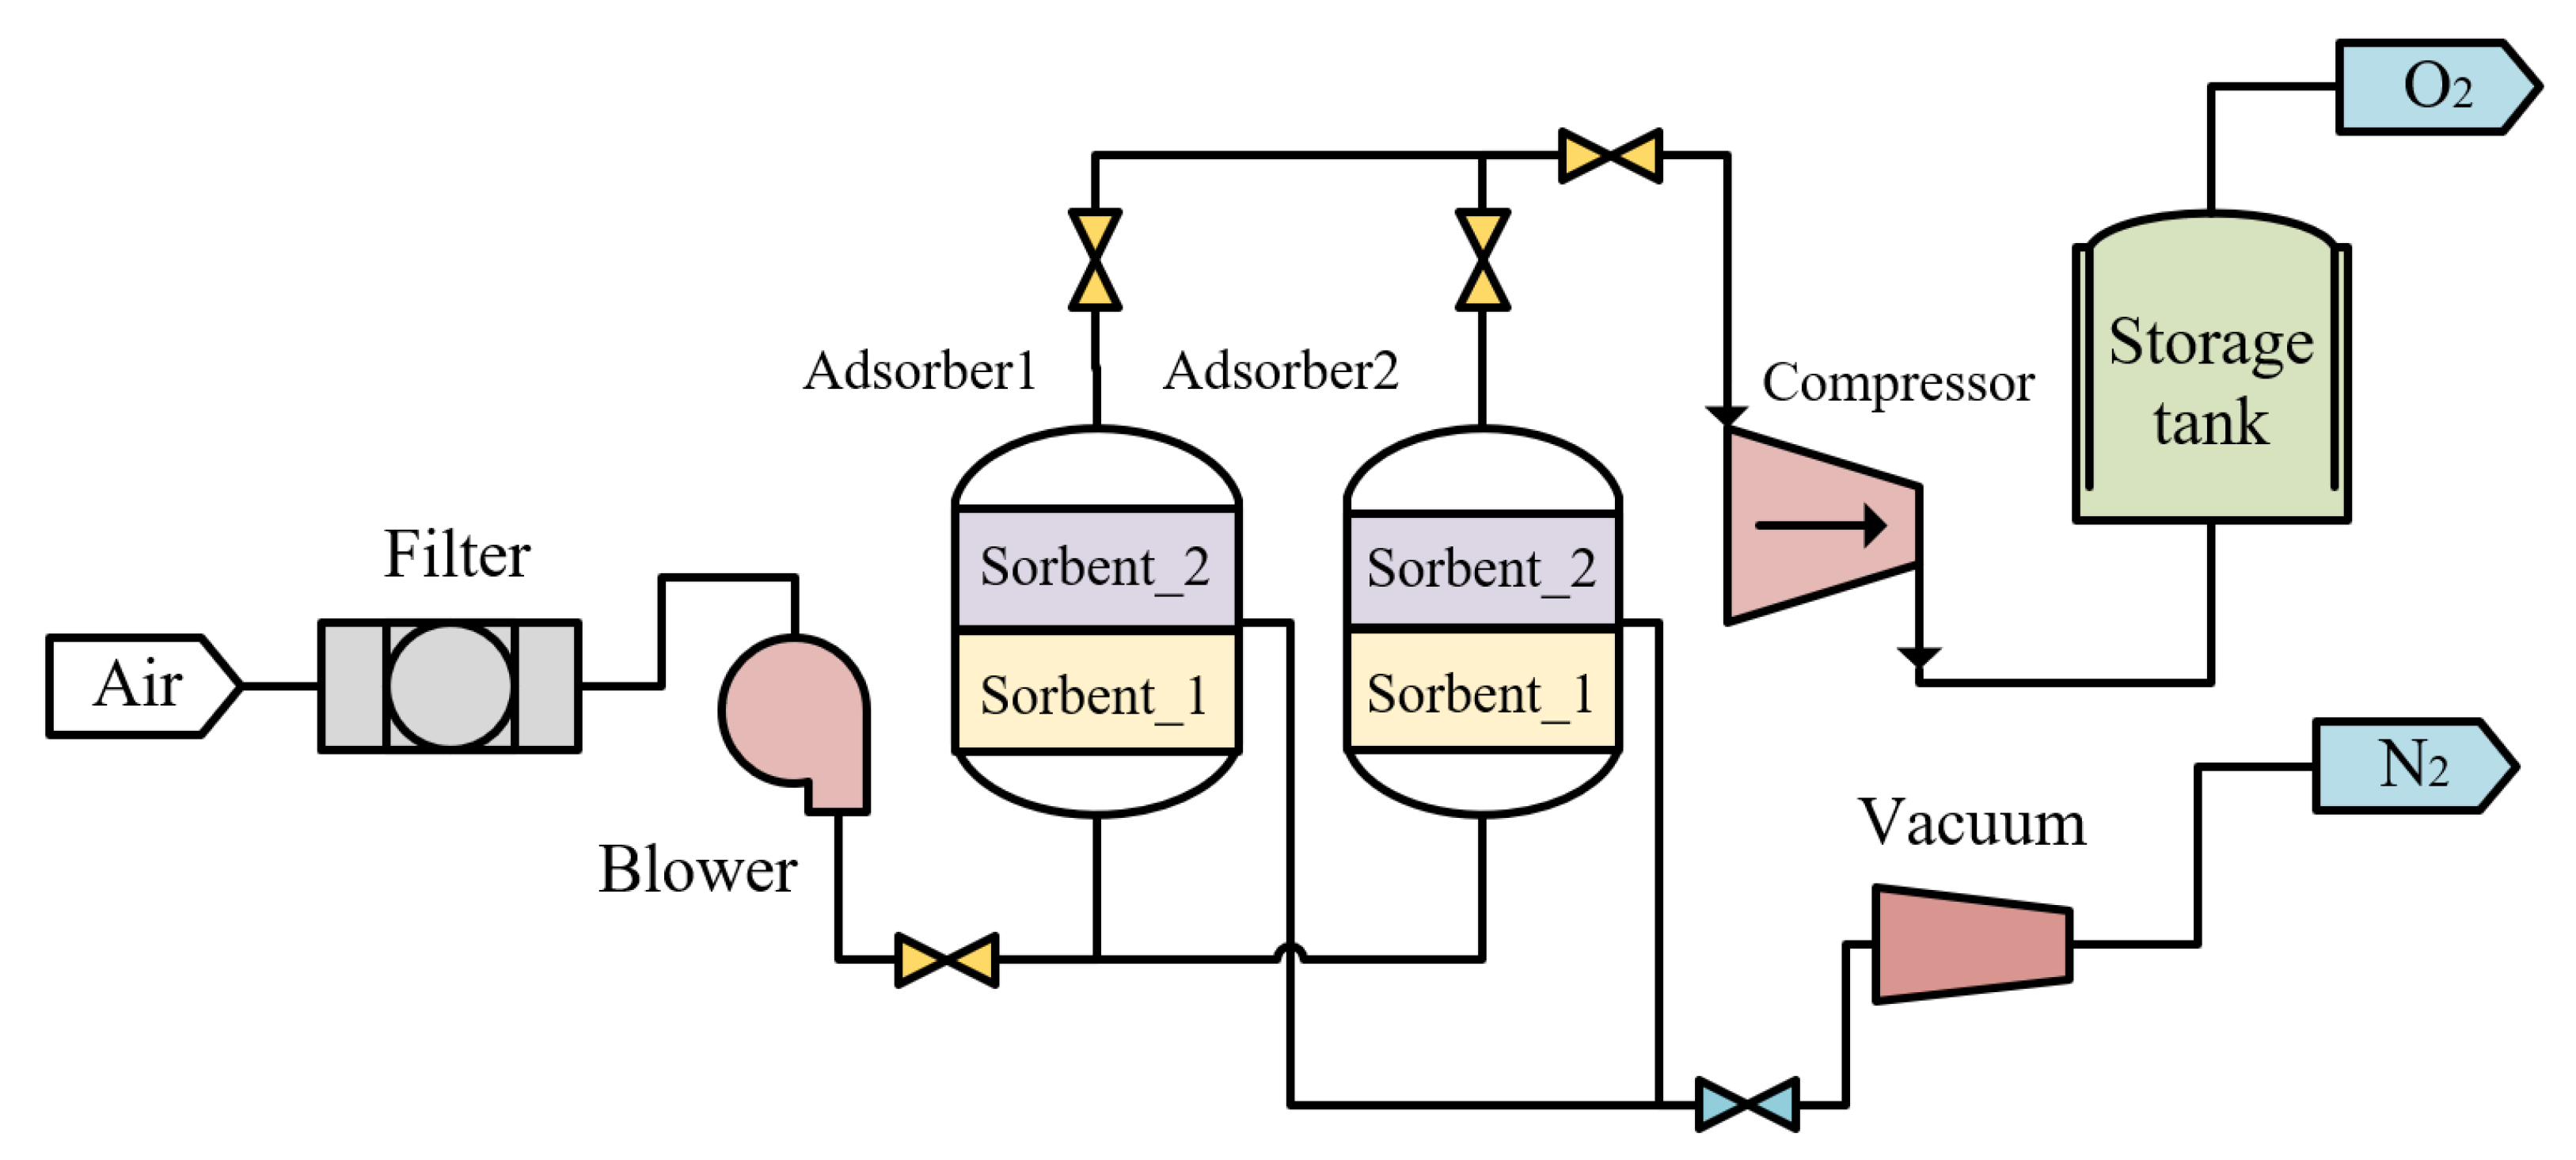
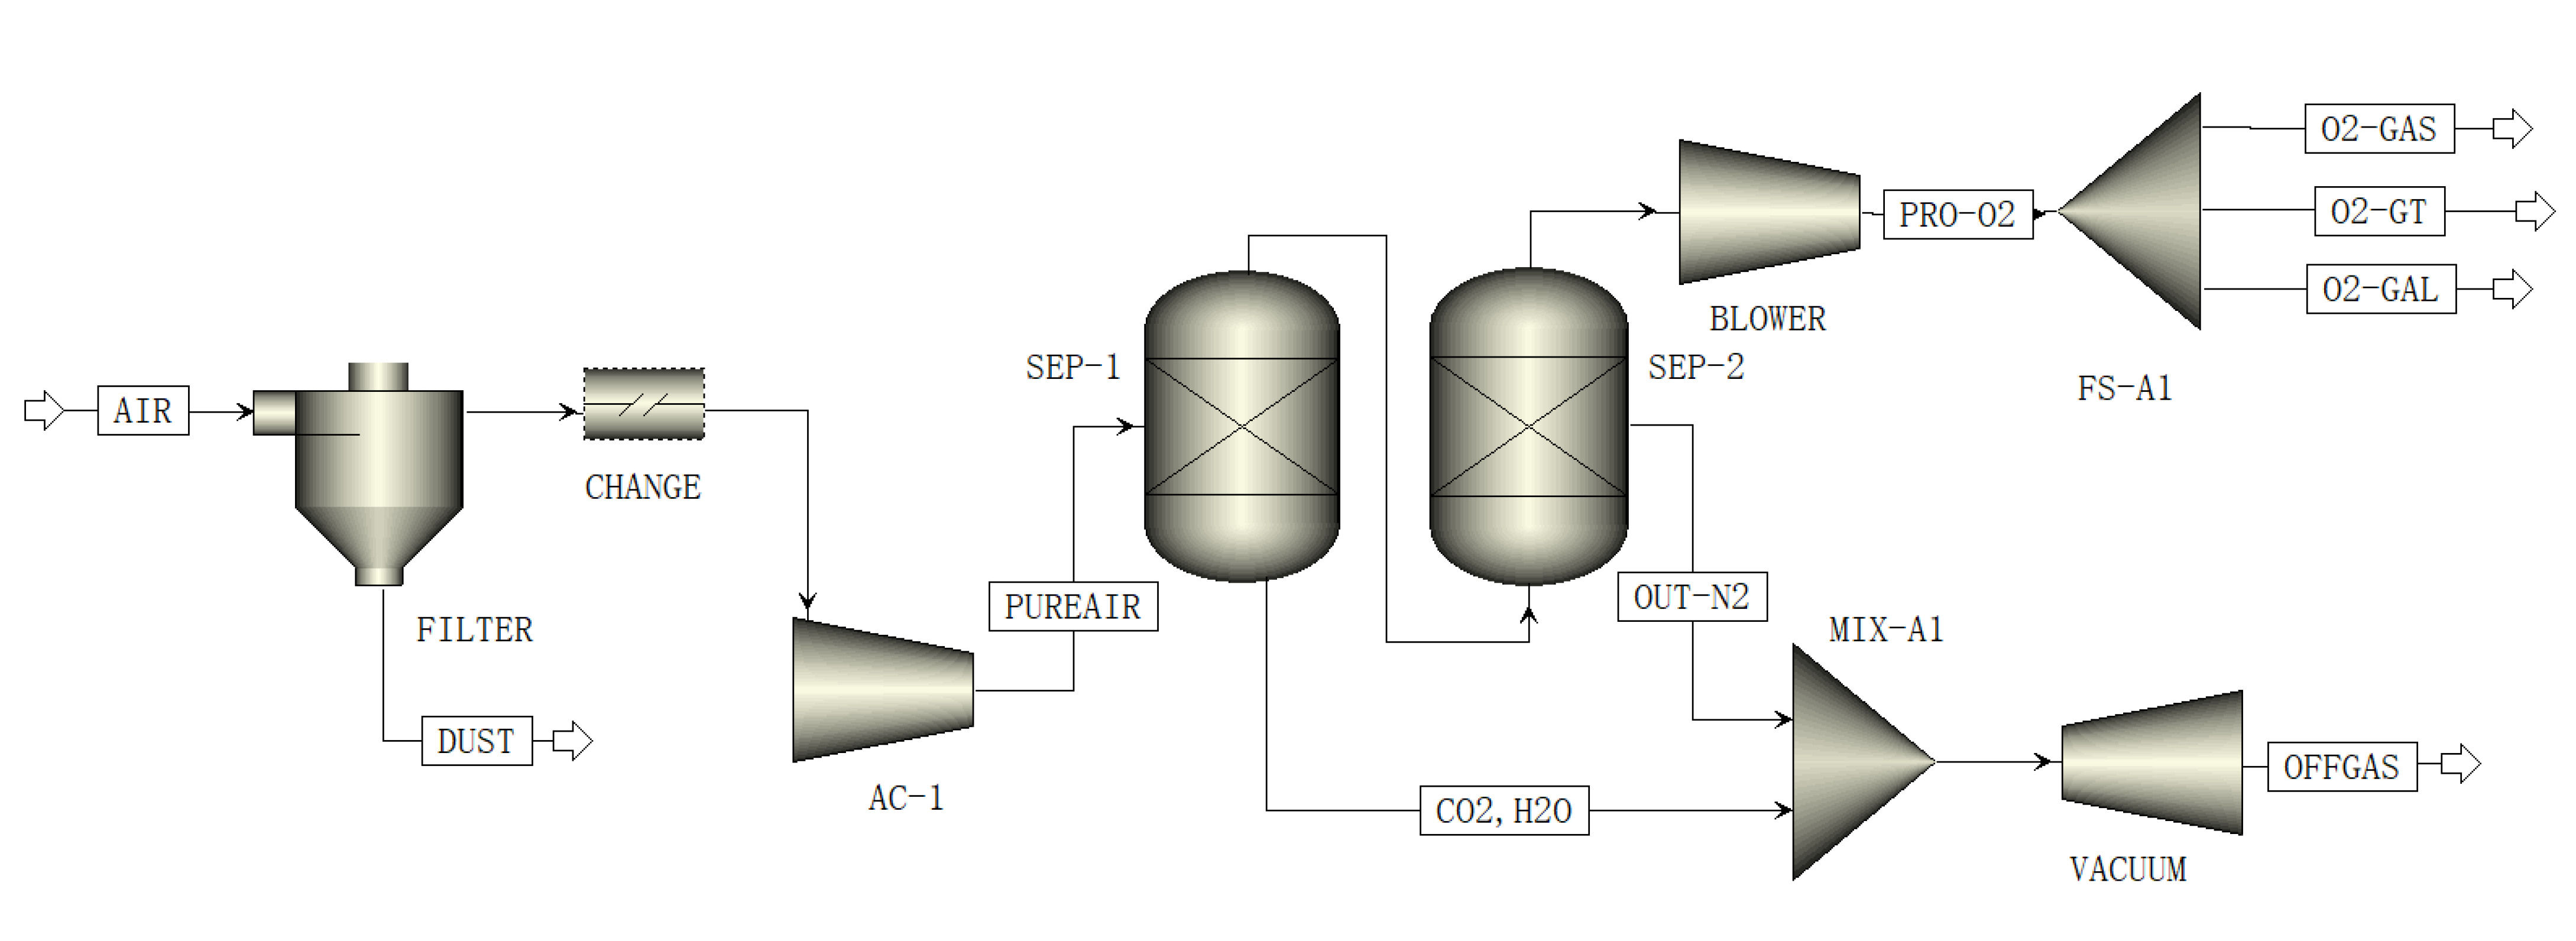
2.4. Oxygen Production
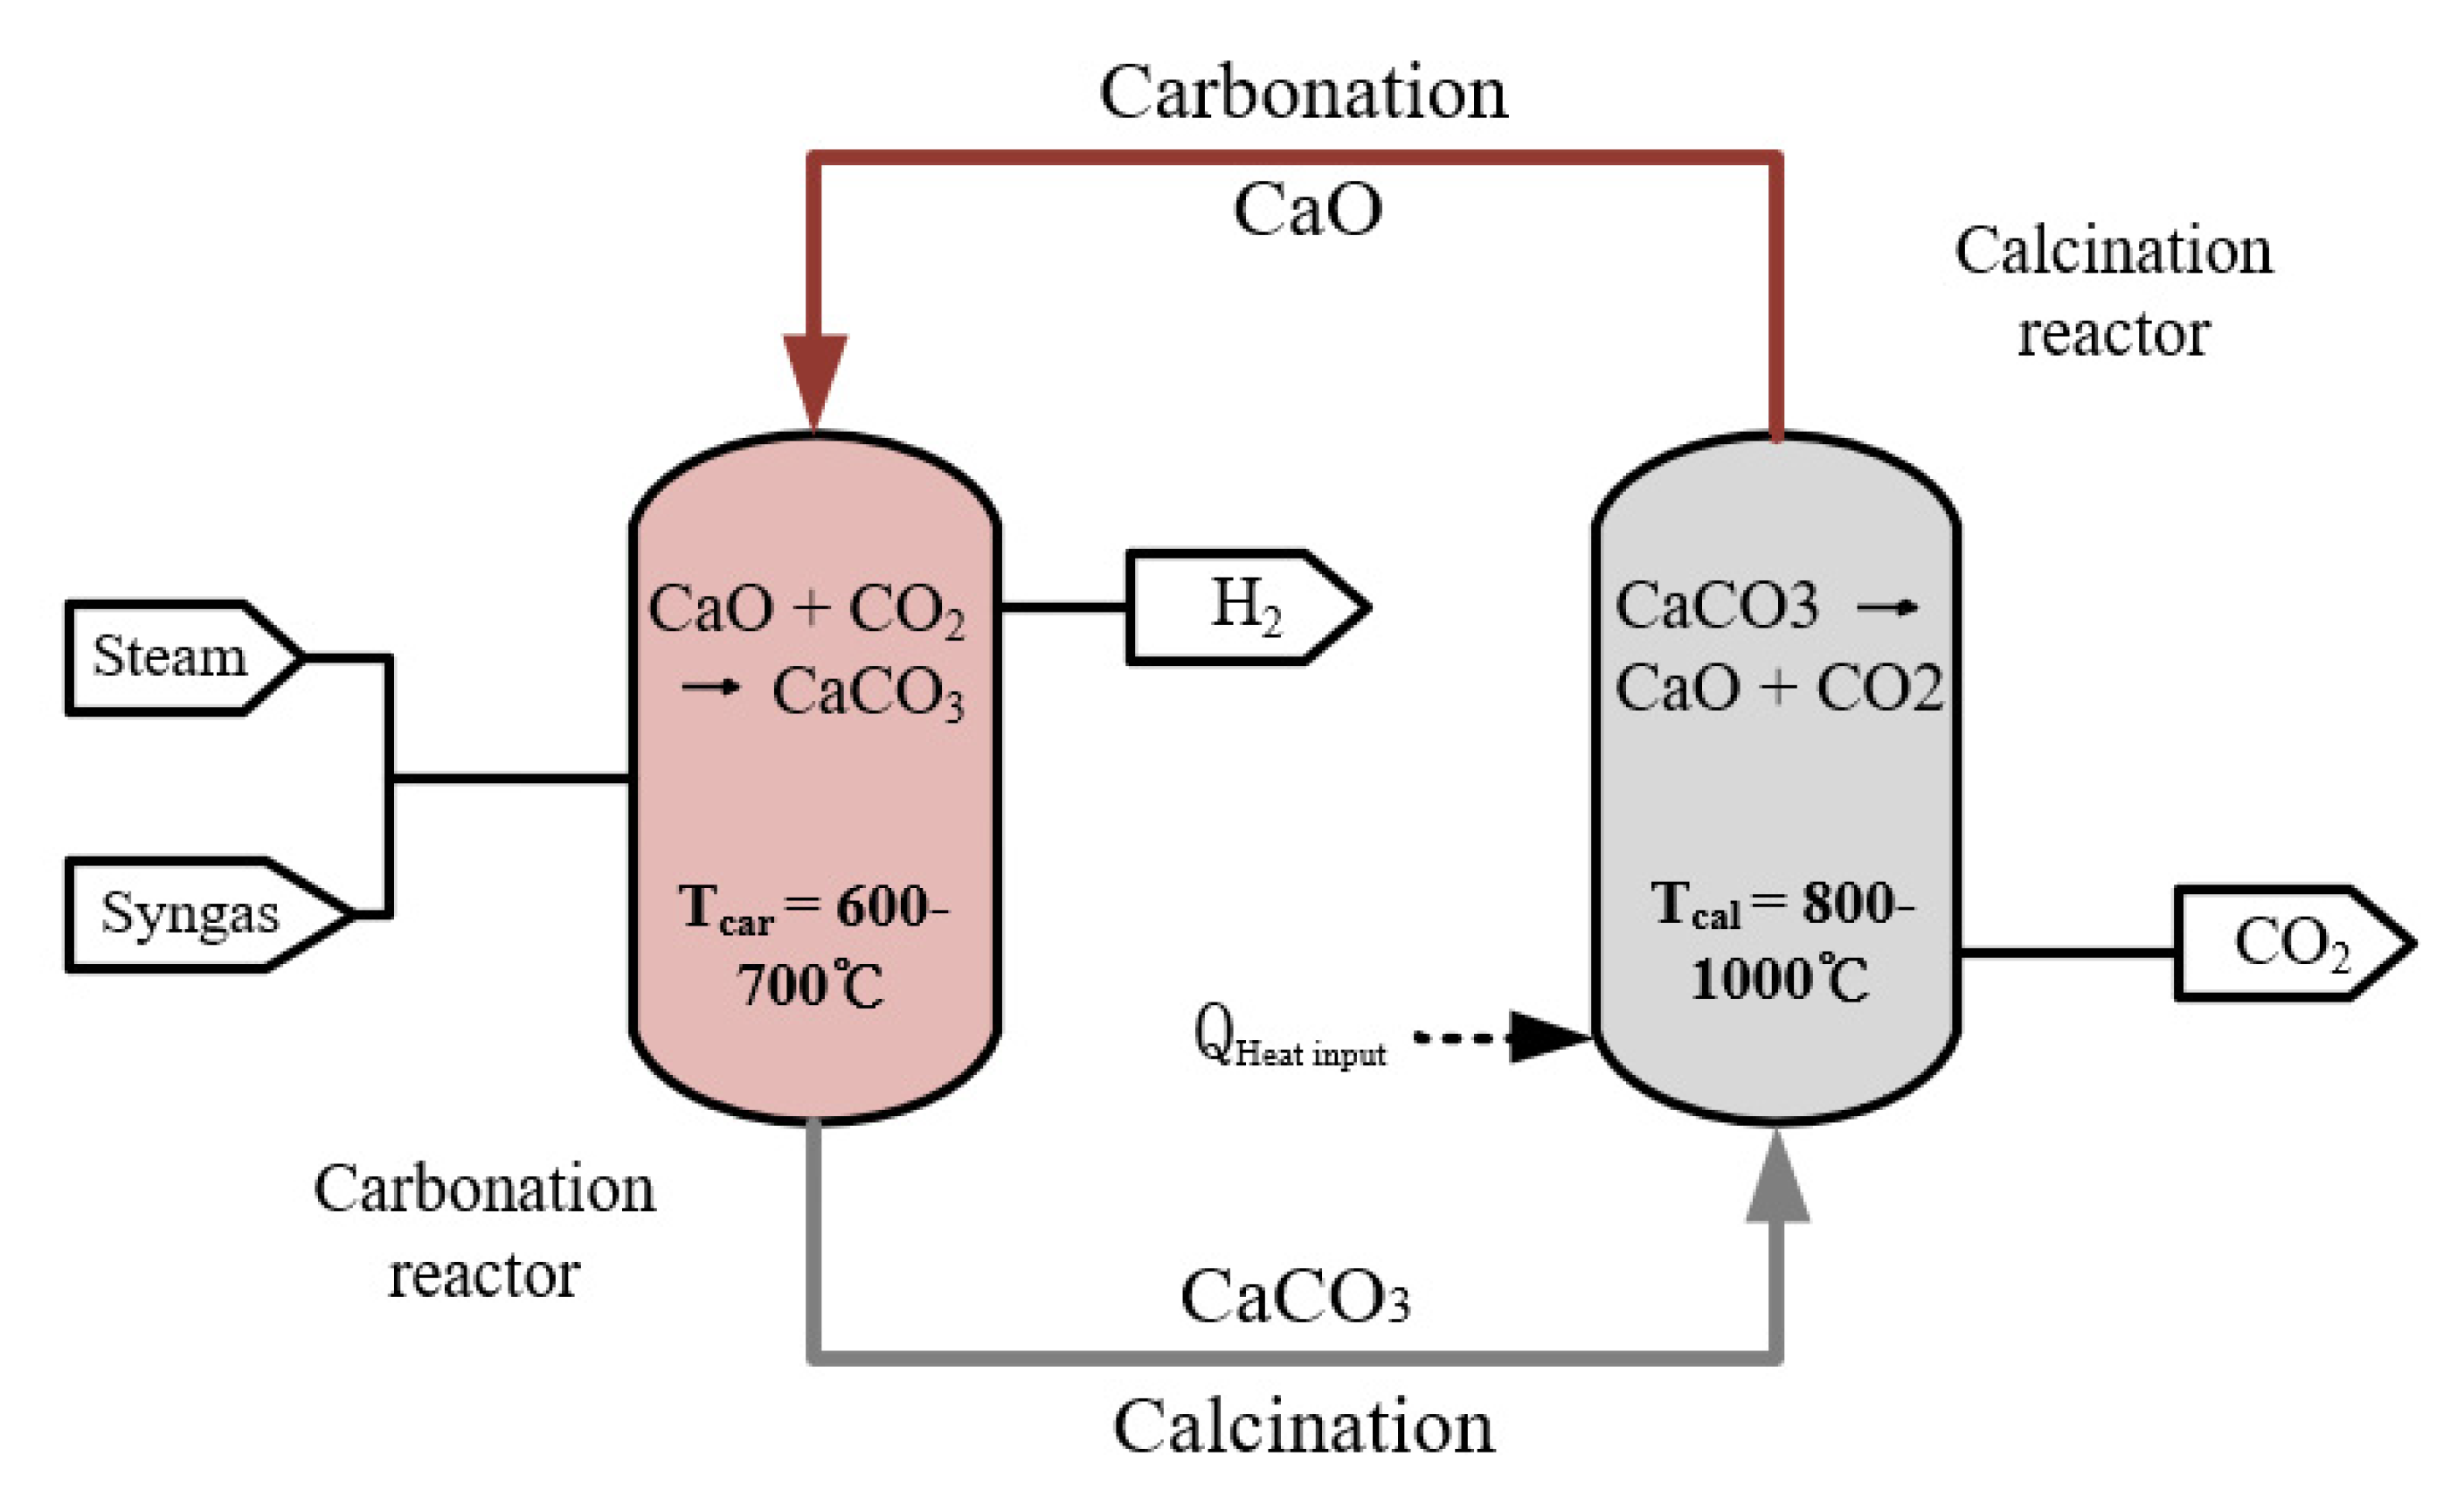
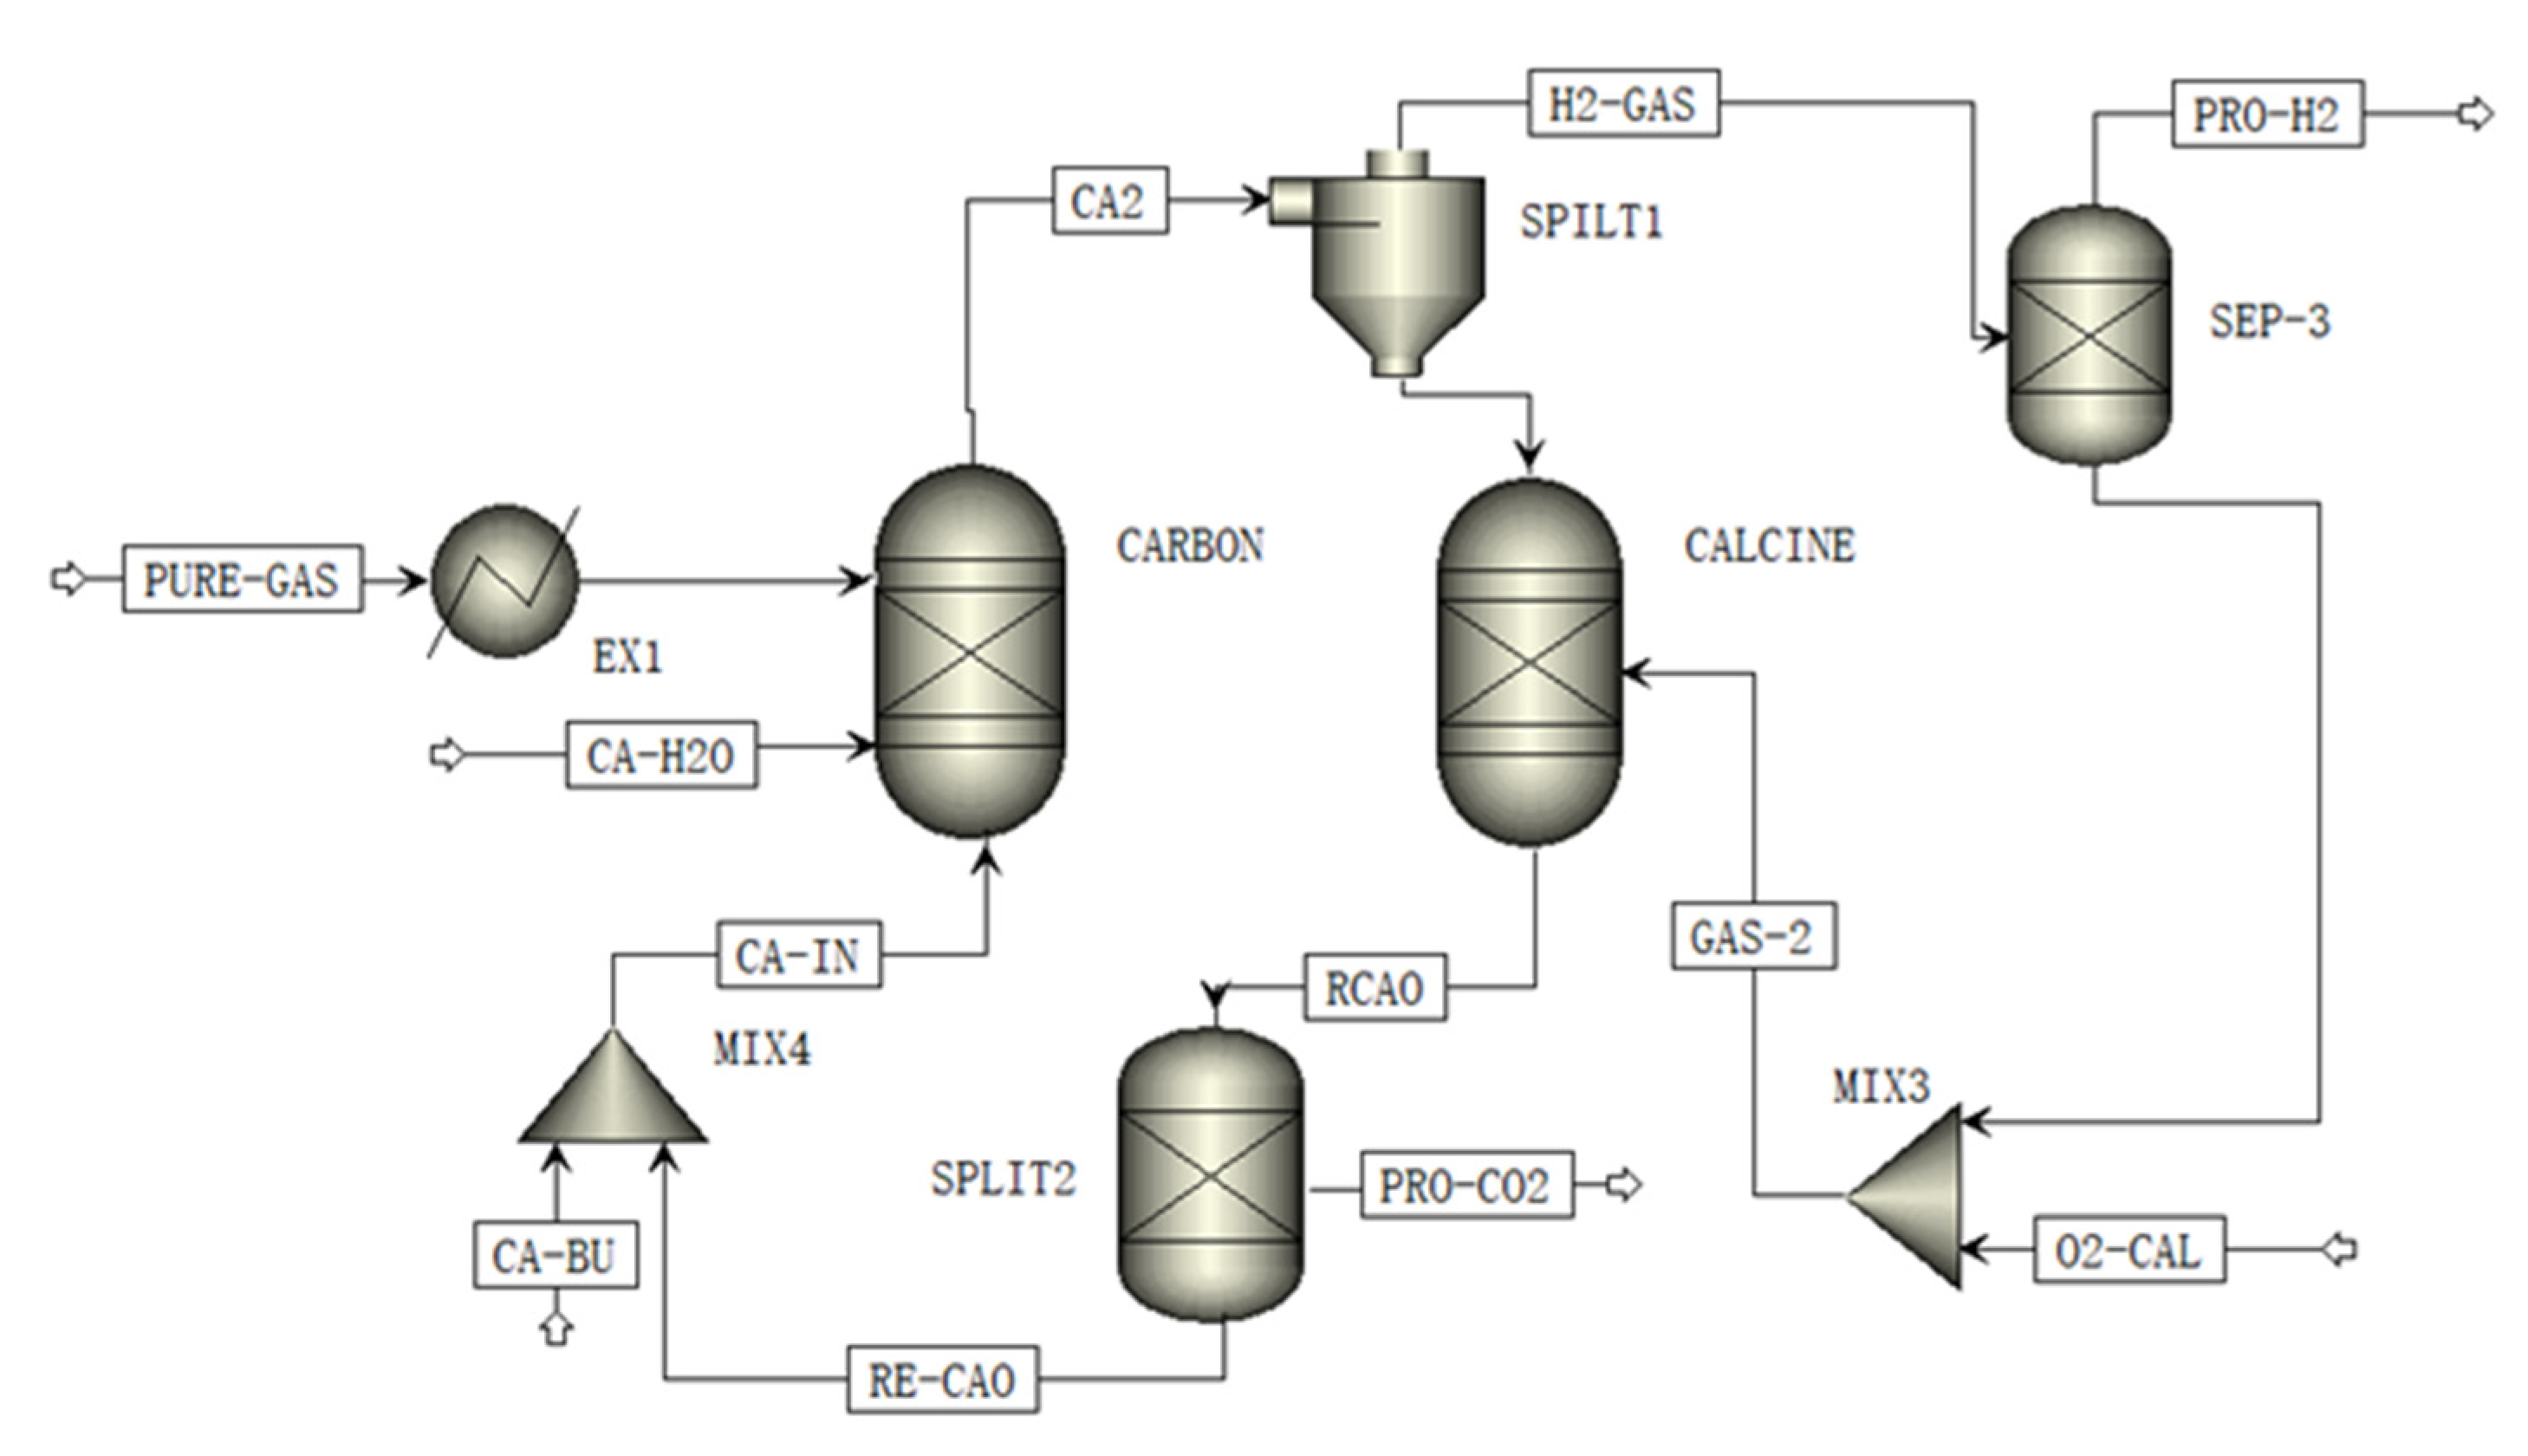
2.5. Calcium-Looping Process
3. Process Simulation
3.1. Gasification Process
3.2. Vacuum Pressure Swing Adsorption Process
3.3. Calcium-Looping Processes
4. Analysis of Simulation Results
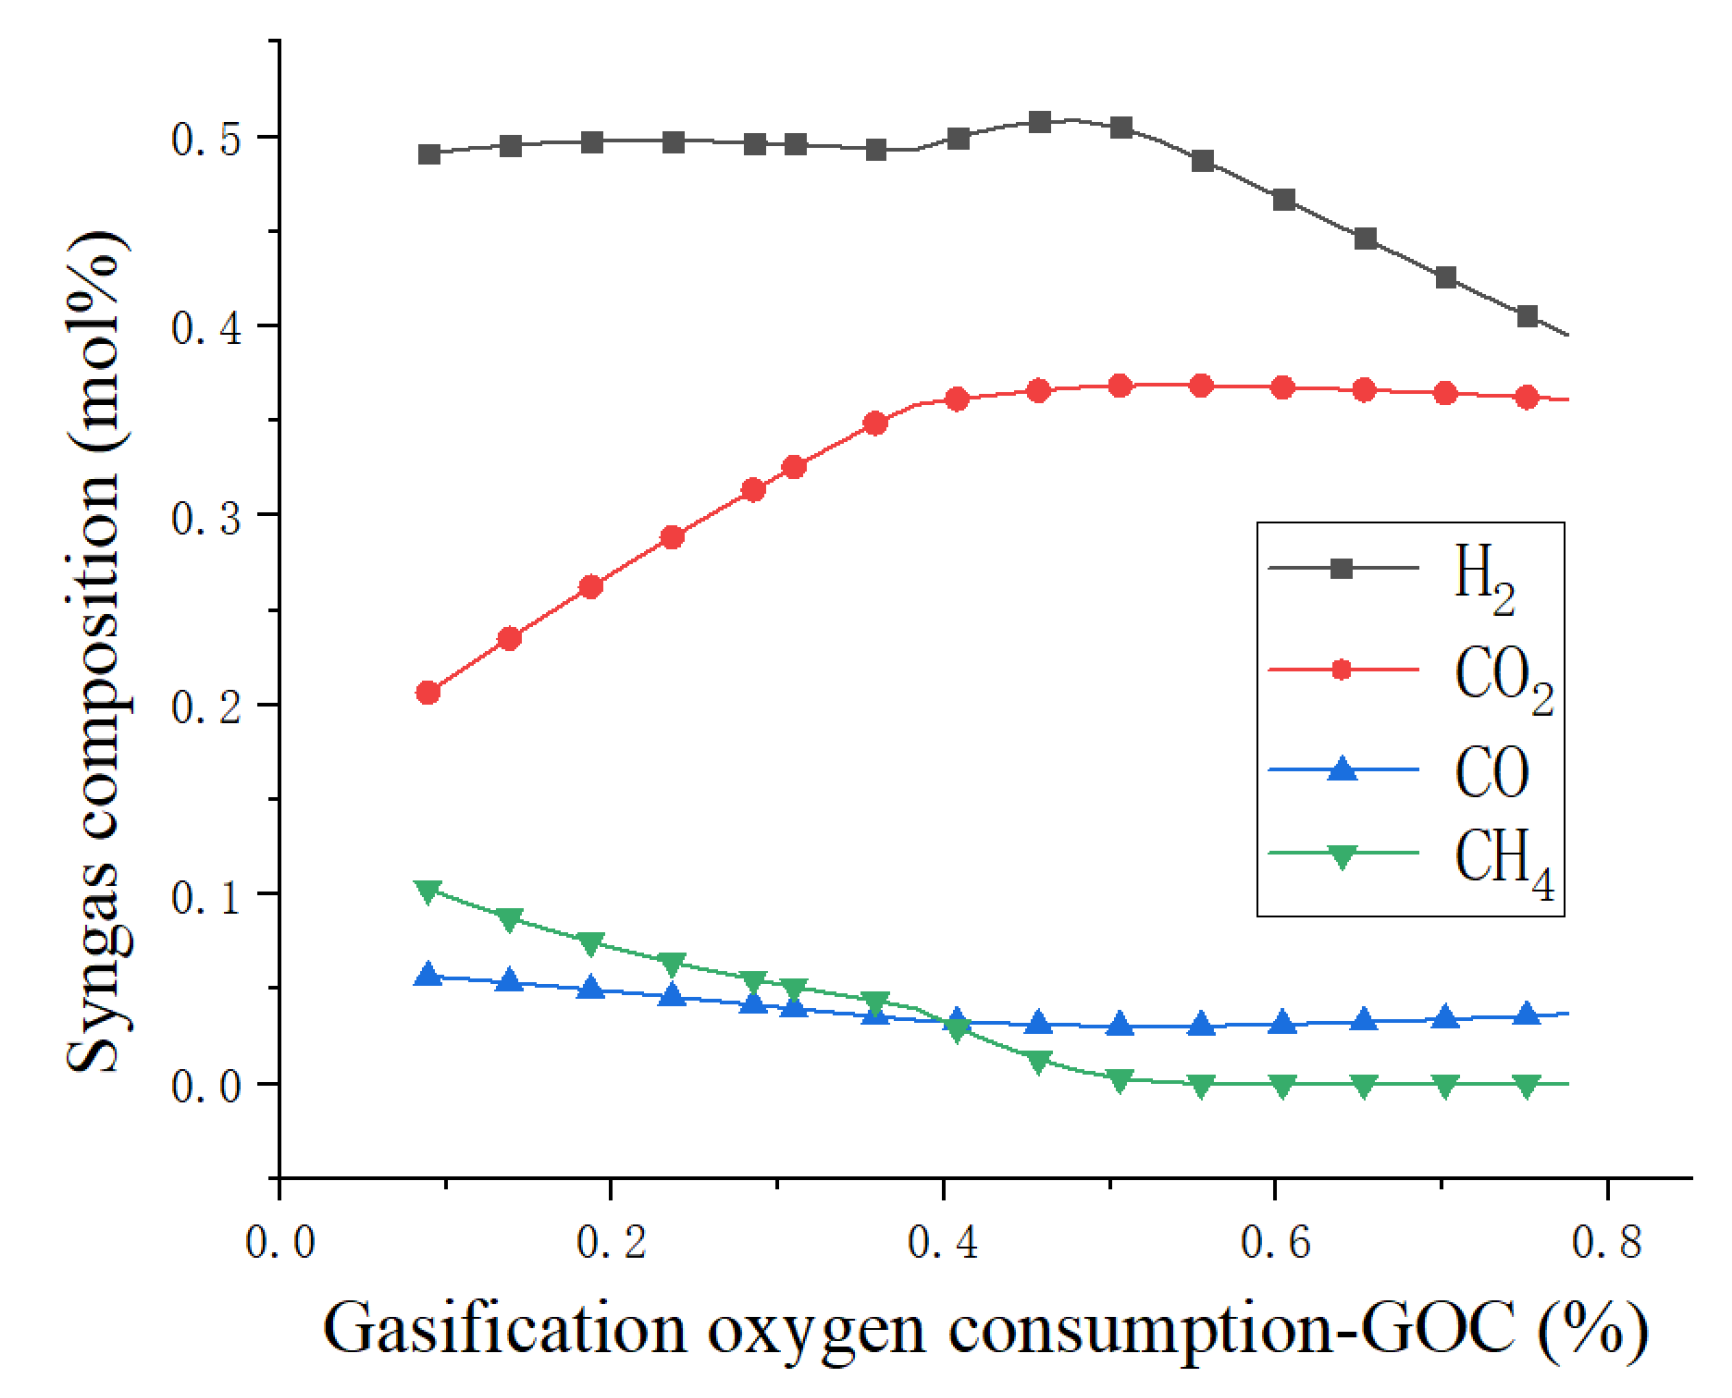
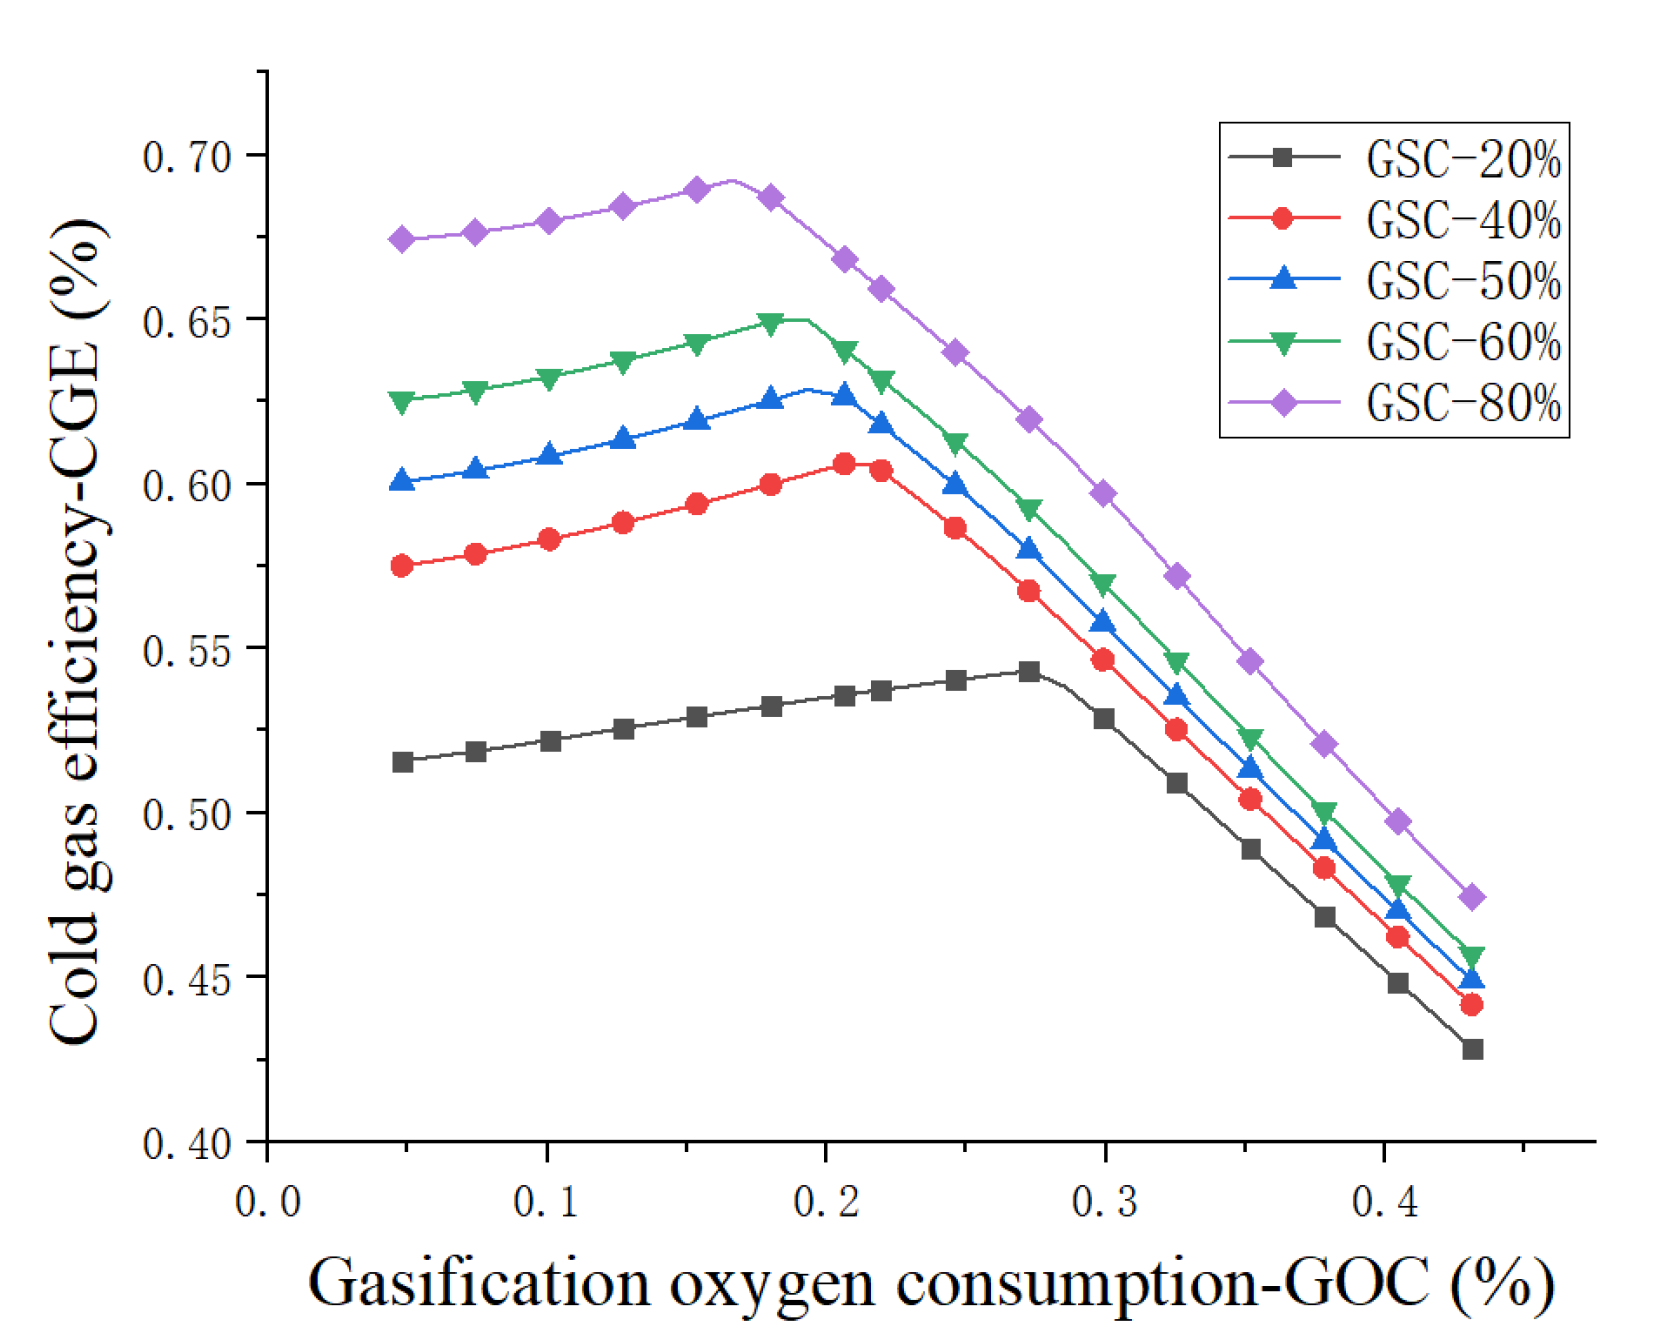
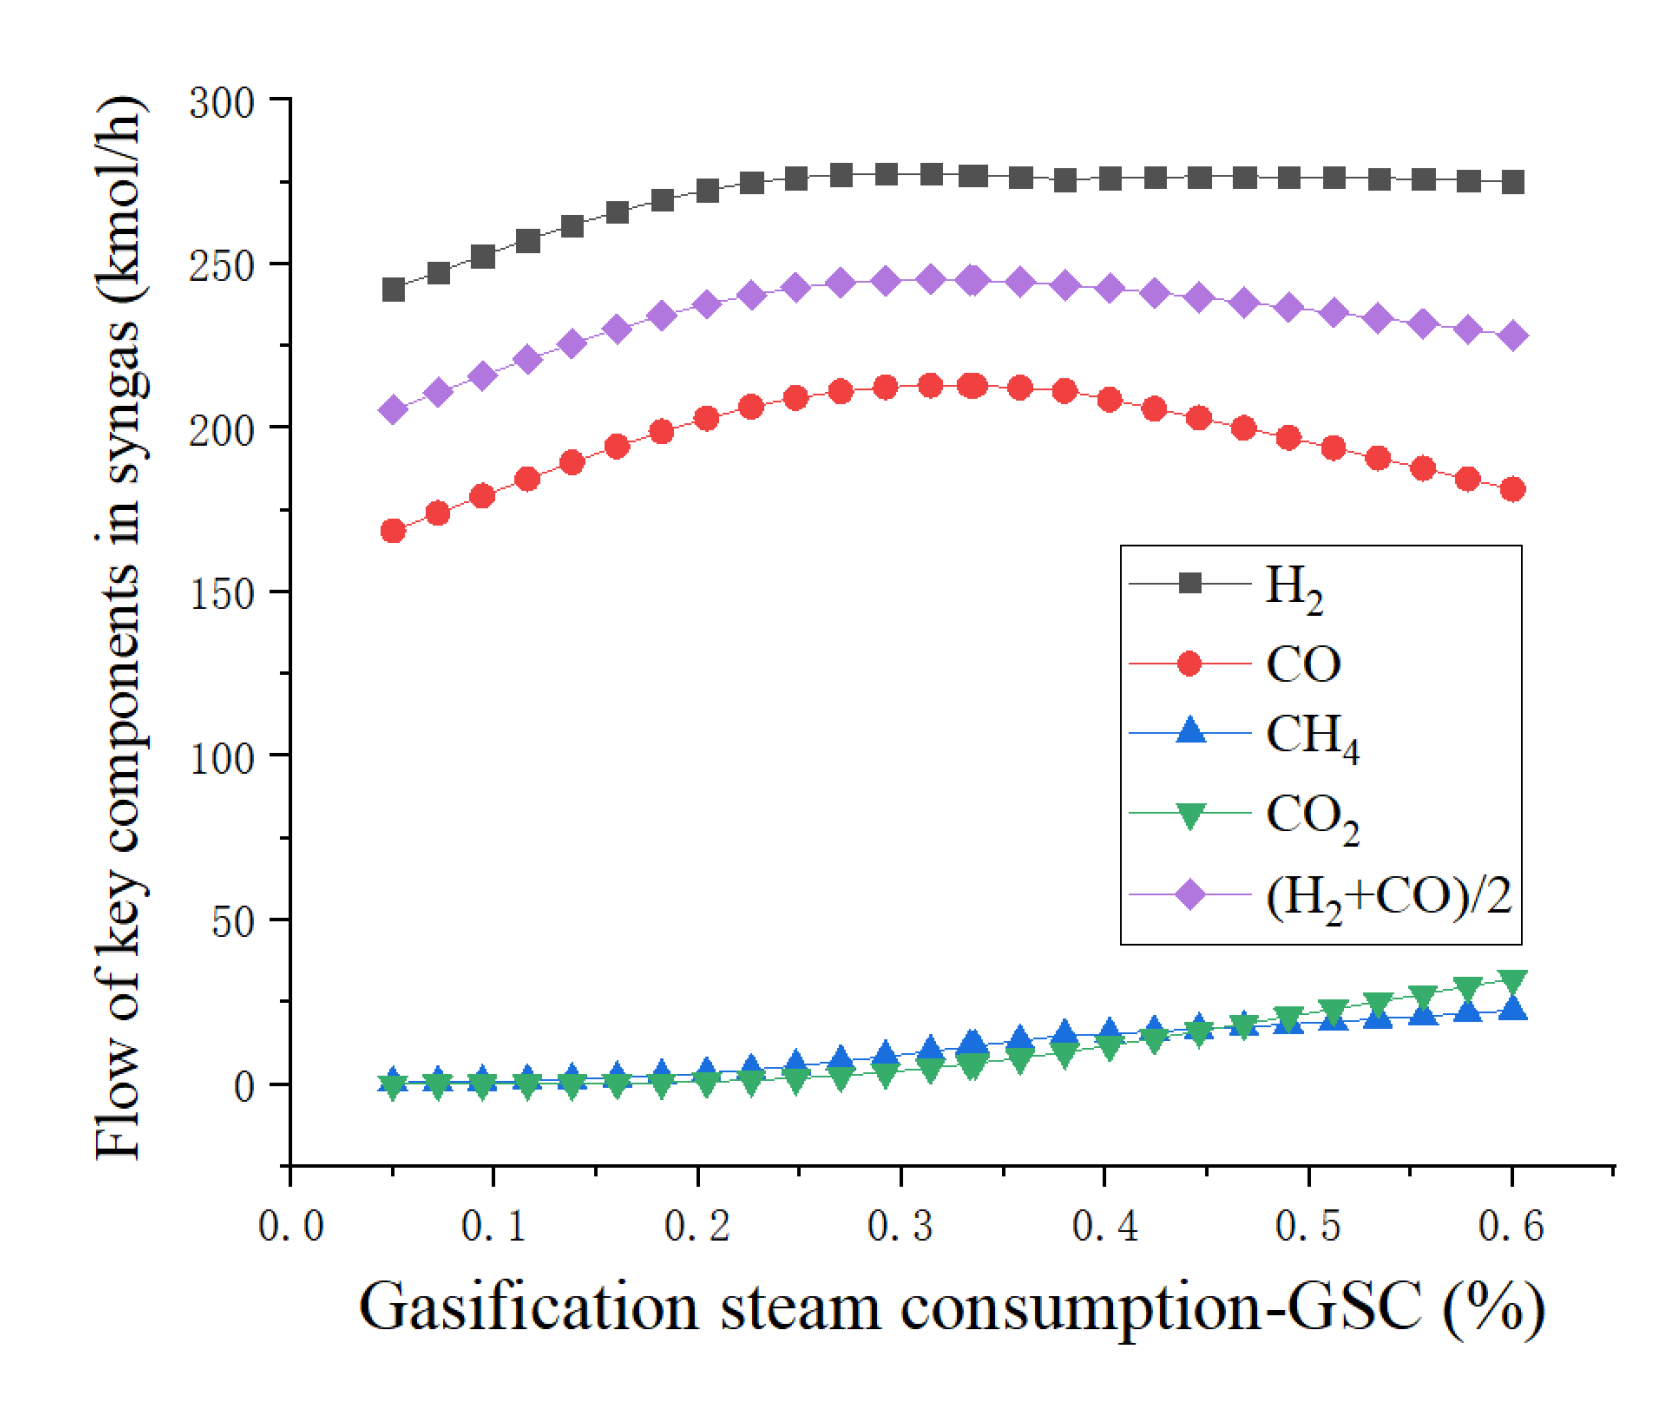
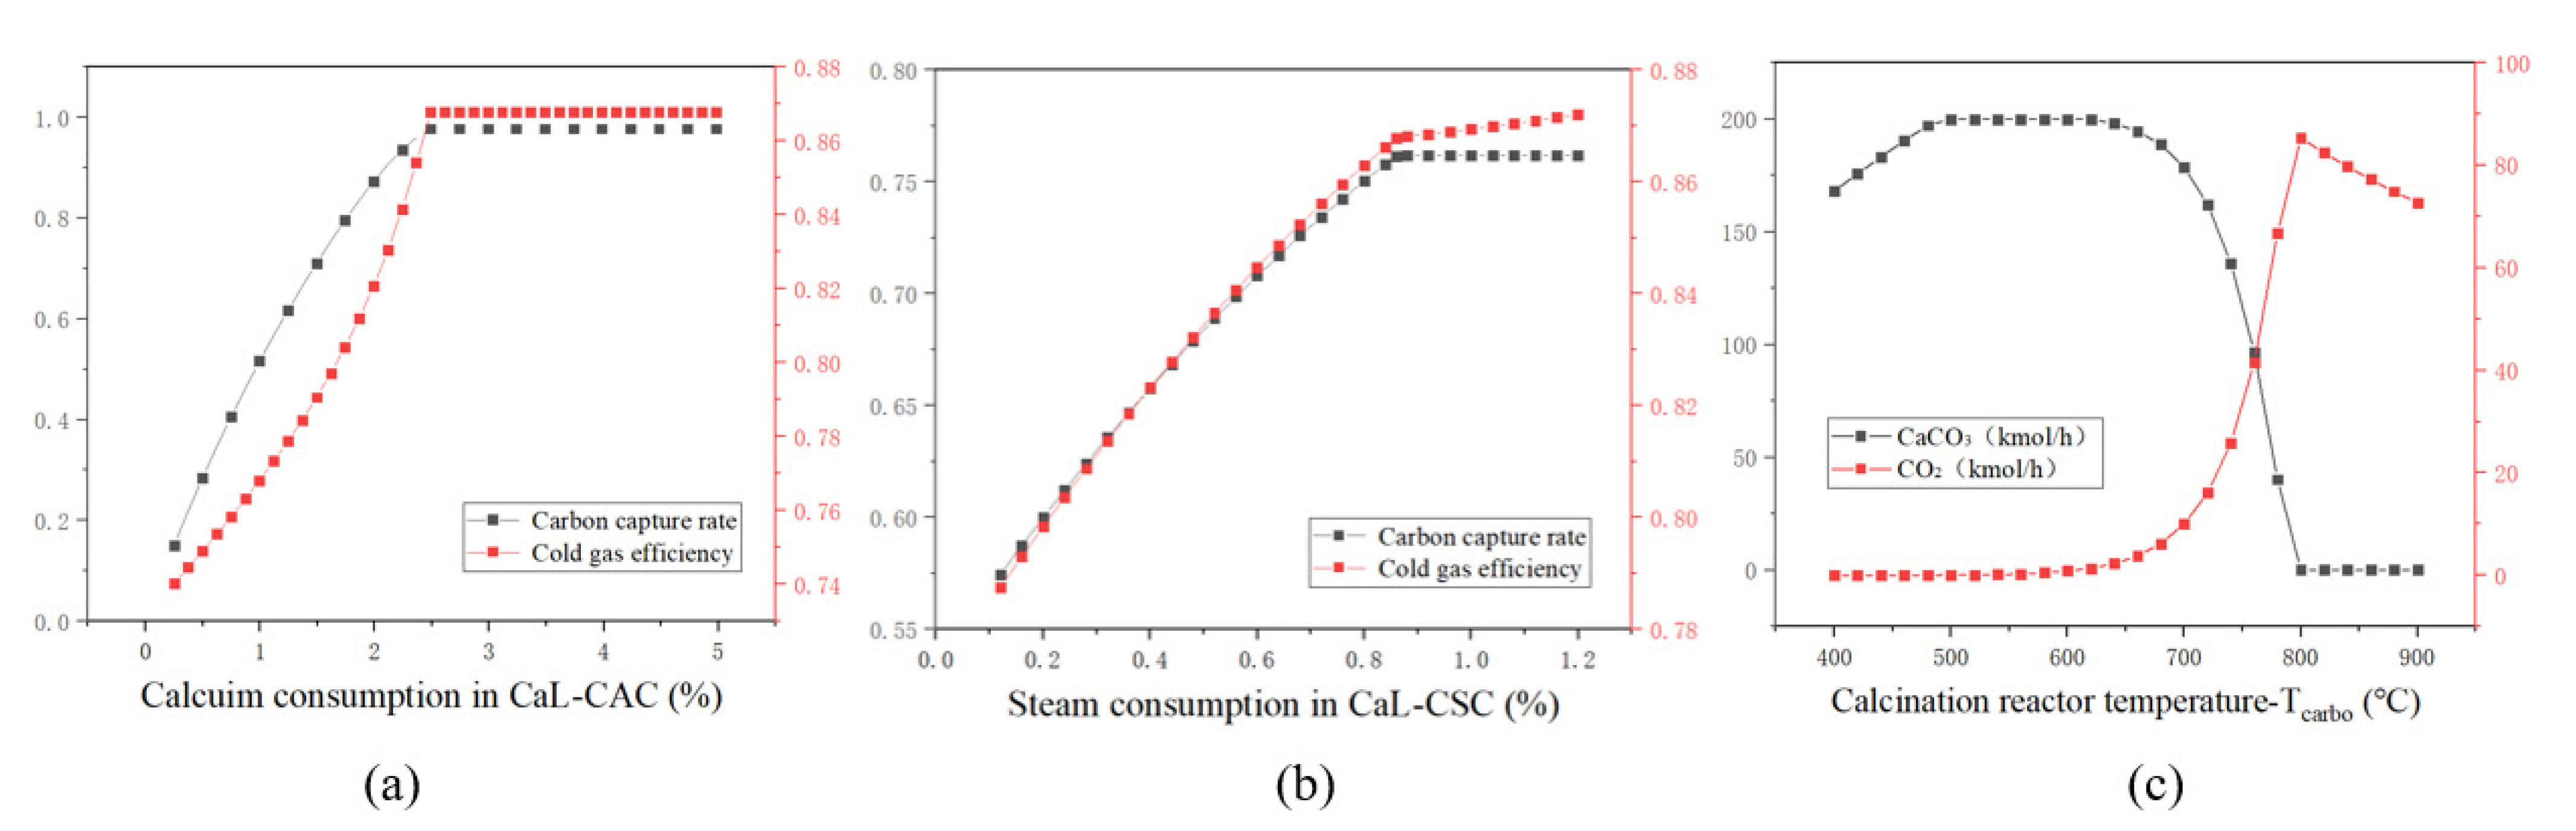
4.1. Sensitivity Analysis
- 1.
- Total system efficiency—:
- 2.
- System net efficiency—:
- 3.
- Carbon capture rate—CCR:
- 4.
- Cold gas efficiency—CGE:
4.2. Process Design
4.3. Results and Discussion
5. Conclusions
- Design 1 is a traditional IGCC-based power generation system that uses cryogenic air separation to produce oxygen. After replacing CAS by VPSA, the energy consumption of the oxygen production part was reduced by 42.14%. The net power of the system also increased by 15.99%. Therefore, VPSA provides a new oxygen production method for MPW recycling.
- Design 3 adds the CaL process, which improves the conversion rate of the WGSR. The most prominent advantage of the addition of the CaL process is that it made outstanding contributions to carbon emission reduction. The carbon capture rate of Design 3 reached 84.43%, and the CGE reached 50.53%. The whole system realizes the conversion of solid waste into valuable products, which is in line with the idea of energy saving and emission reduction.
Author Contributions
Funding
Institutional Review Board Statement
Informed Consent Statement
Data Availability Statement
Acknowledgments
Conflicts of Interest
Nomenclature
| IGCC | Integrated Gasification Combined Cycle |
| CAS | Cryogenic air separation |
| VPSA | Vacuum Pressure Swing Adsorption |
| CaL | Calcium-looping |
| LDPE | Low-density polyethylene |
| HDPE | High-density polyethylene |
| PVC | Polyvinyl chloride |
| PP | Polypropylene |
| PS | Polystyrene |
| ABS | Acrylonitrile Butadiene Styrene |
| PET | Polyethylene terephthalate |
| WGSR | Water-Gas Shift Reactio |
| CCR | Carbon capture rate |
| CGE | Cold gas efficiency |
| MPW | Mixed plastic wastes |
| HHV | Higher heating value |
| LHV | Lower heating value |
| BFB | Bubbling fluidized bed |
| SCR | Selective catalytic reduction |
| GT | Gas turbine |
| ST | Steam turbine |
| CCS | Carbon capture and storage |
| GOC (%) | Gasification oxygen consumption |
| GSC (%) | Gasification steam consumption |
| CAC (%) | CaO consumption in the calcium-looping |
| CSC (%) | Steam consumption in the calcium-looping |
| (%) | Total system efficiency |
| (kW) | System total work |
| (%) | Net system efficiency |
| (kW) | System net work |
| (kg/s) | The feed of gasification raw materials-MPW |
| WGT (kW) | Work of gas turbines |
| WST (kW) | Work of steam turbines |
| WIOE (kW) | Input power of operating equipment |
References
- China Plastics Processing Industry Association. 2019 Review and 2020 Prospect on Chinese Plastics Processing Industry; China Plastics Processing Industry Association: Beijing, China, 2020. [Google Scholar]
- Geyer, R.; Jambeck, J.R.; Law, K.L. Production, use, and fate of all plastics ever made. Sci. Adv. 2017, 3, e1700782. [Google Scholar] [CrossRef] [PubMed] [Green Version]
- Jambeck, J.R.; Geyer, R.; Wilcox, C.; Siegler, T.R.; Perryman, M.; Andrady, A.; Narayan, R.; Law, K.L. Plastic waste inputs from land into the ocean. Science 2015, 347, 768–771. [Google Scholar] [CrossRef]
- Khan, M.Z.H.; Sultana, M.; Al-Mamun, M.R.; Hasan, M.R. Pyrolytic waste plastic oil and its diesel blend: Fuel characterization. J. Environ. Public Health 2016, 2016, 7869080. [Google Scholar] [CrossRef] [PubMed] [Green Version]
- Wang, Q.; Qu, J.P.; Shi, B.; Chen, N.; Nie, M.; Yang, S. Prevention and Control of Waste Plastics Pollution. China Eng. Sci. 2021, 23, 160–166. [Google Scholar]
- Heidenreich, S.; Foscolo, P.U. New concepts in biomass gasification. Prog. Energy Combust. 2015, 46, 72–95. [Google Scholar] [CrossRef]
- Ahmed, I.I.; Gupta, A.K. Hydrogen production from polystyrene pyrolysis and gasification: Characteristics and kinetics. Int. J. Hydrog. Energy 2009, 34, 6253–6264. [Google Scholar] [CrossRef]
- Wu, S.L.; Kuo, J.H.; Wey, M.Y. Highly abrasion and coking-resistance core-shell catalyst for hydrogen-rich syngas production from waste plastics in a two-staged fluidized bed reactor. Appl. Catal. A Gen. 2021, 612, 117989. [Google Scholar] [CrossRef]
- Dang, S.; Pornnapat, R.; Amornchai, A.; Yaneeporn, P. Gasification of plastic waste for synthesis gas production. Energy Rep. 2020, 6, 202–207. [Google Scholar]
- Santagata, C.; Aquaniello, G.; Salladini, A. Production of low-density poly-ethylene (LDPE) from chemical recycling of plastic waste: Process analysis. J. Clean Prod. 2020, 253, 119837. [Google Scholar] [CrossRef]
- Ansari, S.H.; Ahmed, A.; Razzaq, A.; Hildebrandt, D.; Liu, X.; Park, Y.-K. Incorporation of solar-thermal energy into a gasification process to co-produce bio-fertilizer and power. Environ. Pollut. 2020, 266, 115103. [Google Scholar] [CrossRef]
- Siyue, R.; Feng, X.; Yufei, W. Emergy evaluation of the integrated gasification combined cycle power generation systems with a carbon capture system. Renew. Sustain. Energ Rev. 2021, 147, 111208. [Google Scholar]
- Campbell, P.E.; Evans, R.H.; McMullan, J.T.; Williams, B.C. The potential for adding plastic waste fuel at a coal gasification power plant. Waste Manag. Res. 2001, 19, 526–532. [Google Scholar] [CrossRef] [PubMed]
- Gent Malcolm, R.; Menendez, M.; Toraño, J.; Susana, T. Optimization of the recovery of plastics for recycling by density media separation cyclones. Resour. Conserv. Recycl. 2010, 55, 472–482. [Google Scholar] [CrossRef]
- Jia, L.; Gao, K.; Zhenming, X. Charge-decay electrostatic separation for removing Polyvinyl chloride from mixed plastic wastes. J. Clean. Prod. 2017, 157, 148–154. [Google Scholar]
- Choi, W.-Z.; Yoo, J.-M.; Cho, B.-G. Separation of Individual Plastics from Mixed Plastic Waste by Gravity Separation Processes. Geosystem. Eng. 2006, 9, 65–72. [Google Scholar] [CrossRef]
- Liao, X.; Singh, S.; Yang, H.; Wu, C.; Zhang, S. A thermogravimetric assessment of the tri-combustion process for coal, biomass and polyethylene. Fuel 2021, 287, 119–355. [Google Scholar]
- Gartzen, L.; Maite, A.; Maider, A.; Alvarez, J.; Bilbao, J.; Olazar, M. Recent advances in the gasification of waste plastics. A critical overview. Renew. Sustain. Energy Rev. 2018, 82, 576–596. [Google Scholar]
- Ciuffi, B.; Chiaramonti, D.; Rizzo, A.M.; Frediani, M.; Rosi, L. A Critical Review of SCWG in the Context of Available Gasification Technologies for Plastic Waste. Appl. Sci. 2020, 10, 6307. [Google Scholar] [CrossRef]
- Sancho, J.A.; Aznar, M.P.; Toledo, J.M. Catalytic Air Gasification of Plastic Waste (Polypropylene) in Fluidized Bed. Part I: Use of in-Gasifier Bed Additives. Ind. Eng. Chem. Res 2008, 47, 1005–1010. [Google Scholar]
- Wu, W.; Zheng, L.; Shi, B.; Kuo, P.-C. Energy and exergy analysis of MSW-based IGCC power/polygeneration systems. Energy Convers. Manag. 2021, 238, 114119. [Google Scholar] [CrossRef]
- Hao, P.; Shi, Y.; Li, S.; Liang, S. Oxygen sorption/desorption kinetics of SrCo0.8Fe0.2O3-delta perovskite adsorbent for high temperature air separation. Adsorption 2018, 24, 65–71. [Google Scholar] [CrossRef]
- Qadir, S.; Li, D.; Gu, Y.; Yuan, Z.; Zhao, Y.; Wang, S.; Wang, S. Experimental and numerical investigations on the separation performance of [Cu(INA)(2)] adsorbent for CH4 recovery by VPSA from oxygen-bearing coal mine methane. Chem. Eng. J. 2021, 408, 127238. [Google Scholar] [CrossRef]
- Zhaoyang, D. Simulation and Optimization of Industrial-Scale Variable Pressure Adsorption Oxygen Generation Process; Tianjin University: Tianjin, China, 2018. (In Chinese) [Google Scholar]
- Skarstrom, C.W. Method and Apparatus for Fractionating Gaseous Mixtures by Adsorption; Skarstrom C W: USA, 1960; Available online: https://www.freepatentsonline.com/2944627.pdf (accessed on 23 December 2021).
- Sun, H.; Parlett, C.M.; Isaacs, M.A.; Liu, X.; Adwek, G.; Wang, J.; Shen, B.; Huang, J.; Wu, C. Development of Ca/KIT-6 adsorbents for high temperature CO2 capture. Fuel 2019, 235, 1070–1076. [Google Scholar] [CrossRef] [Green Version]
- Mengmeng, Z. Optimization of High-Temperature Flue Gas Calcium-Based CO2 Capture Process for Coal-Fired Power Plants; Qingdao University of Science and Technology: Qingdao, China, 2020. (In Chinese) [Google Scholar]
- Wilk, V.; Hofbauer, H. Conversion of mixed plastic wastes in a dual fluidized bed steam gasifier. Fuel 2013, 107, 787–799. [Google Scholar] [CrossRef]
- Chang, H.; Feng, X.; Khim Hoong, C. Process modeling and thermodynamic analysis of Lurgi fixed-bed coal gasifier in an SNG plant. Appl. Energy 2013, 111. [Google Scholar]
- Agon, N.; Hrabovský, M.; Chumak, O.; Hlina, M.; Kopecky, V.; Maslani, A.; Bosmans, A.; Helsen, L.; Skoblija, S.; Van Oost, G.; et al. Plasma gasification of refuse derived fuel in a single-stage system using different gasifying agents. Waste Manag. 2016, 47, 246–255. [Google Scholar] [CrossRef]
- Isam, J.; Idowu, A.; Sherien, E. Gasification feasibility of polyethylene, polypropylene, polystyrene waste and their mixture: Experimental studies and modeling. Sustain. Energy Technol. 2020, 39, 100684. [Google Scholar]
- Wu, C.; Williams, P.T. Hydrogen production by steam gasification of polypropylene with various nickel catalysts. Appl. Catal. B 2009, 87, 152–161. [Google Scholar] [CrossRef]
- Zhu, L.; Zhang, L.; Fan, J.M.; Jiang, P.; Li, L. MSW to synthetic natural gas: System modeling and thermodynamics assessment. Waste Manag. 2016, 48, 257–264. [Google Scholar] [CrossRef]
- Tengfei, F. Thermodynamic Analysis and Experimental Study of CaSO4 Oxygen Carrier Applied to CaO Regeneration Process; Institute of Engineering Thermophysics, Graduate School of Chinese Academy of Sciences: Beijing, China, 2013. [Google Scholar]
- Wu, W.; Wen, F.; Chen, J.-R.; Kuo, P.-C.; Shi, B. Comparisons of a class of IGCC polygeneration/power plants using calcium/chemical looping combinations. J. Taiwan Inst. Chem. E 2019, 96, 193–204. [Google Scholar] [CrossRef]
- Shi, B.; Xu, W.; Wu, E. Novel design of integrated gasification combined cycle (IGCC) power plants with CO2 capture. J. Clean. Prod. 2018, 195, 176–186. [Google Scholar] [CrossRef]


| No. | Category | Density Range (g/cm3) | Typical (g/cm3) |
|---|---|---|---|
| 1 | HDPE | 0.94–0.965 | 0.94 |
| LDPE | 0.918–0.93 | 0.932 | |
| 2 | PP | 0.89–0.91 | 0.9 |
| 3 | PS | 1.03–1.077 | 1.06 |
| 4 | PET | 1.35–1.40 | 1.37 |
| 5 | PVC | 1.37–1.42 | 1.39 |
| Items | Proximate Analysis (%) | Ultimate Analysis (%) (Major Element) | HHV | LHV | |||||||
|---|---|---|---|---|---|---|---|---|---|---|---|
| Moisture | Volatiles | Fixed Carbon | Ash | C% | H% | O% | N% | S% | MJ/kg | MJ/kg | |
| Straw | 7.3 | 75.9 | 13.4 | 10.7 | 48.2 | 6.6 | 33.0 | 1.1 | 0.3 | 18.56 | 16.0 |
| Coal | 2.8 | 9.0 | 65.7 | 25.3 | 57.8 | 2.1 | 12.05 | 0.8 | 1.0 | 29.88 | 25.5 |
| MPW | 0.8 | 83.6 | 15.7 | 0.7 | 69.9 | 14.5 | 10.6 | 0 | 0 | 42.33 | 22.9 |
| Mol% | CO | H2 | CH4 | CO2 |
|---|---|---|---|---|
| Simulation 1 | 29.4 | 57.8 | 3.1 | 9.7 |
| Experimental 1 | 33.0 | 58.4 | 4.2 | 4.4 |
| Simulation 2 | 32.1 | 24.1 | 0.04 | 43.76 |
| Experimental 2 | 34.1 | 24.4 | 0 | 41.46 |
| Simulation 3 | 27.1 | 63.3 | 1.9 | 7.7 |
| Experimental 3 | 25.7 | 64 | 3.3 | 6.4 |
| Industrial Analysis (wt%) | ||||||
|---|---|---|---|---|---|---|
| Moisture | Volatile | Fixed Carbon | Ash | Stacking Density (kg/m3) | HHV (MJ/kg) | |
| 3.204 | 79.248 | 13.148 | 7.604 | 895 | 36.29 | |
| Elemental analysis (wt%) | ||||||
| Ash | C | H | O | N | S | Cl |
| 7.604 | 69.996 | 10.303 | 10.6 | 0.558 | 0.138 | 0.801 |
| Processes. | Aspen Unit Module Used in the Process | Specific Operating Conditions |
|---|---|---|
| Gasification | Drying: RStoic Pyrolysis: RYield Combustion: RStoic Gasification: RGibbs Cyclone separator: SSPLIT | Fixed carbon conversion: 99.9% Heat loss: 0.8% MPW lower heating value Gasification temperature: 1064 °C; Gasification pressure: 300 kPa GOC: 0.38; GSC: 0.31 |
| Vacuum Pressure Swing Adsorption | The compressor: Compr Flash tower: Sep Heat exchanger: HeatX | Air composition: (N2: 78.1%; O2: 20.9%; inert gas: 0.939%; CO2: 0.031%; H2O: 0.03%; O2: 80.11%mol) Energy consumption: 0.313 kW/Nm3 O2 |
| Calcium-looping | Carbonation: Gibbs Calcination: Gibbs | Carbonation reactor temperature: 650 °C Pressure:300 kpa Calcination reactor temperature: 920 °C Pressure: 300 kpa Circulating quantity of calcium oxide: 200 kmol/h The feed rate of the water: 215 kmol/h |
| Cryogenic air separation | Hot hydrazine: MHeatX Distillation tower: RadFrac Compressor: Compr | High pressure tower temperature: −170 °C; Pressure: 5.8 atm Low pressure tower temperature: −132 °C; Pressure: 1.28 atm Primary compressor: 1.48 atm Two-stage compressor: 6.2 atm |
| Gas turbine, steam turbine | Burner: RGibbs Compressor: Compr Turbine: Compr Heat exchanger: Heater | Isentropic efficiency: 0.90; Primary compressor: 22 bar Secondary compressor: 50 bar; Tertiary compressor: 90 bar Primary condenser: 95 °C; Secondary condenser: 65 °C Tertiary condenser: 95 °C Burner: T = 1200 °C; P = 35 atm |
| MeOH synthesis unit | Reactor: REquil Condenser: Cool Separator: Sep | Recator: Temperature = 230 °C; Pressure = 82 atm |
| Flows | Unit | Design 1 | Design 2 | Design 3 |
|---|---|---|---|---|
| Inlet | ||||
| kg/h | 4500 | 4500 | 4500 | |
| kg/h | 14,500 | 14,600 | 19,300 | |
| kg/h | 1814 | 2135 | 2135 | |
| kg/h | 1536 | 1900 | 3200 | |
| O2 | mol% | 96.03 | 80.11 | 80.11 |
| kg/h | 1400 | 1400 | 1400 | |
| kg/h | \ | \ | 3870 | |
| kg/h | \ | \ | 11,215 | |
| Outlet | ||||
| kmol/h | 526.9 | 502 | 502 | |
| H2 | mol% | 52.7 | 50.7 | 50.7 |
| CO | mol% | 40.6 | 34.5 | 34.5 |
| CO2 | mol% | 0.9 | 1.9 | 1.9 |
| CH4 | mol% | 1.9 | 3.26 | 3.26 |
| kmol/h | \ | \ | 546.6 | |
| H2 | mol% | \ | \ | 69.82 |
| CO | mol% | \ | \ | 0.35 |
| CO2 | mol% | \ | \ | 0. 24 |
| CH4 | mol% | \ | \ | 5.07 |
| H2O | mol% | \ | \ | 20.4 |
| kmol/h | 91.4 | 114.9 | 81.89 | |
| H2 | mol% | 2.6 | 24.58 | 58.86 |
| CO | mol% | 72.99 | 1.0 | 2.37 |
| CO2 | mol% | 6.13 | 40.9 | 1.65 |
| CH4 | mol% | 3.60 | 14.1 | 33.86 |
| kmol/h | 150.7 | 138.60 | \ | |
| mol% | 99.7 | 95.86 | \ | |
| kmol/h | \ | \ | 333.55 | |
| mol% | \ | \ | 99.9 | |
| kmol/h | 95.42 | 105.4 | 168.3 | |
| CO2 | mol% | 87.85 | 62.74 | 99.99 |
| Conditions | Unit | Design 1 | Design 2 | Design 3 |
| Nm3/s | 0.459 | 0.462 | 0.611 | |
| kg/s | 0.389 | 0.389 | 1.46 | |
| % | 48.12 | 40.62 | 25.17 | |
| % | 22.08 | 25.61 | 5.3 | |
| kW | 2180 | 1840 | 1140 | |
| kW | 1003 | 1160 | 240 | |
| CH3OH | Kg/s | 1.34 | 1.23 | / |
| H2 | Kg/s | / | / | 0.185 |
| CCR | % | 64.27 | 66.65 | 84.43 |
| CGE | % | 39.55 | 33.77 | 50.53 |
Publisher’s Note: MDPI stays neutral with regard to jurisdictional claims in published maps and institutional affiliations. |
© 2022 by the authors. Licensee MDPI, Basel, Switzerland. This article is an open access article distributed under the terms and conditions of the Creative Commons Attribution (CC BY) license (https://creativecommons.org/licenses/by/4.0/).
Share and Cite
Xu, H.; Shi, B. Design and System Evaluation of Mixed Waste Plastic Gasification Process Based on Integrated Gasification Combined Cycle System. Processes 2022, 10, 499. https://doi.org/10.3390/pr10030499
Xu H, Shi B. Design and System Evaluation of Mixed Waste Plastic Gasification Process Based on Integrated Gasification Combined Cycle System. Processes. 2022; 10(3):499. https://doi.org/10.3390/pr10030499
Chicago/Turabian StyleXu, Hui, and Bin Shi. 2022. "Design and System Evaluation of Mixed Waste Plastic Gasification Process Based on Integrated Gasification Combined Cycle System" Processes 10, no. 3: 499. https://doi.org/10.3390/pr10030499